PRO
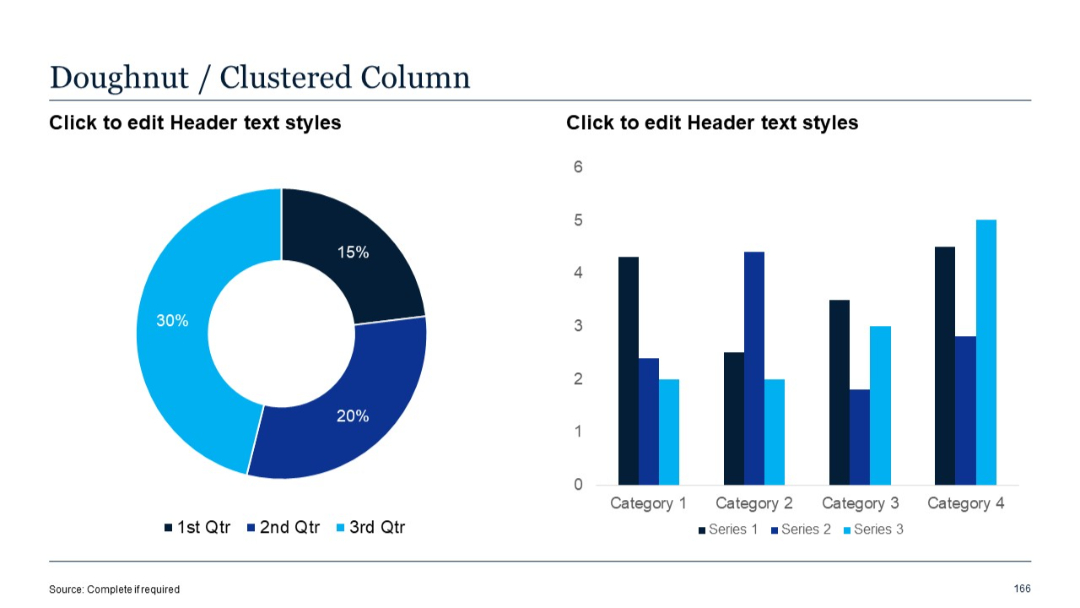
Doughnut chart alongside clustered column chart with grouped bars for three series per category.
PRO
Grid layout of icons related to location, geography, and global connectivity in a purple outline style.

PRO
Minimalist section divider slide with a large number "01" in blue and the section title in bold black below it. Diagonal striped design elements on the top right add a subtle visual accent.

PRO
Five-segment circular layout in a radial pattern with icons and color-coded divisions.

PRO
White background with left-aligned logo placeholder and a blue sidebar on the left.

PRO
Four hexagonal segments connected horizontally, each with an icon inside. Clean lines and modern color gradient borders.

PRO
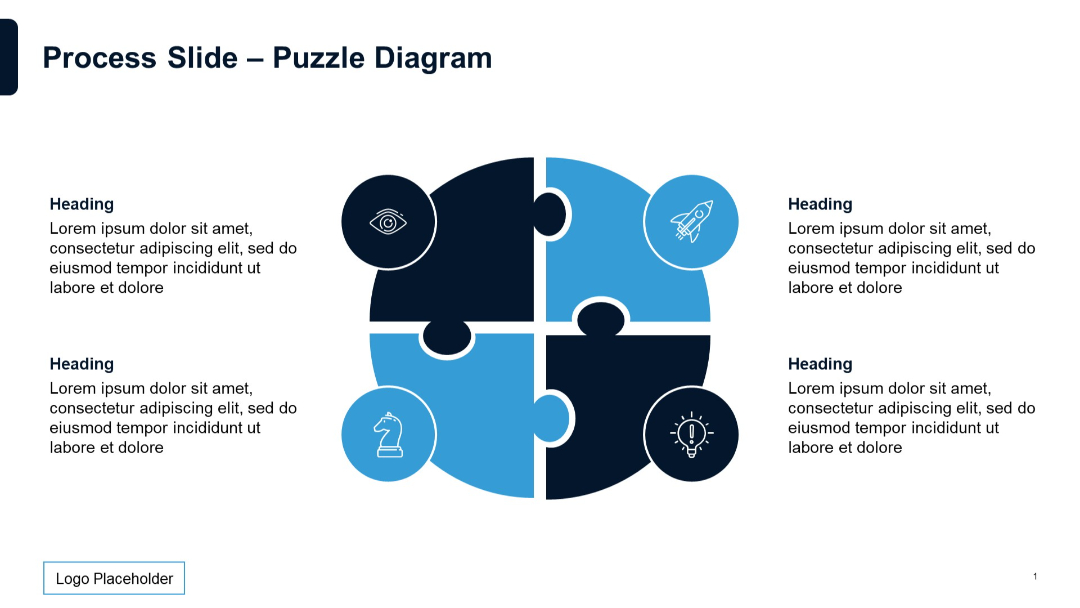
Central circular 4-piece puzzle diagram, icons in each quadrant, surrounded by four text blocks.
PRO
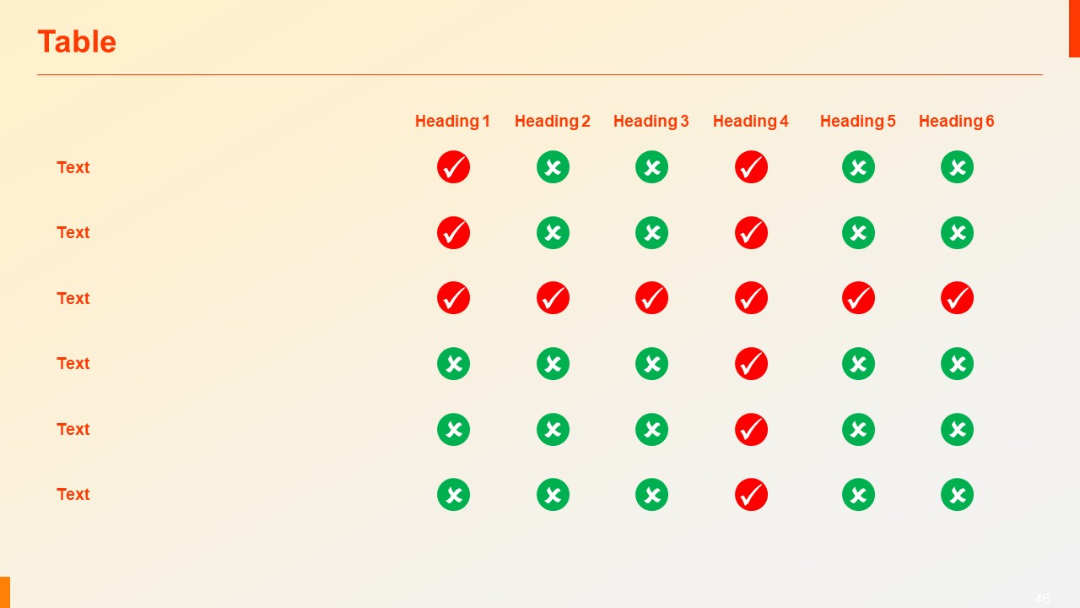
Matrix-style table with rows of text vs six column headers using green check and red cross icons. Highly visual and simple.
PRO
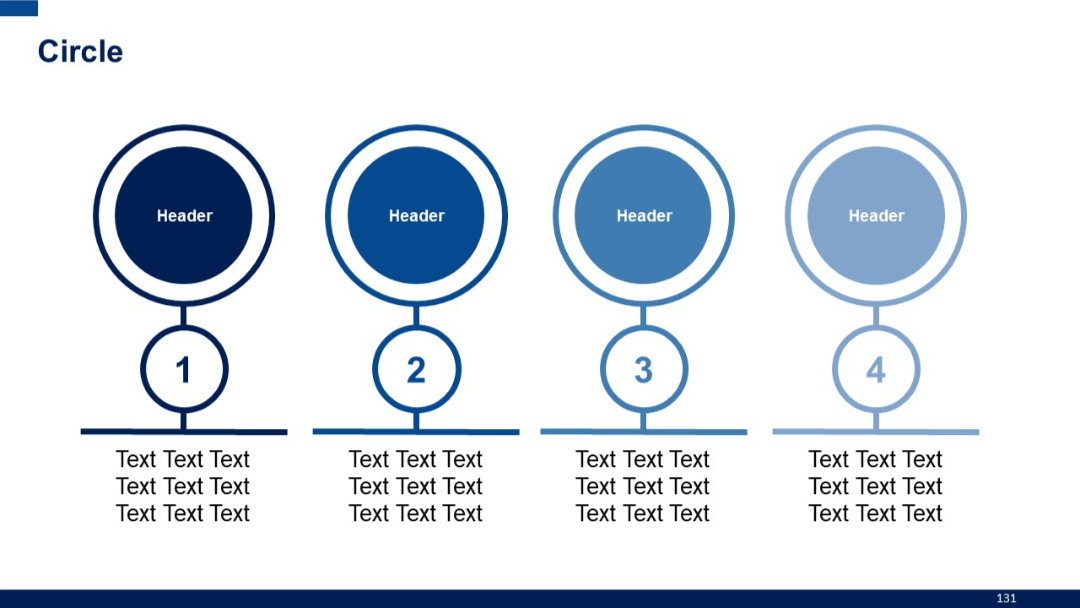
Horizontal layout with four vertical circular segments, numbered 1 to 4, each with a large circle header and text below.
PRO
3D-style vertical funnel diagram with four stages, each in a different color and icon. Text placeholders are placed to the right of each stage.

PRO
Split layout: stacked column chart on the left and a pie chart on the right; both use bright colors.

PRO
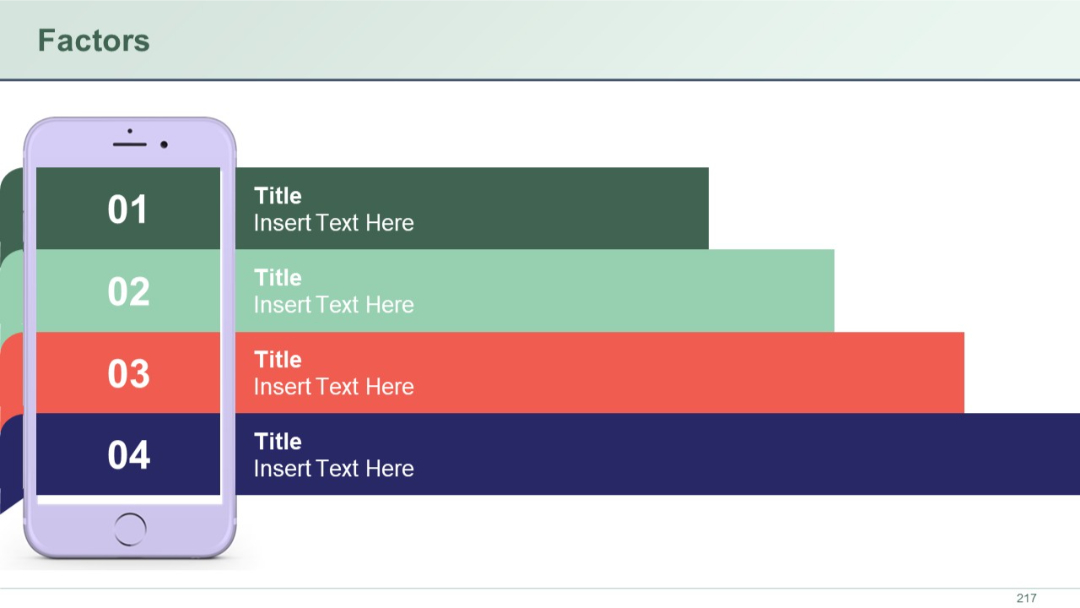
Smartphone illustration on the left with four numbered horizontal bars extending from the screen to the right, each with title and text placeholders.
PRO
Two side-by-side area charts: left shows a regular area chart with two data series, right shows a 100% stacked area version. Clean, minimal style.

PRO
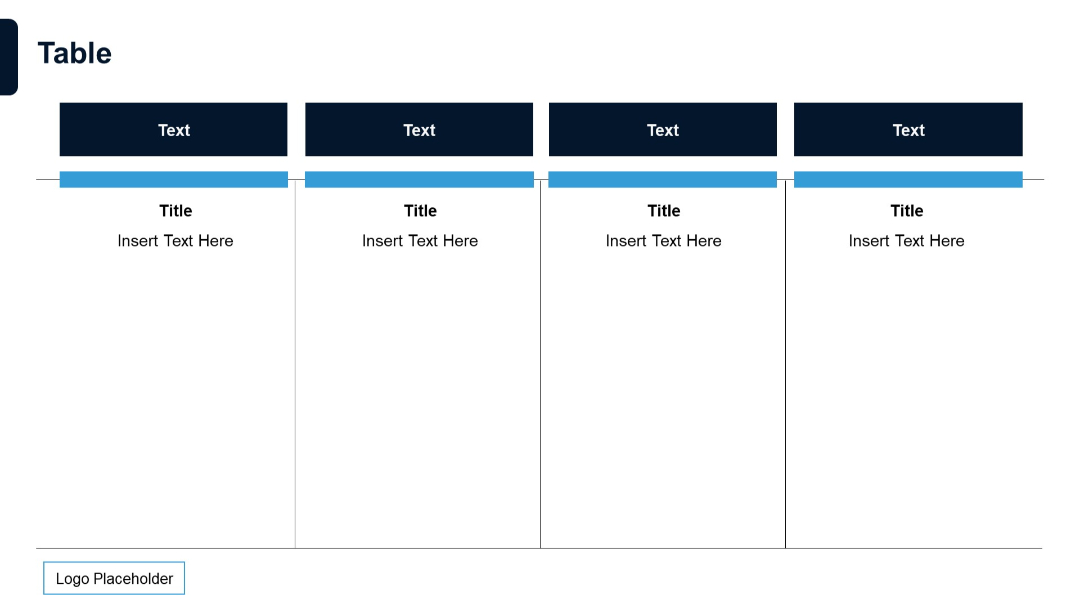
Four-column structure. Header blocks in dark blue with blue underline accents. Clean vertical division.
PRO
Curved arrow with five segments shaped like petals or fish scales. Icons embedded in each, leading right to left with increasing color contrast.

PRO
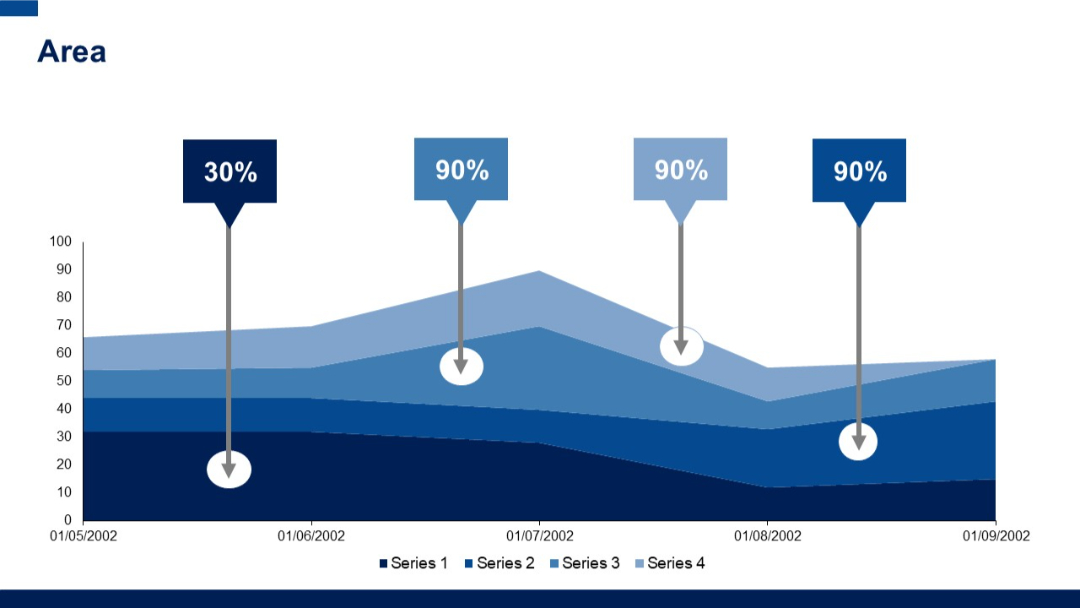
Multi-layered area chart with annotations (percentages inside arrows) pointing to peaks. Uses four series and blue gradient layers.
PRO
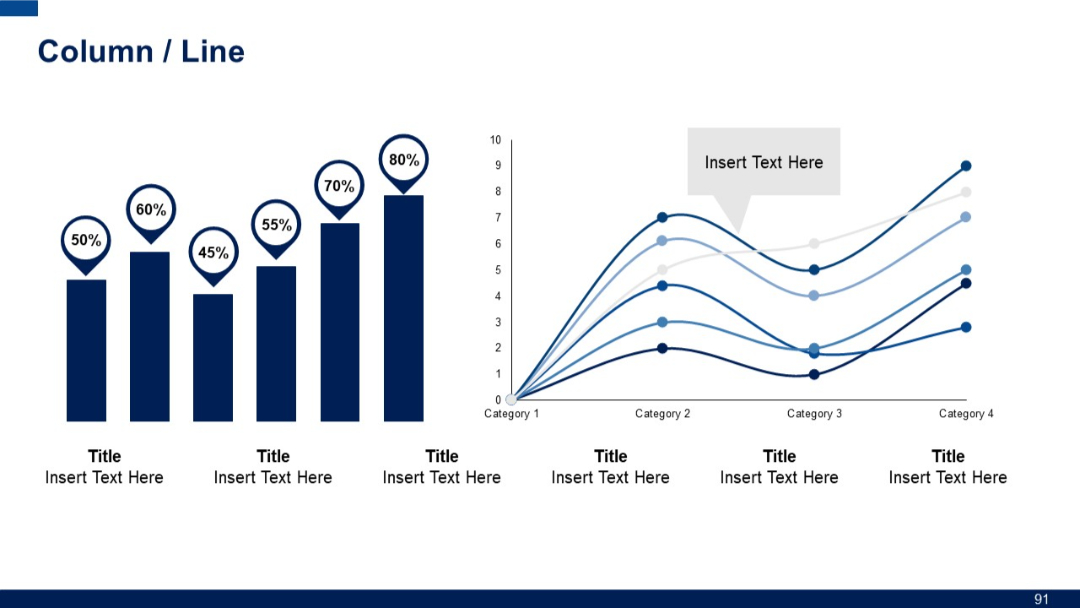
Split slide with two chart types: bar chart with percentage markers (left), multi-line graph with data labels (right); clean layout with icons and placeholders.
PRO
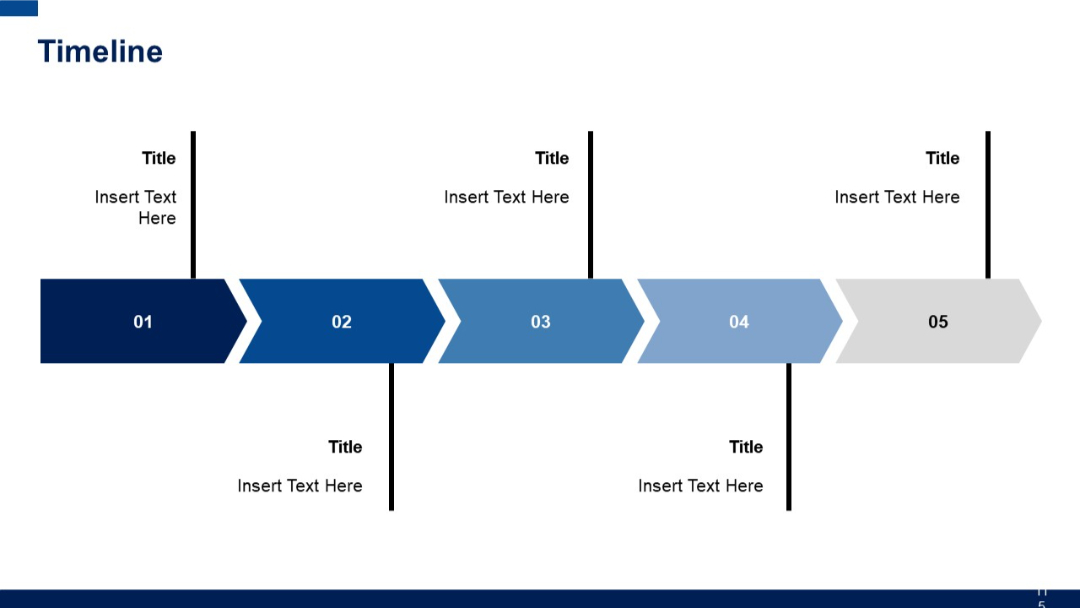
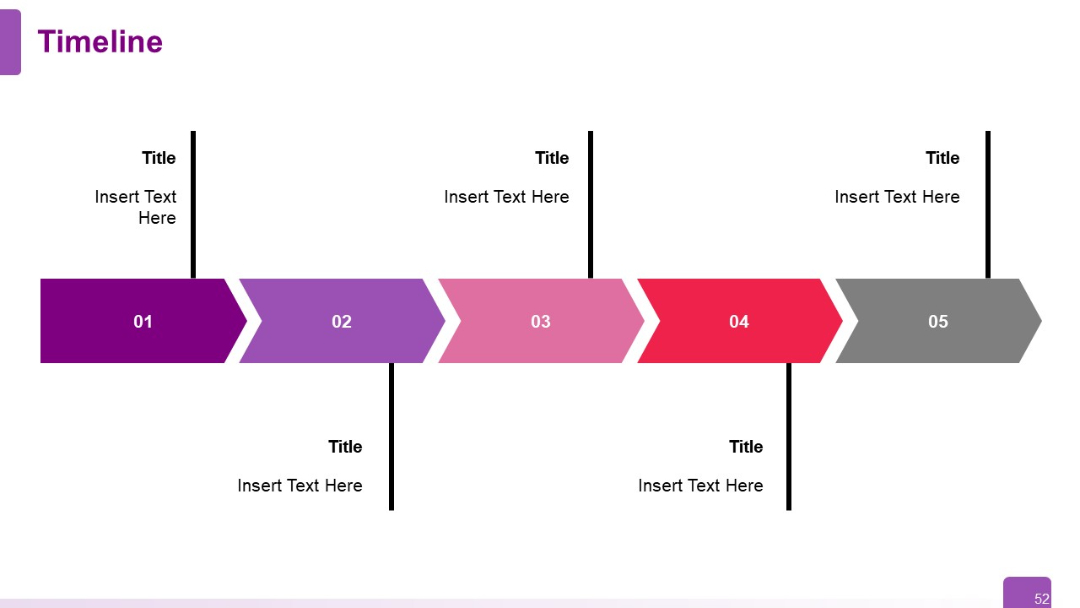
Horizontal arrow path segmented into five chevrons, each numbered 01–05, with alternating top-bottom text fields for each segment.
PRO
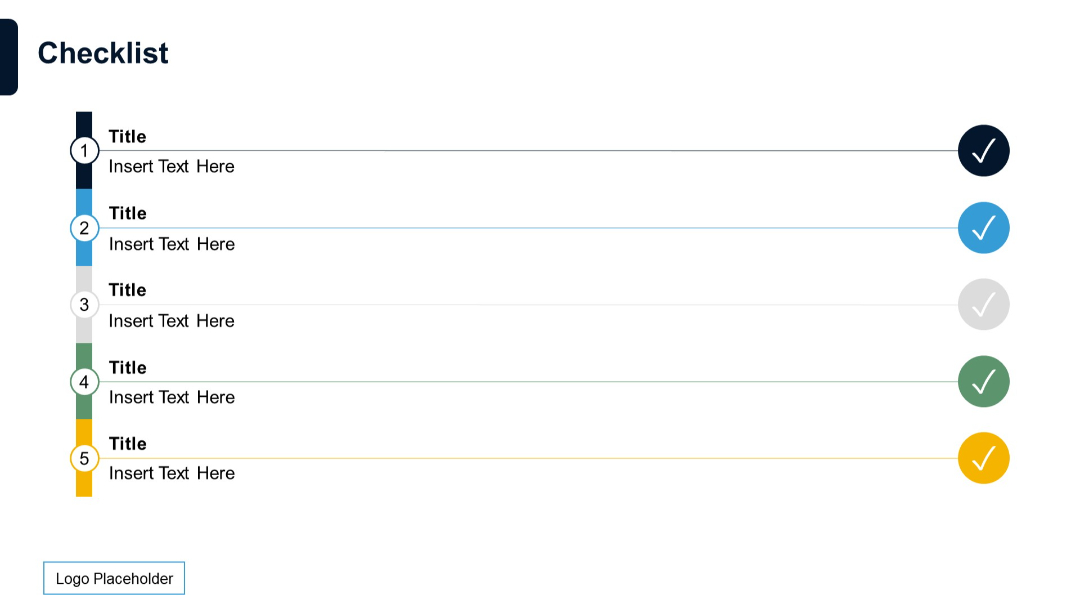
Vertical checklist of five steps, each with a circular number marker on the left and a check icon on the right. Each step is color-coded and connected by a line.
PRO
Layout split between a background photo on the left and three circular segmented progress indicators on the right labeled 30, 60, 90 DAY.

PRO
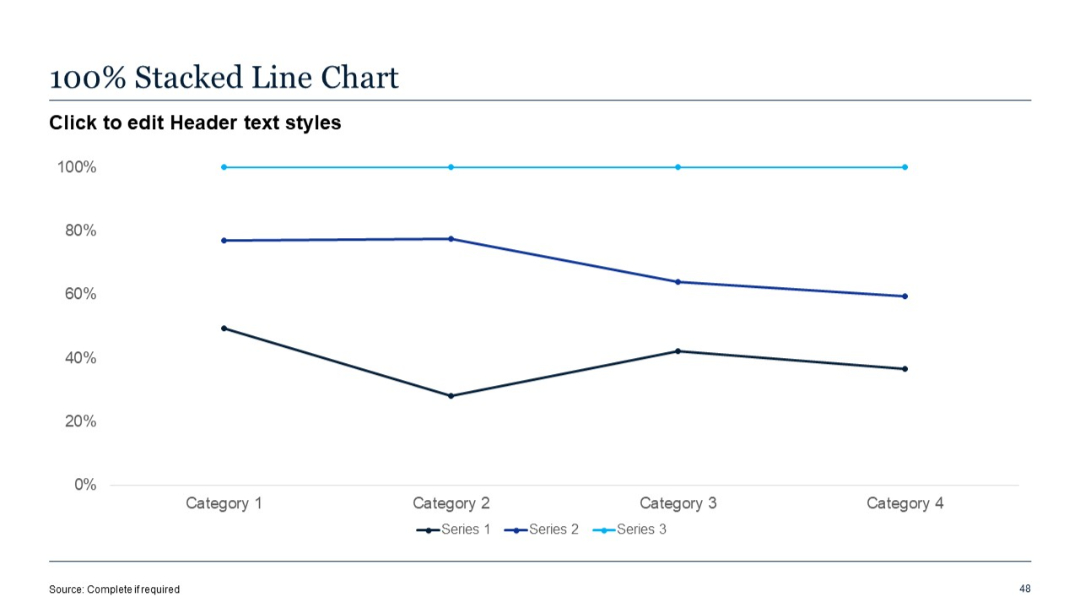
Line chart showing relative percentages of three data series across four categories. Y-axis in percentages.
PRO
Four vertical step-like bars in red with ascending heights, overlaid with percentage labels. Icon and text box to the right.

PRO
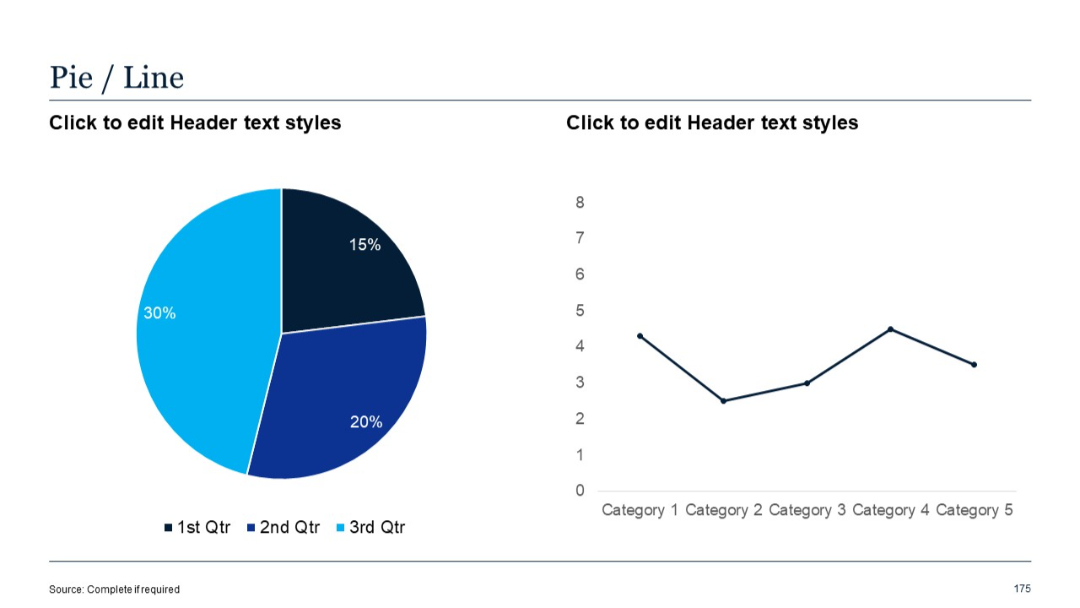
Pie chart on the left and a simple line chart on the right.
PRO
Chevron arrow timeline flowing left to right with five connected arrow blocks. Each block contains a step number and allows space for title and text.
PRO
Grid of magnifying glass-themed icons related to analysis, search, evaluation, and financial tools.
PRO
Dark-themed variant of the SWOT matrix with evenly spaced quadrants and bold typographic headings.

PRO
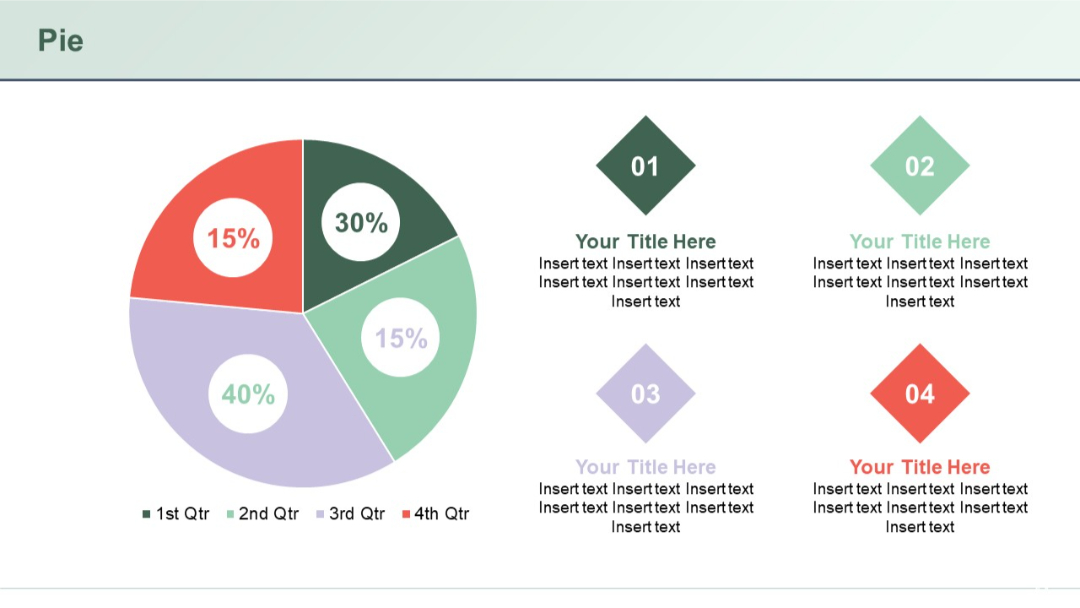
A large pie chart on the left with percentage breakdown of four quarters, each color-coded. Four corresponding text blocks with diamond icons appear on the right.
PRO
A row of alternating arrows creates a directional flow. Dotted lines connect arrows to vertical text blocks above and below.

PRO
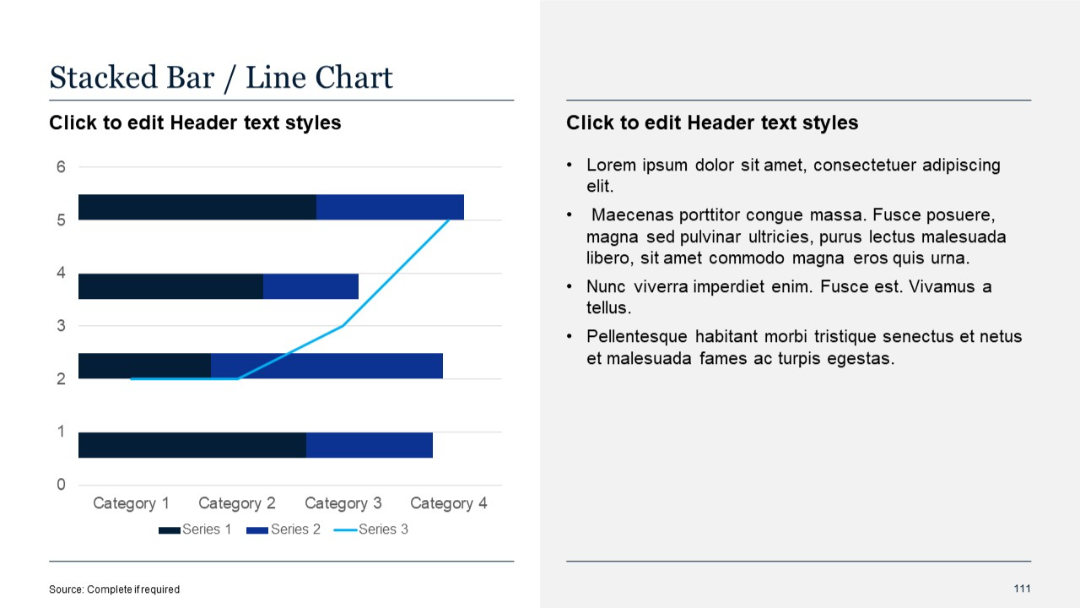
Split layout: left side with horizontal stacked bar chart and overlaid line chart; right side with bulleted placeholder text.
PRO
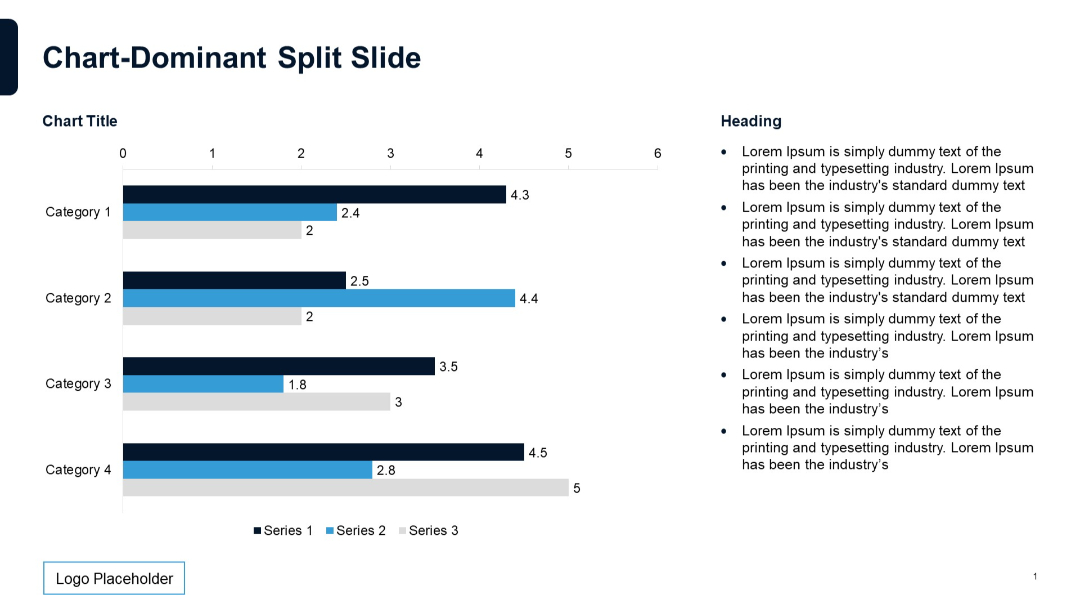
Horizontal bar chart on the left; bullet point list on the right; three-color series with value labels.