PRO
Left-aligned vertical list with icons and horizontal lines, paired with clipboard and pen illustration on the right.
PRO
Left-dominant circle with four connected numbered callouts pointing to right-aligned rectangular boxes.

PRO
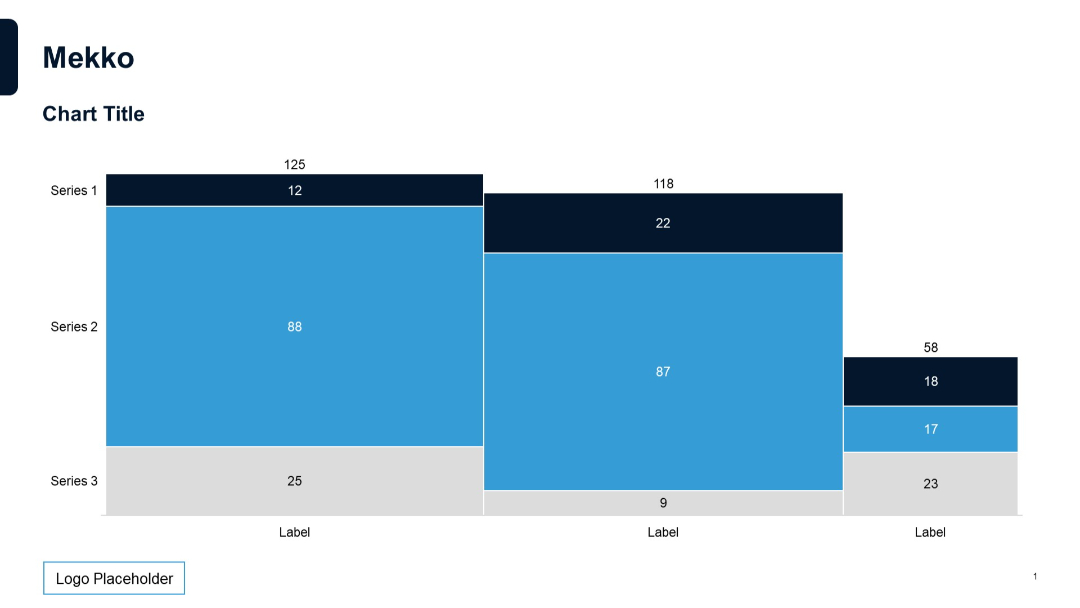
Marimekko chart with variable-width and height blocks, stacked and color-coded series, horizontal layout, minimal labels, and clean visual style.
PRO
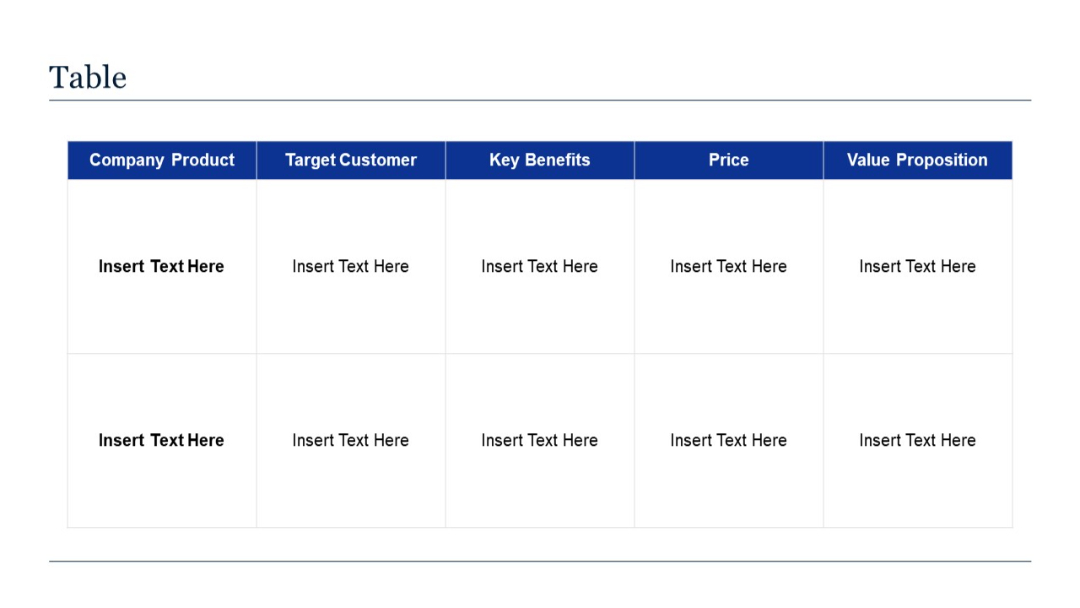
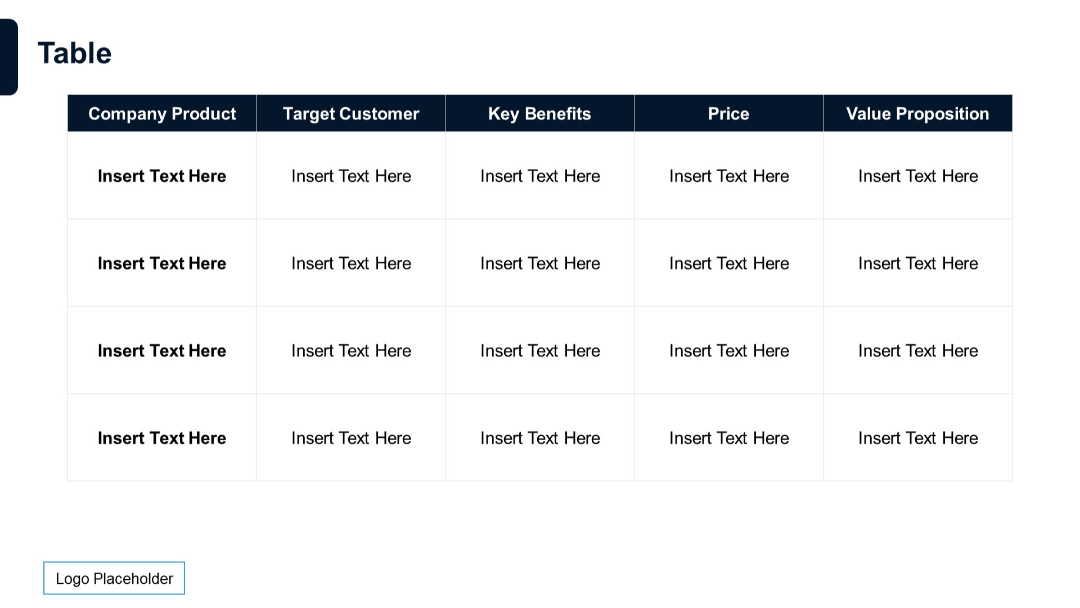
Five-column comparison table with headings like "Company Product", "Target Customer", "Key Benefits", "Price", and "Value Proposition".
PRO
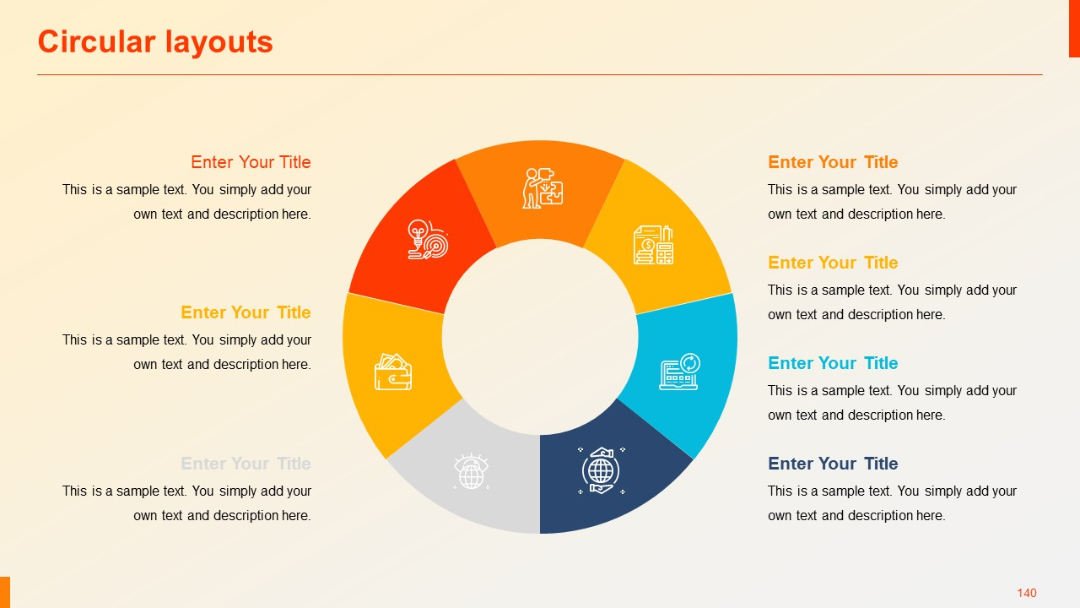
Flat-design circular pie layout with eight even slices and central negative space. All segments have icons and placeholder content next to them.
PRO
A gradient green title slide with minimal content. Large slide number “02” and subtitle “Quantitative Slides.”

PRO
A two-column layout with two red header blocks. Content cells underneath include section titles and placeholder text.
PRO
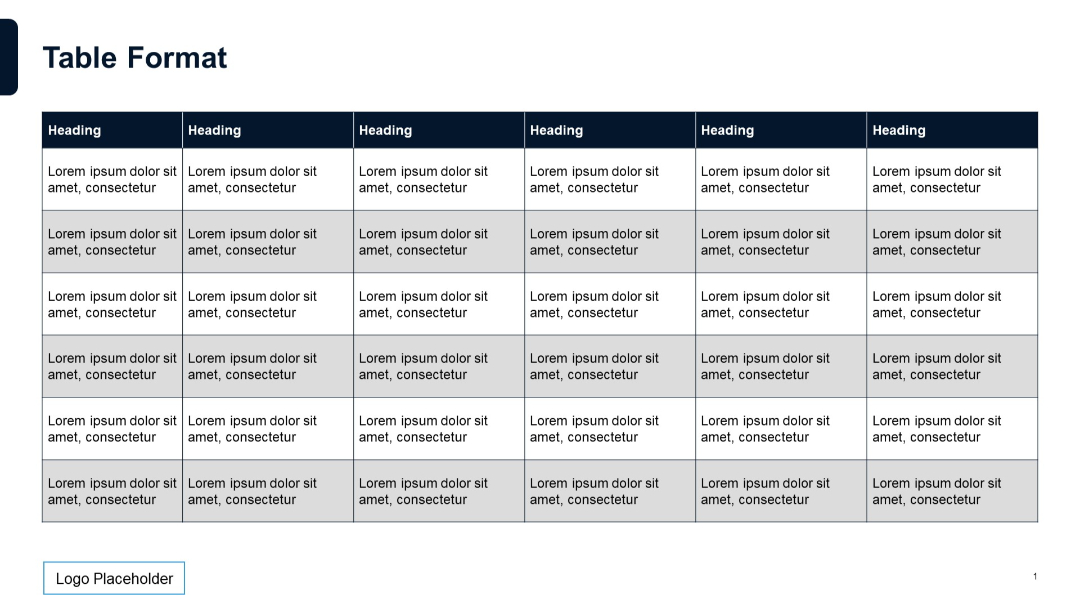
Four-row, five-column table layout identical to previous slide but extended vertically with more entries.
PRO
Grid layout with six cells (two columns, three rows), each pairing an icon on the left with bold header text and a paragraph. Icons vary (screen, thumbs-up, bulb), encircled with gradient rings.
PRO
Minimalist two-column layout with symmetrical content areas. Each column includes a bold subtitle and placeholder text.

PRO
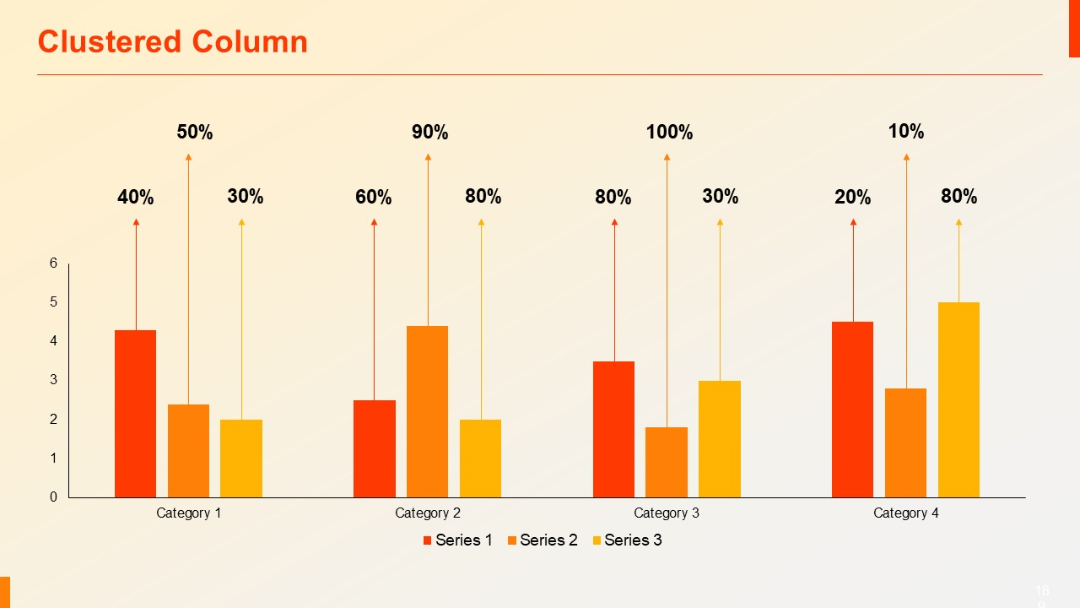
Vertical clustered column chart with four grouped bars per category. Each group has percentages and arrows above. Clean white background.
PRO
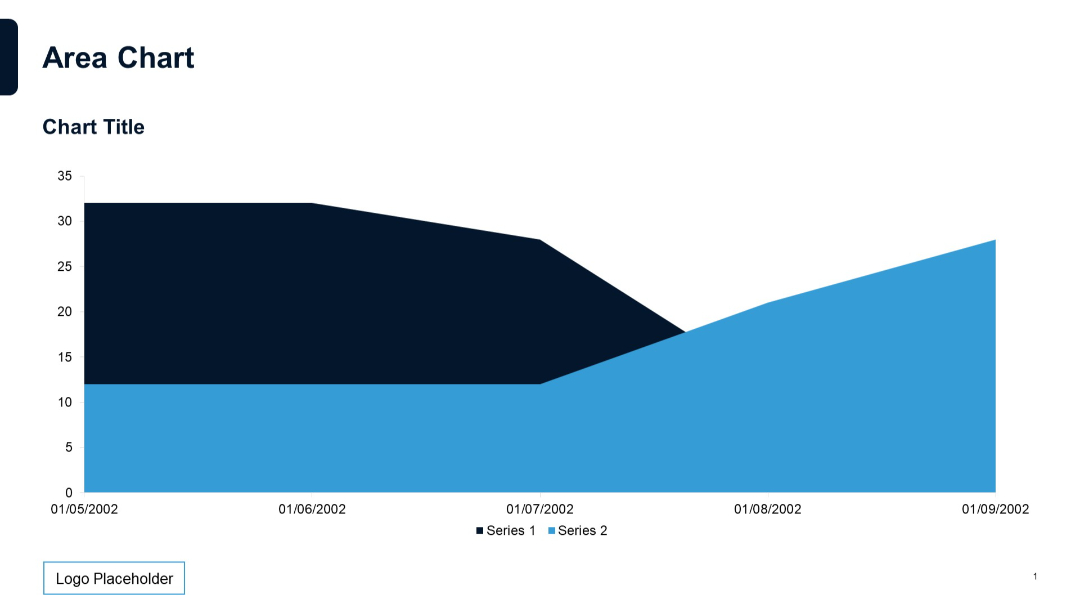
Full-width overlapping area chart with two data series over time, simple white background, logo at bottom left, and horizontal date-based x-axis.
PRO
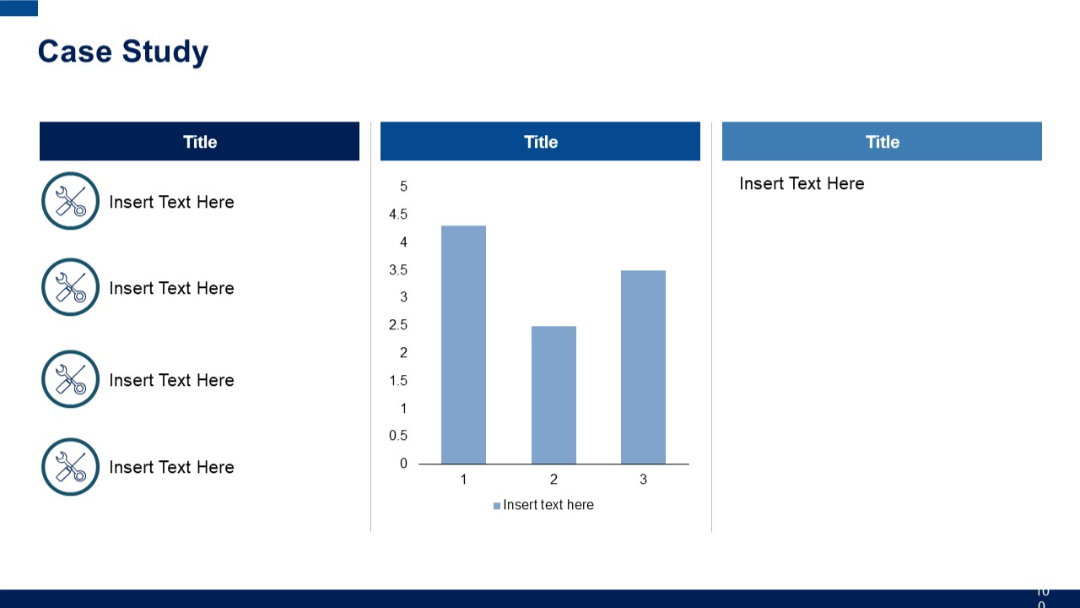
Three-column layout: left with vertical icon list, center with simple bar chart, right with large blue text box; aligned header sections.
PRO
Four-row, five-column grid; similar style as slide 41. Red column headers with beige cells and placeholder text.

PRO
Numbered vertical timeline with round icons and color transitions for visual segmentation.

PRO
Simple section divider with large numeric indicator and horizontal line beneath subtitle text.

PRO
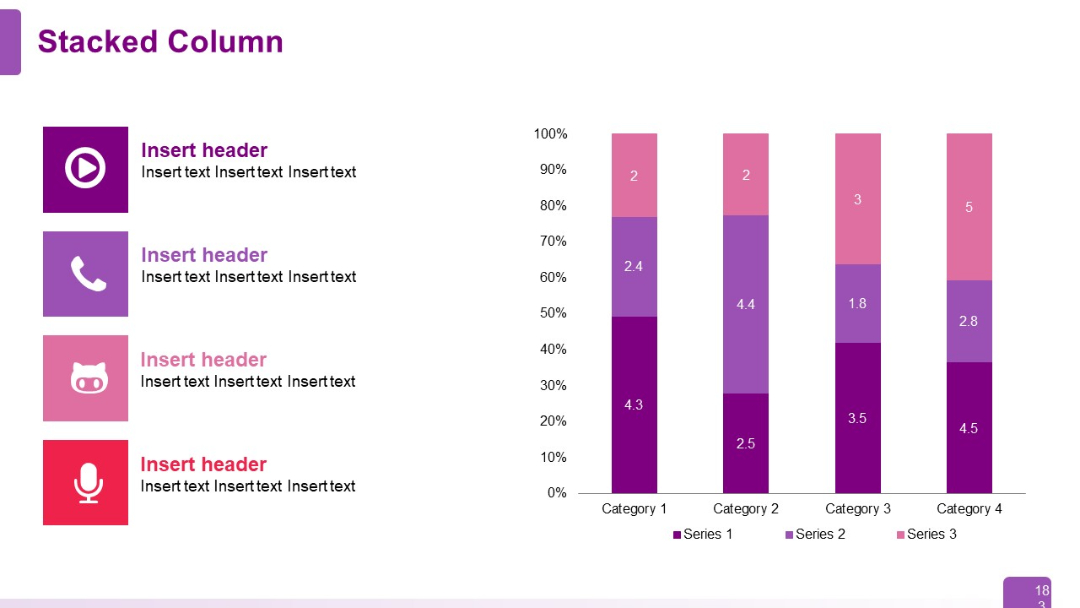
Left section with four icons and text labels; right section has a 100% stacked column chart with values labeled inside each segment.
PRO
Gear-shaped icons numbered 1–5 aligned vertically with adjacent titles and descriptions. Neutral background.

PRO
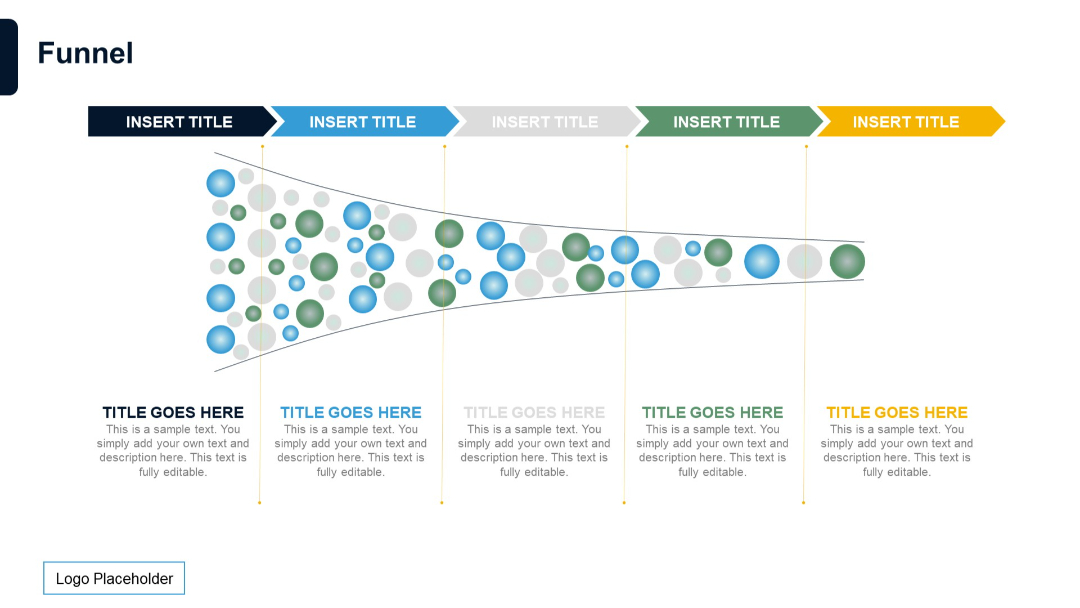
A stylized horizontal funnel filled with colorful circles and topped with horizontal process arrows. Descriptive text beneath each stage.
PRO
Five-section circular infographic with vibrant colors, numbered steps, and connected external text fields.

PRO
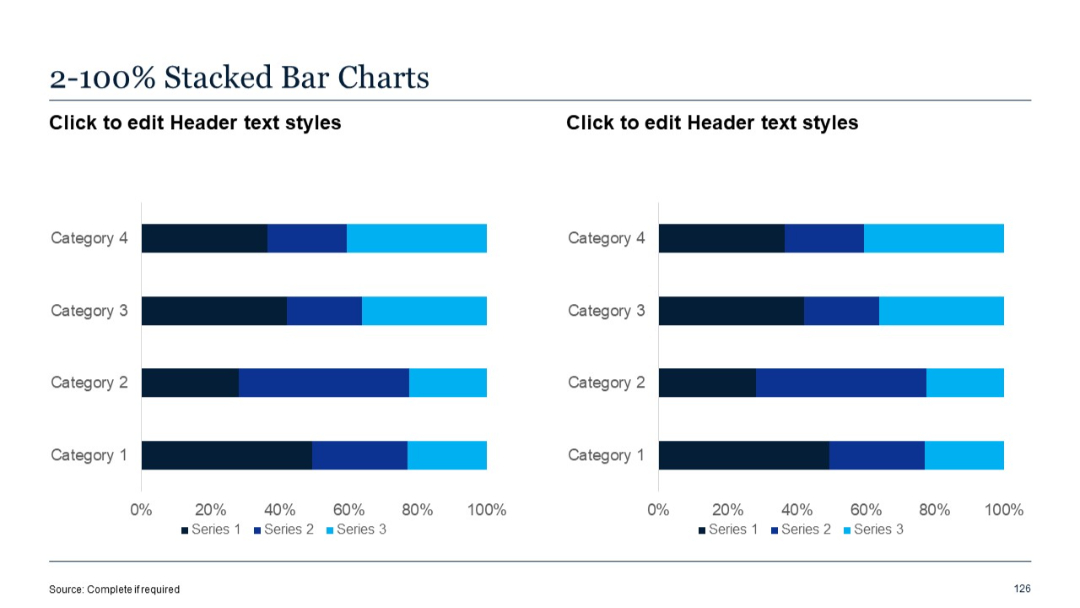
Two horizontal 100% stacked bar charts. Each bar represents full distribution across categories.
PRO
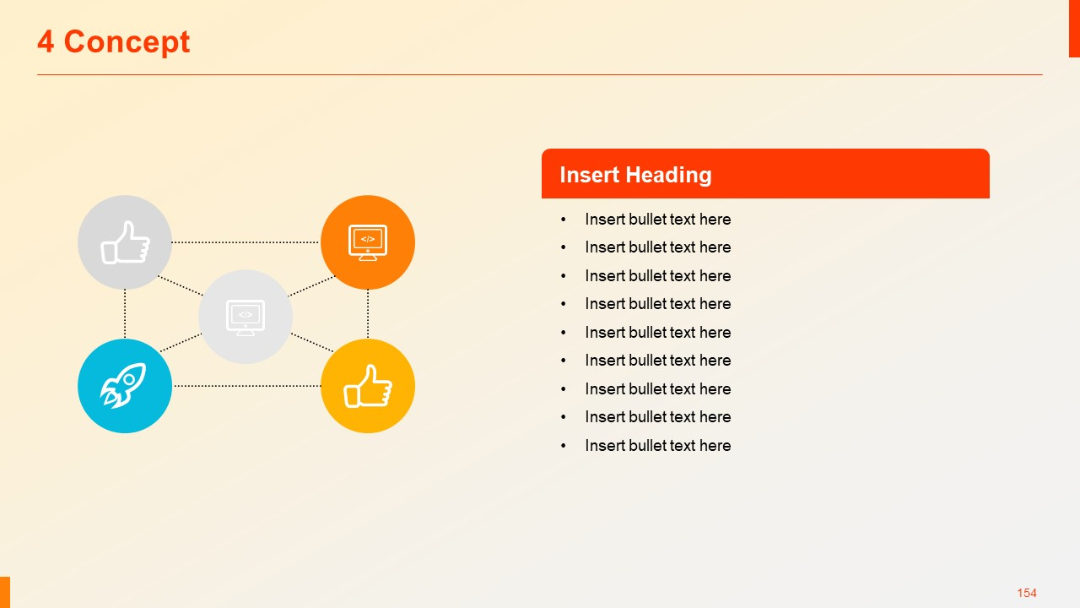
Grid network of five icons connected by dotted lines; a symmetrical structure with bullet list to the right.
PRO
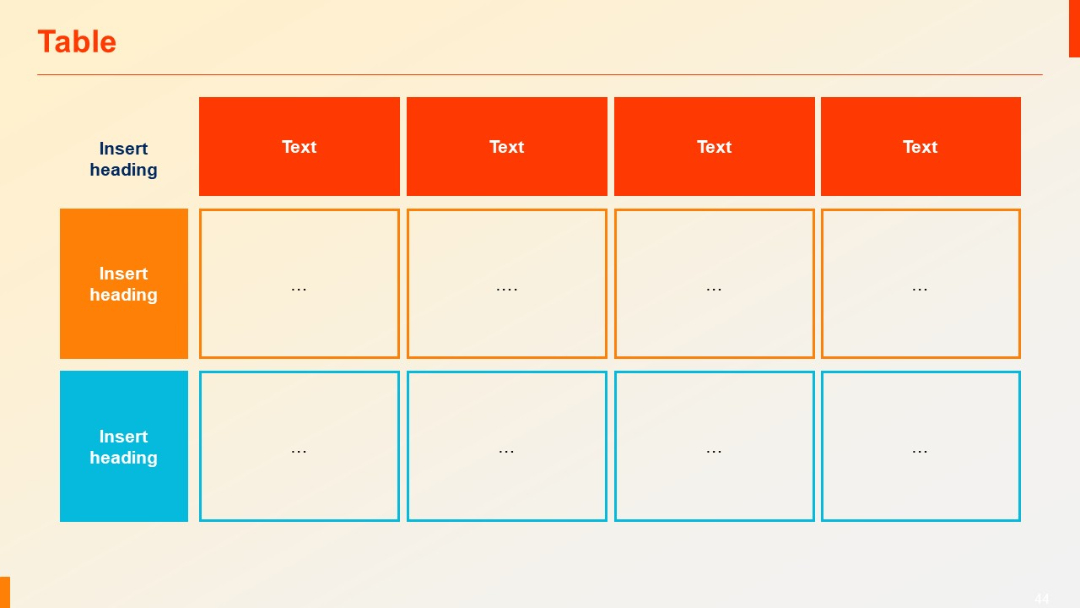
3x5 table with two side row headers and top column headers in bold colors (orange, blue, red). Cells contain ellipses. Colored border lines separate sections.
PRO
Identical to previous slide but with alternating grey shading on rows for visual contrast.
PRO
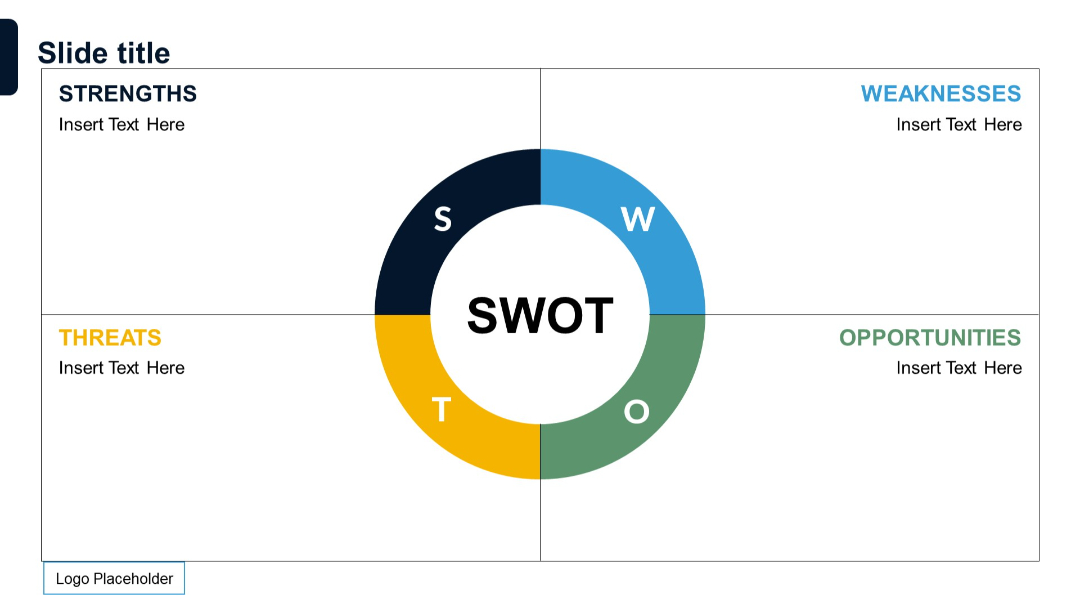
Circular quadrant with SWOT sections around a donut chart in center; each quadrant labeled and color-coded.
PRO
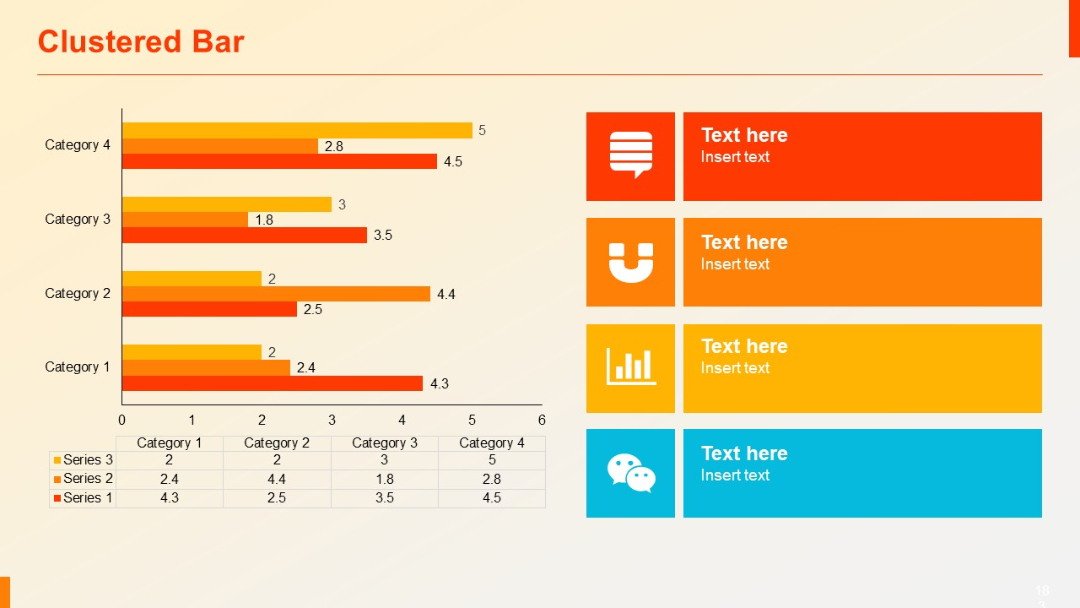
Left-aligned clustered horizontal bar chart with a four-color legend and a right-aligned grid of colorful text boxes with icons.
PRO
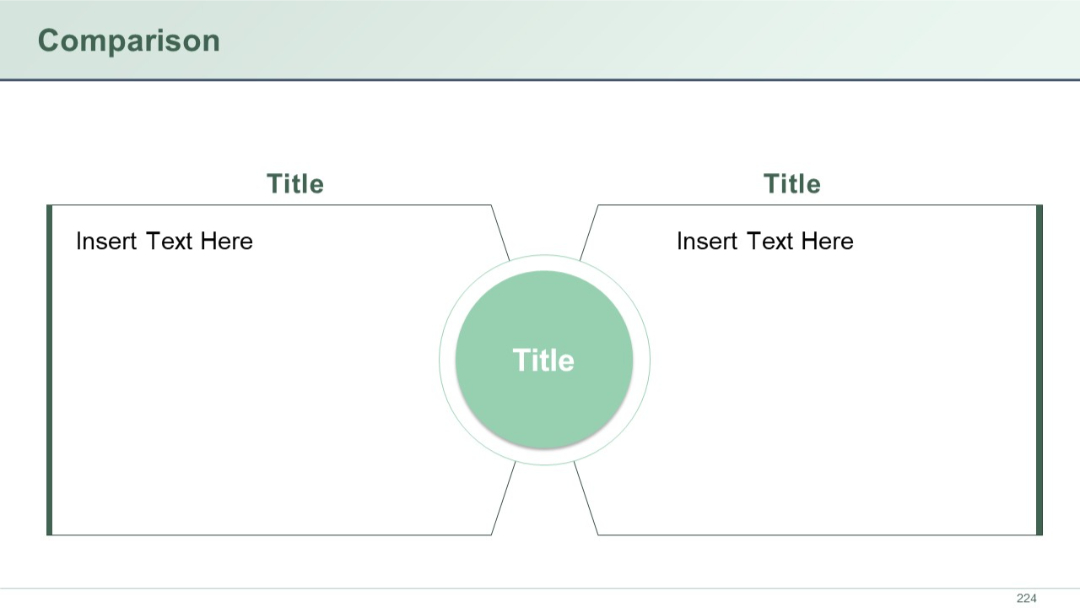
Symmetrical layout with two side boxes connected to a central circle. All elements contain placeholder text.
PRO
Left side has dark triangle overlay with title; right side shows a group photo of professionals in discussion.

PRO
Two columns with bold dark header bars above each subtitle; centered content; clean whitespace around elements.
PRO
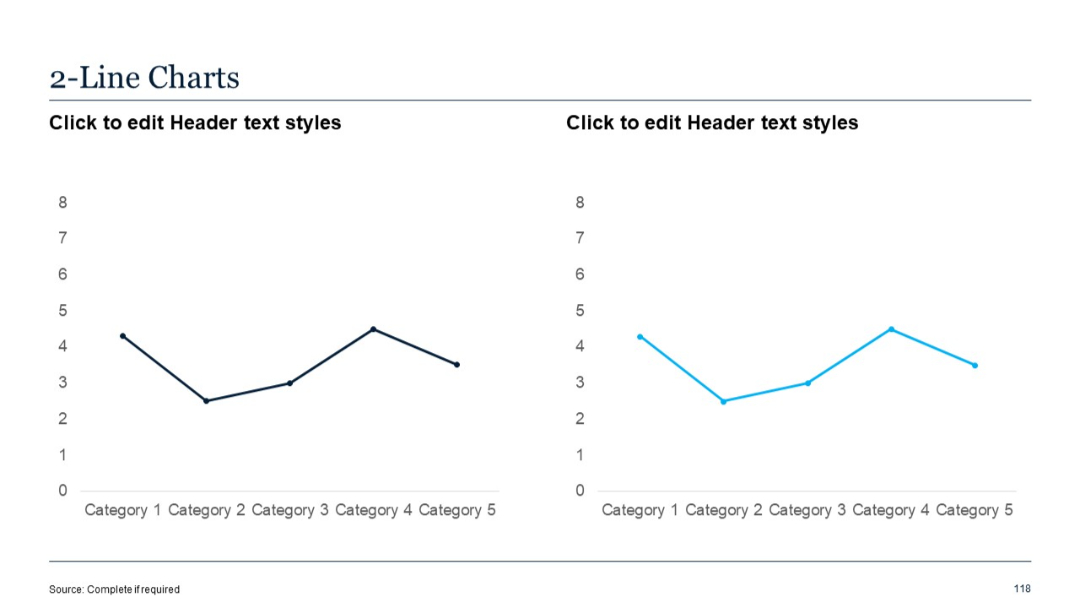
Dual panel line charts, each with one line series, showing category trends; no right-side text panel.