PRO
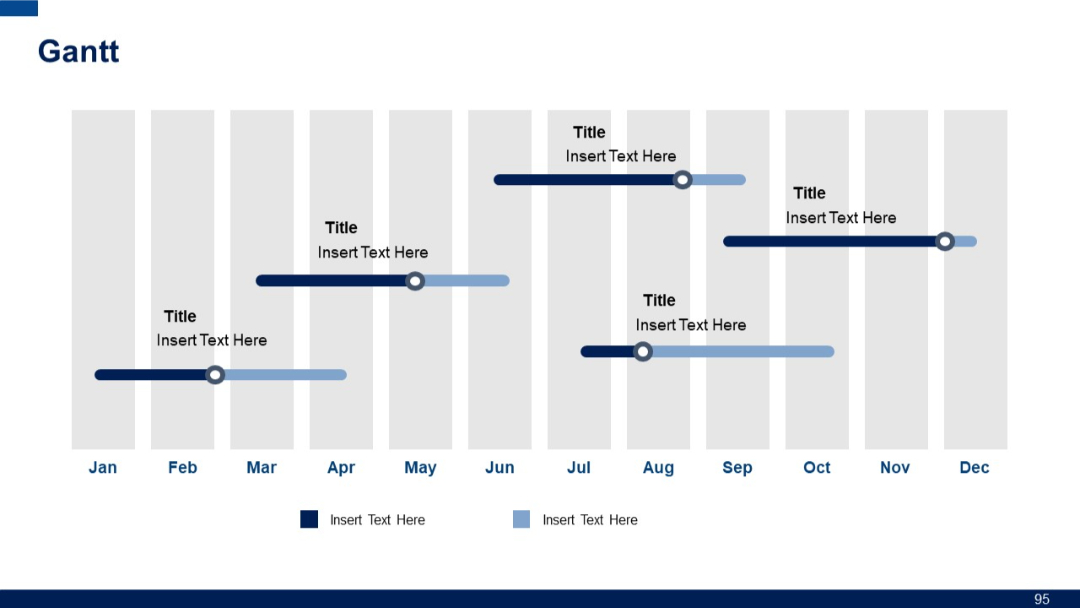
Calendar-style Gantt chart spanning Jan–Dec with horizontal progress bars across shaded months; rounded-end bars and milestone markers.
PRO
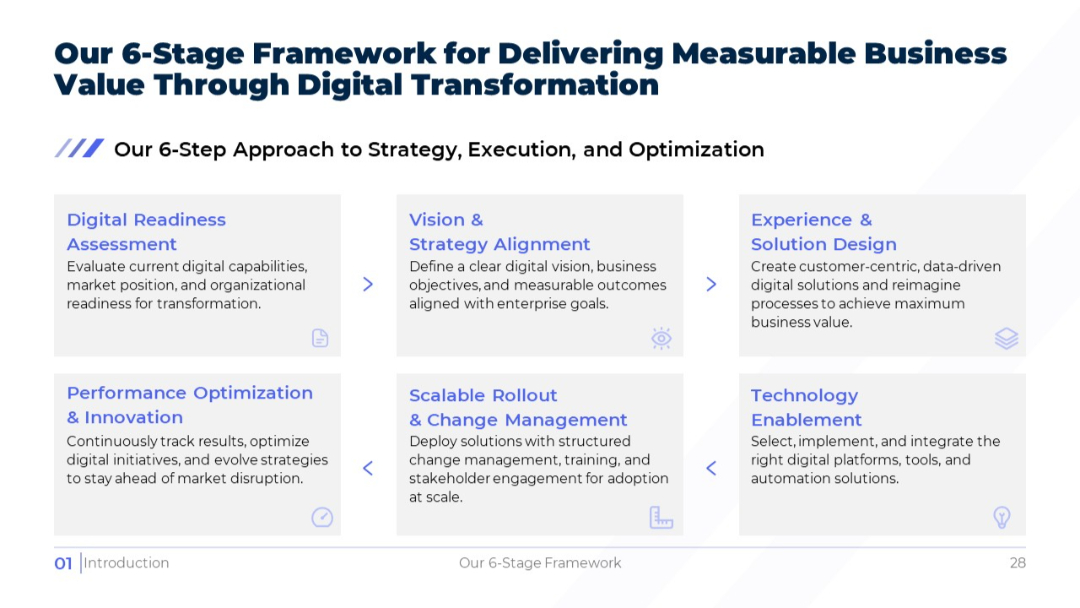
Light-themed, block-style layout with two rows of three stages each, highlighting an expanded process.
PRO
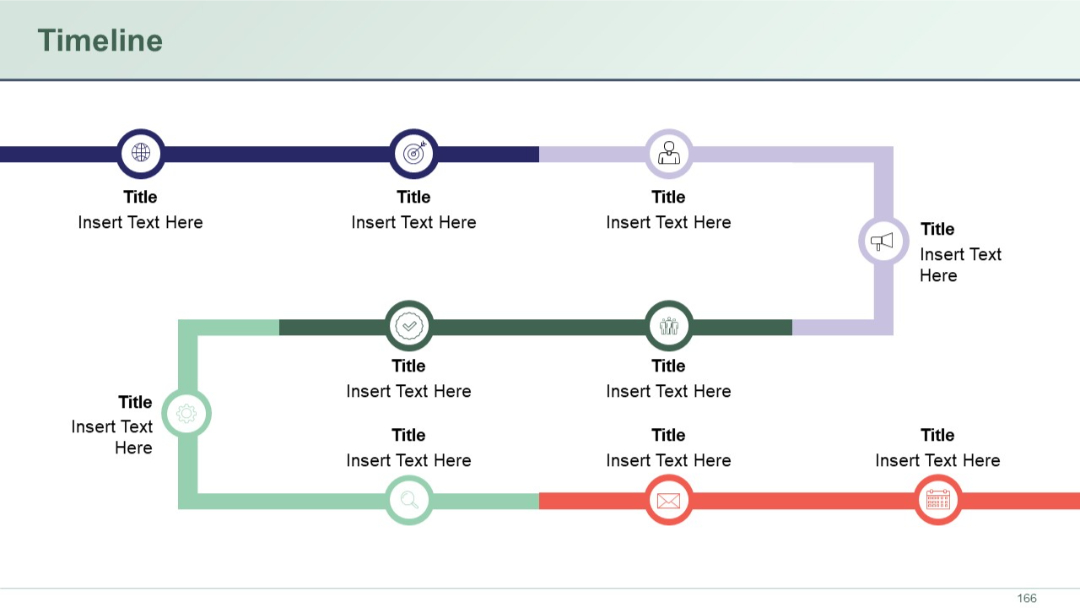
Two-tier timeline with icons and circular nodes, connected by straight colored lines. Top tier (blue-purple), bottom tier (green-red).
PRO
Multiseries area chart with visual markers and percentages called out at data peaks; four series shown in layered colors.

PRO
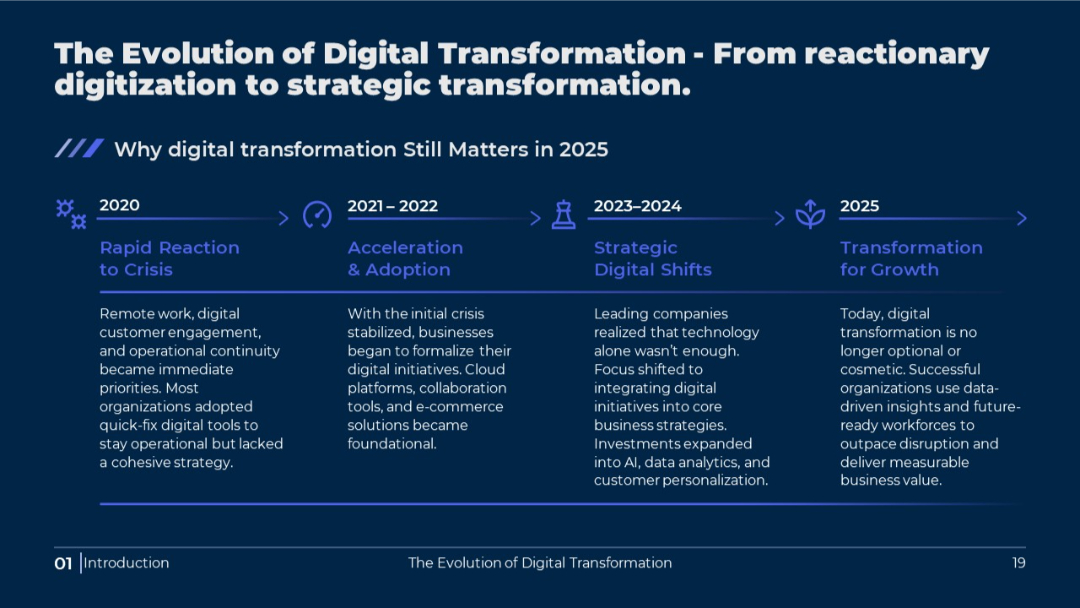
Horizontal timeline across four years; each year includes icons, titles, and short paragraphs; dark background with blue accents.
PRO
Horizontal clustered bar chart showing side-by-side comparison of three series per category. Each series in different colors.

PRO
One-column layout with large bold headline and subheading followed by three paragraphs of body text. Text-heavy slide with a focus on storytelling. Consistent dark blue and black typography on white background.

PRO
Similar to previous, but with 4 rows. Red left-side blocks indicate row headers. Right-hand cells are uniform with placeholder text.
PRO
Numbered circles (1 to 4) with surrounding text blocks beneath each. Arranged in a horizontal line.
PRO
Curved segmented arrow with five interlinked shapes, each containing an icon, title, and placeholder description.
PRO
White slide with large bold "Thank you!" text and accent slashes. Sparse layout.

PRO
Three-column layout with top-centered numbered tags (01–03) above arrow-tab headers; content boxes beneath each for title and text.
PRO
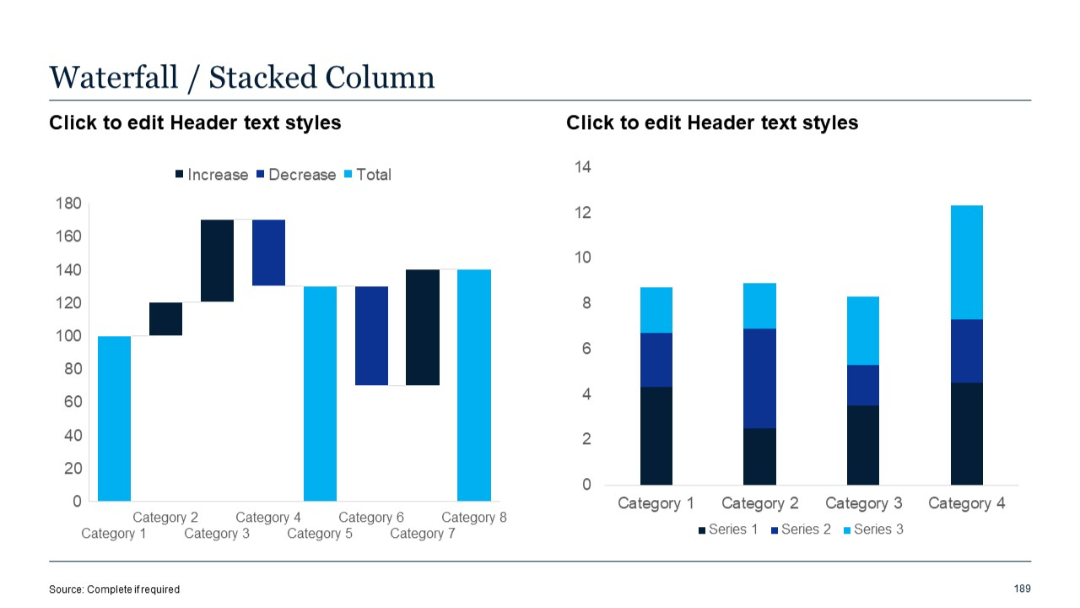
Waterfall chart on left, stacked column chart on right with three stacked series per category.
PRO
Vertical progress bar layout with five columns, each containing an icon, a title, and supporting text underneath.
PRO
Seven icons in a circular, fully interconnected network with central icon; all connected via dotted lines; bullet list included.
PRO
Similar layout to 161 with added dark blue circle on the right, totaling five circles around the lightbulb center.
PRO
A 5-column, 3-row table layout with bold row headers on the left in dark blue. Minimalist design with ample white space. Logo placeholder at bottom left.
PRO
Three-column layout with red headers labeled “Text.” Content boxes below include section titles and placeholder details.
PRO
Two horizontal blocks with circular icons and header bars in purple shades; bulleted text follows each header.
PRO
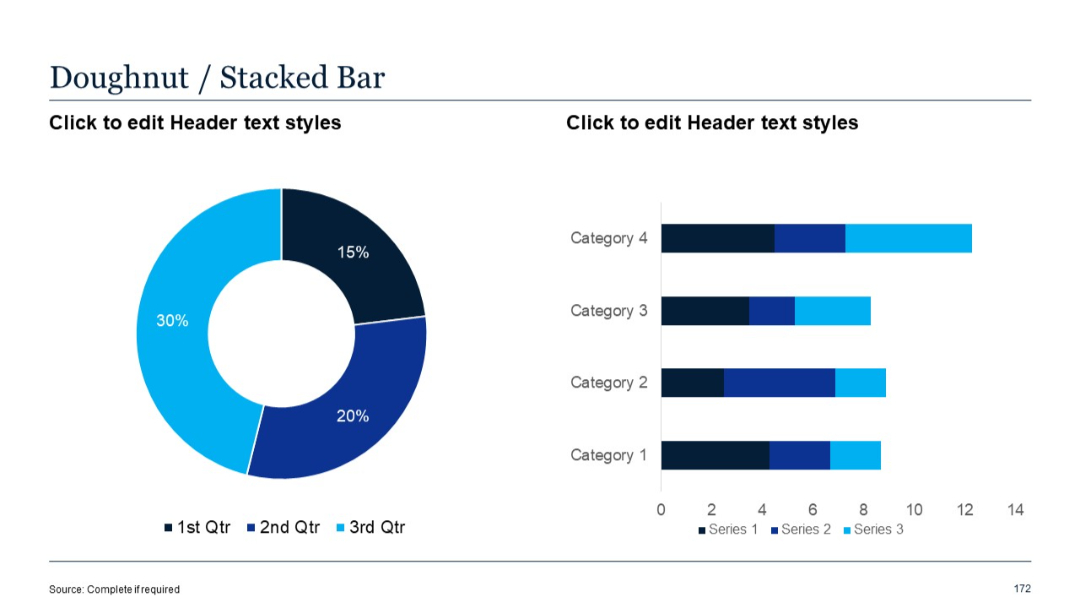
Side-by-side layout with a doughnut chart on the left and a stacked horizontal bar chart on the right.
PRO
Three rectangular columns with bold "30 DAY," "60 DAY," and "90 DAY" headings. Icons in top-right of each box represent progression.

PRO
Circular layout with seven icons surrounding a central icon; variation in icon shapes (star, thumbs-up, globe) enhances visual interest.

PRO
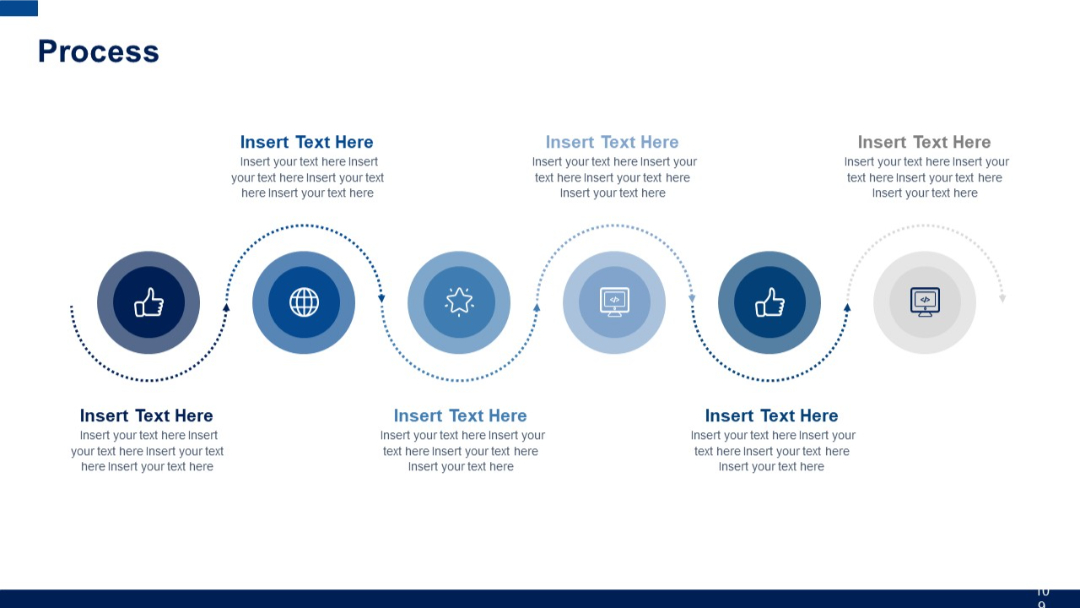
Circular path of process flow with five stages, each represented by a filled icon inside a circle and a text area below.
PRO
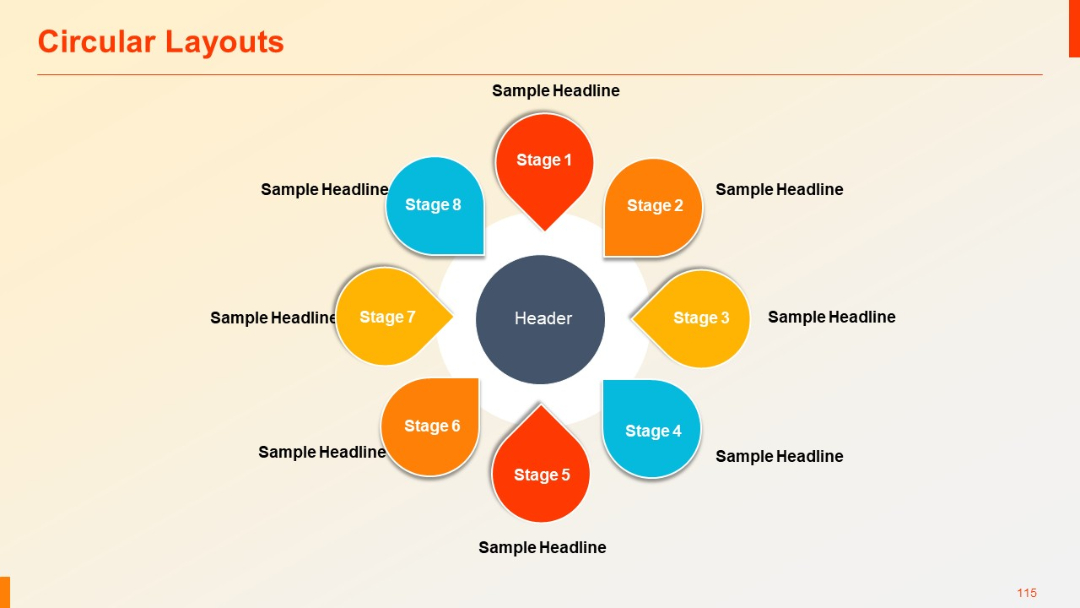
A circular petal-shaped diagram with 8 stages, each petal pointing outward. Each stage is color-coded and accompanied by a headline.
PRO
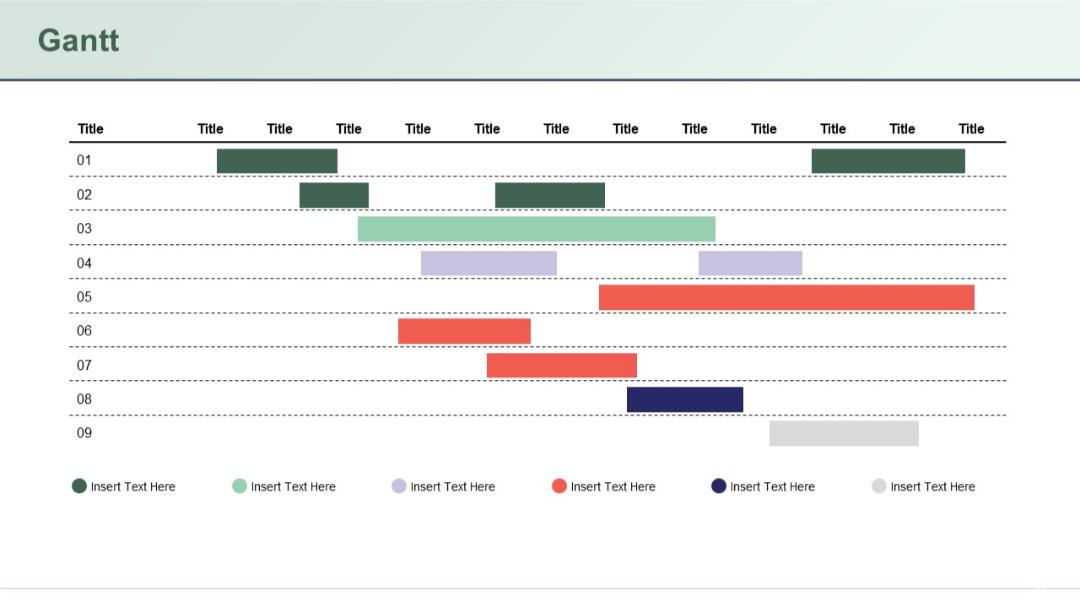
Multi-color bar layout across a detailed grid with rows numbered 01–09. Color-coded tasks in varying lengths, legend at bottom.
PRO
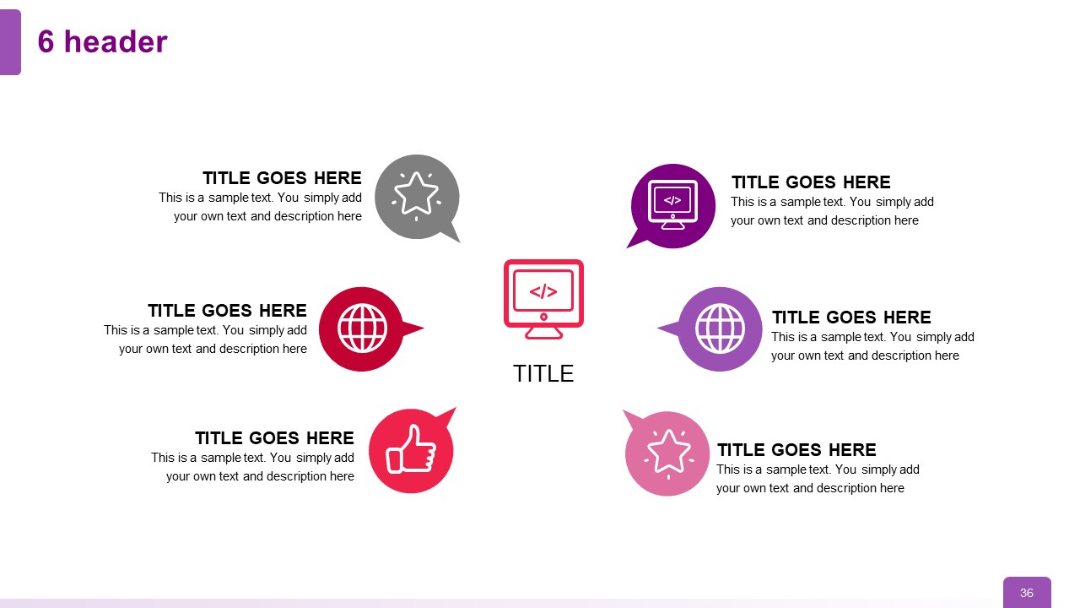
Two-layered circular layout with six icons and headers encircling a central icon; arrows and speech bubble icons add a dynamic flow.
PRO
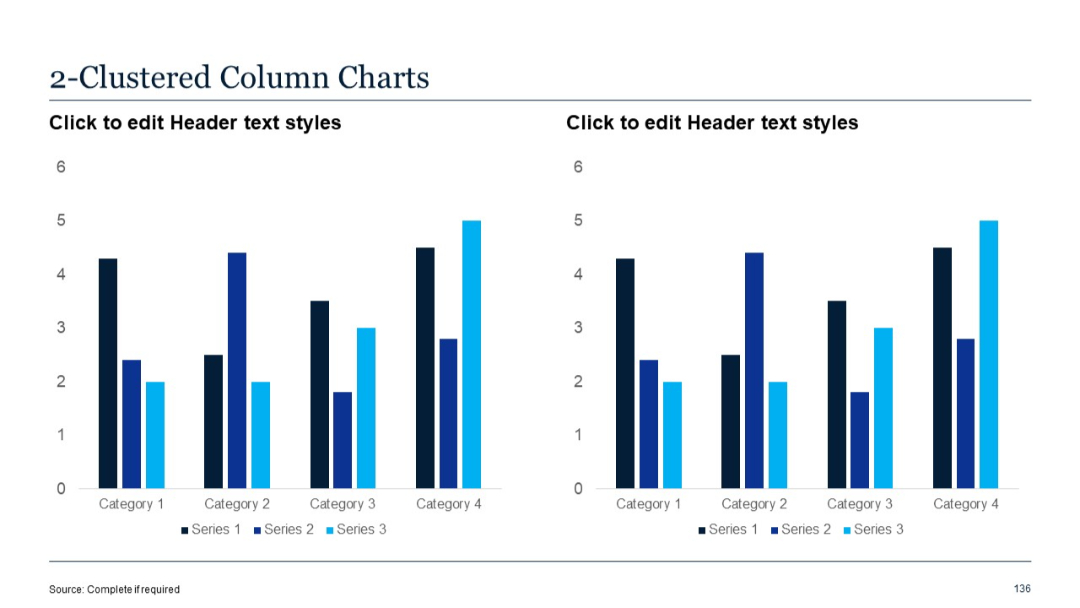
Two vertical clustered column charts, with separate bars for each series in every category. Blue shades distinguish series.
PRO
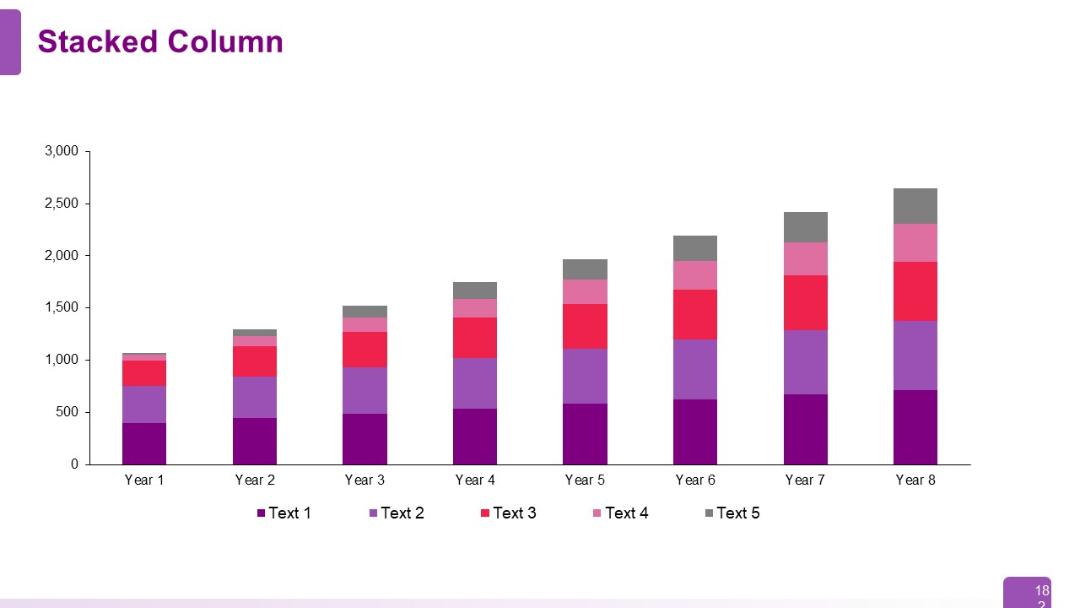
Full-slide stacked column chart with 8 time-based columns (Year 1–8). Each column is subdivided into 5 color-coded data series.
PRO
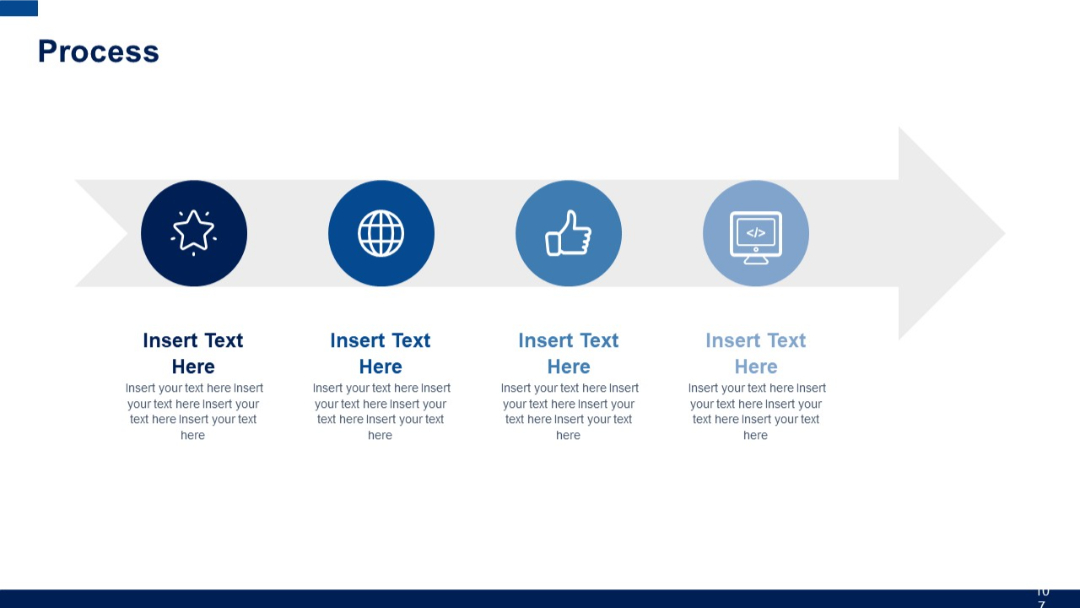
Horizontal arrow with four circular icons, each followed by a bold title and multiline placeholder text beneath.
PRO
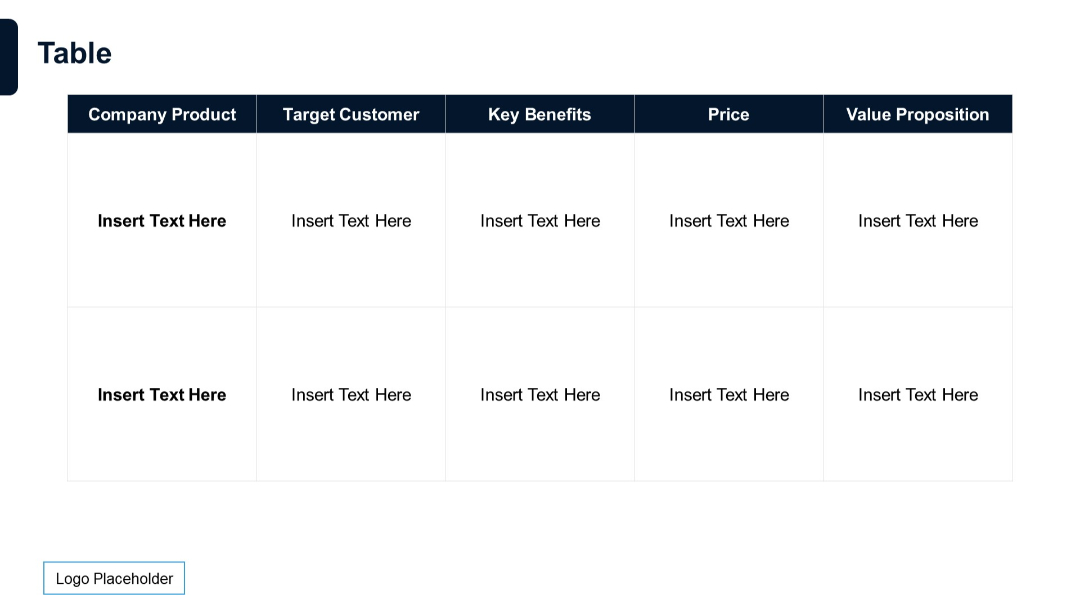
Two-row, five-column grid with bolded column headers: Company Product, Target Customer, Key Benefits, Price, and Value Proposition.