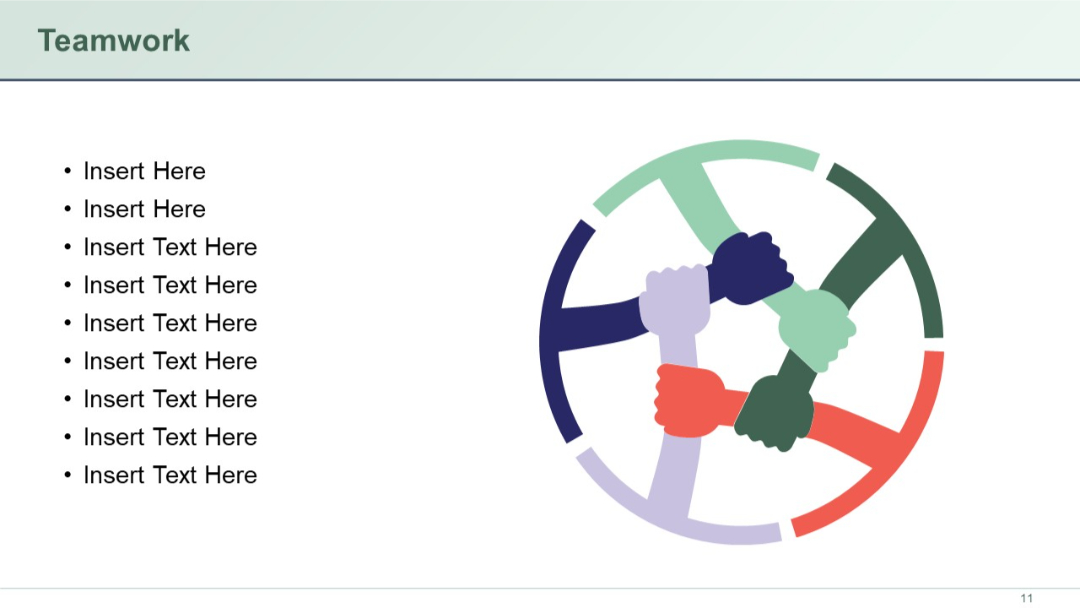
PRO
Left-aligned bullet list with placeholder text, right side features an abstract circular illustration of diverse hands grasping each other in unity.
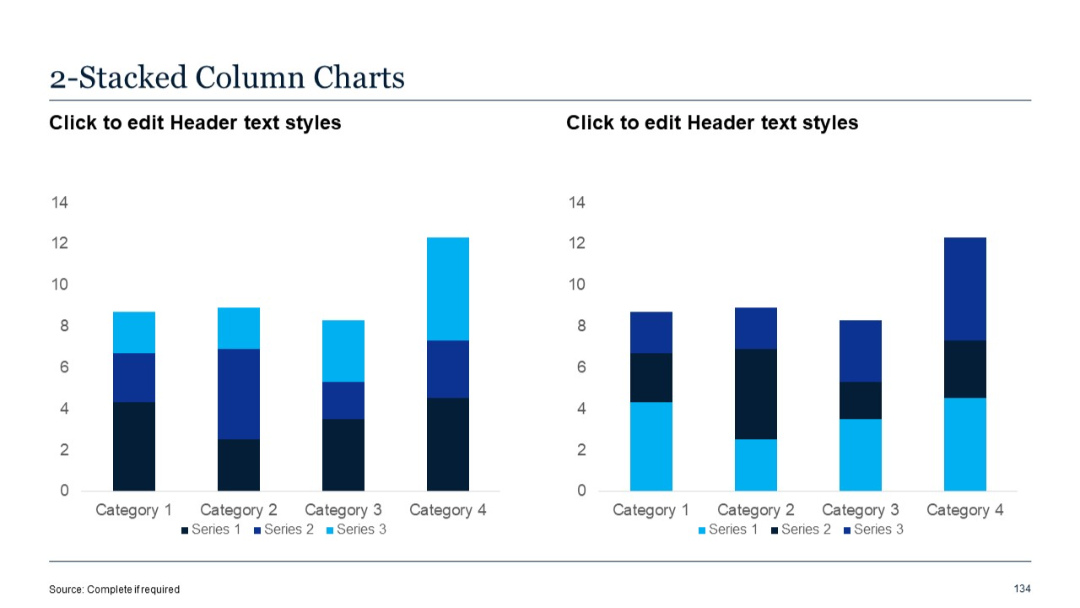
PRO
Two vertical stacked column charts side-by-side. Each column is divided into three series segments in different shades of blue.
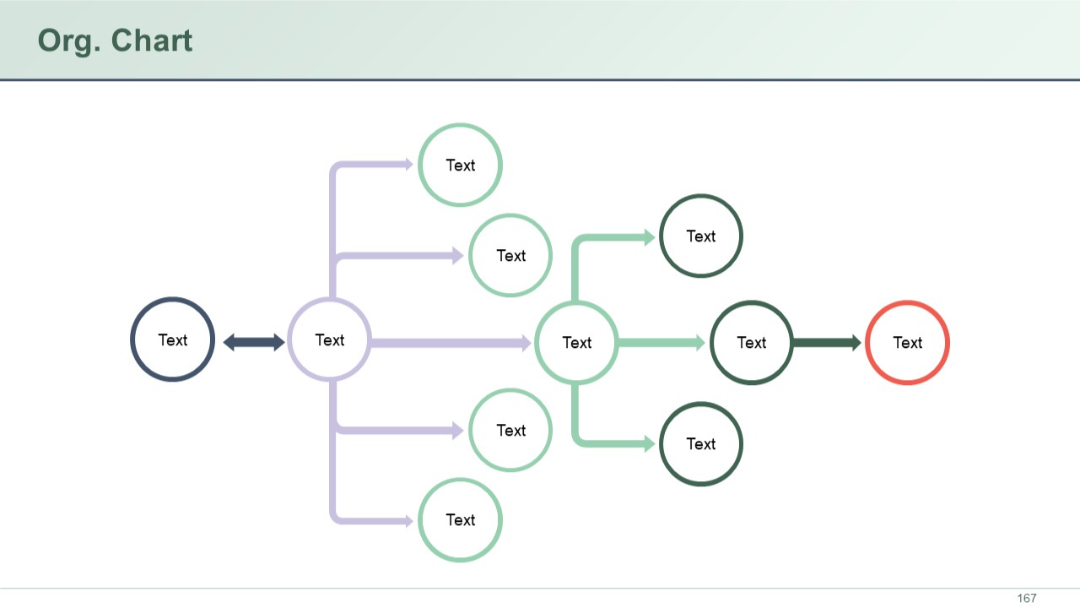
PRO
Horizontal org chart with circles and arrows. Central node branches into various teams, with mixed arrow styles indicating flows.
PRO
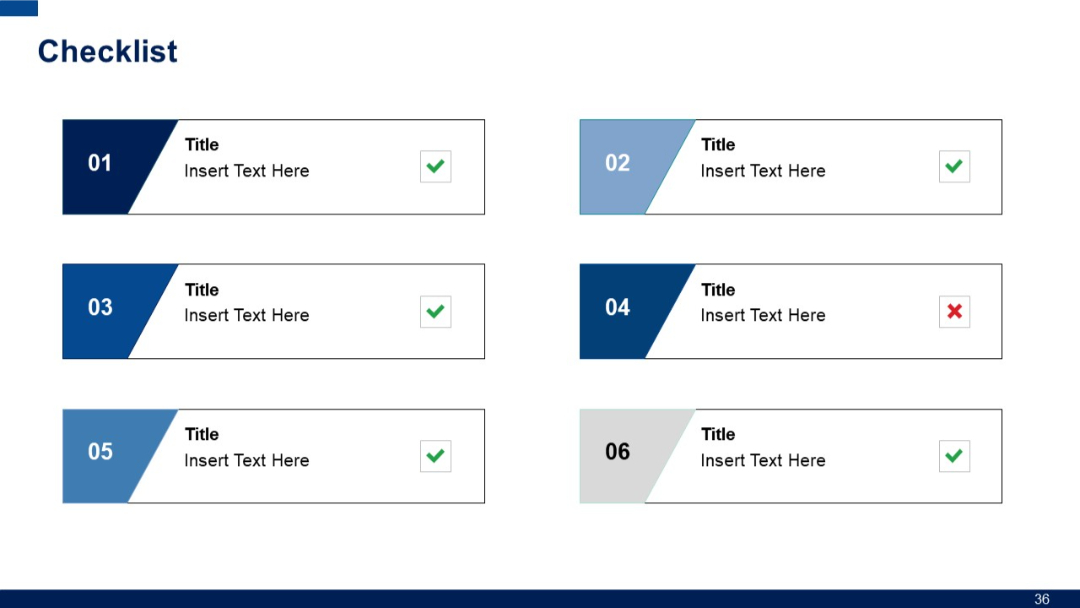
Two-column grid of checklist items with six labeled boxes (01–06), each containing a title, description, and checkmark or cross.
PRO
Complex radial diagram with a dual-ring design—outer segments have icons and the inner ring has a gear-like center.

PRO
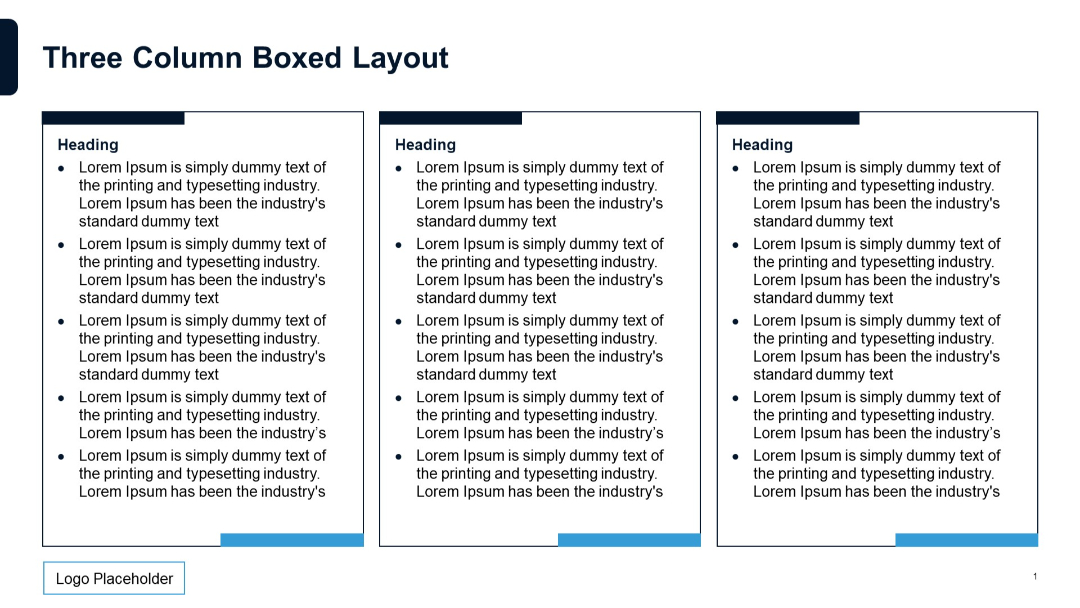
Three vertical rectangular boxes with bullet point text under headings. Blue accents and minimal lines. Structured, clean format.
PRO
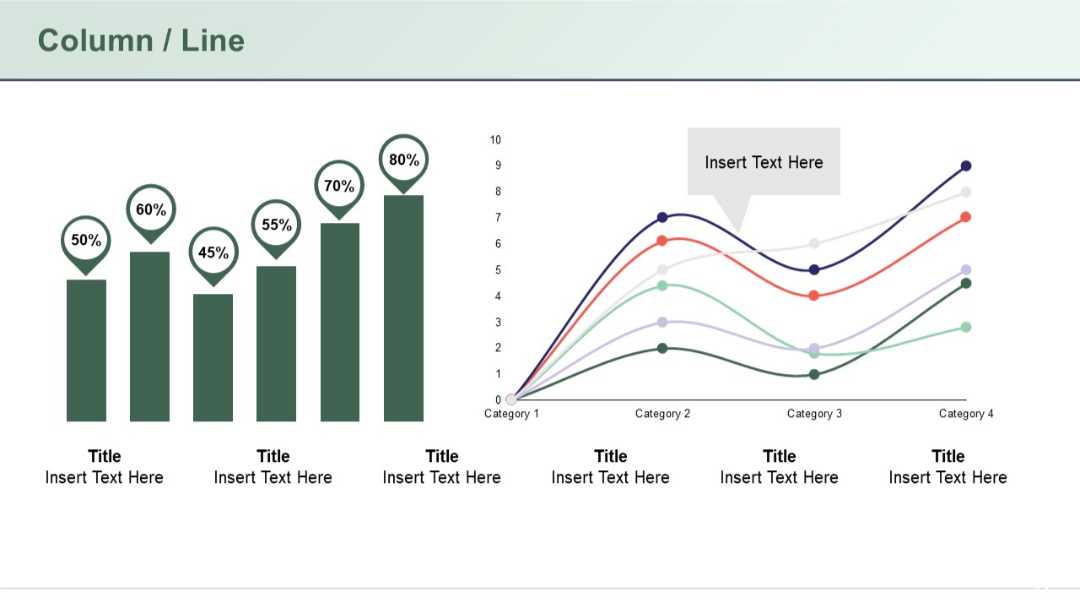
The slide features a bar chart with percentage labels above each bar on the left side, and a multi-line graph on the right with markers and a callout text box.
PRO
Left side shows a stacked column chart with numeric labels across four categories and four series. Right side presents a pie chart with labeled segments.

PRO
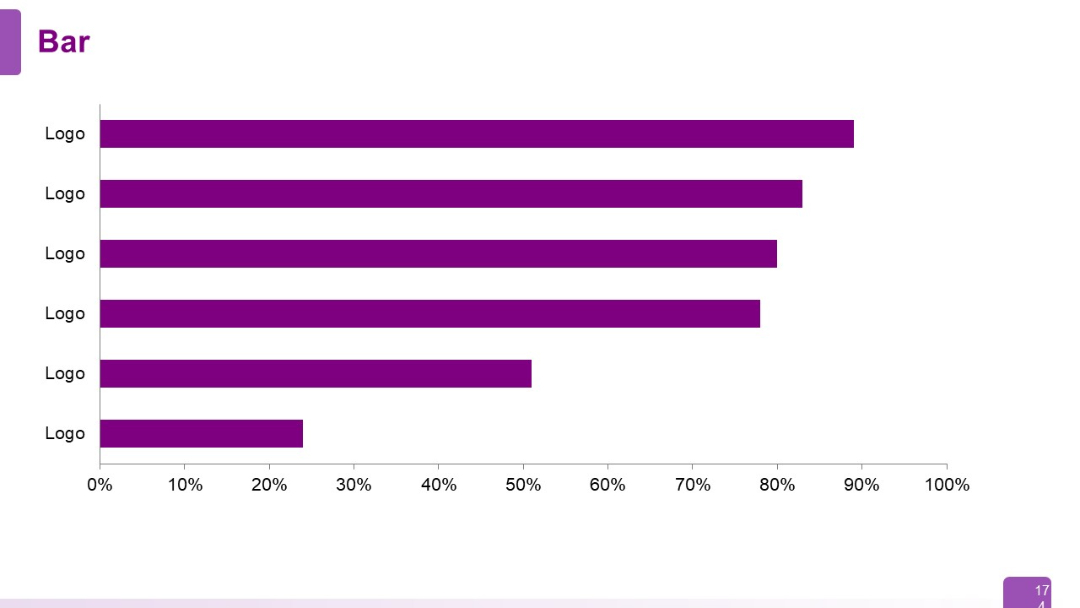
A simple horizontal bar chart with six uniformly styled bars labeled "Logo" on the Y-axis and percentage scale on the X-axis. No numerical data shown on bars.
PRO
Left-aligned visual network diagram of five circular icons (thumbs-up, rocket, monitor) connected by dotted lines. Right side has a dark blue title box with bullet list.
PRO
Line chart with three data series plotted together across four categories. Uses distinct color lines.

PRO
Three rounded rectangular cards with numbering tabs at the bottom.

PRO
Grid layout with six square purple icons numbered 01–06, each followed by text. Three rows and two columns. Simple, modern design.
PRO
Horizontal timeline with five numbered milestones (1–5) marked by purple location pins. Each milestone has a textbox beneath it. Clean and minimal layout.
PRO
A basic area chart showing two series over time. No additional descriptive text, minimalistic layout focused on the chart itself.

PRO
White background grid layout filled with outlined vector icons in multiple rows, clean and minimalist with black thin-line icons.
PRO
Two-column layout with titles at the top and checkmark icons beside each listed item; symmetric and clean design.
PRO
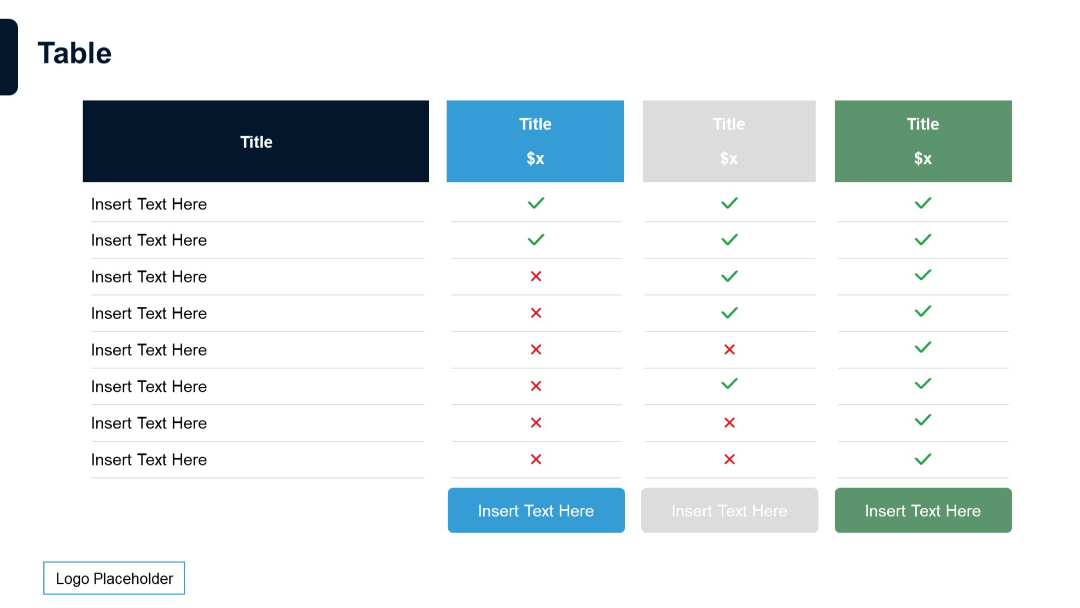
Column-focused table using colored columns (blue, gray, green) with pricing titles; rows contain check/cross status for feature inclusion.
PRO
A five-part circular diagram with petal-like segments arranged around a central text circle. Each segment is uniformly sized and colored differently.

PRO
Grid of six outlined rectangular boxes with top-left numeric tabs and titles, arranged in two rows.
PRO
Left-aligned vertical content list with blue arrows, paired with faded icon-labeled blocks on the right.
PRO
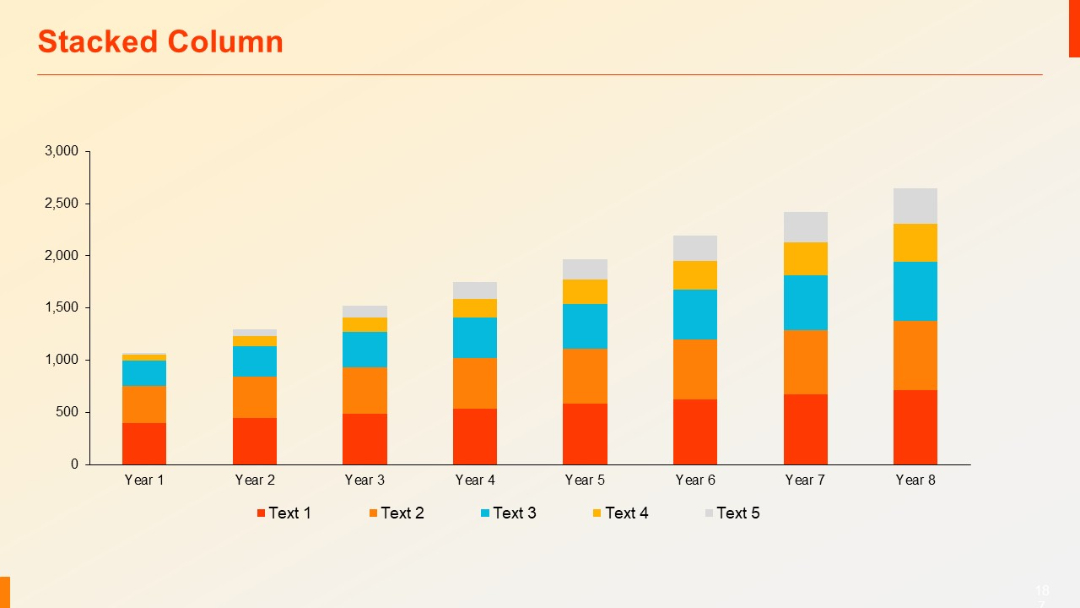
A stacked vertical column chart over eight time periods (Year 1–Year 8), with five colored segments per bar. Clean grid background.
PRO
A large central quote block with bold quotation marks and a dark title bar above; ample space for text.
PRO
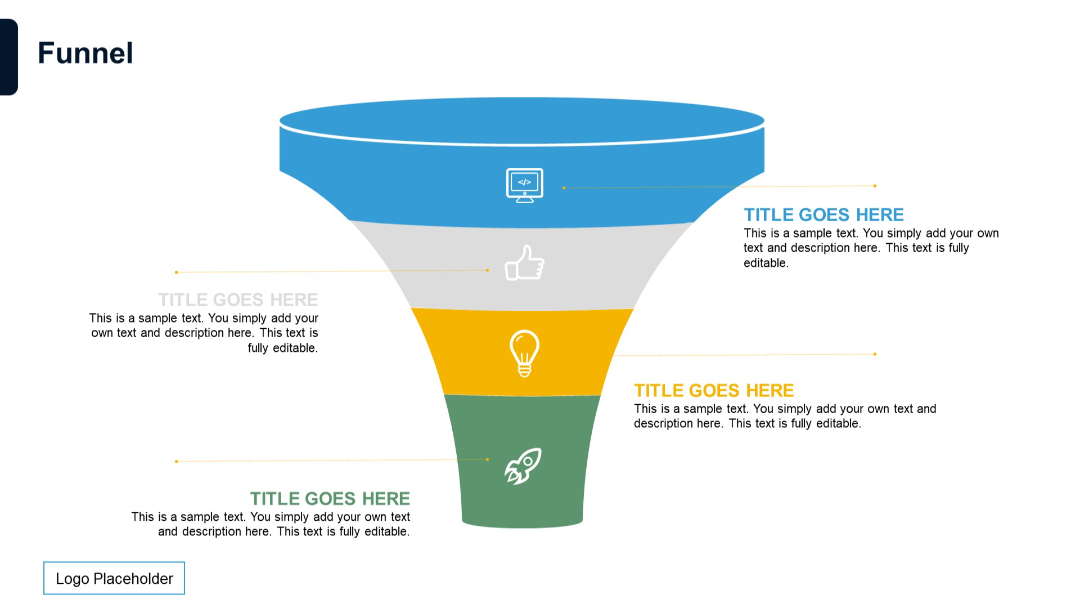
Classic vertical funnel layout with five stages in distinct colors. Each stage has icons and editable text pointing outward to the right or left.
PRO
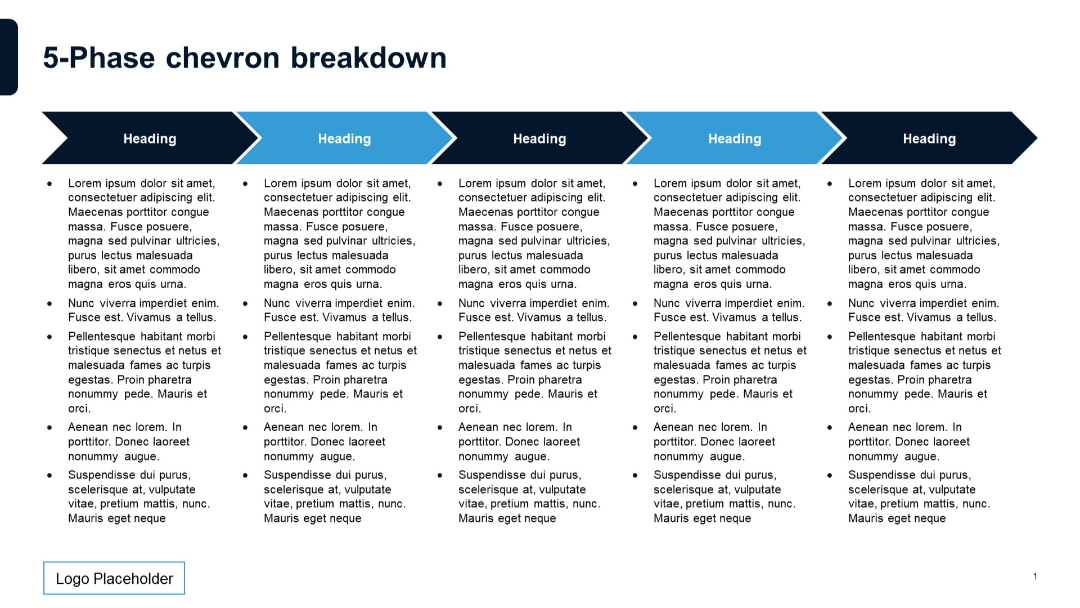
Five horizontally connected chevrons with alternating blue shades. Each phase has a heading and aligned bullet list below. Spans across the slide, using all available horizontal space.
PRO
Seven-part circular diagram with beveled segment design and central ring. Each part is labeled with an icon and accompanied by text around the outside.
PRO
Flow-style organizational chart using colored circular nodes and arrows to indicate relationships.
PRO
Split layout with a purple text box on the left for the quote and a white box on the right, possibly for attribution or commentary. Bold quotation marks in corners.

PRO
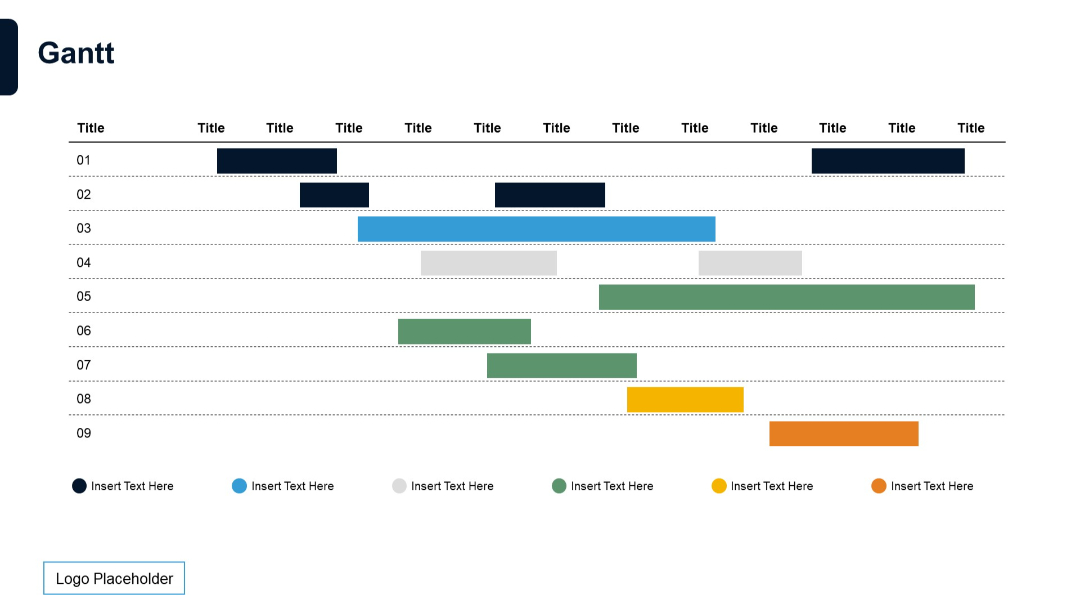
Dense, multi-row Gantt chart with horizontal bars color-coded across nine tasks. Black header with repeating "Title".
PRO
Similar matrix format as Slide 23 but with three rows; all column headers styled in bold blue, and rows use shaded title columns on the left.