PRO
Two large columns with bold red headers. Subtitles are emphasized with strong color blocks above text areas.

PRO
Single stacked column chart with green hues and positive/negative axis values. No data labels; minimal layout.

PRO
Left-aligned large semi-circle with "Title" text and four aligned horizontal checkmarks with text placeholders on the right.
PRO
Vertical list of five items with numbered icons and checkmarks; blue gradient sidebar with circular labels; structured linear layout.
PRO
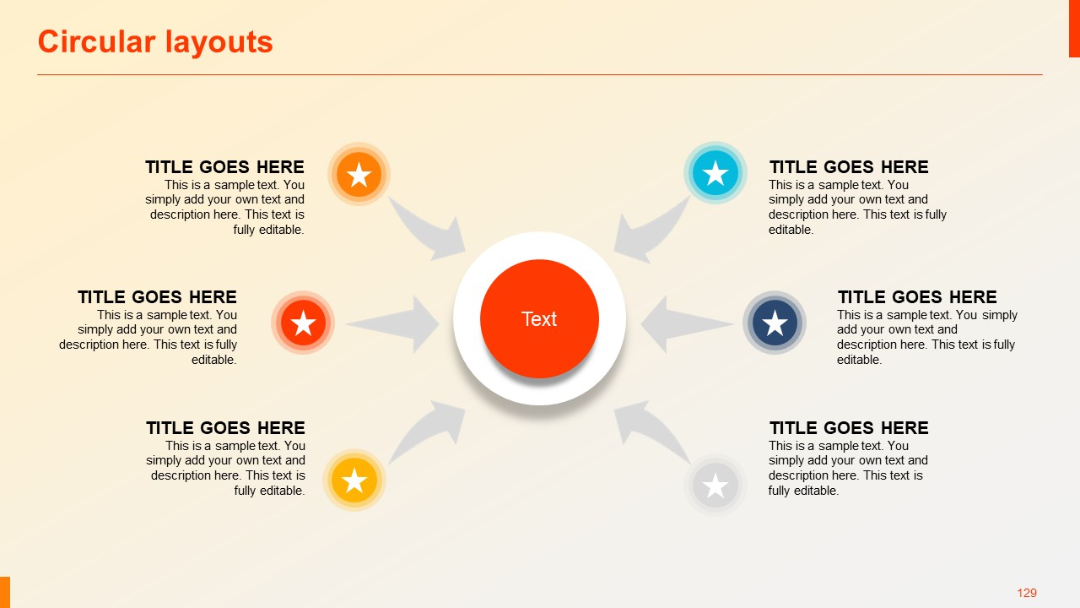
Central red circle labeled "Text" with six surrounding icons and arrows pointing inward; each outer item includes a title and description.
PRO
Minimal slide with only a section number and title. White background with faint diagonal lines.

PRO
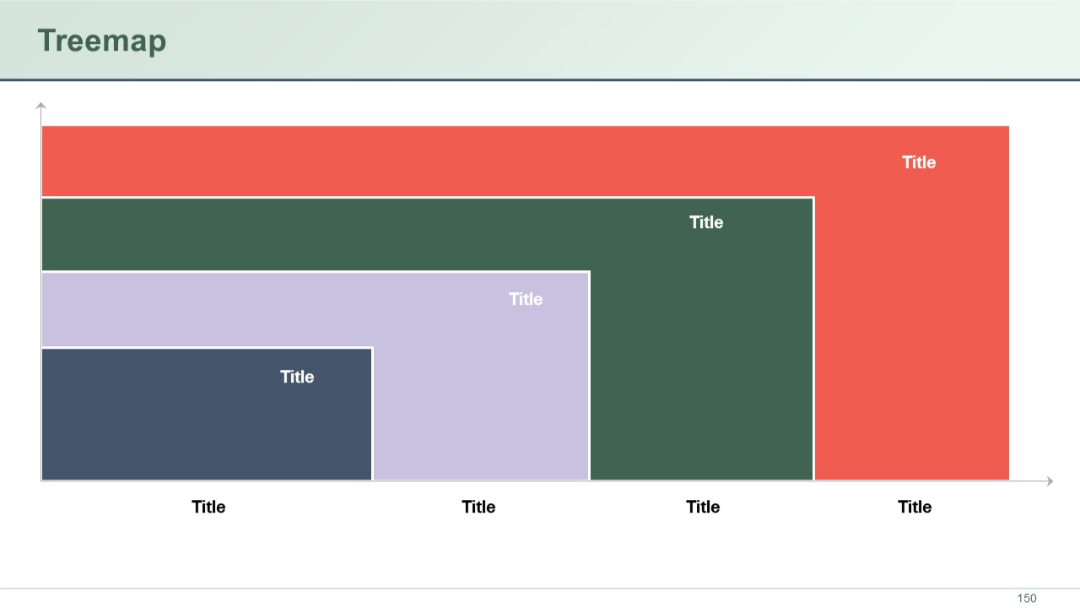
A treemap chart made of nested rectangles with different colors and sizes. Each block has a placeholder title and represents hierarchical data visually.
PRO
Clean white background with a left-aligned title and date; placeholder for logo; diagonal color accents on the bottom right.

PRO
Structured container with a header labeled "Title" and four speech bubble icons aligned vertically, each with two levels of placeholder text.
PRO
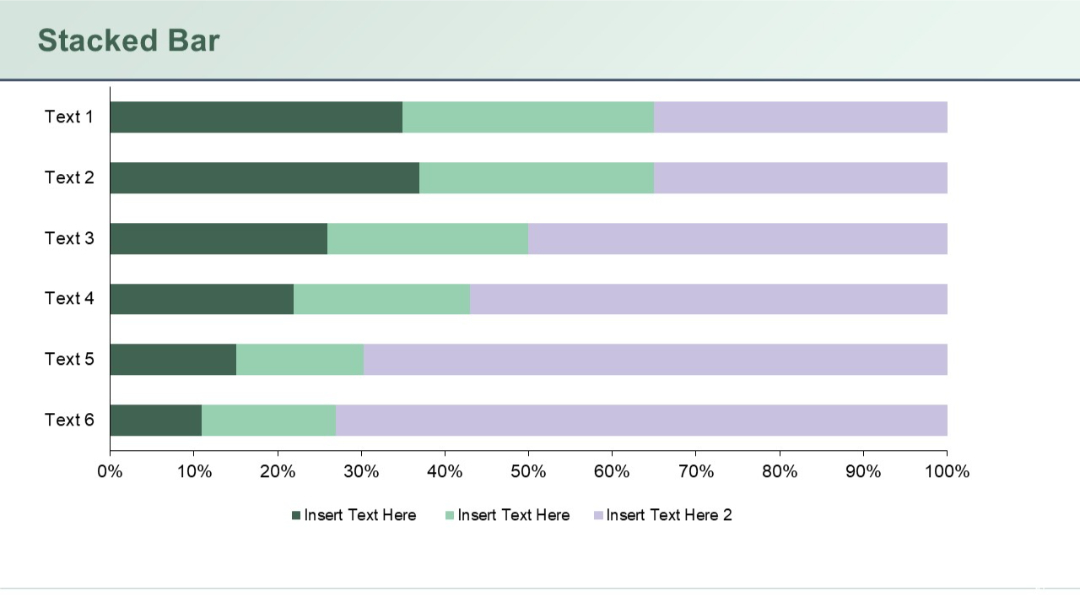
Horizontal 100% stacked bar chart with six rows, using three different colors to indicate series data.
PRO
Four rectangular blocks with rounded edges layered over a large arrow background, progressing left to right.
PRO
Grid of directional and action-based icons (arrows, checkmarks, cancel, play) arranged in consistent spacing.
PRO
Title slide with dark background, bold “Case Study” label, and a horizontal line ending in a circle for visual effect.

PRO
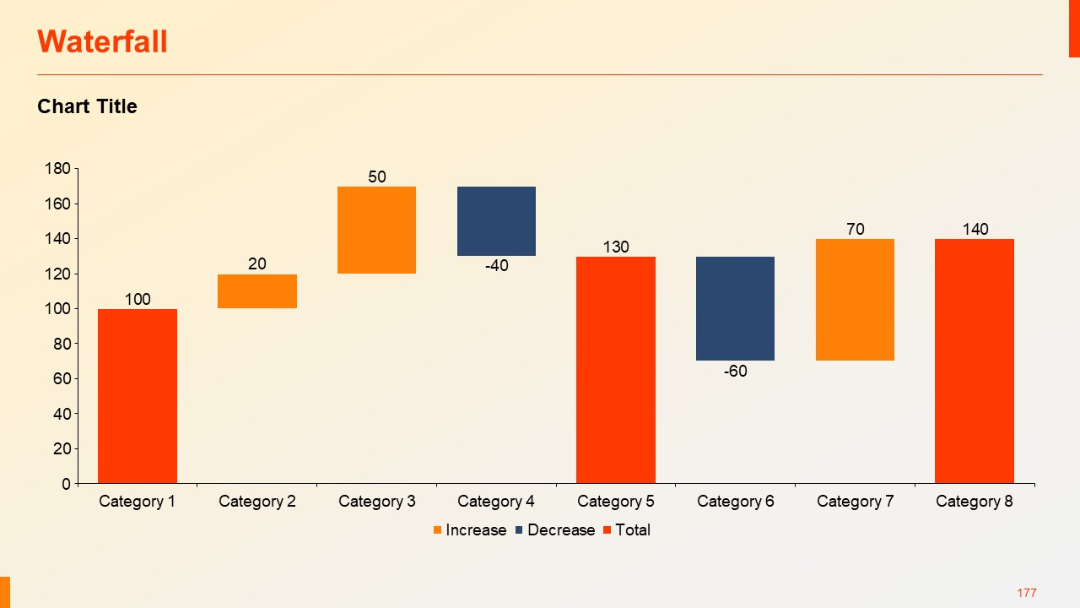
Waterfall chart with categories 1–8. Bars color-coded by type: increase (orange), decrease (blue), total (red). Numeric values displayed above bars.
PRO
Circular infographic with 7 gear-shaped segments numbered 1 to 7, arranged around a central gear labeled "HEADING". Text placeholders surround the circle.

PRO
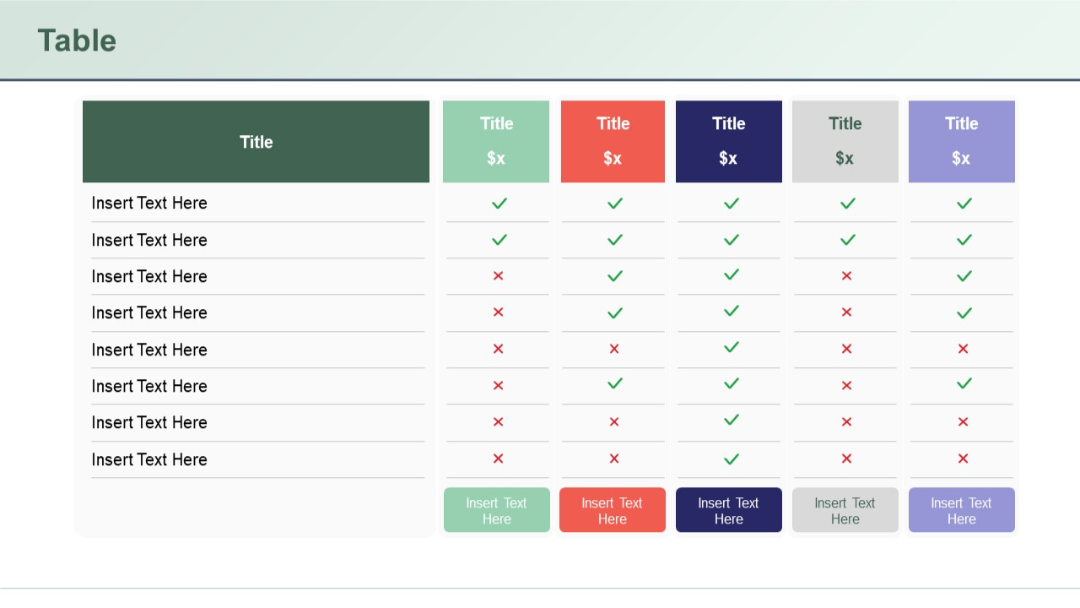
Six-column comparison layout with color-coded column headers and check/X symbols; header and bottom “Insert Text Here” fields for each column.
PRO
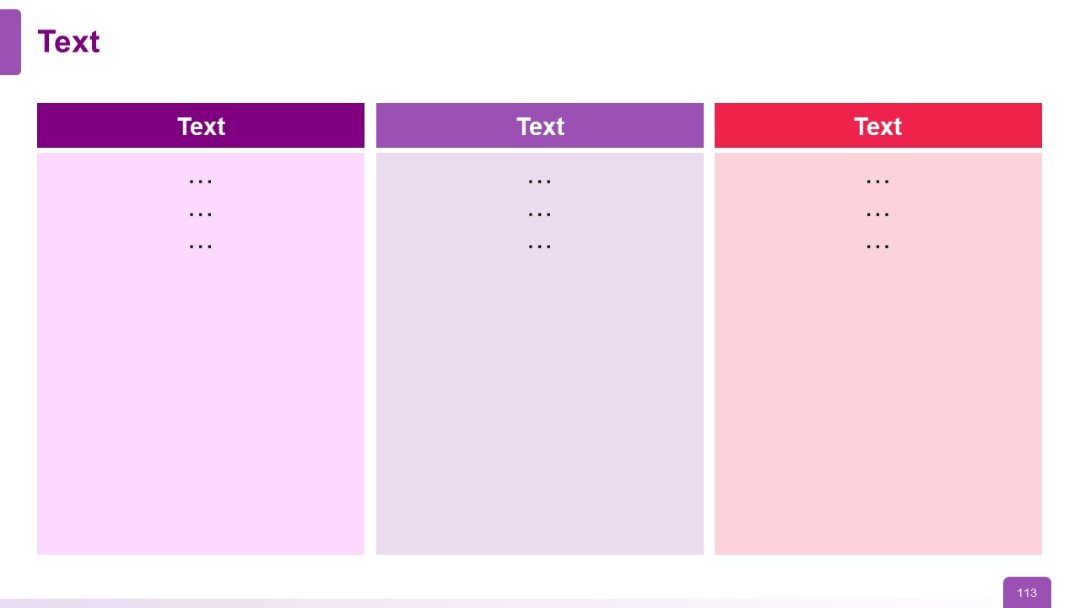
Three-column layout with color blocks, each featuring header and list
PRO
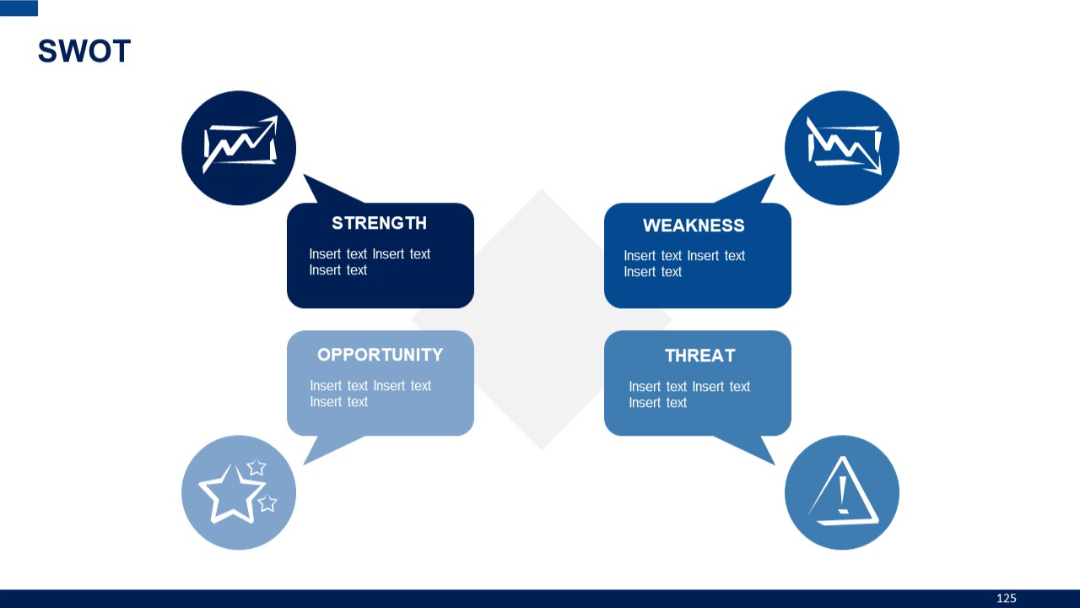
Icon-based SWOT diagram with arrows pointing from icons to rectangular text boxes, symmetrically arranged around a central diamond.
PRO
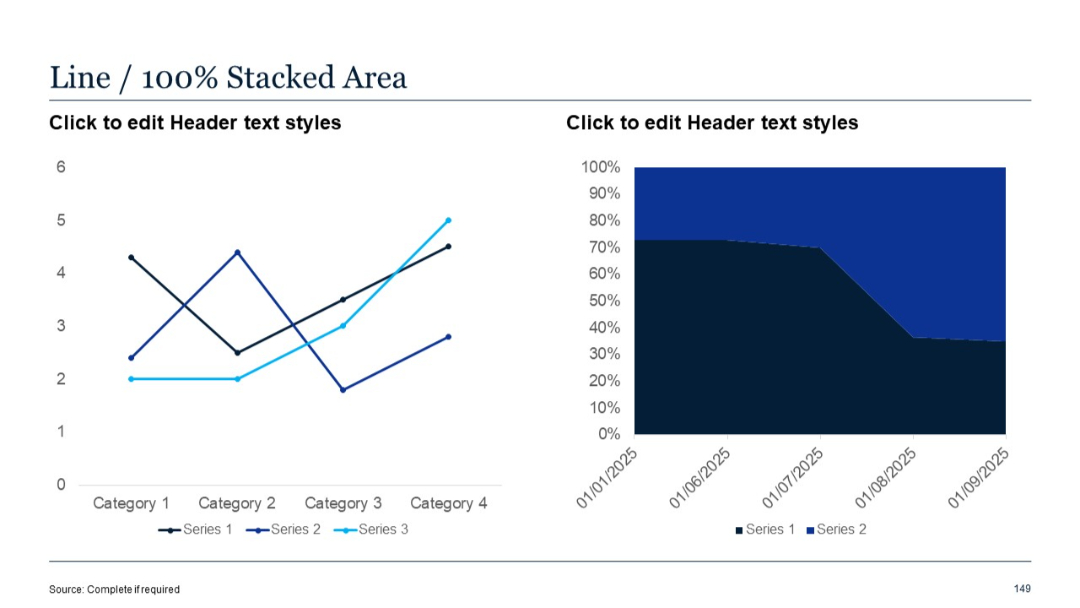
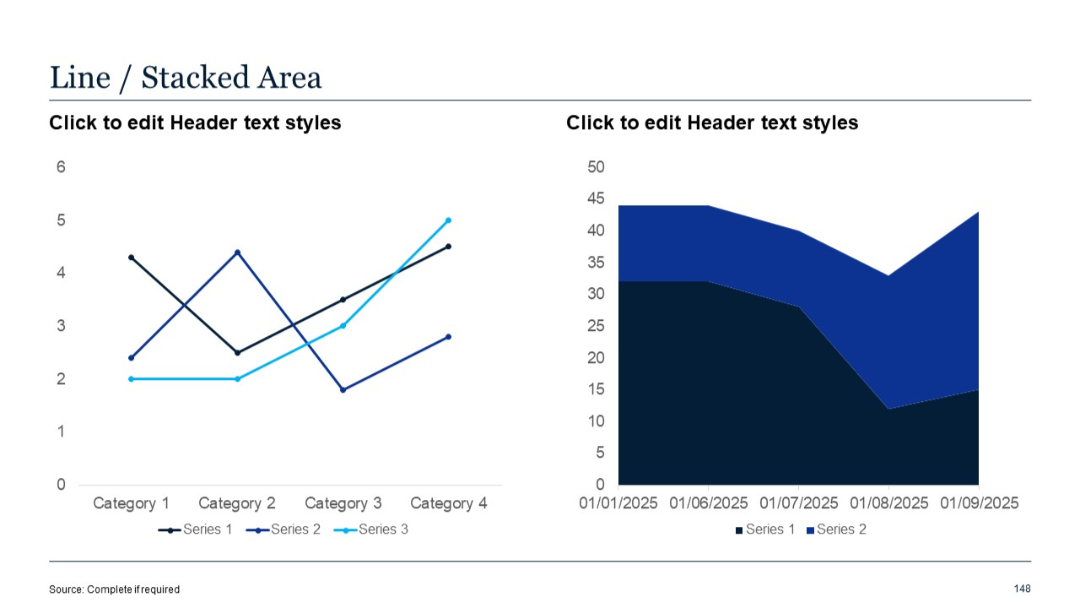
Left panel has a line chart for 3 series; right panel is a 100% stacked area chart for 2 series. Percent focus on right.
PRO
Table with 5 rows and 4 columns; left column fully shaded; uniform row spacing; white cells for content.
PRO
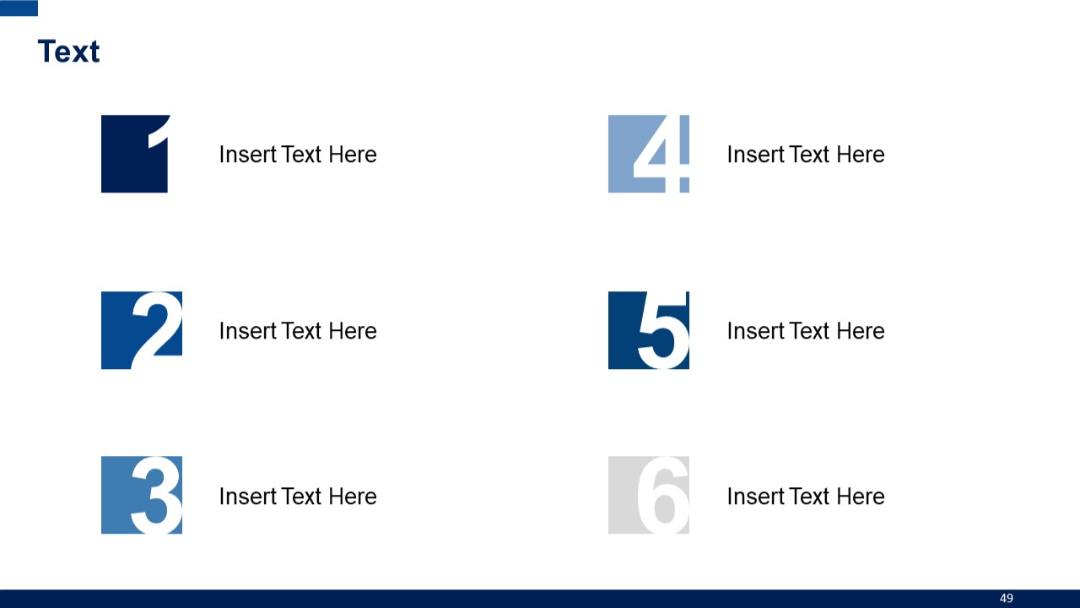
Grid layout with large numbers in boxes on alternating sides and placeholder text next to each.
PRO
Light background with centered title, circular expert portraits, and brief bios underneath.

PRO
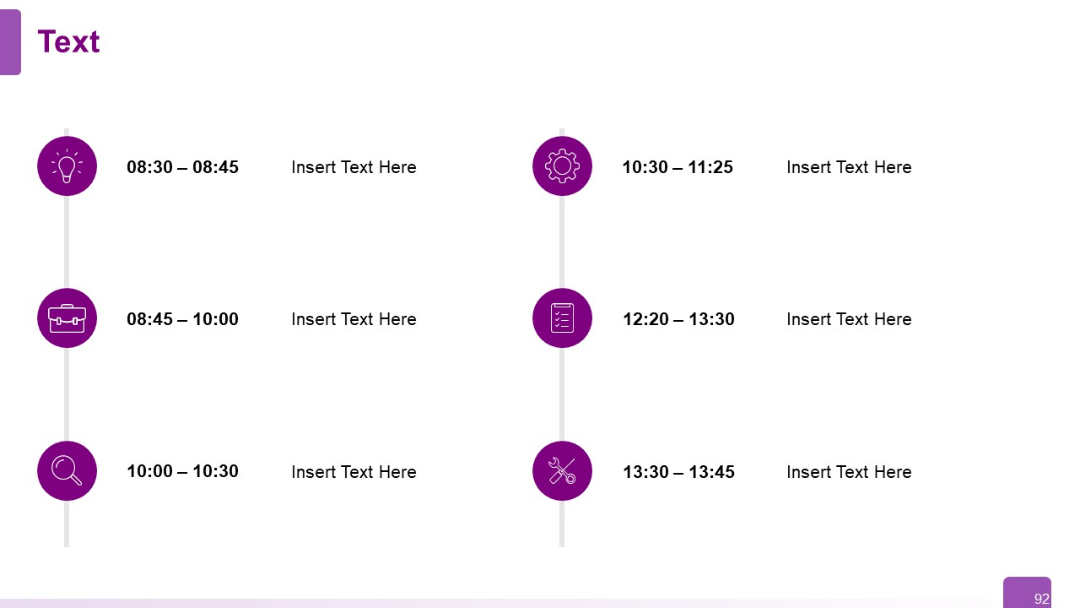
Vertical timeline with icons and time blocks on either side; alternating placement with icons in purple circles and text aligned left and right.
PRO
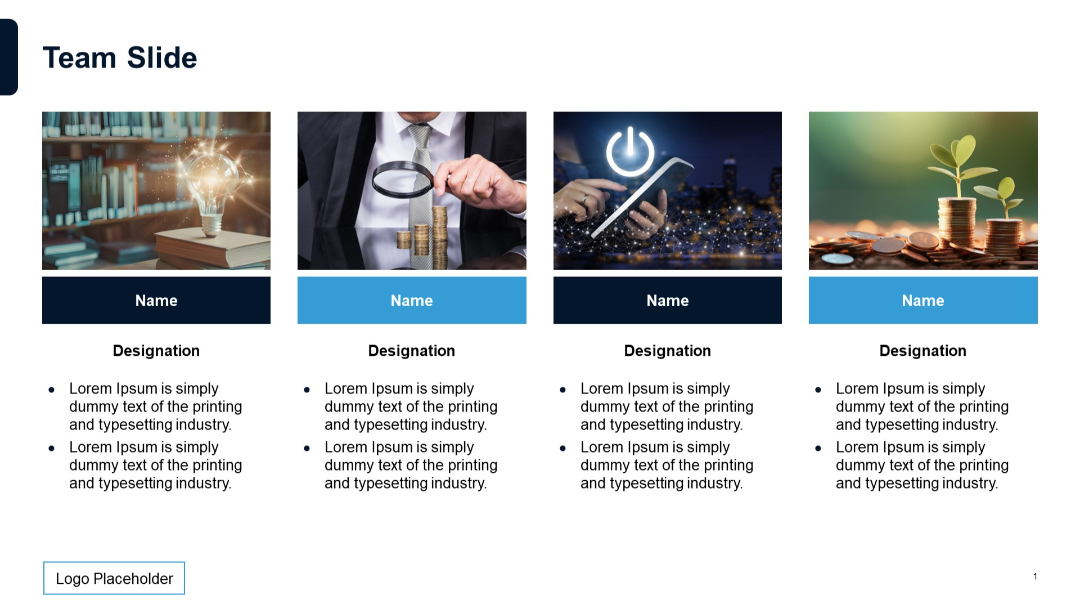
A slide with real photo placeholders above each profile section, adding visual context to team descriptions.
PRO
Left chart is a line chart for 3 series; right chart is a stacked area for 2 series. Split visual structure balances time and category views.
PRO
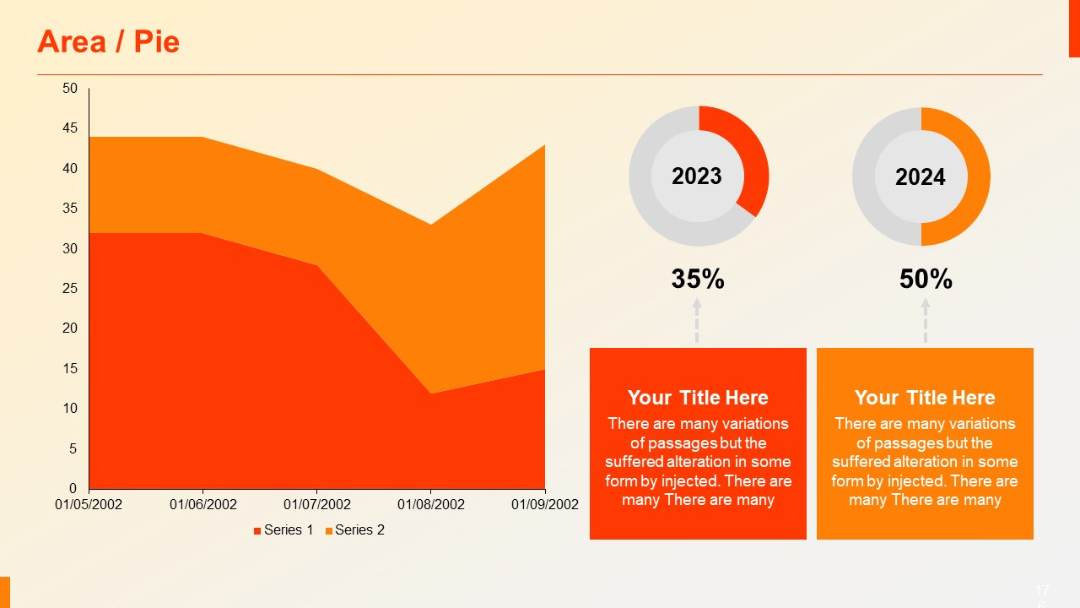
Combo slide: Left side shows an area chart, right side displays two donut pie charts with year and % (2023: 35%, 2024: 50%). Text boxes below each chart.
PRO
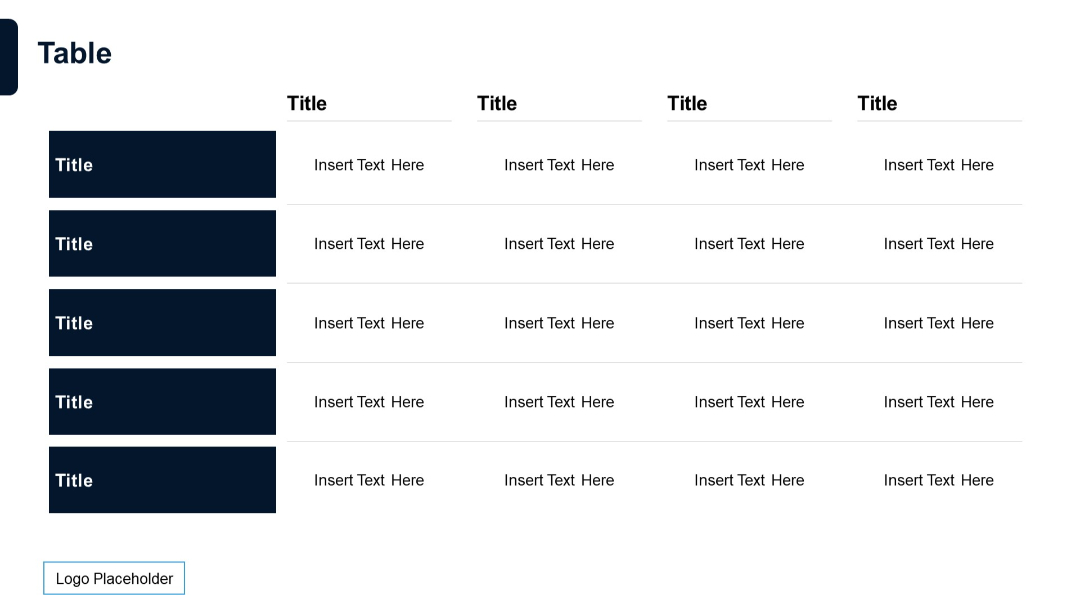
5-column, 4-row table with consistent styling. Dark blue header column and minimal dividers. Ample space for text. Logo placeholder included.
PRO
Two-column layout with vertical timeline in the center. Each side contains vertically aligned text entries with circle markers connected to a central line.
PRO
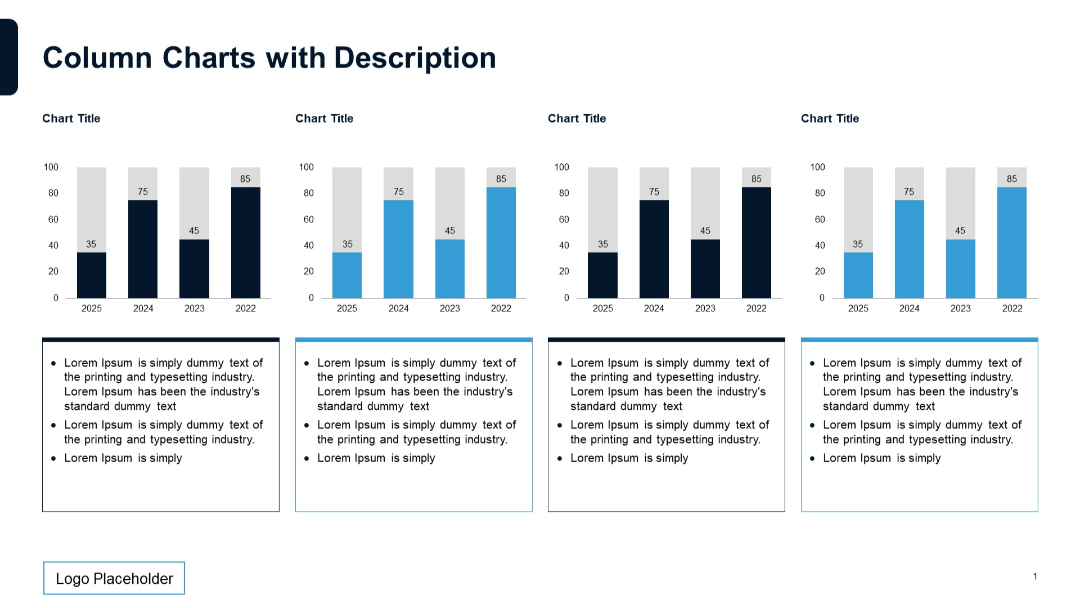
Four stacked column charts placed horizontally, representing yearly comparisons. Each chart has a text box with bullets directly below it.
PRO
Section title slide with large "02" and the label "Quantitative Slides"; minimal design with angled lines on the right.


