PRO
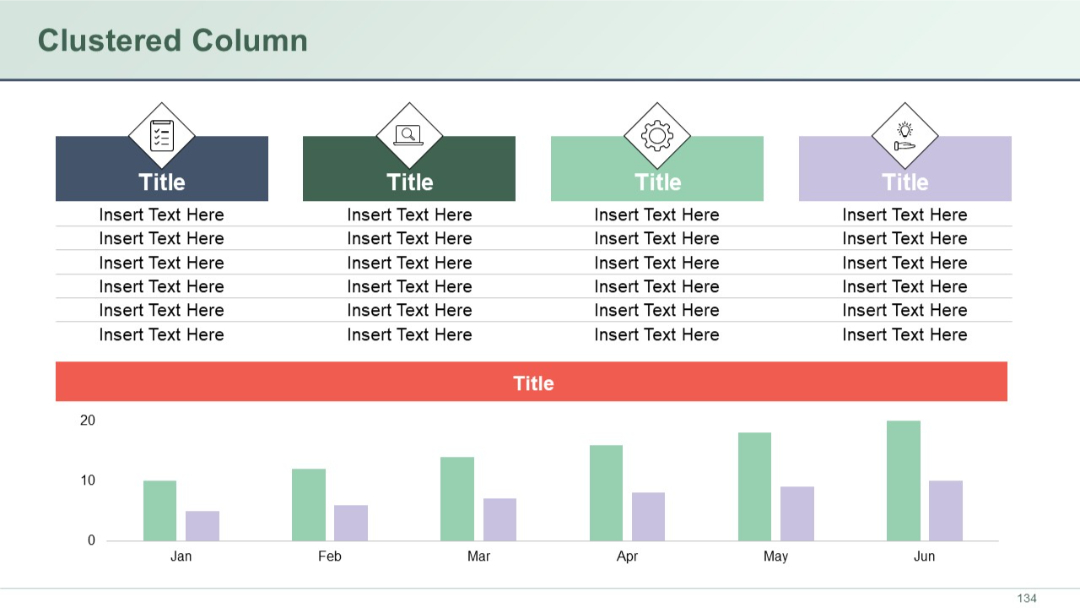
Slide with a combination of top data tables and a clustered column chart on the bottom. Visual icons and color blocks used in top sections.
PRO
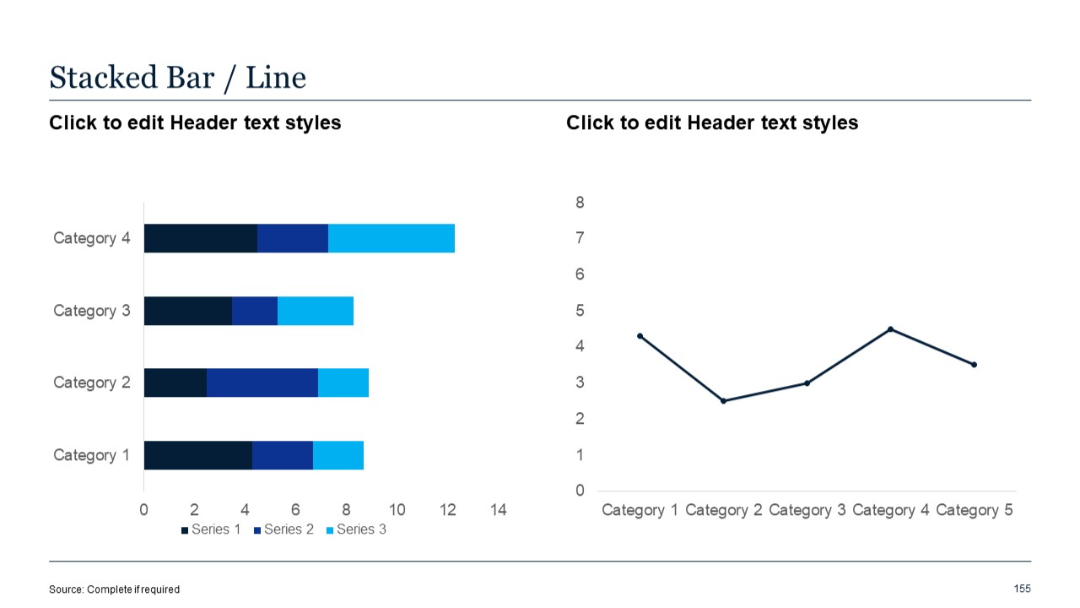
Left chart uses horizontal stacked bars; right chart is a line graph. Series are color-coded in blue gradients.
PRO
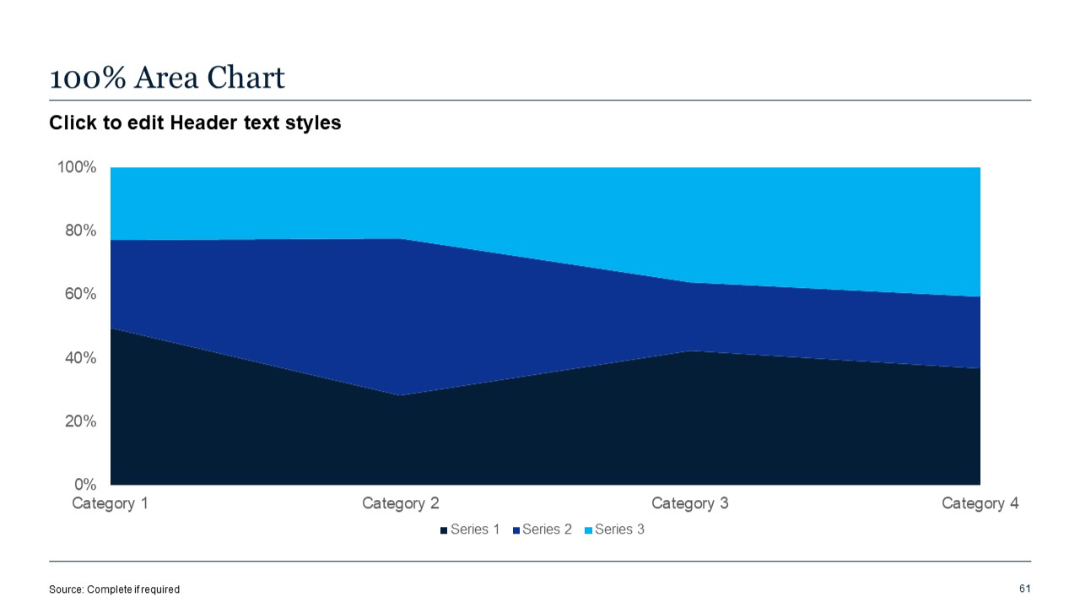
Horizontal area chart with three stacked color bands; clean layout with axis labels and legend.
PRO
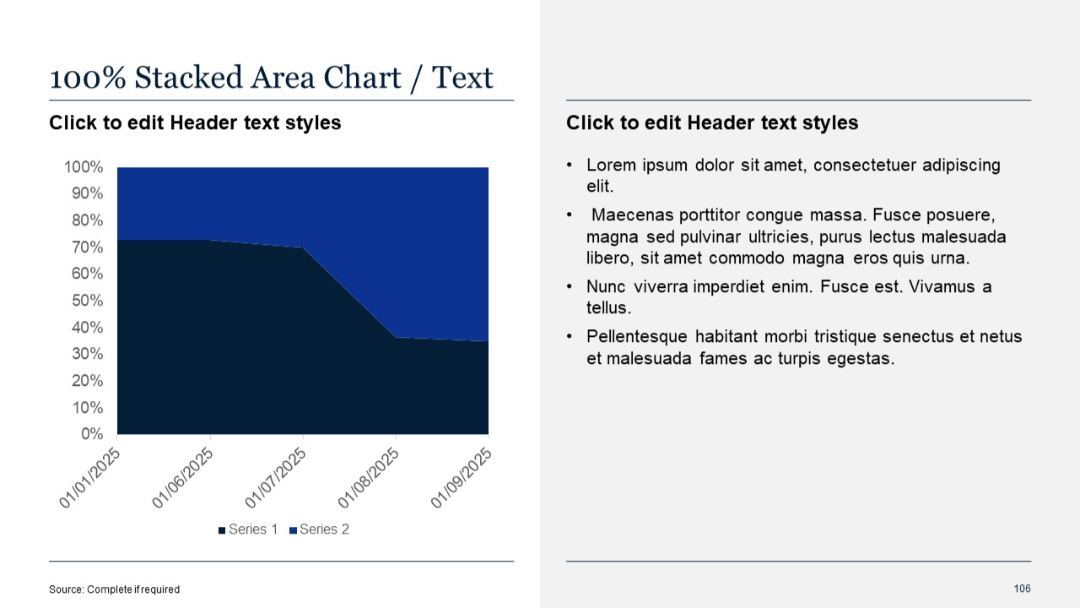
100% stacked area chart on the left with angled date labels; standard text panel on the right.
PRO
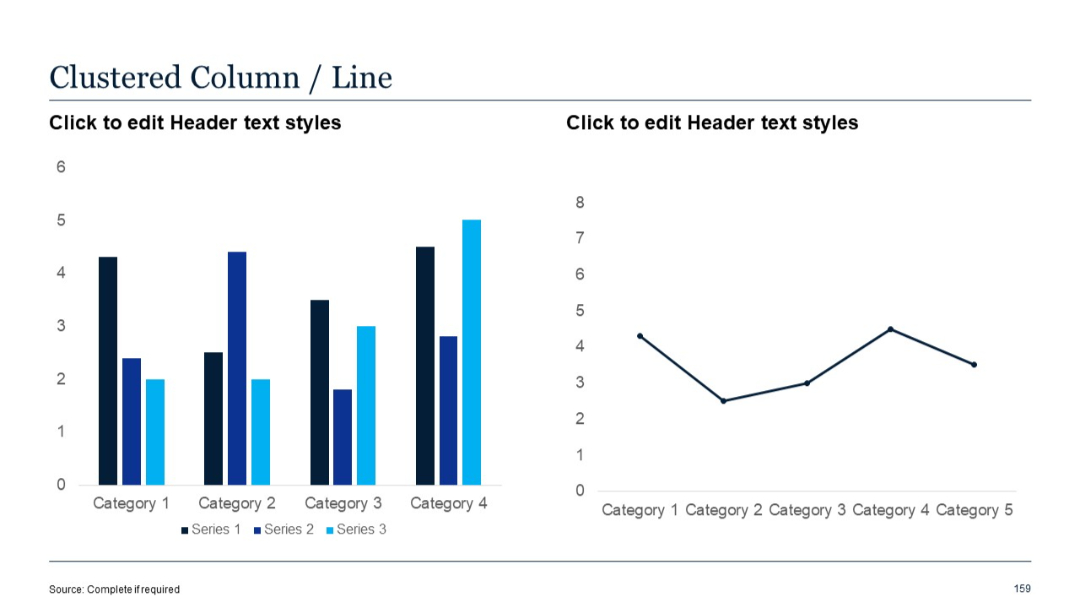
Left chart uses clustered vertical columns; right chart is a line graph. Series are clearly color-separated.
PRO
Four equal rectangular sections with headings for Strength, Weakness, Opportunity, and Threat.

PRO
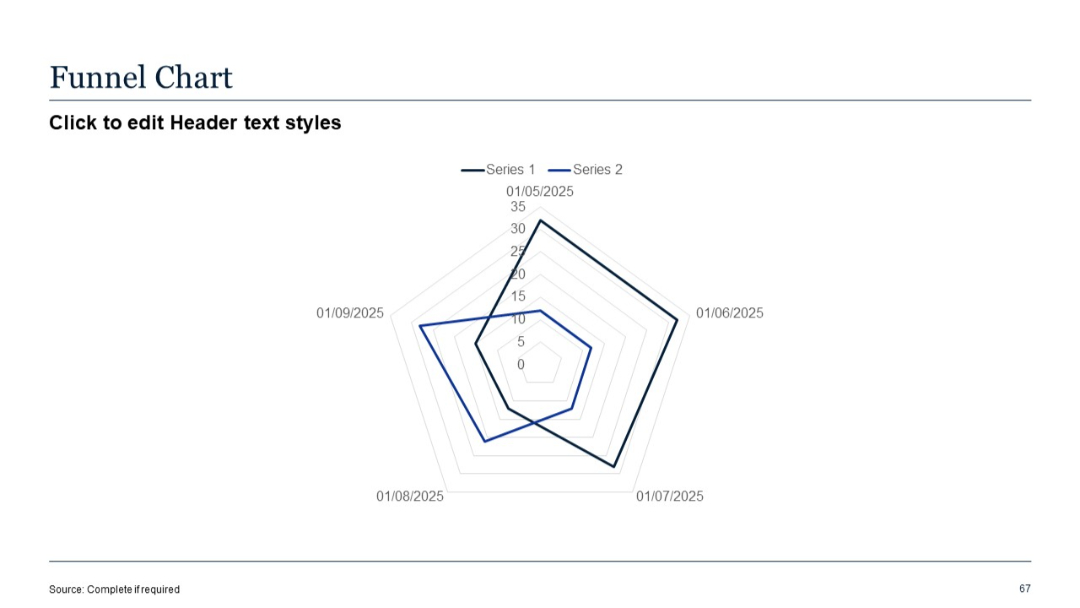
Radar (spider) chart mislabeled as funnel chart; two data series over five time-stamped axes.
PRO
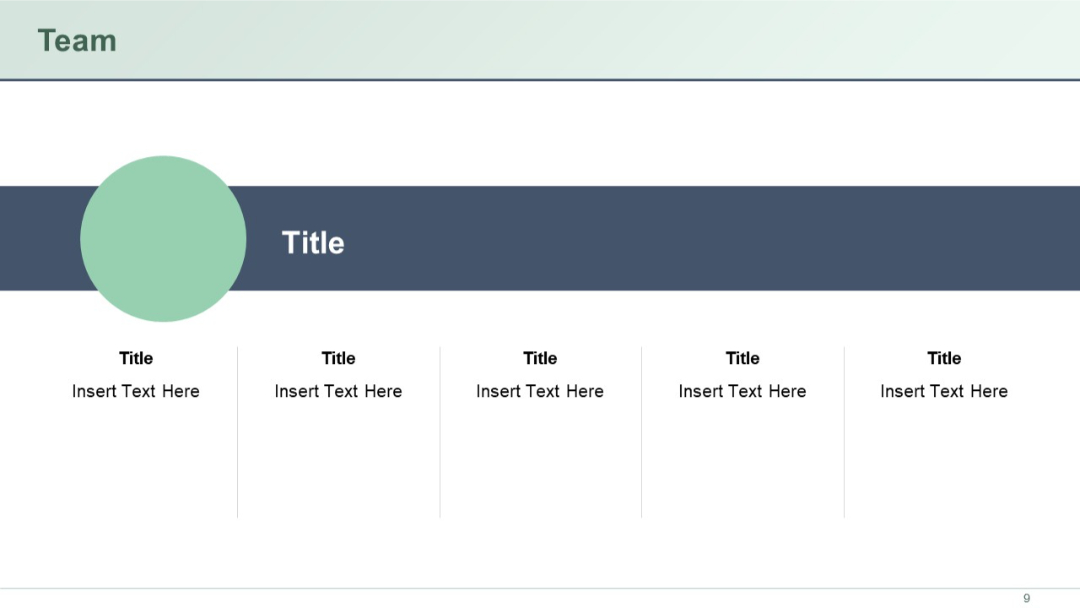
Horizontal layout with a central title bar and five team member placeholders beneath. Circle frames and aligned structure ensure clarity.
PRO
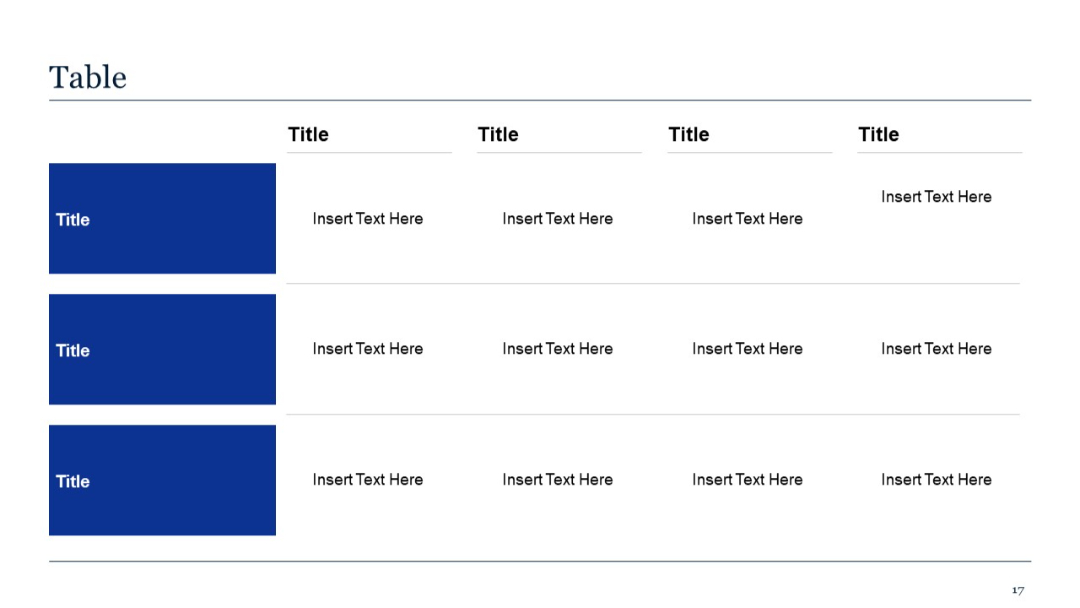
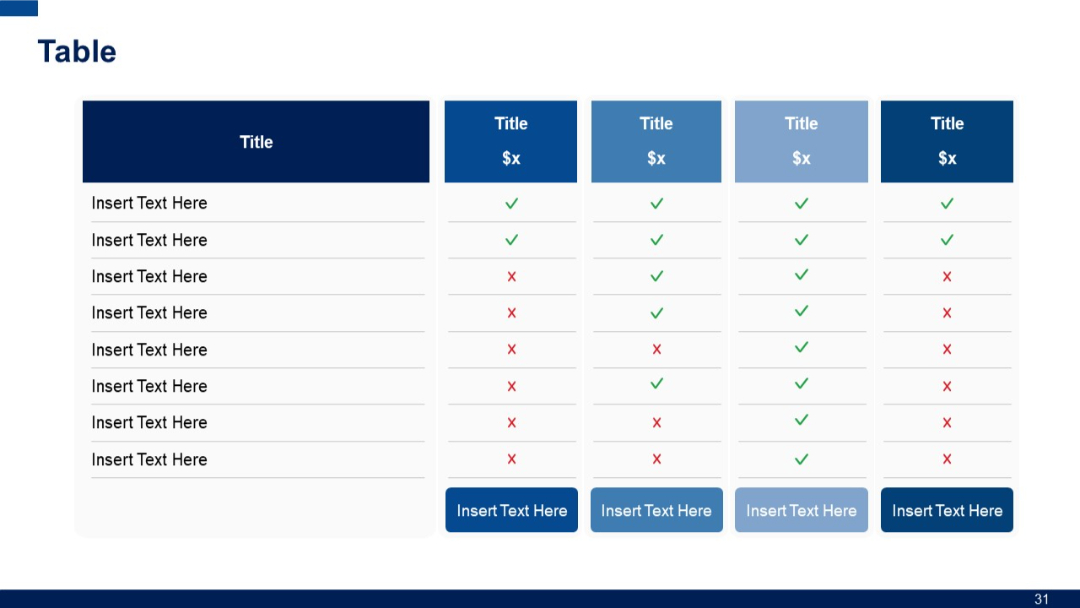
Expanded table format with three rows and four columns. Consistent with slide 16 but offers more data points.
PRO
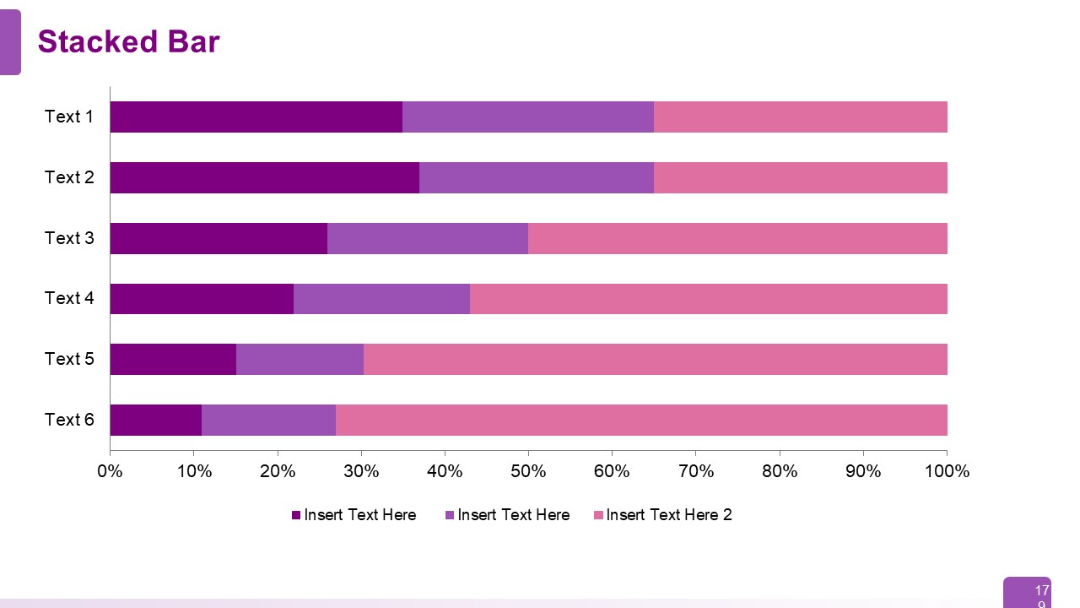
Full-width horizontal stacked bar chart with six rows (Text 1–6). Each row contains three colored segments labeled with placeholder text.
PRO
Four side-by-side pillar columns with circular icons and bullet point text below each header. Neatly segmented for clarity.

PRO
Horizontal comparison table with five vertical columns and eight horizontal rows; columns have colored headers and cells use checkmarks or crosses.
PRO
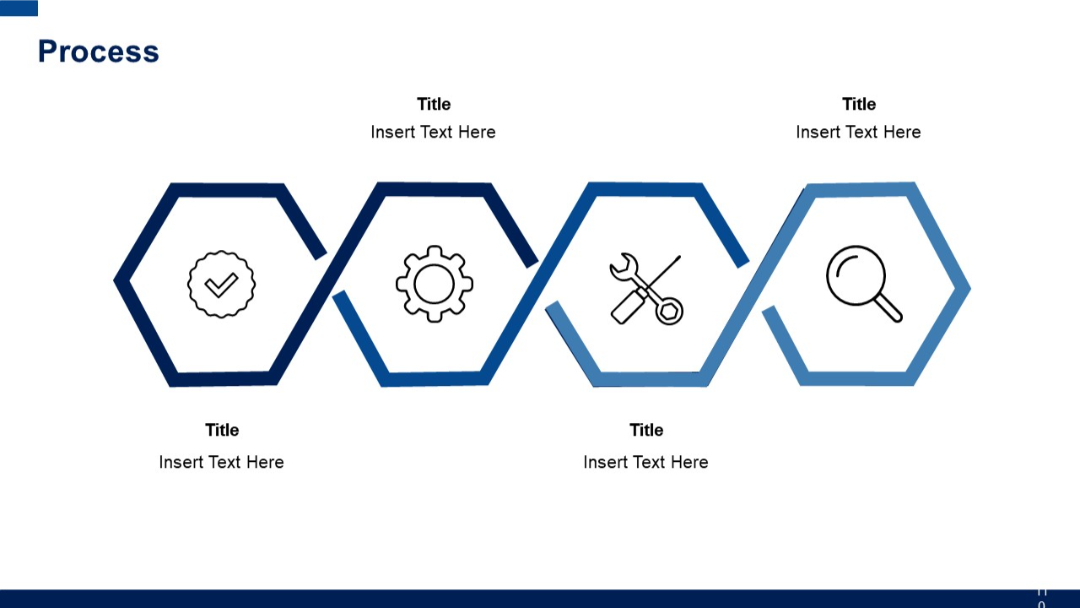
Four hexagonal shapes with icons inside, connected in a zigzag path, each labeled with a title and short text below.
PRO
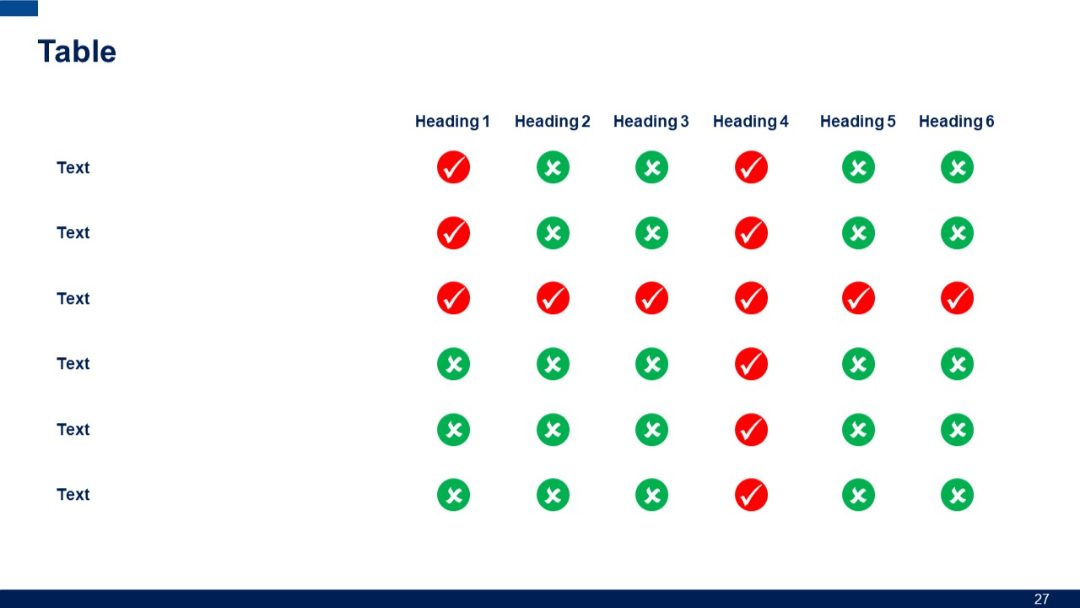
Visual matrix with 6 columns and 5 rows. Each cell shows a green check or red cross. Row labels are on the left, column headings on top.
PRO
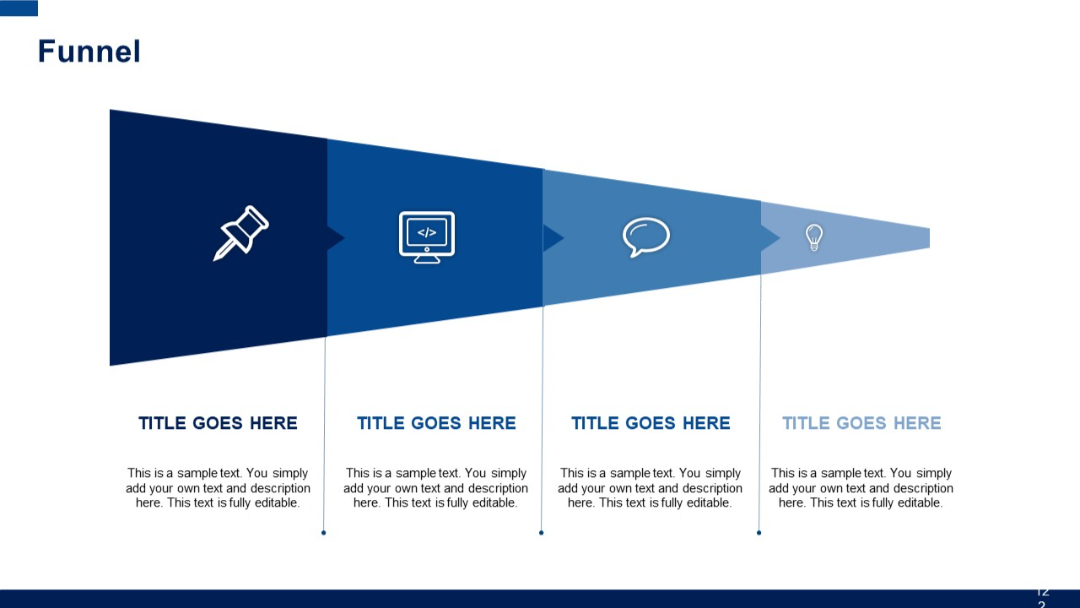
Diagonal segmented funnel in four stages with icons and text beneath each stage. Visual gradient from dark to light blue indicates progression.
PRO
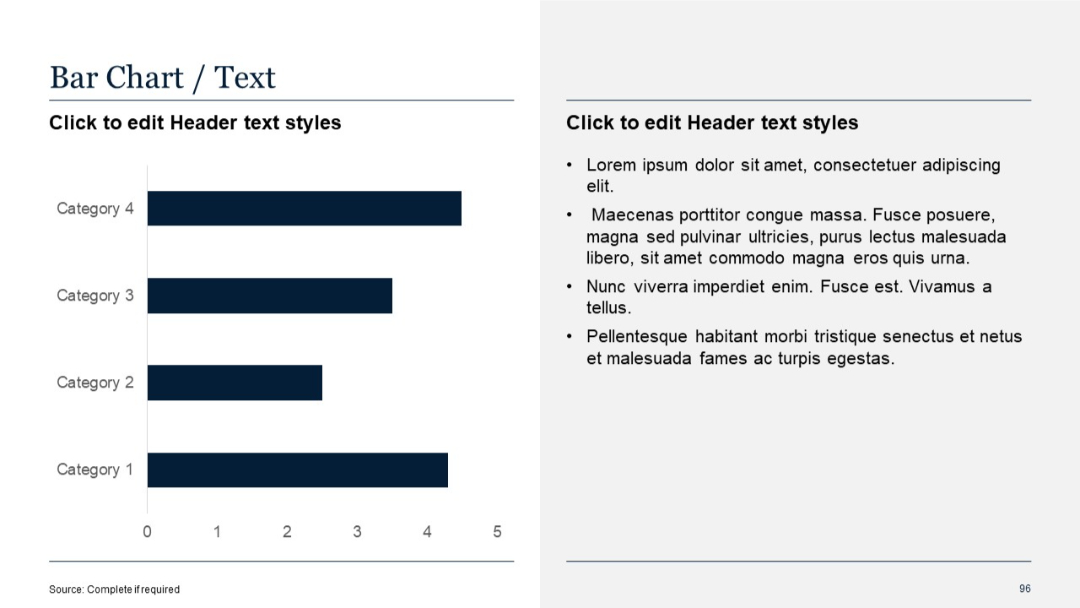
Horizontal bar chart with four categories; right-hand text box.
PRO
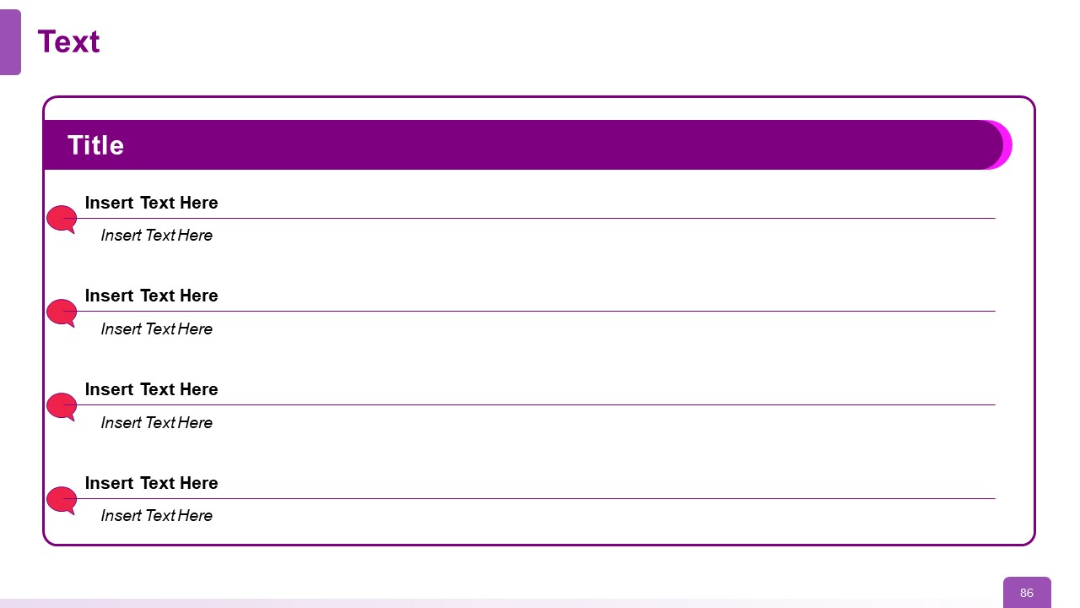
Boxed table layout with title bar and four rows. Speech bubble icons mark bullet points. Mix of bold and italic fonts.
PRO
Center-aligned dark blue quote box with quotation marks, placeholder text, and empty white space.

PRO
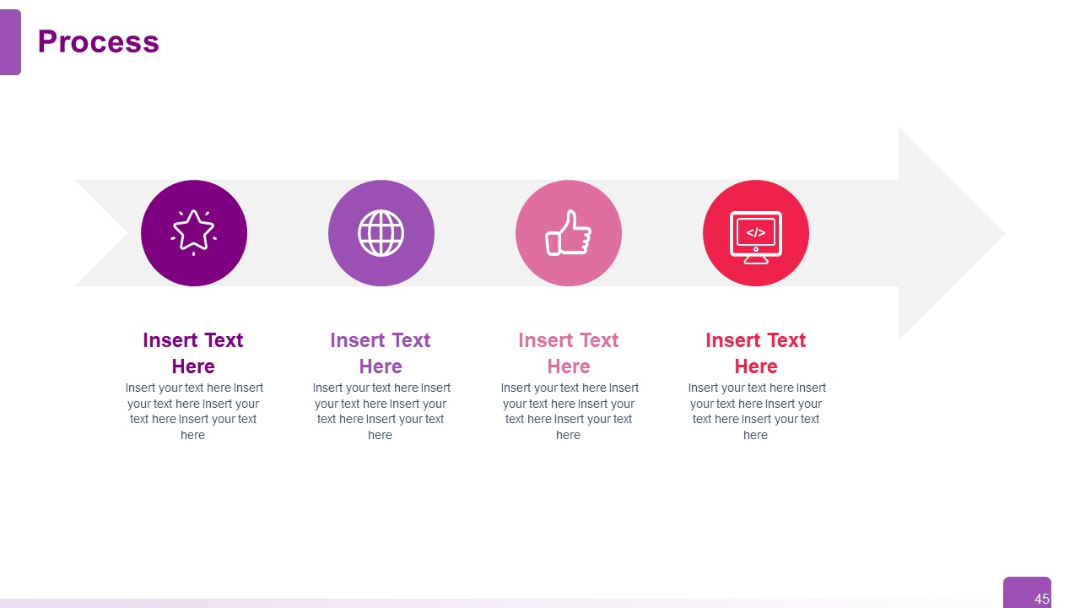
Horizontal arrow with 4 circular icons placed along the path. Each icon has associated editable text below it. Light background and linear flow.
PRO
Grid layout with vertical bars inside a matrix, each bar labeled with a number; headers are labeled “Title.”

PRO
A clustered vertical bar chart with three data series displayed in different colors across four categories.

PRO
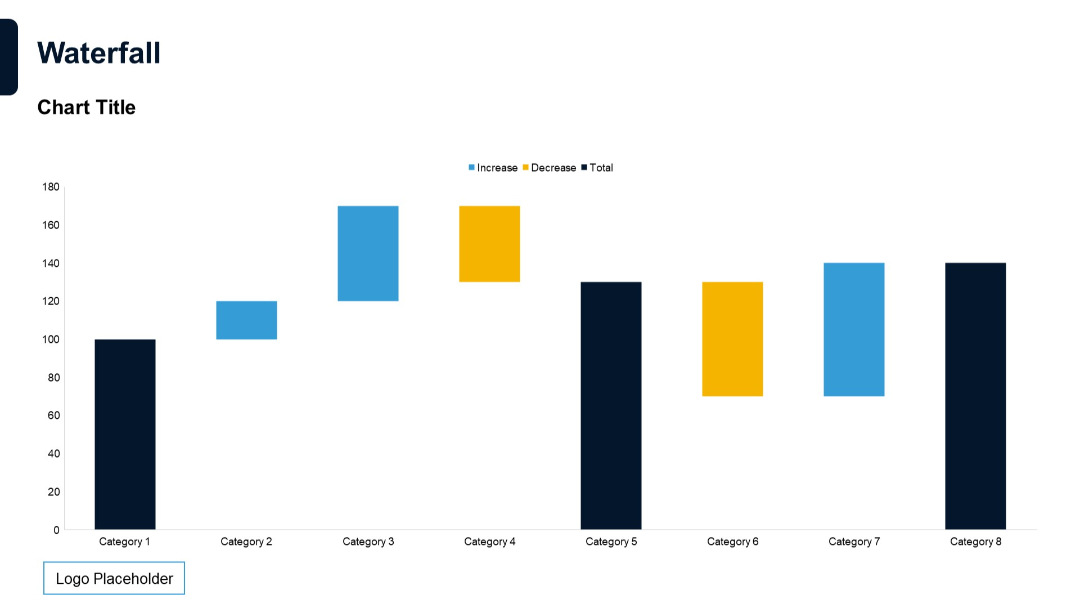
Classic waterfall chart with categories on x-axis and colored bars representing increase, decrease, and total values.
PRO
A minimalist section divider slide with dark background, white text, and a single horizontal line with a circular end point.

PRO
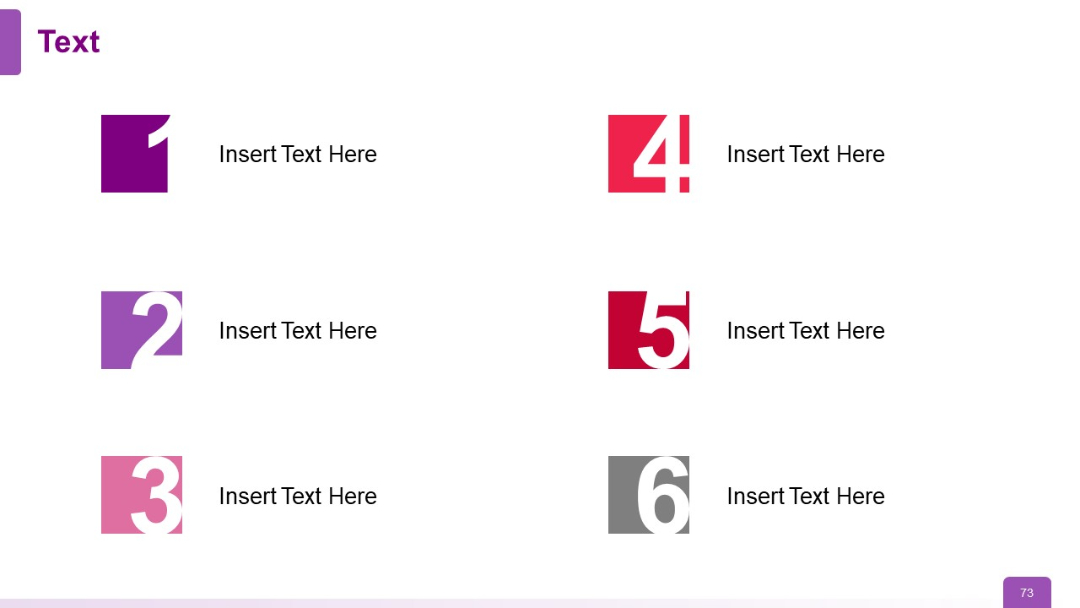
Two-column layout with six numbered square icons (1–6) paired with text, arranged in three rows. Bold colors differentiate each pair.
PRO
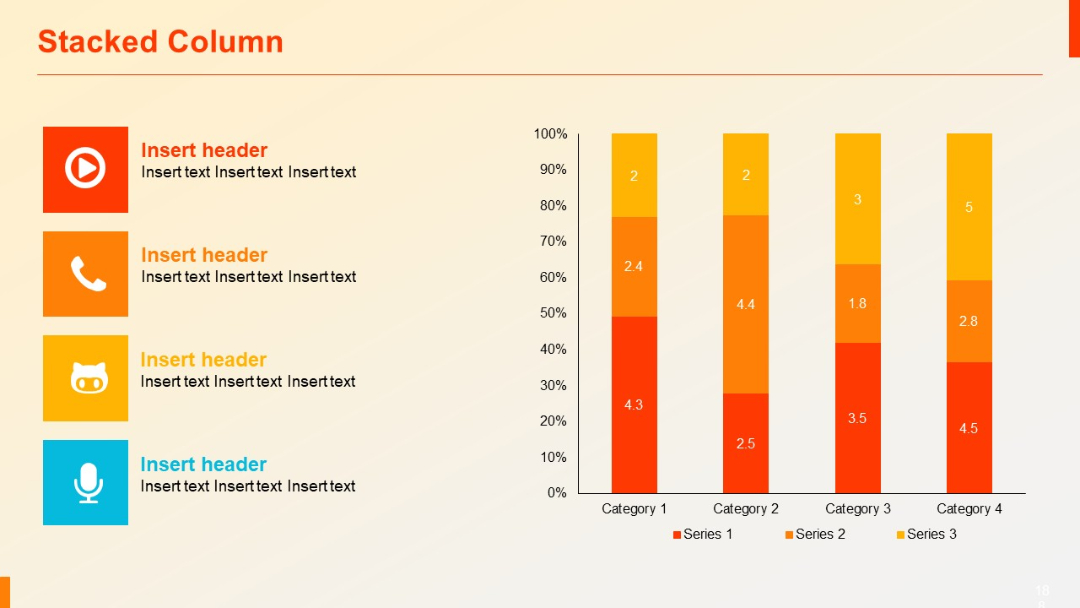
Split layout: Left section with icon-labeled text boxes, right section with stacked vertical column chart segmented into three data series.
PRO
Grid-based Gantt chart with horizontal bars and milestone numbers. Text placeholders used throughout.

PRO
A minimal tree diagram with two circular nodes (icons: lightbulb, computer monitor) extending from two branches; clean white background with purple accents.

PRO
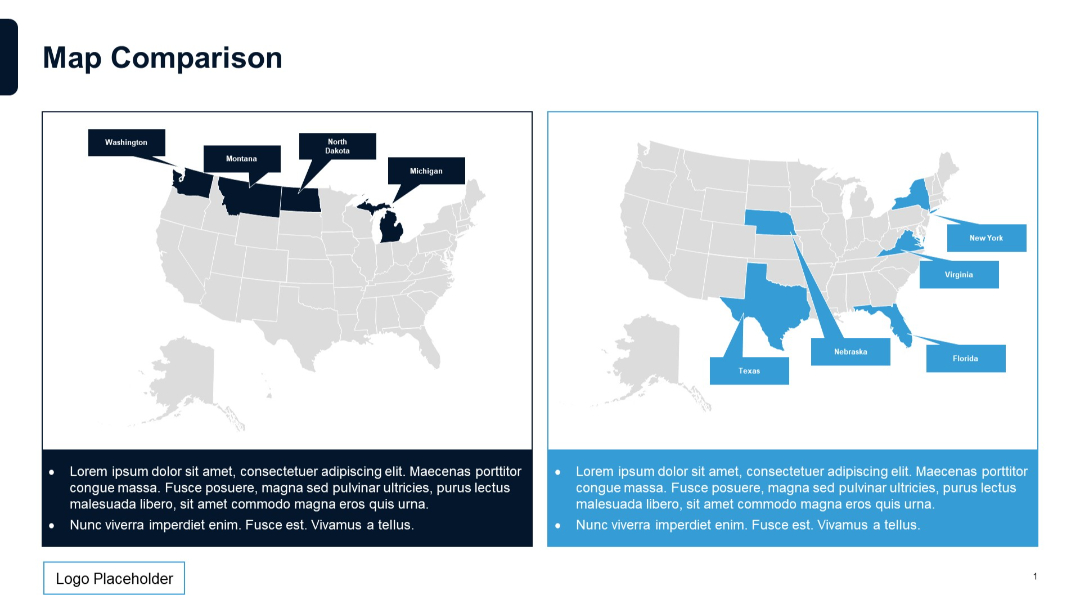
Side-by-side U.S. maps highlighting different states in blue and dark blue, with bullet text below each map.
PRO
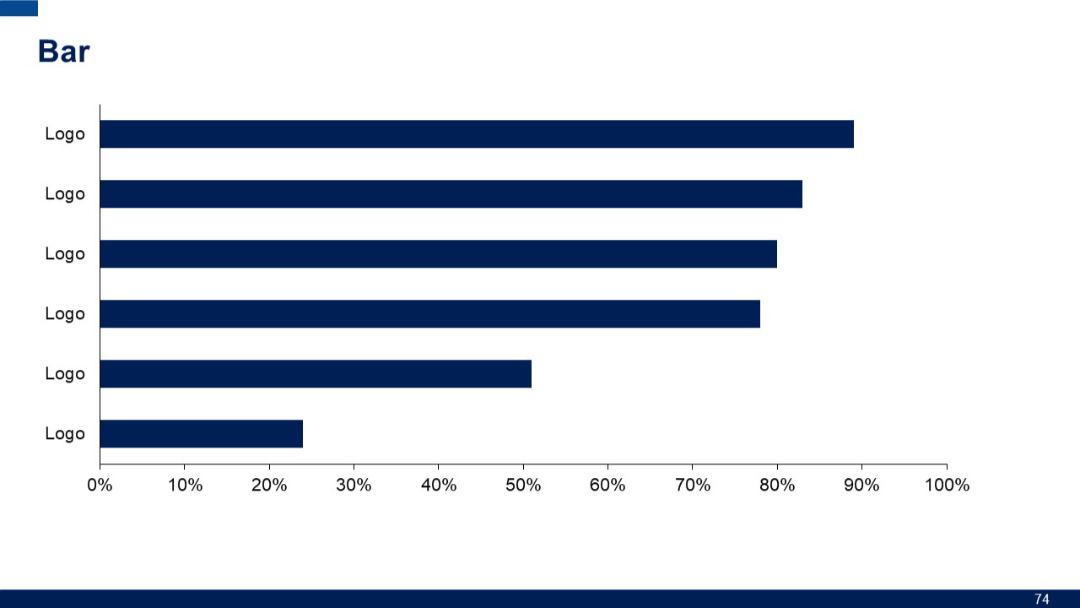
Horizontal bar chart with six uniform bars labeled “Logo.” Minimal text and evenly spaced layout.
PRO
Dark blue background with large white heading on the left. Single white horizontal line with a white circle terminal. Logo and pagination visible.