PRO
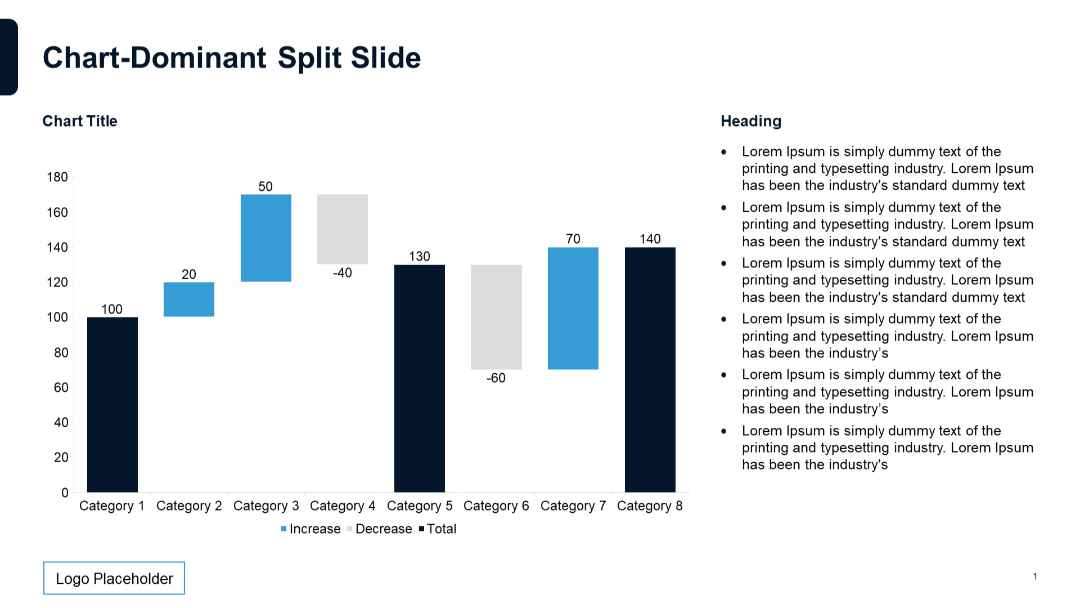
Waterfall chart with labels; bars colored by increase/decrease/total; text list to the right.
PRO
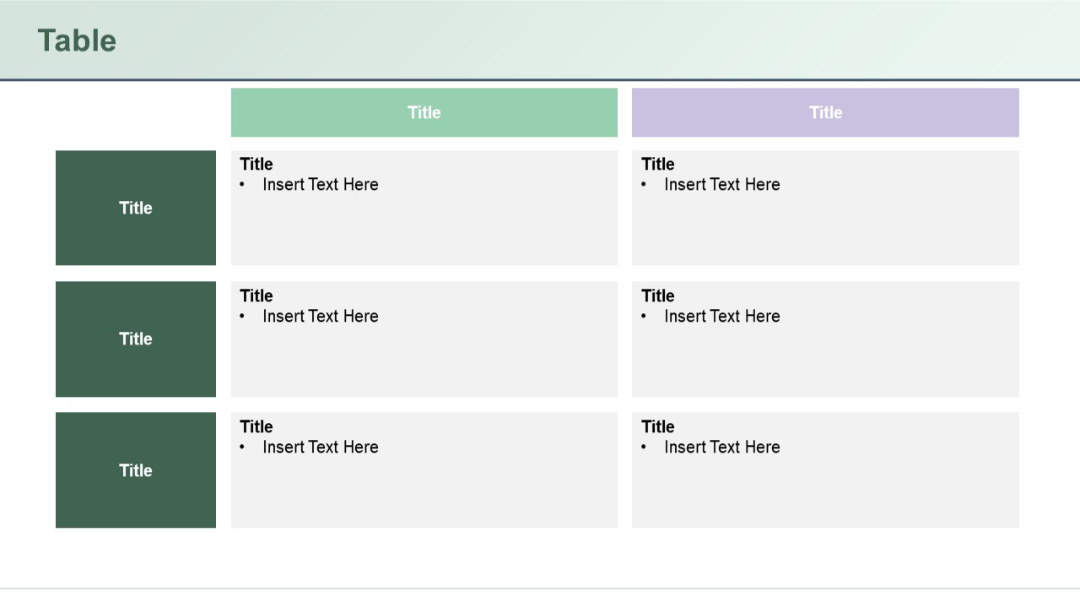
Three-row, three-column table; alternating soft green and purple headers; bullet points and placeholder boxes. Sidebar column in dark green.
PRO
Split into two main sections: left with text and right with a horizontal bar chart using three shades of blue. Clean white background and structured layout.

PRO
Simple white slide with title text at top and bulleted list with multiple levels of indentation. Footer includes “Source” and page number.
PRO
Vertical checklist with colored icons and check marks at the right end of each line.
PRO
Four rectangular content blocks with numbered sidebars (01–04) in two rows, alternating colors.
PRO
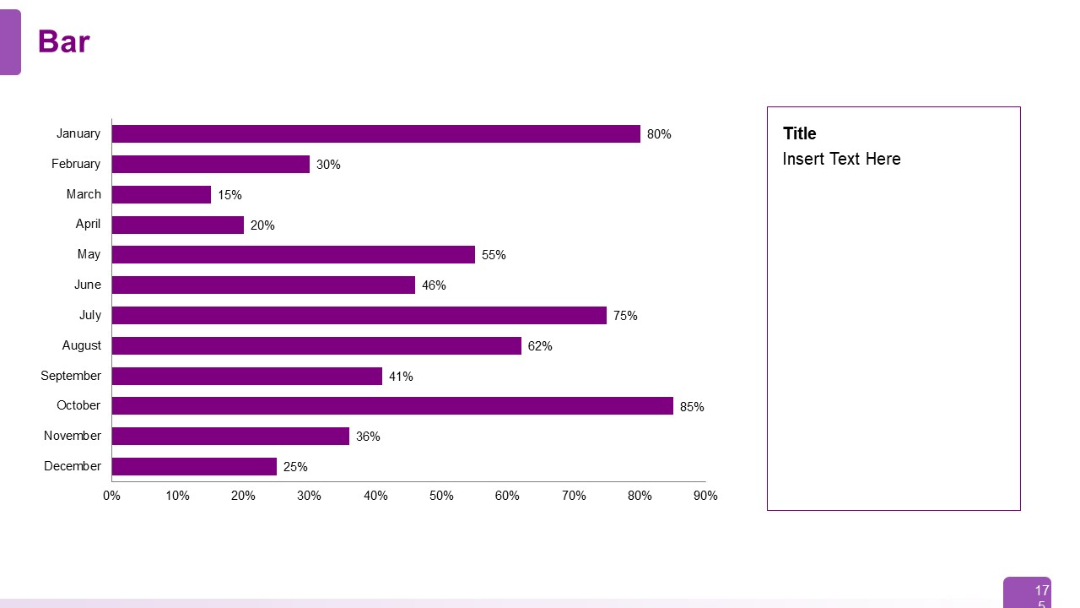
Horizontal bar chart showing monthly data from January to December. Text box area on the right for insights. Bars are labeled with percentage values.
PRO
Vertical chevrons along the left margin with corresponding text on the right.
PRO
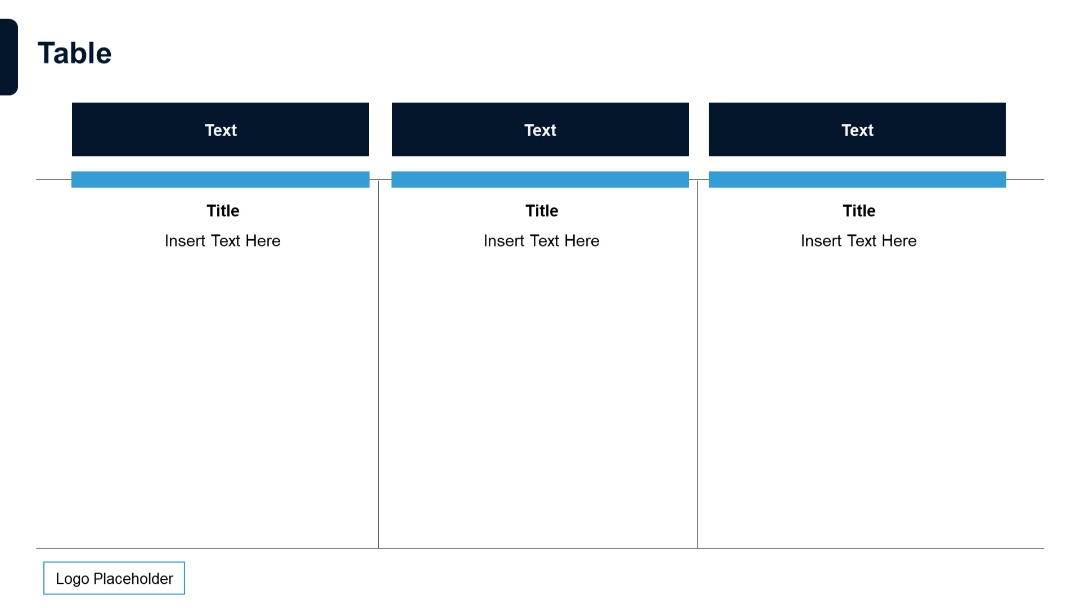
Three-column table format. Bold dark headers with horizontal highlights. Simple design for showcasing three entities or features.
PRO
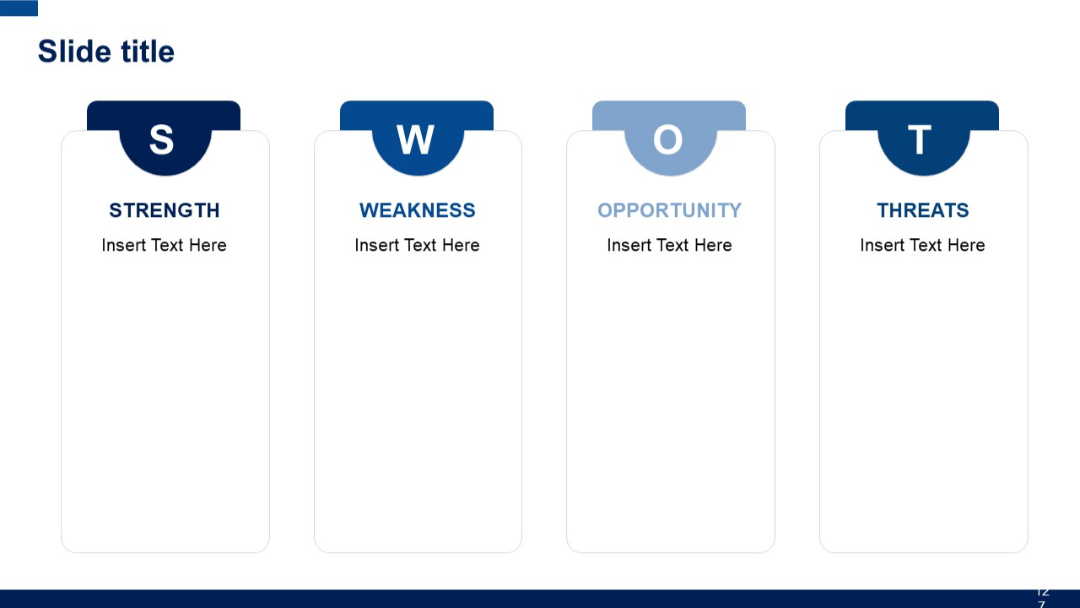
Vertical pill-shaped boxes labeled S, W, O, T at the top, each with a corresponding full-width section beneath for textual content.
PRO
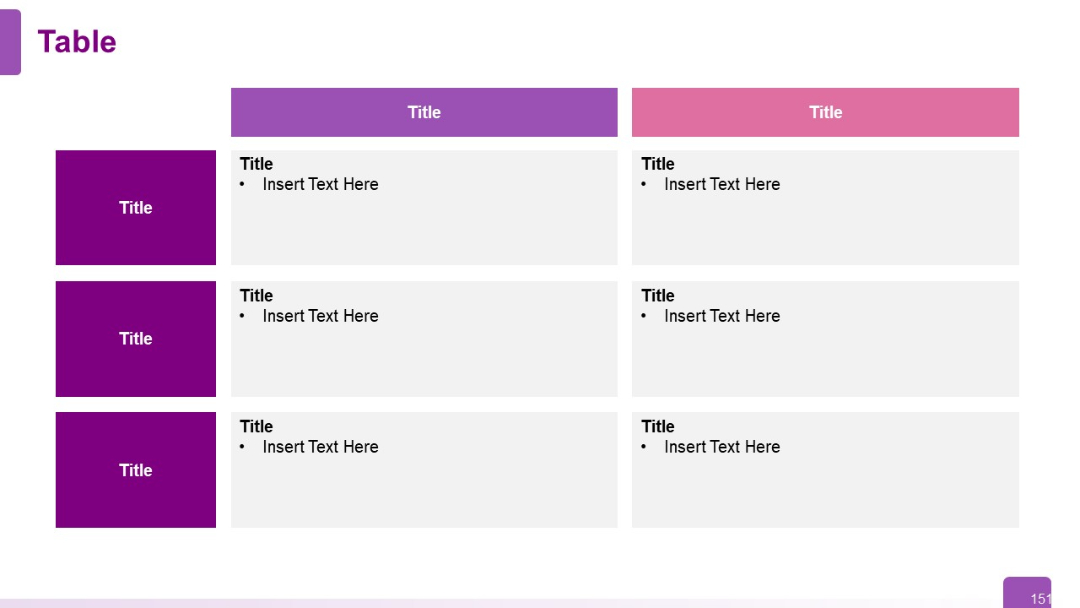
3x3 grid matrix with colored headers and side labels; each cell includes placeholder bullet text. Uses purple and pink shades for styling.
PRO
Three horizontal puzzle-piece styled blocks forming rows, each with a short paragraph on both ends and a central icon. Colors alternate by row.

PRO
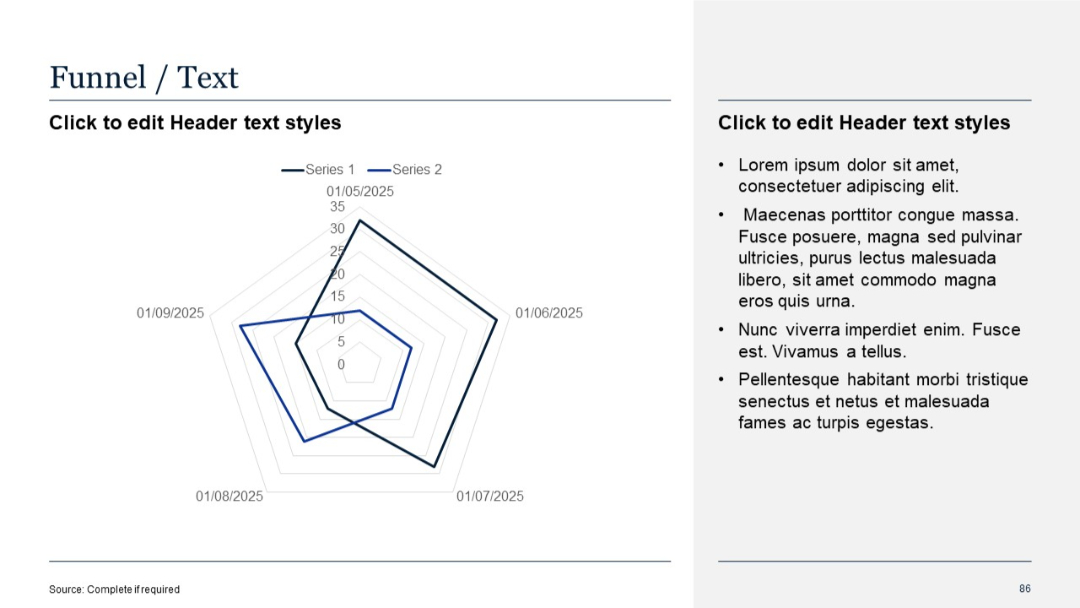
Radar (spider) chart styled as a funnel; text explanations on the right
PRO
Matrix layout with icons on left and corresponding content in two adjacent boxes
PRO
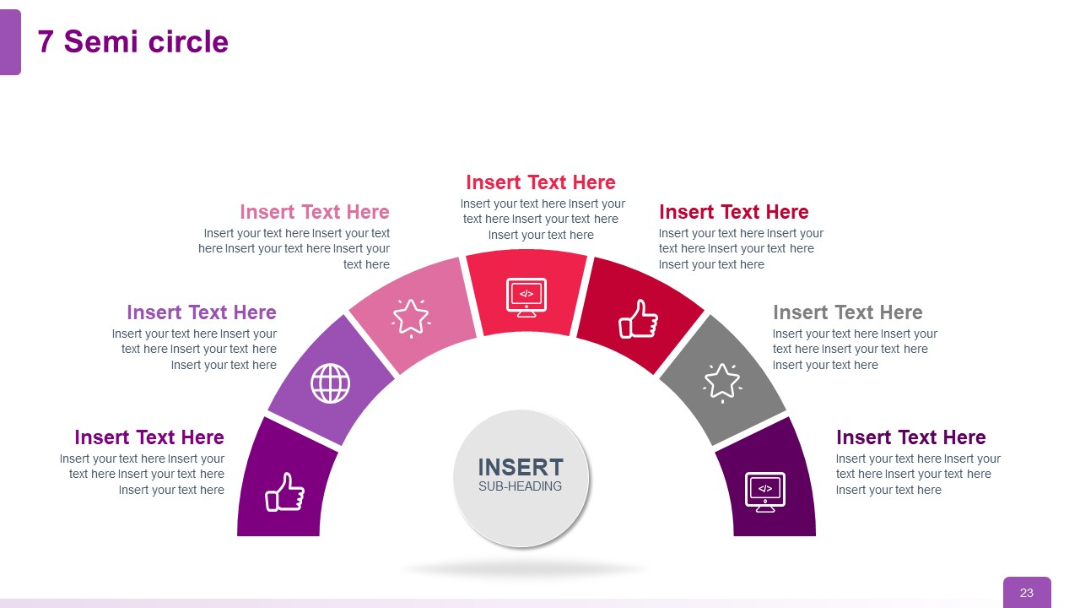
Four-segment semi-circle chart with a central sub-heading and evenly distributed arc segments; icons: star, thumbs up, globe, computer.
PRO
Visual builds to seven total circles, maintaining same lightbulb layout with left-side bullet list.
PRO
Full-width line chart showing three lines over 8 quarters (Q1 2020 to Q4 2021). Minimalist style with labels and title.

PRO
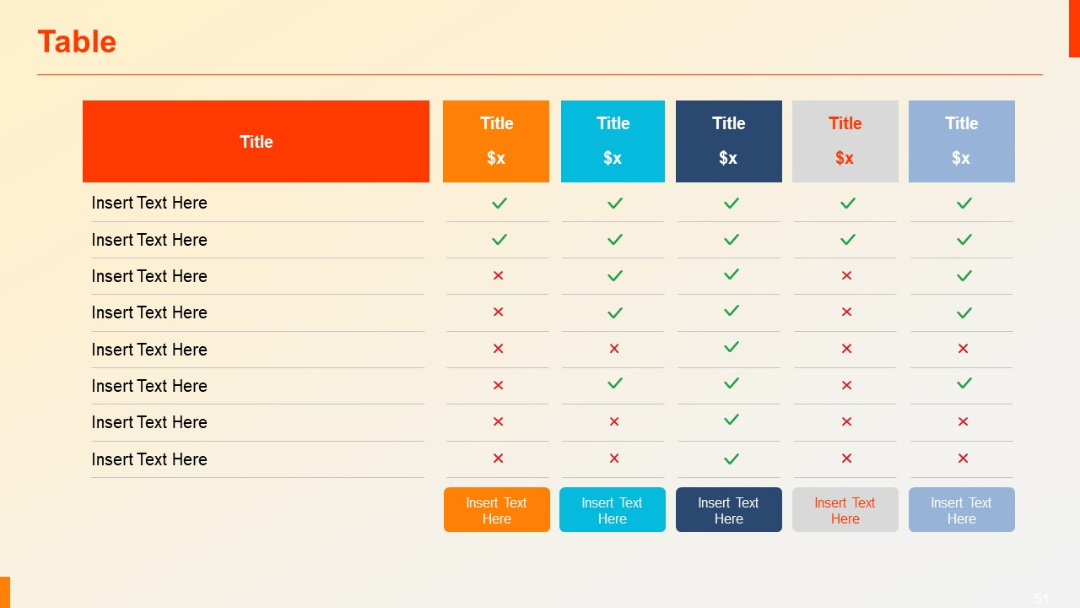
A 7-column comparison matrix using colorful headers (orange, blue, gray), check marks, and crosses. Includes a bottom row of colored buttons for CTA/input options.
PRO
Left-aligned semi-circle with the title, and three checklist items each marked with a check icon and connected by a line. Monochrome with navy accents.
PRO
2x3 grid layout of round photo placeholders for team members with space below for titles. Minimalistic and symmetrical layout.
PRO
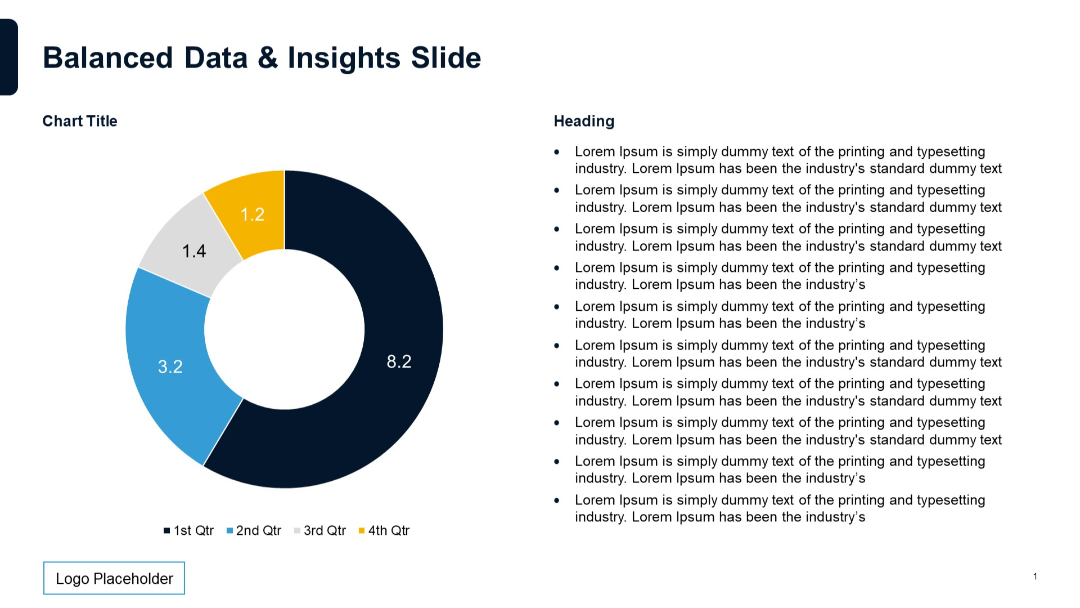
Doughnut chart visualizing four quarterly segments with numerical values. Right side features placeholder bullets.
PRO
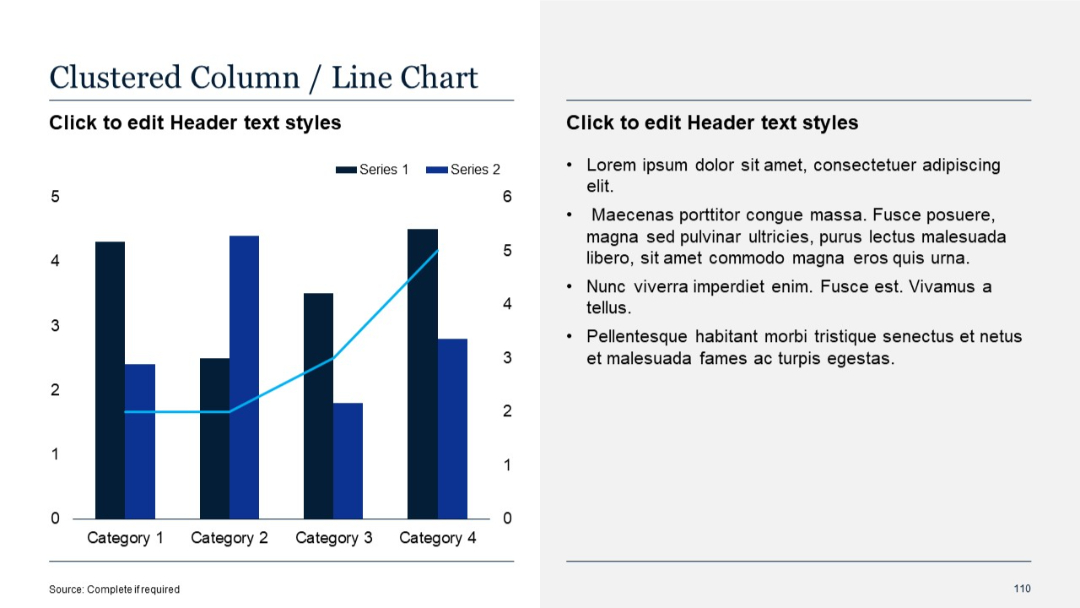
Combo chart (bar and line) on left; bullet point text on right.
PRO
White background grid layout filled with outlined vector icons in multiple rows, clean and minimalist with black thin-line icons.
PRO
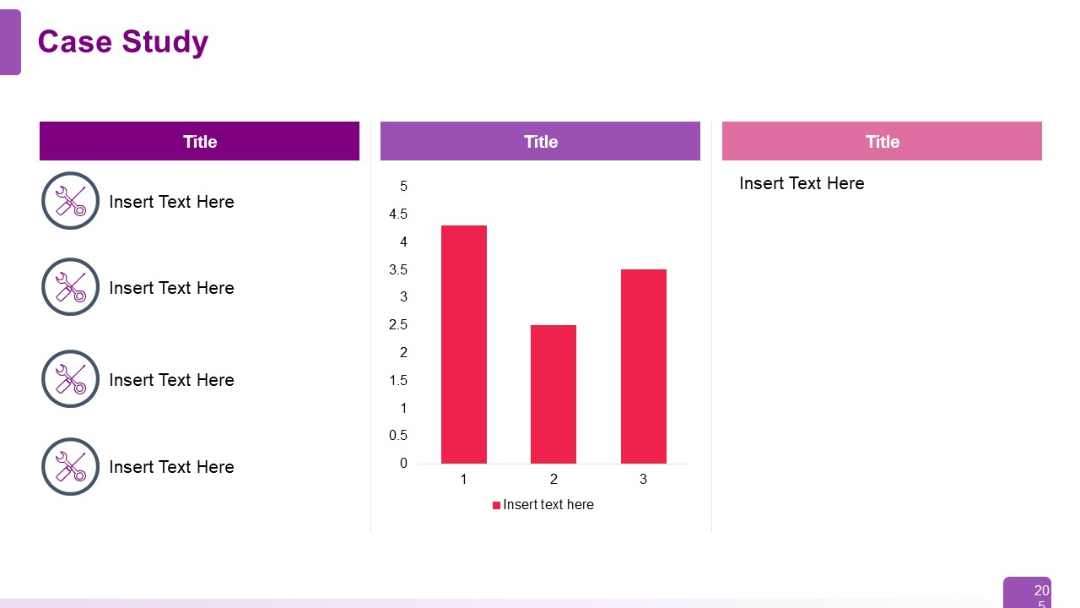
Divided into three vertical columns: left with icons and bullet points, center with a vertical bar chart, right with a title and placeholder text.
PRO
Another white-background icon set featuring education, communication, achievement, and organization themes. 5x6 layout of clean purple-outline graphics.

PRO
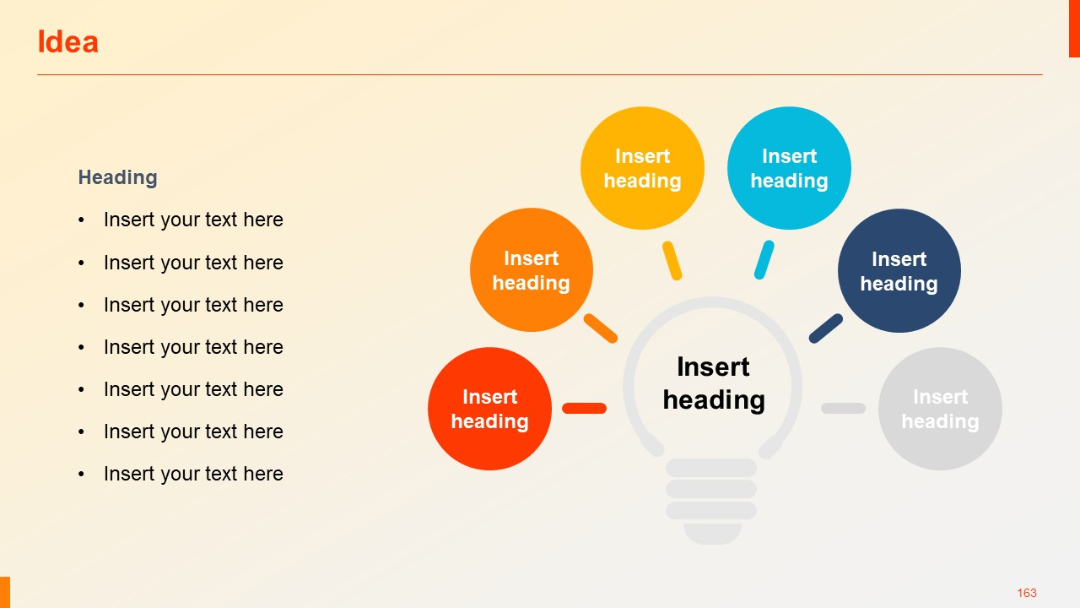
Same layout as 162, now featuring six circles including a faded grey one, suggesting future or optional ideas.
PRO
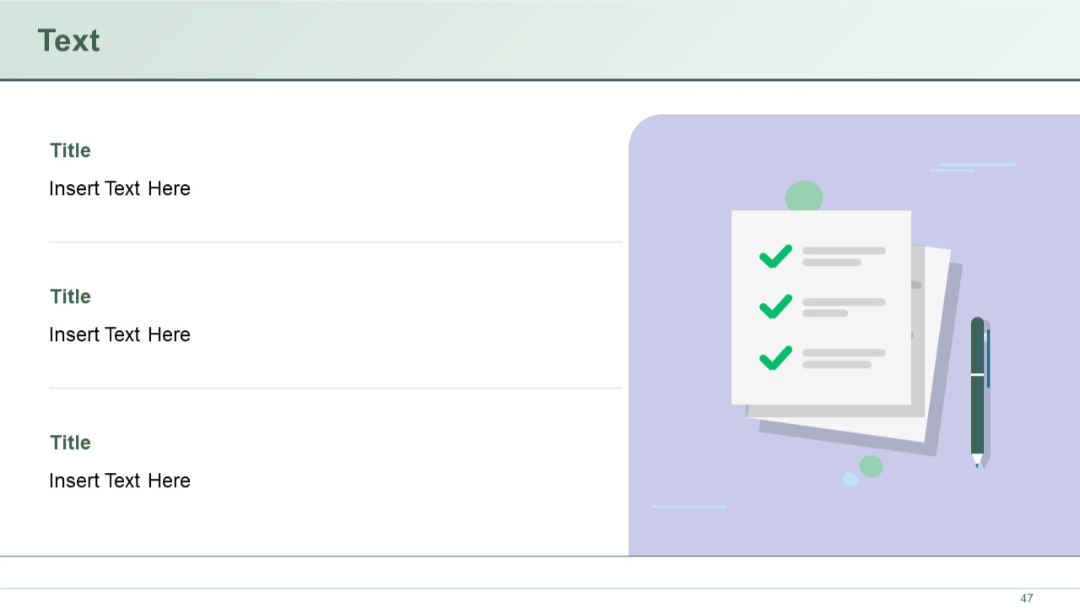
Two-column layout: left side has title and text in three stacked segments; right has illustration of checklist and pen.
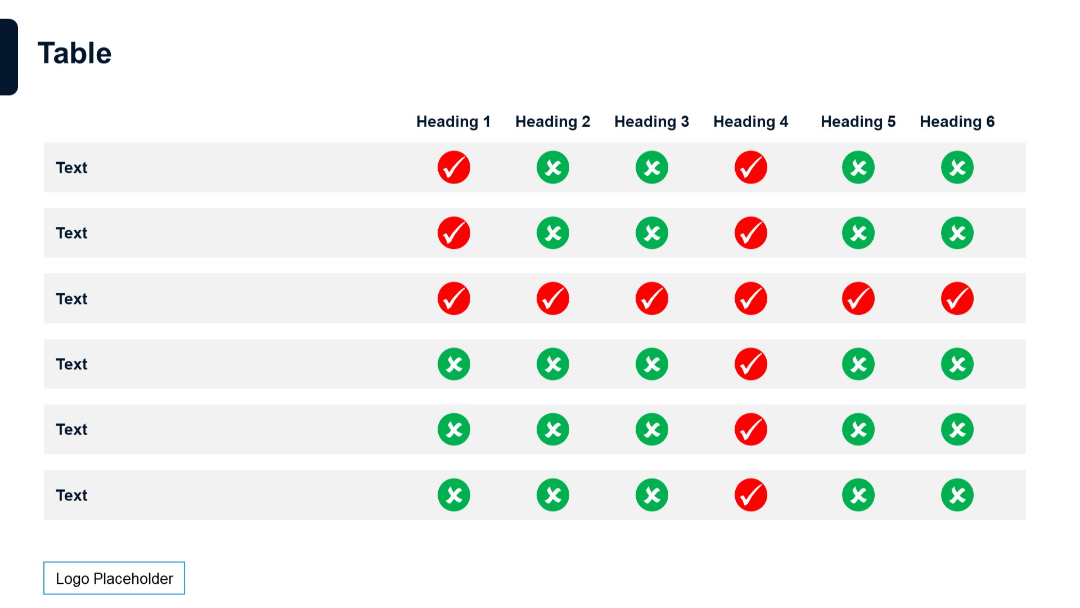
PRO
Multi-column checklist-style table with colored check/cross icons across rows and six headers. Grey alternating row fills for clarity.
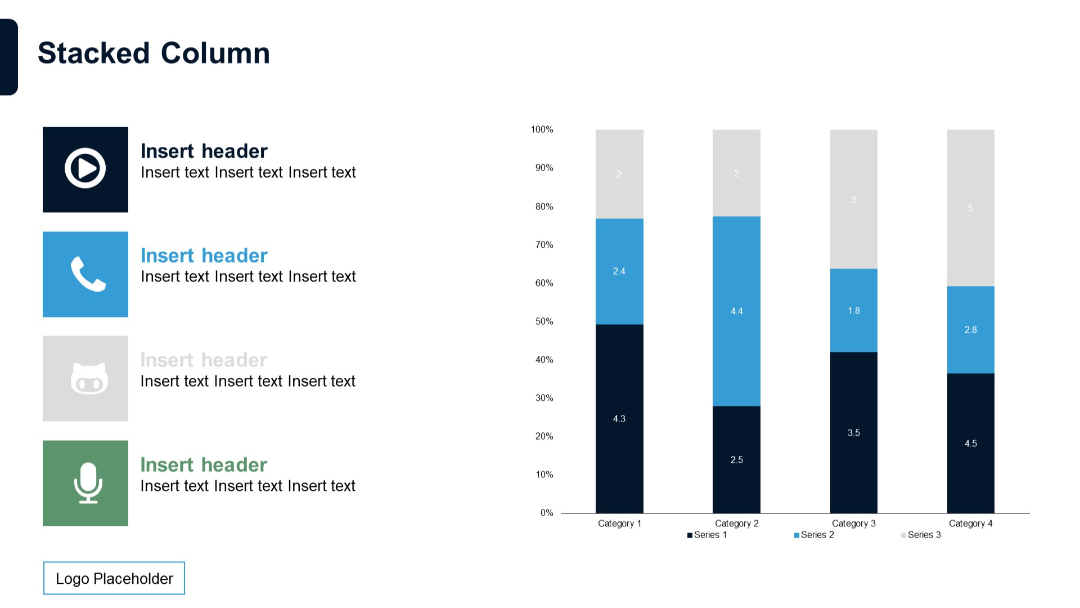
PRO
Left-aligned icons with text headers and a 100% stacked column chart on the right. Clean layout with color-coded data bars.
PRO
A vibrant semi-circle segmented into 7 parts, each with icons and placeholder texts. Segments span purple to grey.