PRO
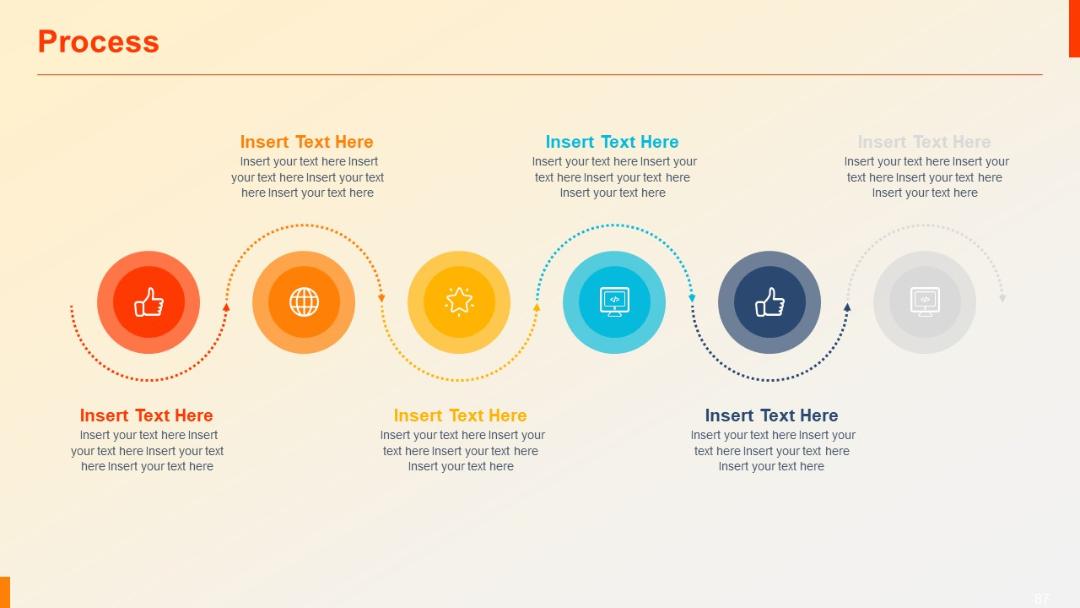
Dotted-line path connecting six circular icons in gradient shades. Balanced visual flow suggesting a journey or roadmap.
PRO
Combination of an area chart (left) and two donut charts (right), labeled 2023 and 2024 respectively, with percentage values and descriptive text boxes below.

PRO
Three-column layout with evenly spaced text blocks titled "Subtitle", all with placeholder text underneath.
PRO
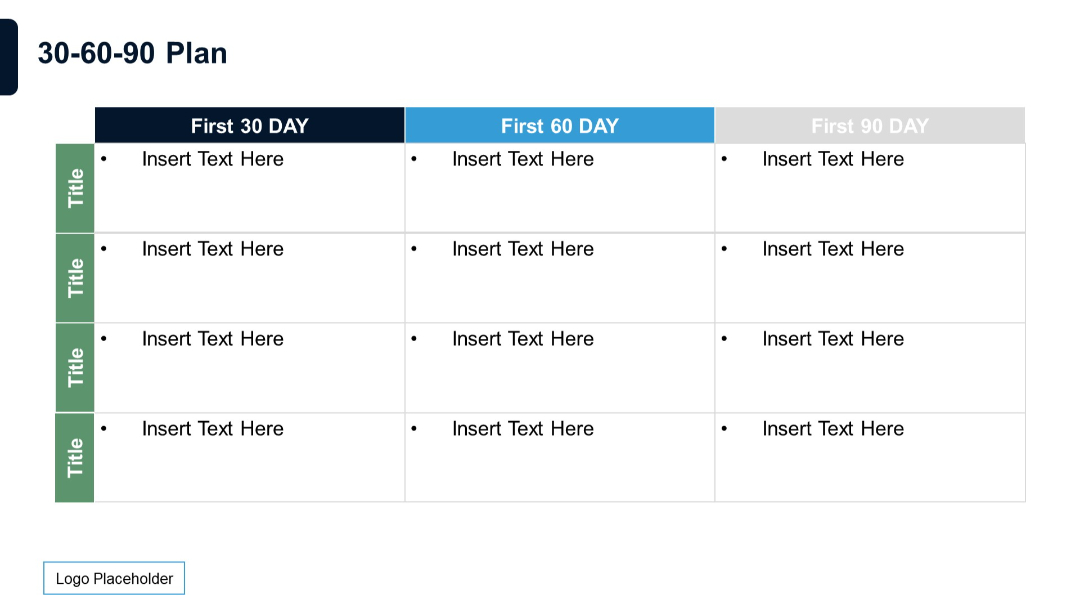
Table format with row titles and column headers labeled for each 30-60-90 day phase, featuring bullet points.
PRO
Linear process flow using six vertical columns with arrows pointing right. Each block contains title and placeholder text.
PRO
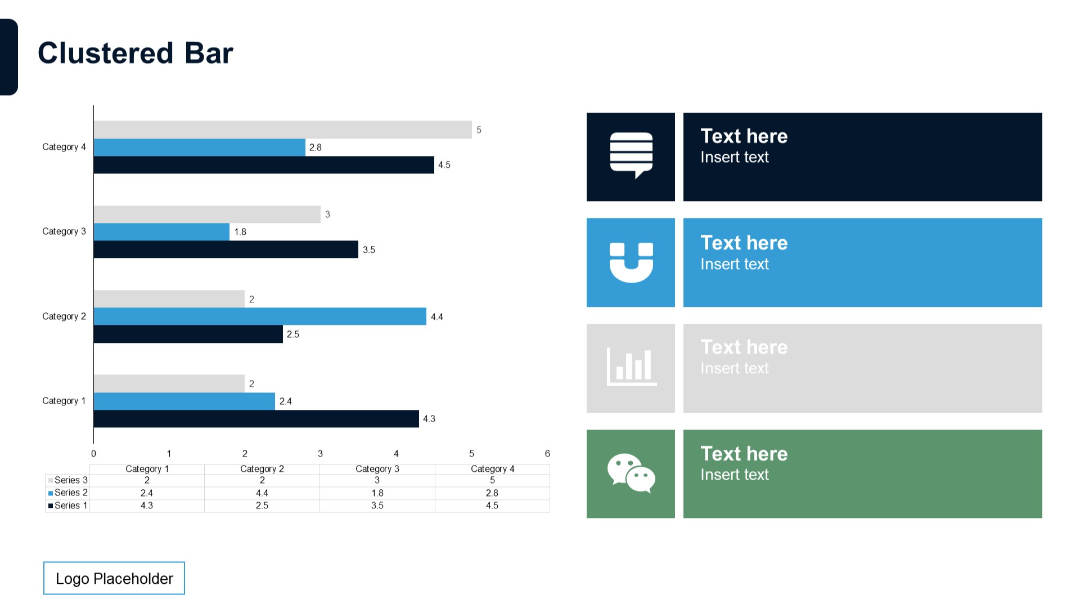
Clustered bar chart on the left comparing three data series across four categories. Right side features colored text boxes with icons and labels.
PRO
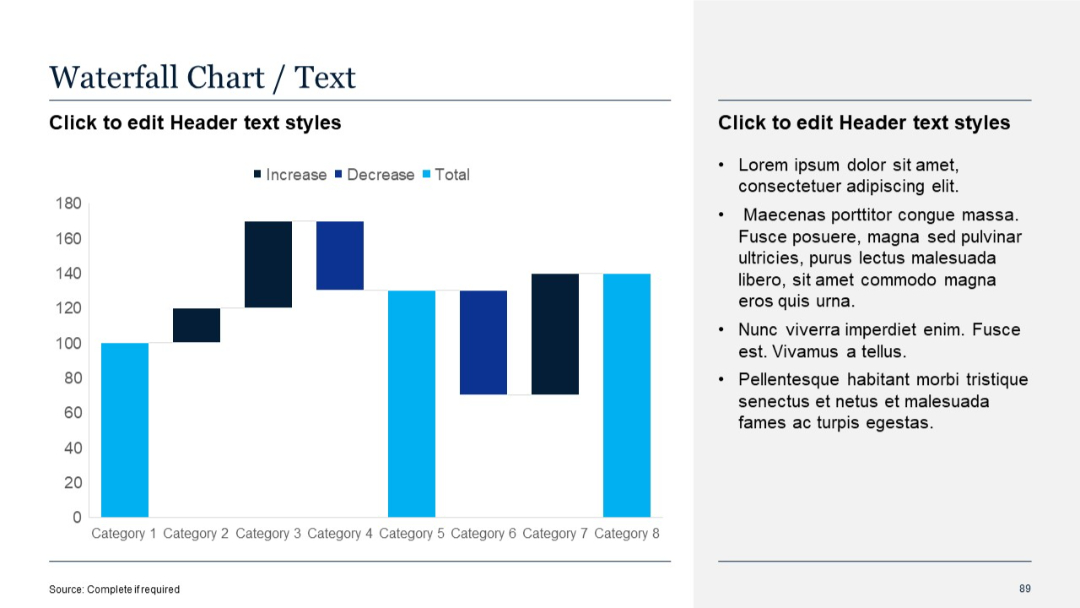
Vertical waterfall chart showing increases/decreases; category labels on X-axis
PRO
Grid-based quote layout with four separate bordered boxes and open quotation marks.
PRO
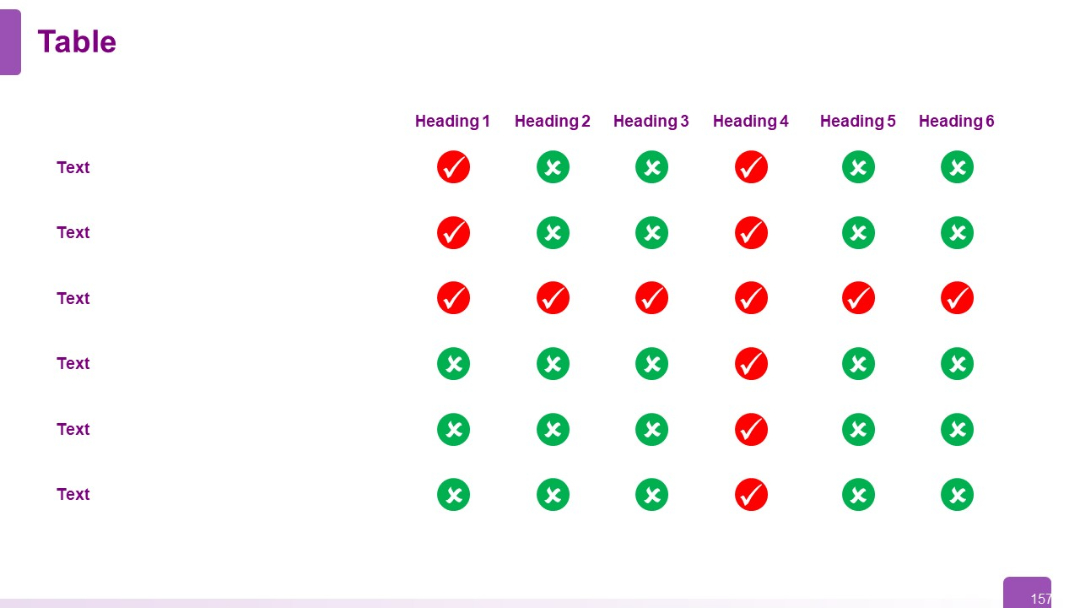
Matrix-style layout with row labels and six columns. Contains red and green check/cross symbols indicating status or presence.
PRO
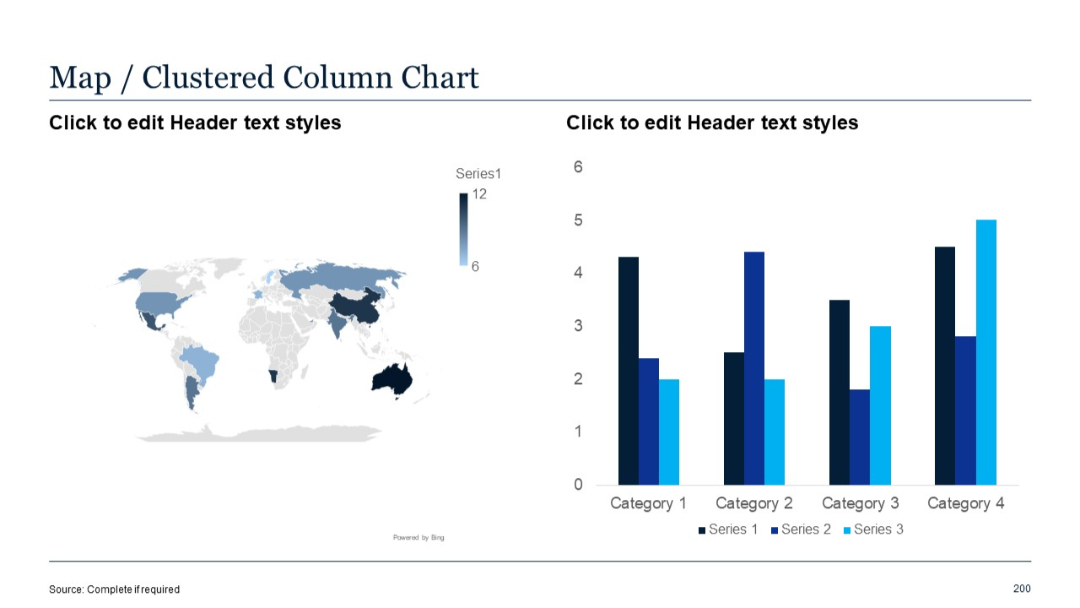
Left: world map heatmap; Right: clustered column chart comparing three series across four categories.
PRO
Dark background dashboard design with modular panels; mix of text, metrics, icons, and images; structured into impact areas.

PRO
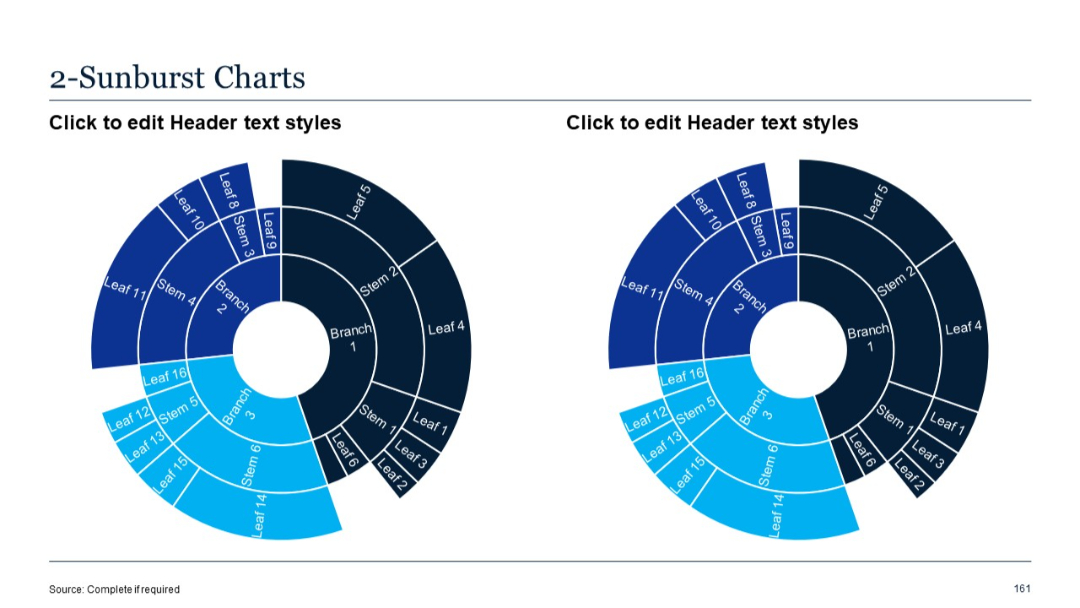
Two side-by-side sunburst charts with multilevel concentric rings representing hierarchical data structure.
PRO
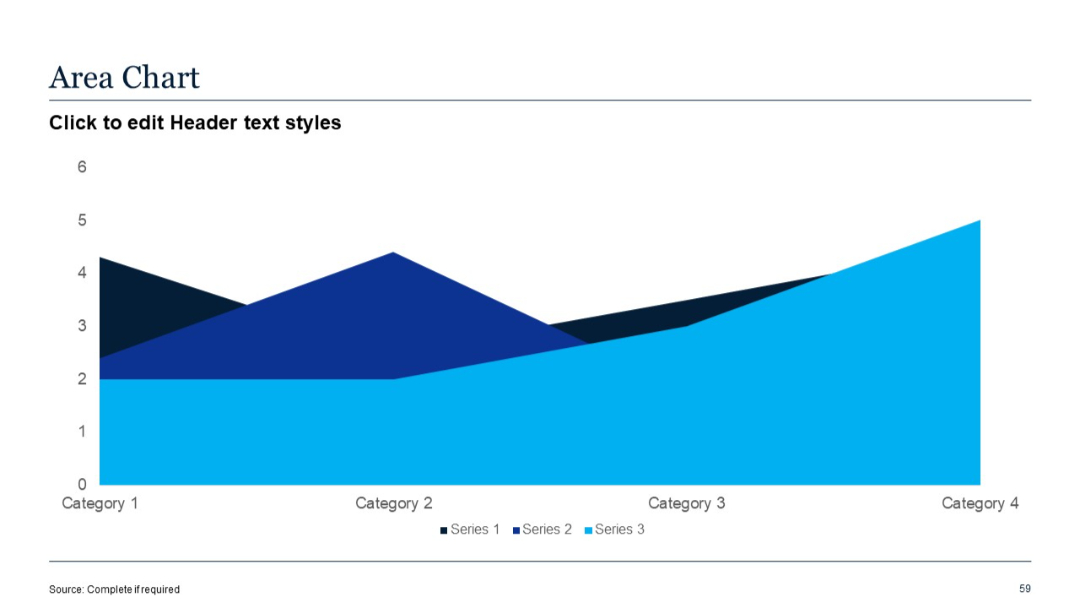
Layered area chart with three data series; smooth curves; partially overlapping colors.
PRO
Balanced scale illustration with plus and minus signs; circular text bubbles positioned accordingly.

PRO
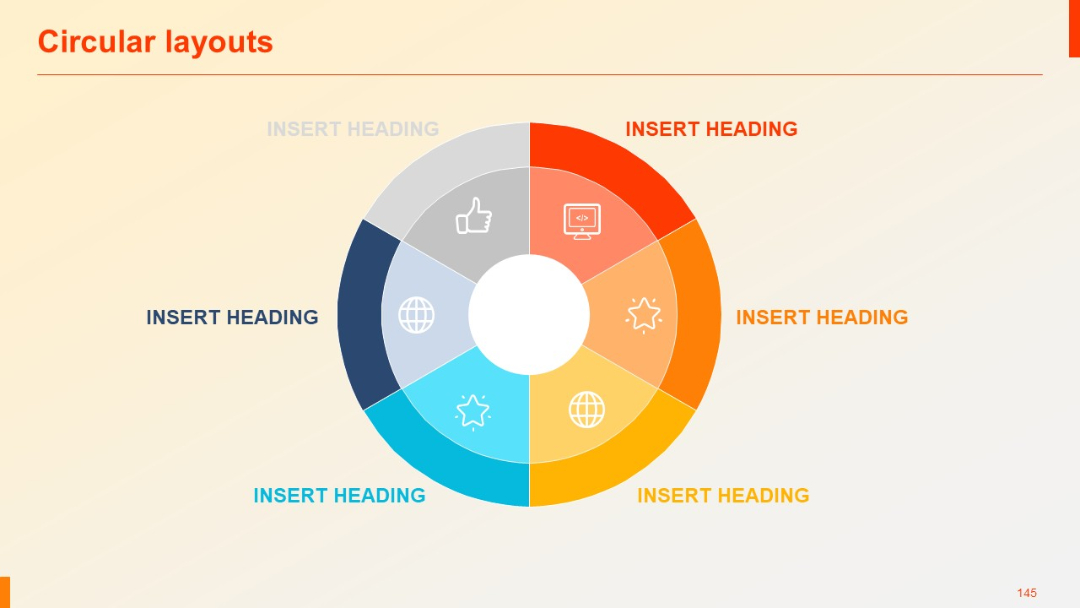
Six-segment concentric ring diagram, colorful layout with icon representation per segment.
PRO
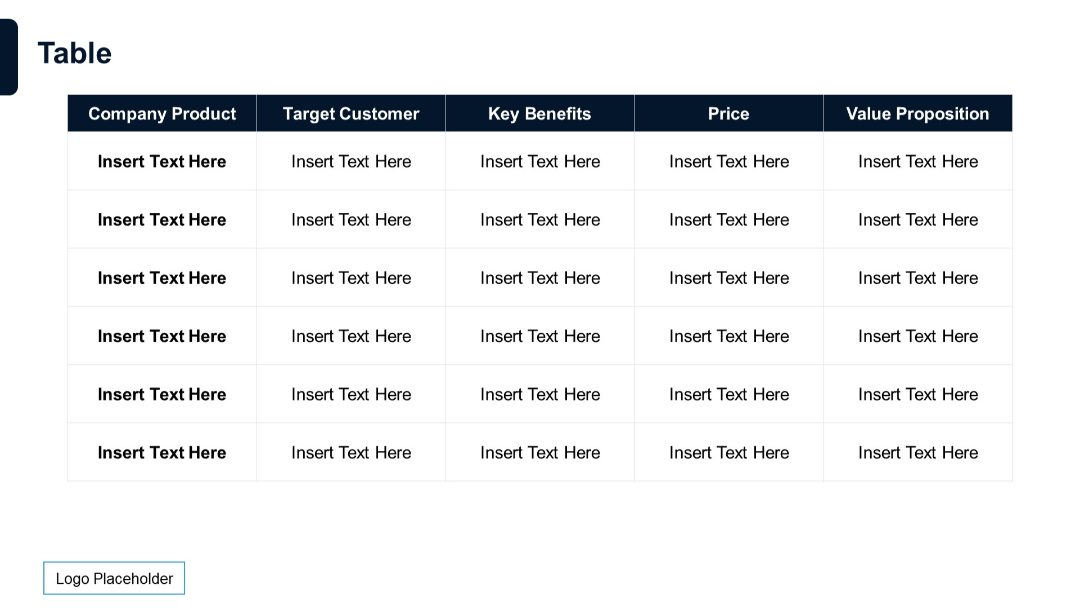
Six-row table format; consistent with previous product comparison layouts; uniform green-topped column headers.
PRO
Left: map; Right: 100% stacked column chart, standard layout with percentage-based breakdowns across categories.

PRO
Two-column layout with large, colored numeric boxes and text, evenly distributed (1–6).
PRO
Agenda list in two-column format with agenda items numbered 01 to 10. Blue vertical line beside each number. Minimalist, structured layout.

PRO
Vertical timeline layout with four horizontal text segments aligned to circular icons. Soft orange gradient background.

PRO
Simple line chart with three data series, point markers, and labeled data points; neutral white background and light grid.

PRO
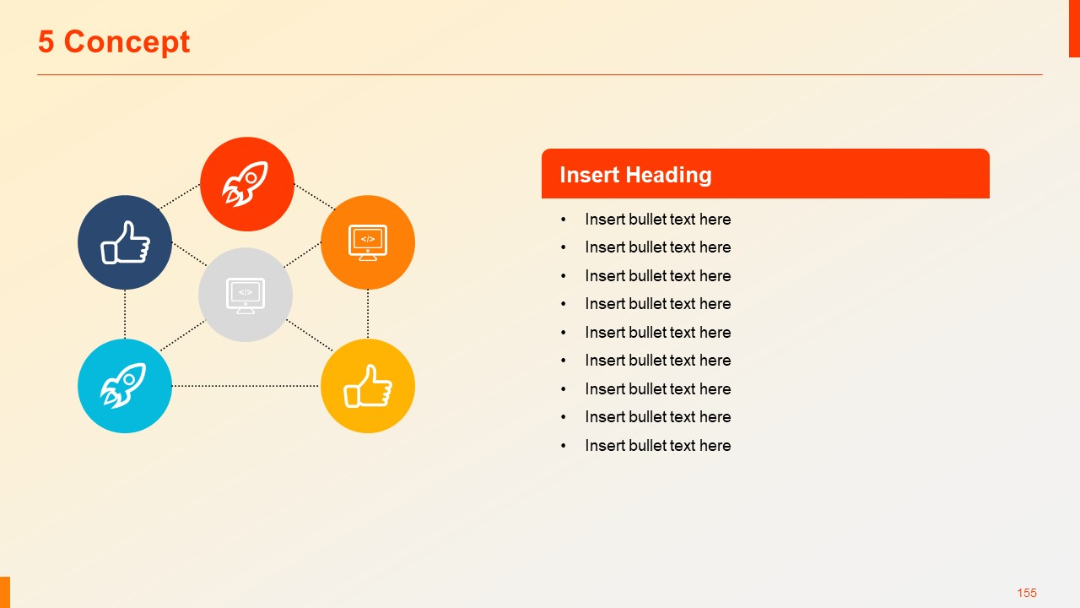
A five-node interconnected circular network using diverse icons (rocket, thumbs up, code); bullet list on the right.
PRO
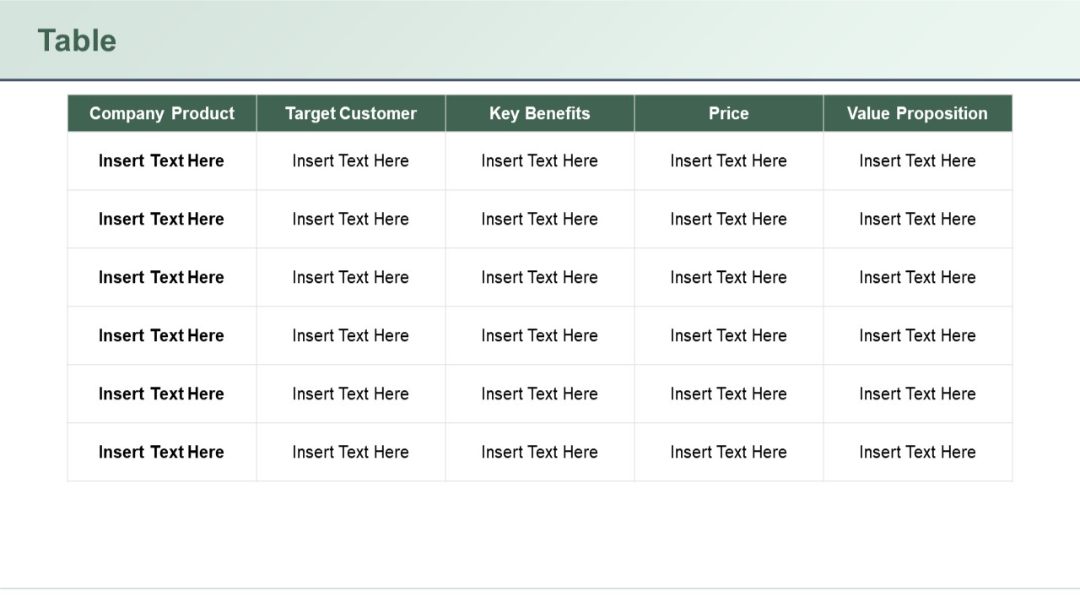
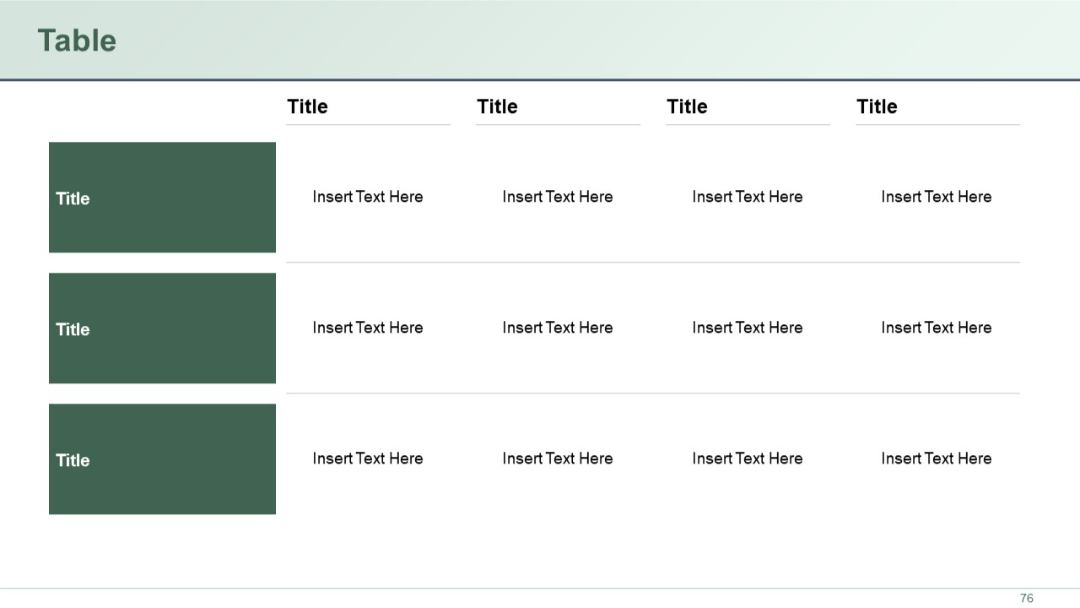
A wide 5-column by 3-row table with large dark green blocks in the first column acting as row headers. Text fields are placeholders.
PRO
Vertical list with colorful diamond-shaped icons (red to blue gradient) beside text items. Clean separation between rows.

PRO
Three vertically-aligned blocks with stylized corners and numbering

PRO
Six-row, five-column table with same format and styling; increased row entries for deeper analysis.
PRO
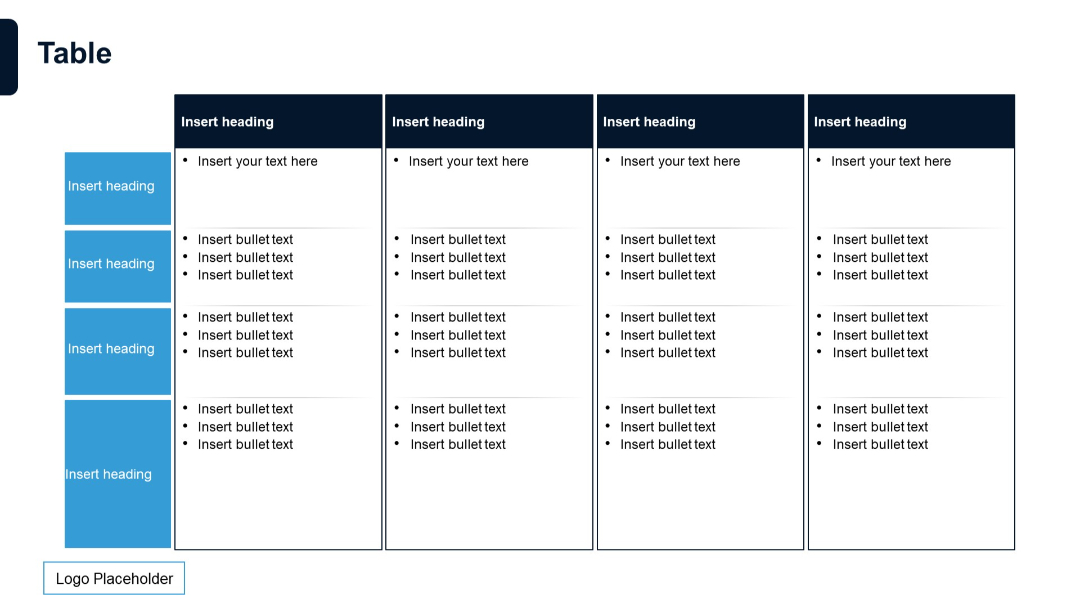
Grid format with five vertical columns and five horizontal sections; each cell contains bullet lists and text blocks.
PRO
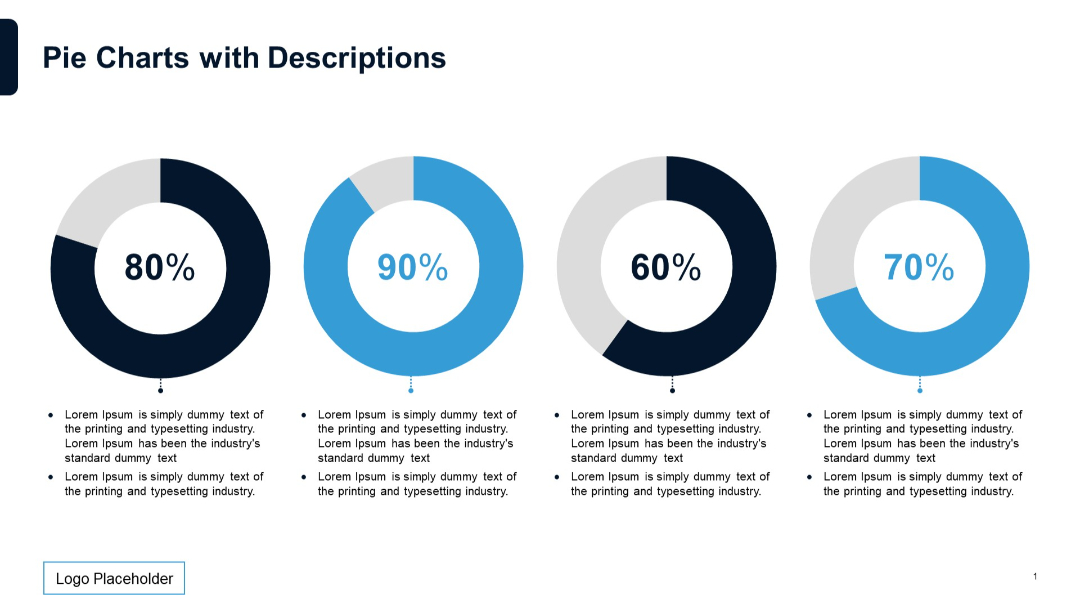
Features four doughnut-style pie charts in a row. Below each is a bullet-point text box explaining the percentage shown in the chart.
PRO
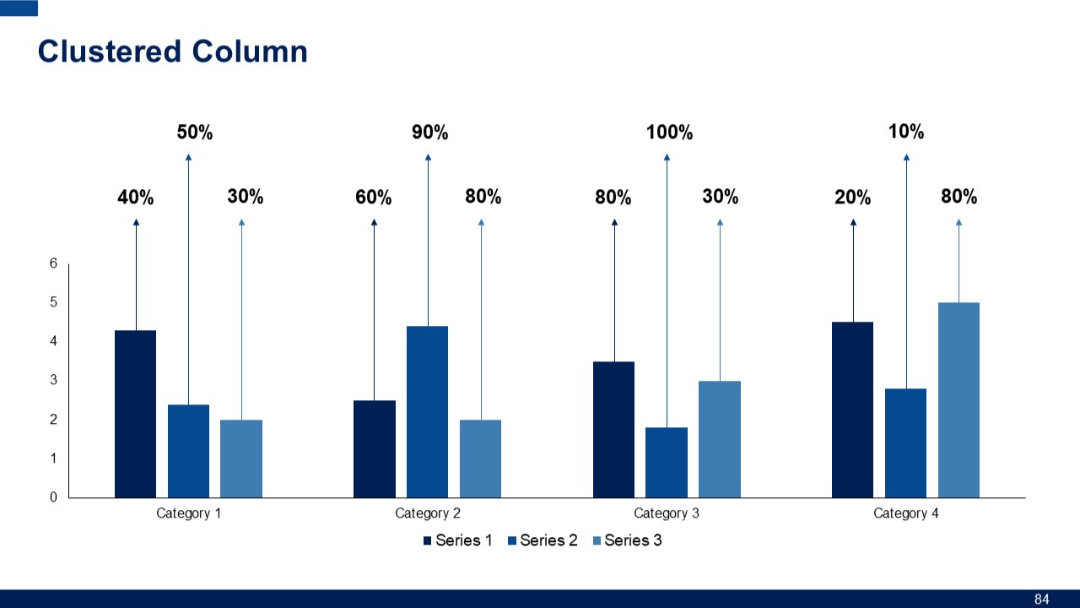
Clustered column chart showing performance of three series across four categories, with percentage values labeled above each bar.
PRO
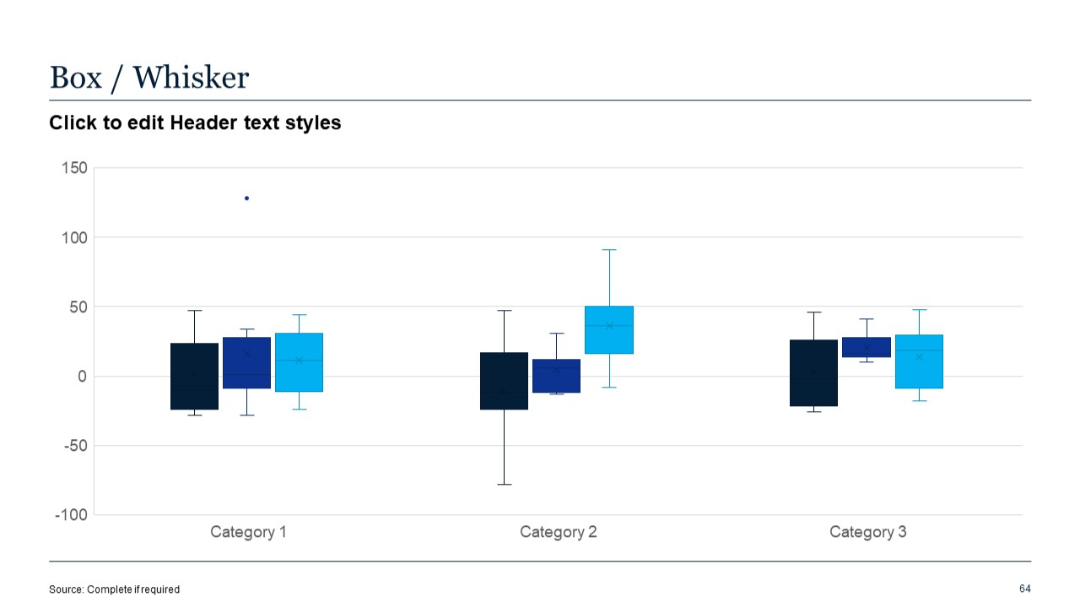
Box-and-whisker plot with three category groups and color-coded series; grid background.