PRO
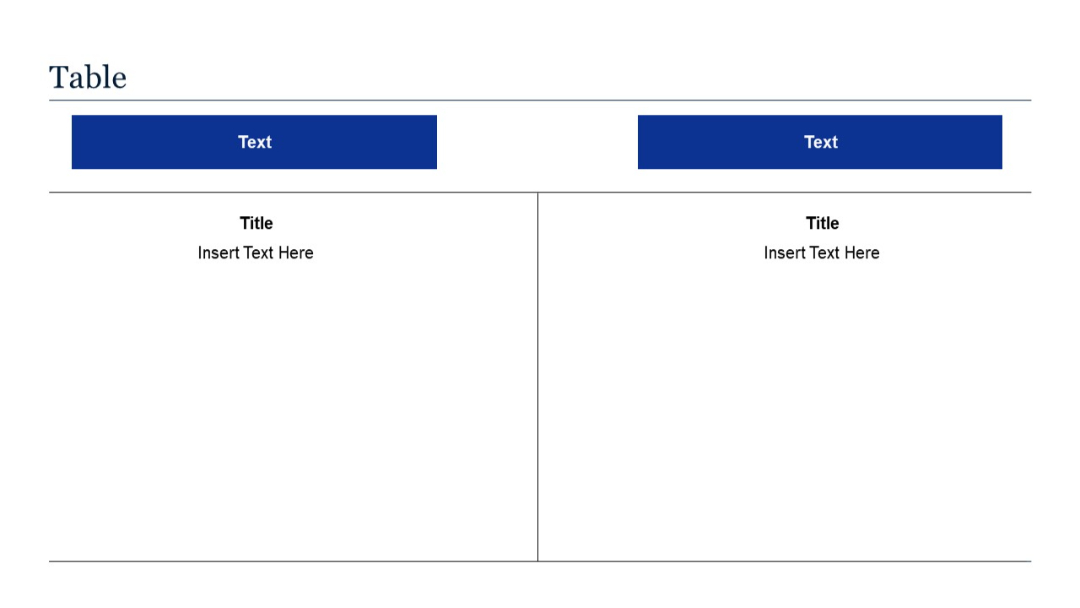
Split vertical layout with two large columns; each side includes a blue header labeled "Text" and corresponding content below with a title placeholder.
PRO
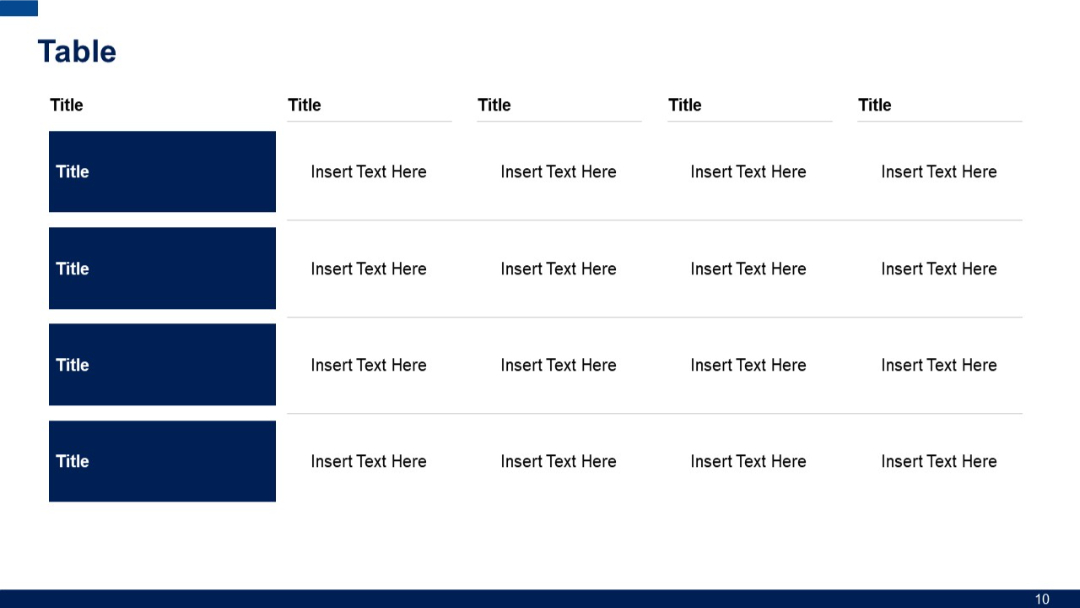
Further extended hybrid layout with four vertical title blocks and matching horizontal data fields; consistent blue-and-white color scheme.
PRO
Simple vertical list with one large circle and five horizontal text entries connected by lines. Minimal color with one blue circle icon.
PRO
Horizontal bar chart with monthly data (January–December) on the left; right side contains placeholder for title and description.

PRO
Icon grid focusing on clocks, time, and scheduling (e.g., watches, timers, calendars) in red outline style.

PRO
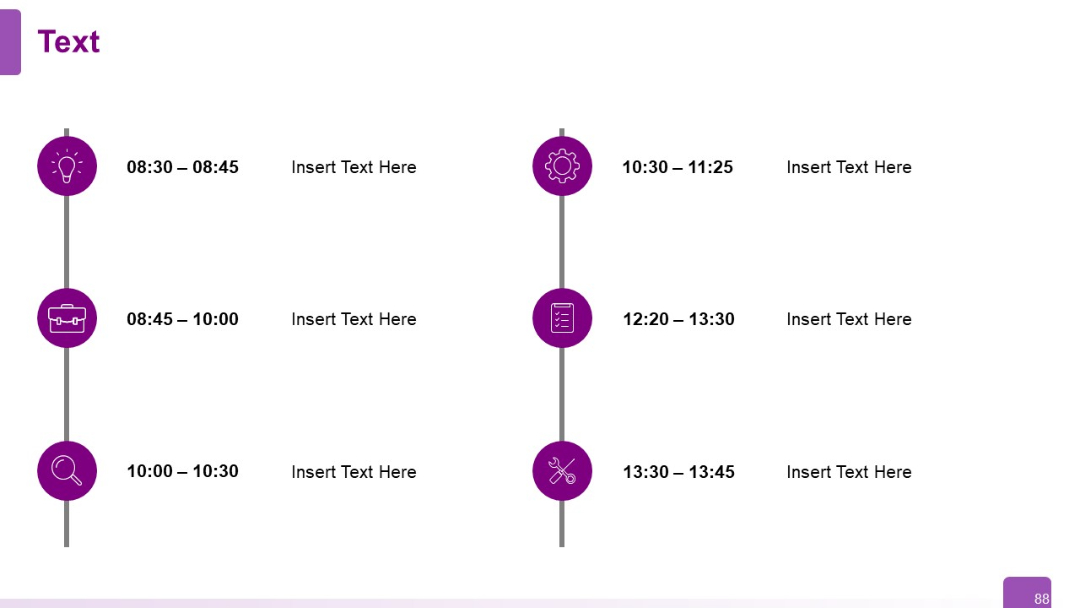
Vertical timeline with large circular icons and matching symbols. Time slots on the left, event descriptions to the right.
PRO
Horizontal bar chart with four categories; single data series; minimalist layout.

PRO
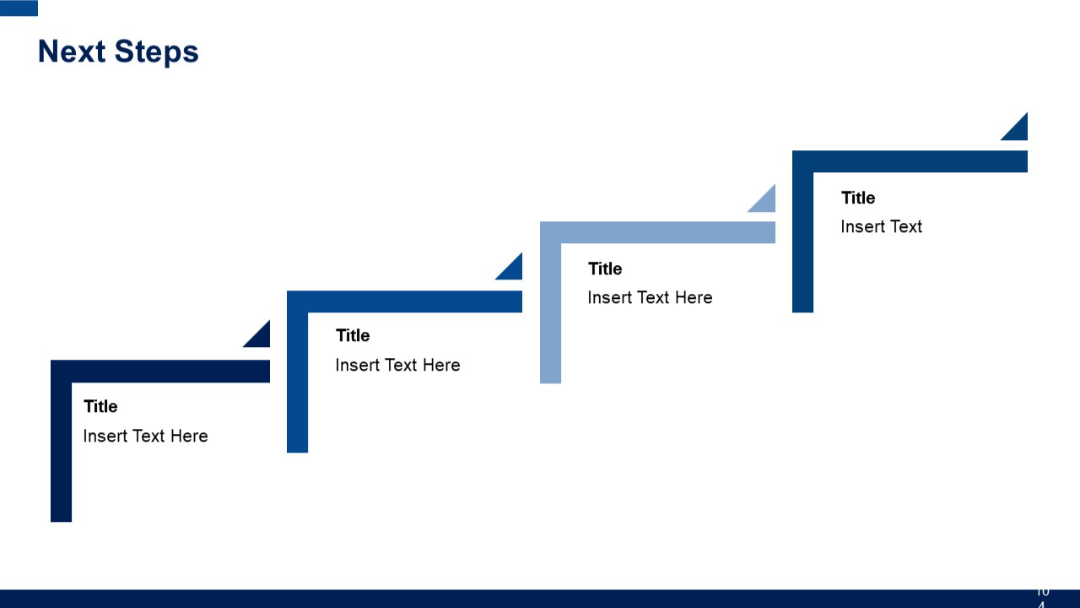
Four L-shaped blocks arranged like stairs, each with a title and text area, using gradient coloring for progression.
PRO
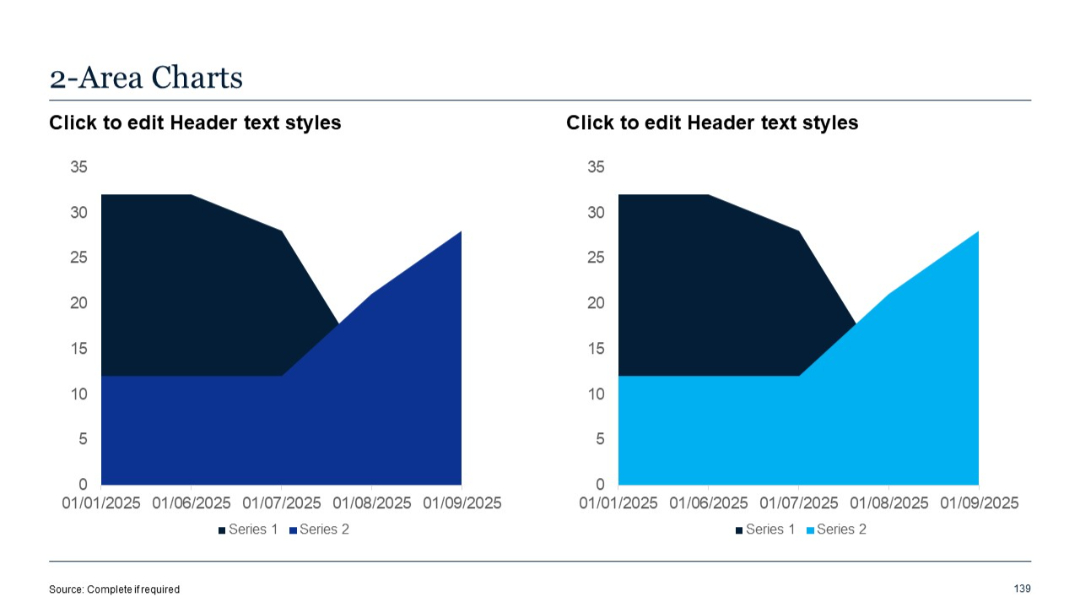
Two area charts side-by-side. Left chart shows two overlapping areas in dark blue and navy; right chart uses navy and cyan blue.
PRO
Horizontal Gantt chart with labeled tasks and color-coded bars across time phases; grid background.

PRO
A four-part circular quadrant layout with a central pie chart. Each quadrant is labeled numerically (01–04) and includes editable text outside the circle.

PRO
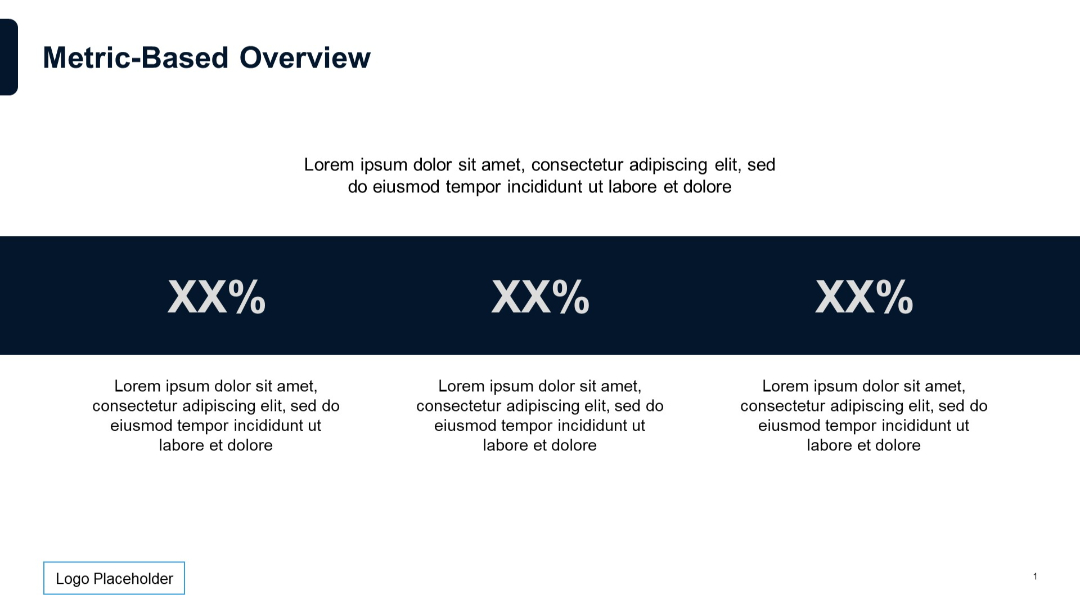
Three equally spaced percentage values in bold with supporting text above and below.
PRO
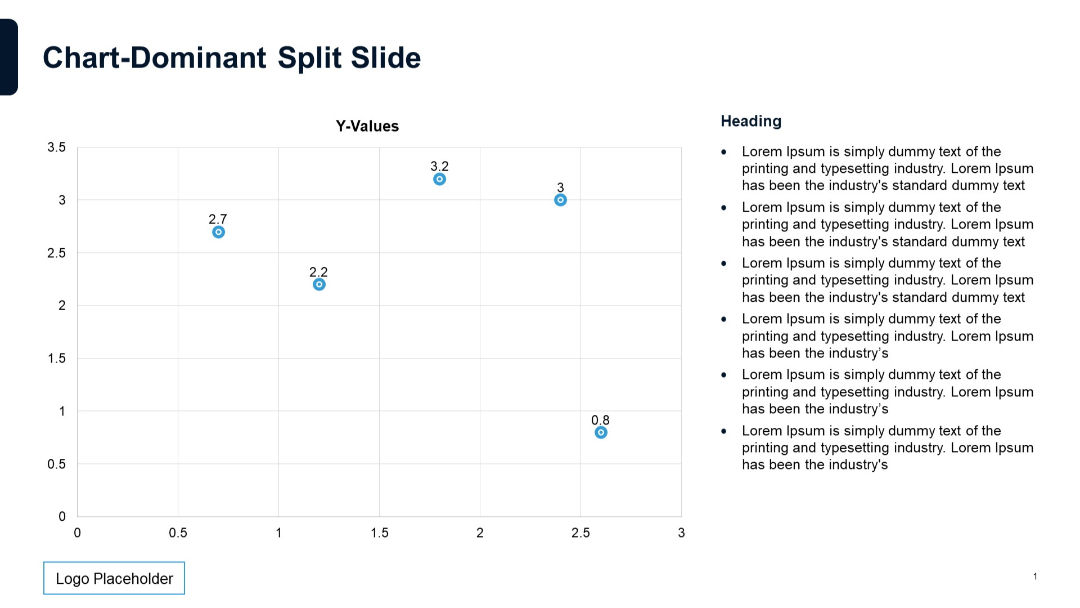
Scatter plot with numeric labels; evenly spaced grid background; bullet list on right.
PRO
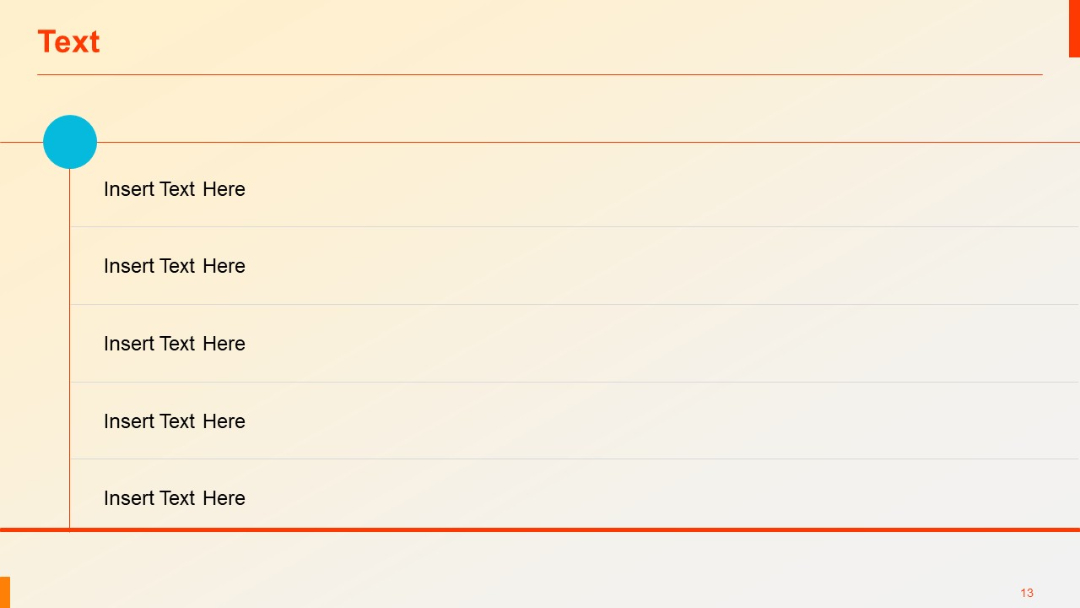
Vertical list with a single thick line and large blue dot at top left; simple rectangular text blocks.
PRO
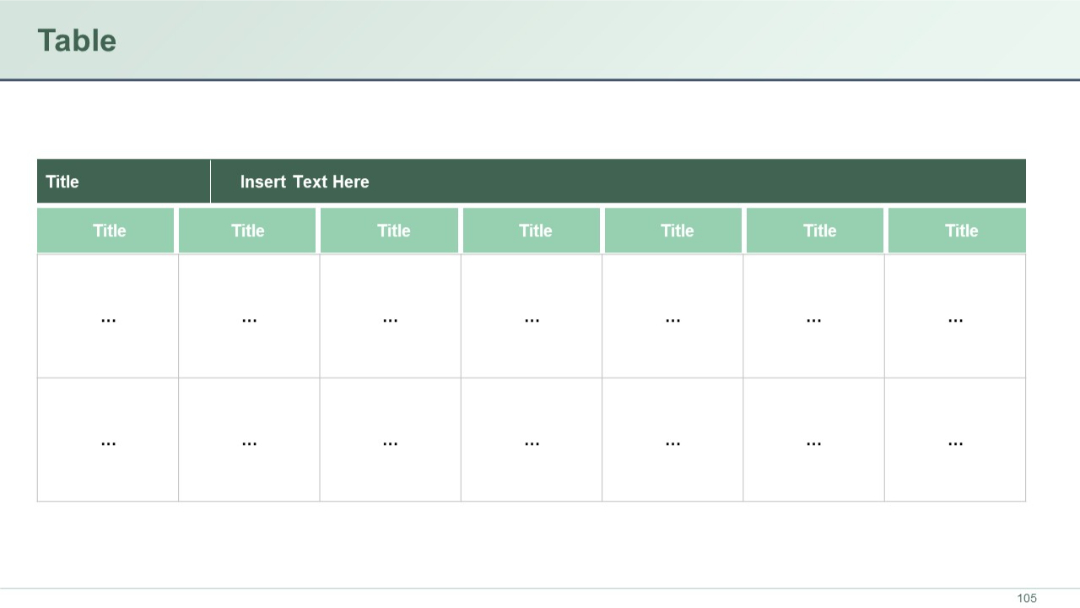
Clean table with horizontal and vertical headers; light green and dark green shades; placeholder dots used within cells.
PRO
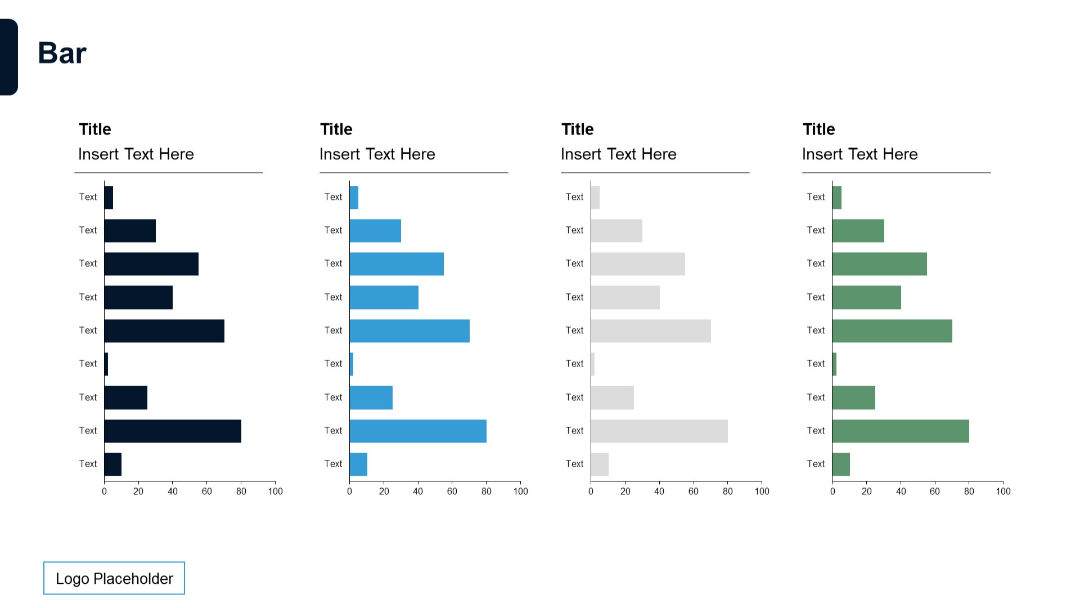
Four grouped horizontal bar charts with color-coded bars (dark blue, light blue, gray, green). Each chart has title and labeled y-axis.
PRO
Dark-themed title slide with "Graphic Slides" in bold text. A single horizontal line with a white circle and arrow dot motif pointing right. Bottom-left logo. Minimalist layout.

PRO
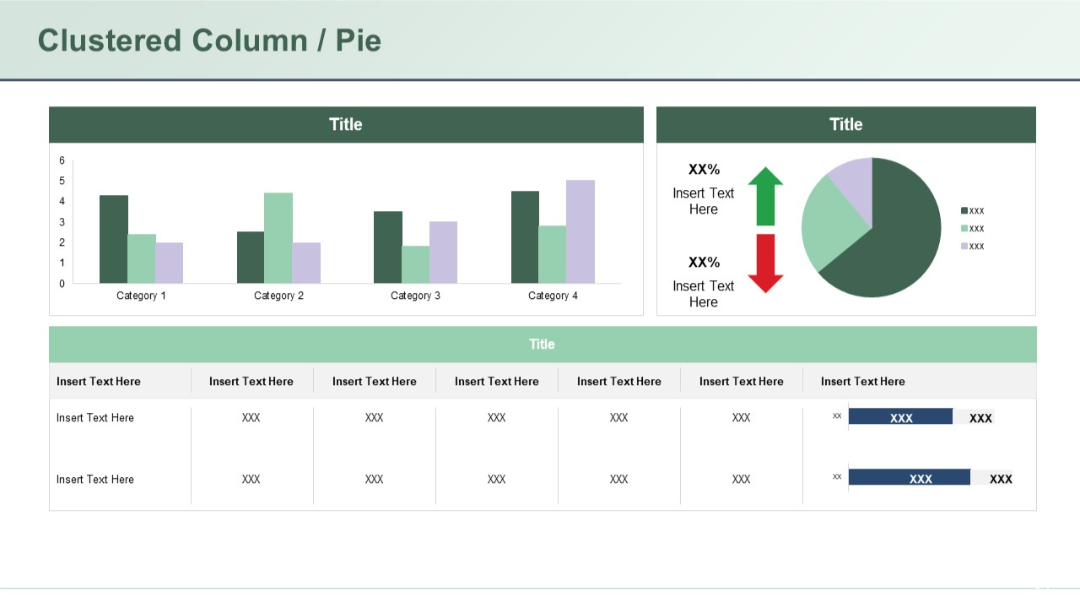
Top section shows a clustered column chart and pie chart side-by-side. Bottom section includes a structured table with placeholder text.
PRO
Simplified table with two rows, each containing a large red category cell and associated cells for editable content across four columns.

PRO
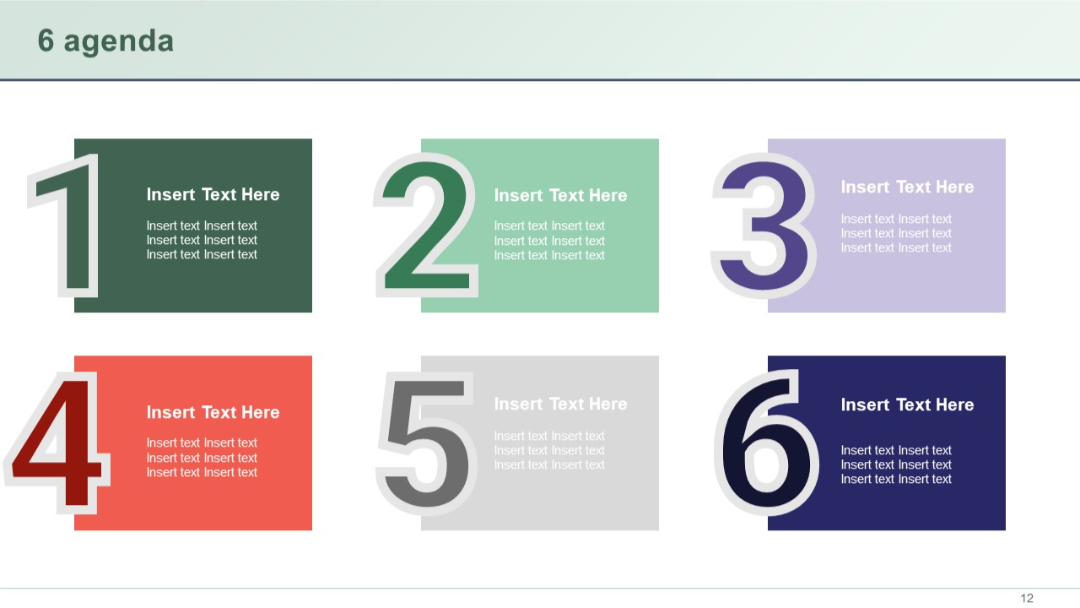
Two-row, three-column grid layout with large numbered blocks (1–6), each containing placeholder titles and text; colorful segmented design.
PRO
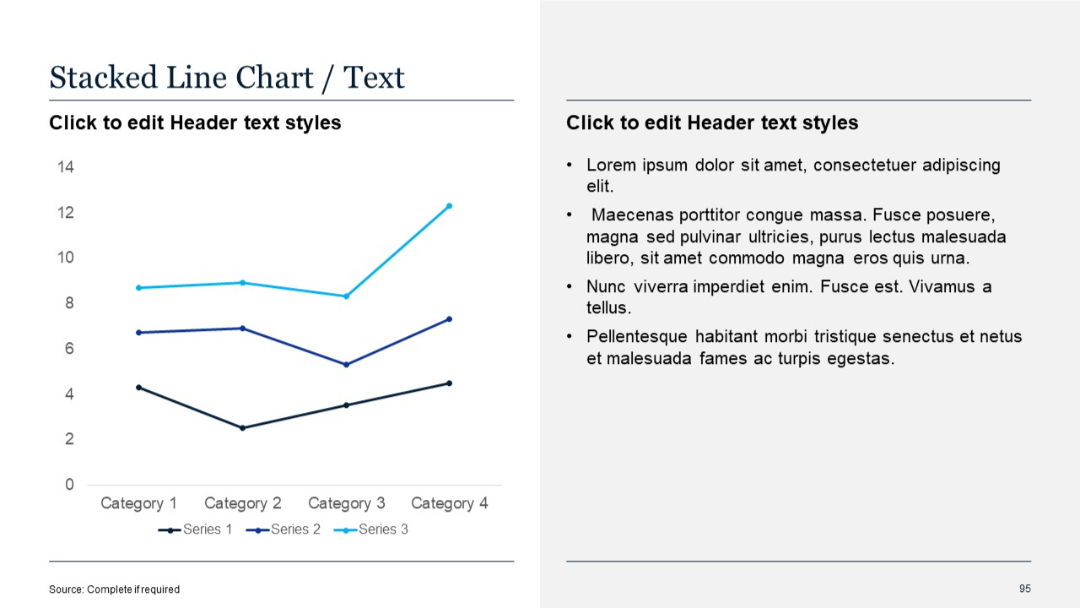
Multi-series line chart with three data series; right side with text bullets.
PRO
One large quote section with bold orange background and a contrasting white section. High visual contrast to highlight one powerful quote.

PRO
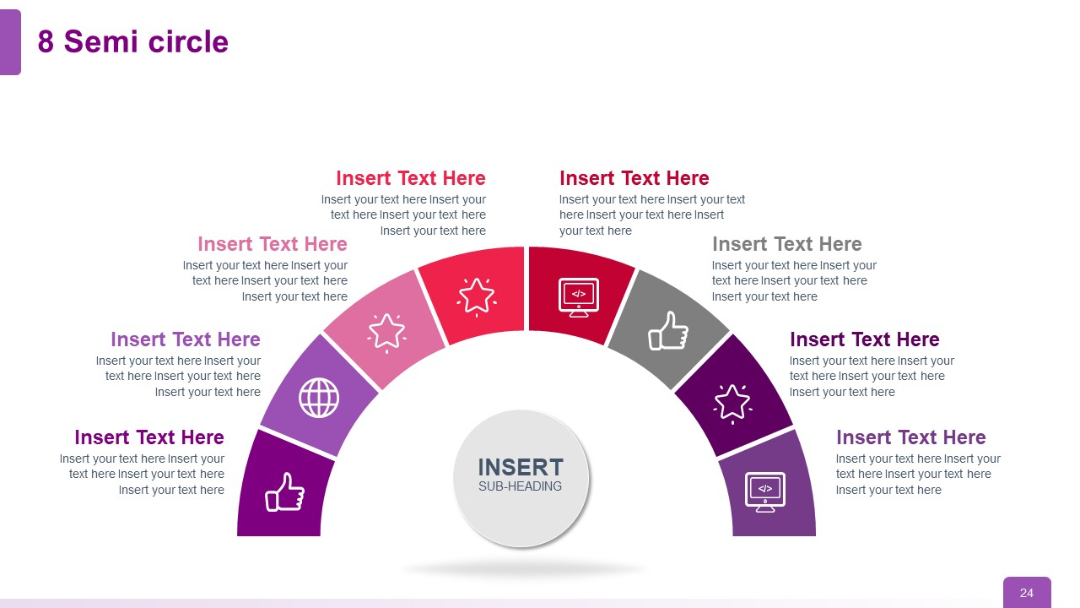
Semi-circle with 8 gradient-colored segments and icons. Each segment includes space for text. Central grey circle labeled “Insert Sub-heading.”
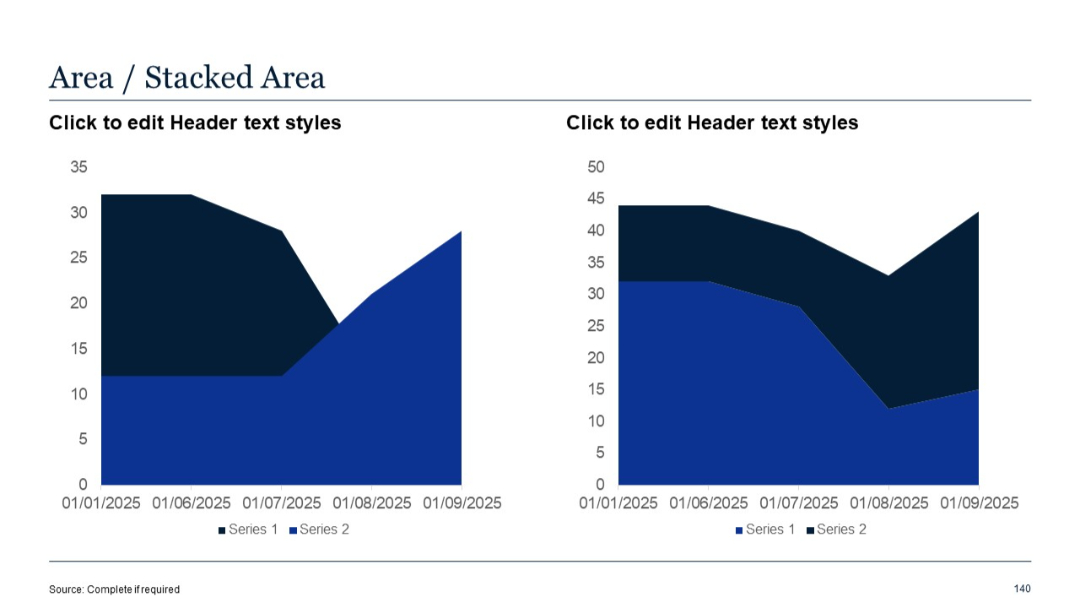
PRO
Left chart is a basic area chart; right chart is a stacked area chart, both showing time series for two series with color differentiation.
PRO
Four rectangular quote boxes arranged in a 2x2 grid, each with large quotation marks and placeholder text.
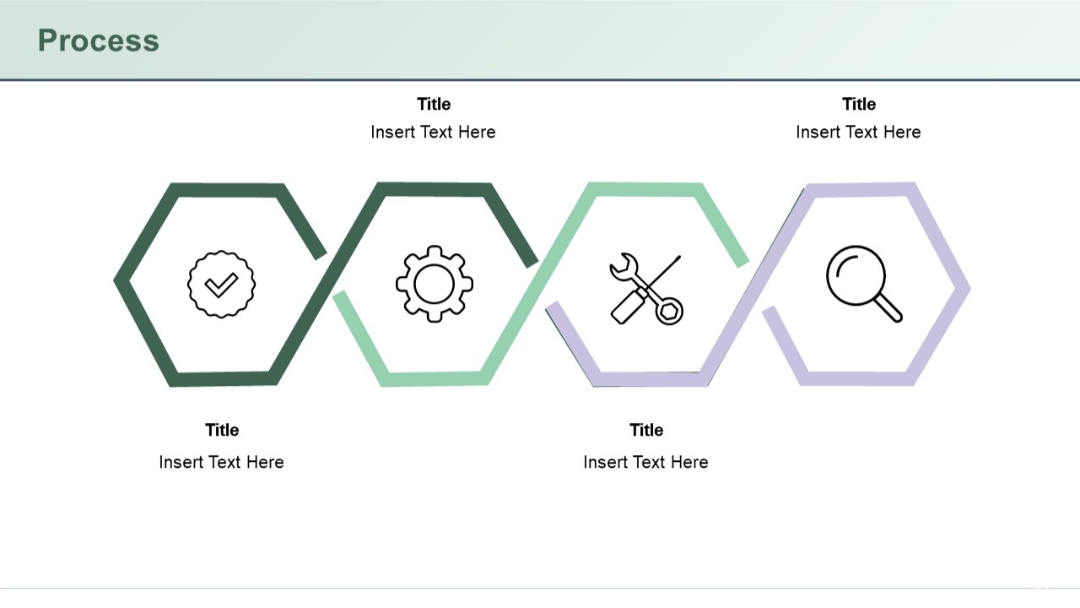
PRO
Hexagonal outline icons connected in a horizontal layout with text placeholders above and below each icon.
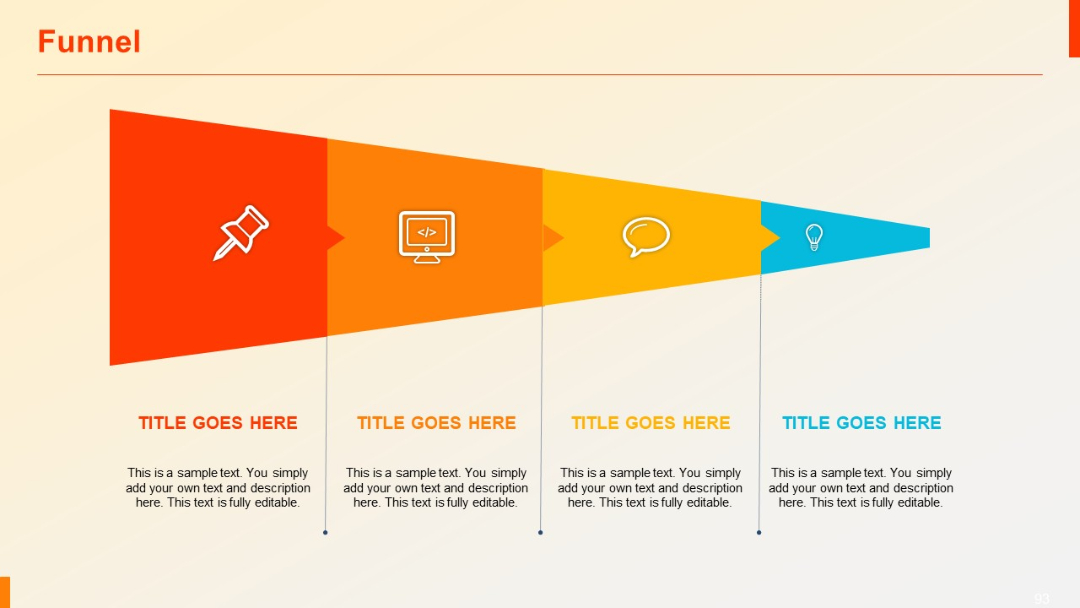
PRO
Funnel shown as a segmented triangle with four vertical sections from left (wide) to right (narrow), each with icons and editable text.
PRO
Three-part circular infographic with numbered colored sections and matching text boxes placed around the perimeter.

PRO
Six purple rectangular blocks in a 3x2 grid with white placeholder text centered within each box. Uniform size and layout.
PRO
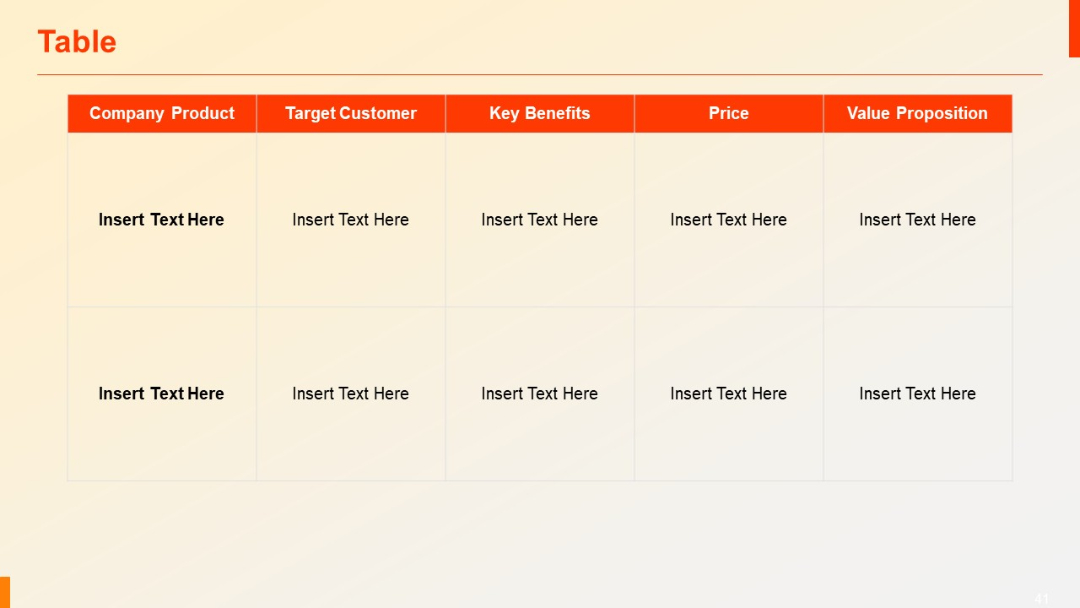
Two-row, five-column grid with bold red column headers and light beige background. Equal column widths. Clean and structured layout.