PRO
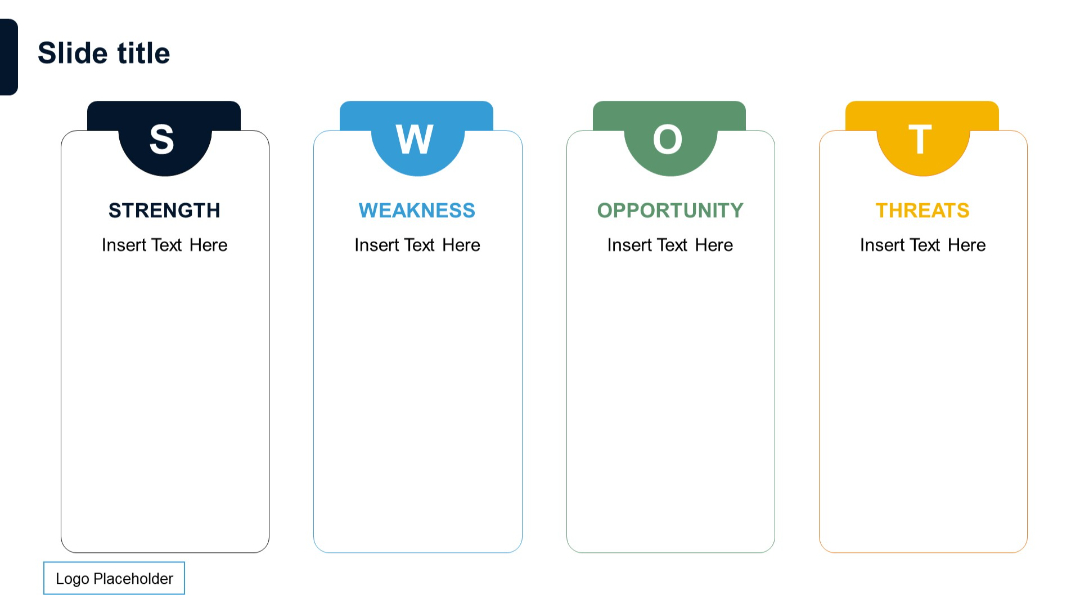
Tab-style vertical layout for SWOT categories with rounded headers and color indicators.
PRO
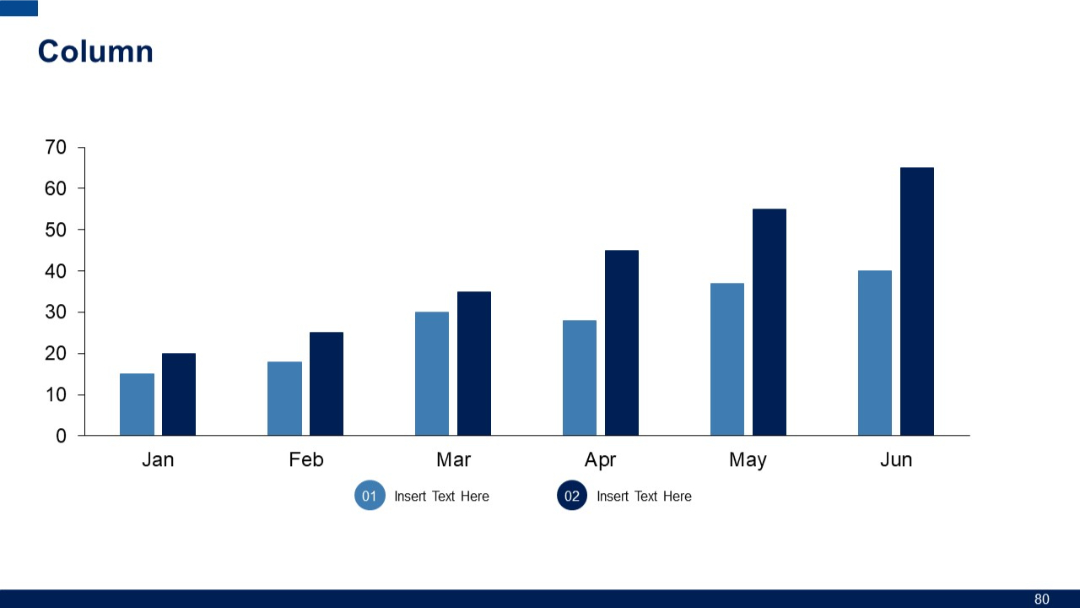
Vertical column chart showing data from January to June. Two data series are represented using varying shades of blue.
PRO
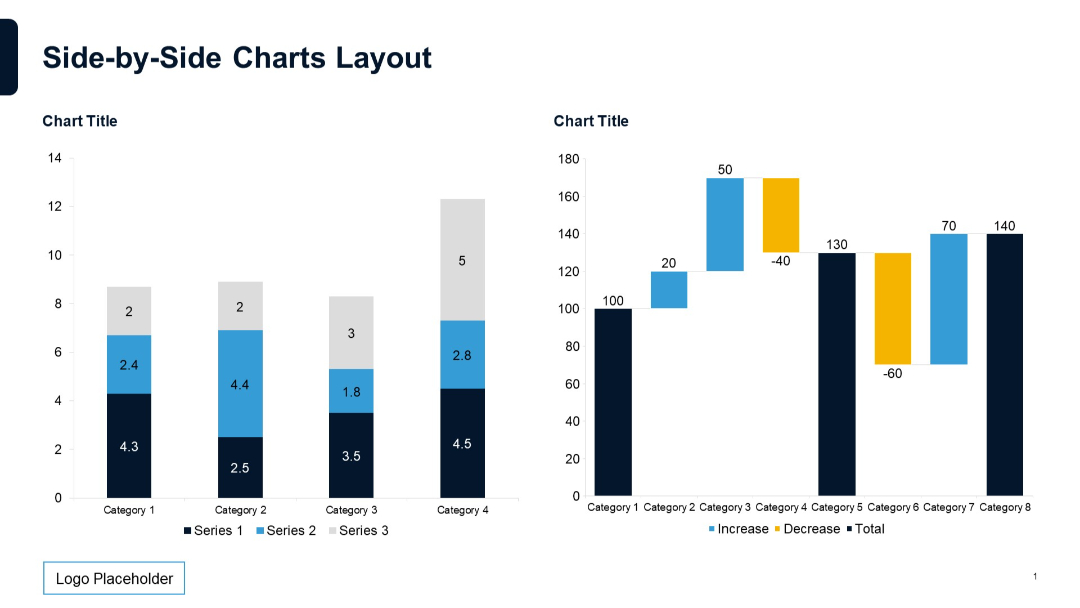
Stacked bar chart on left, waterfall chart on right. Clean division of chart types with equal spacing.
PRO
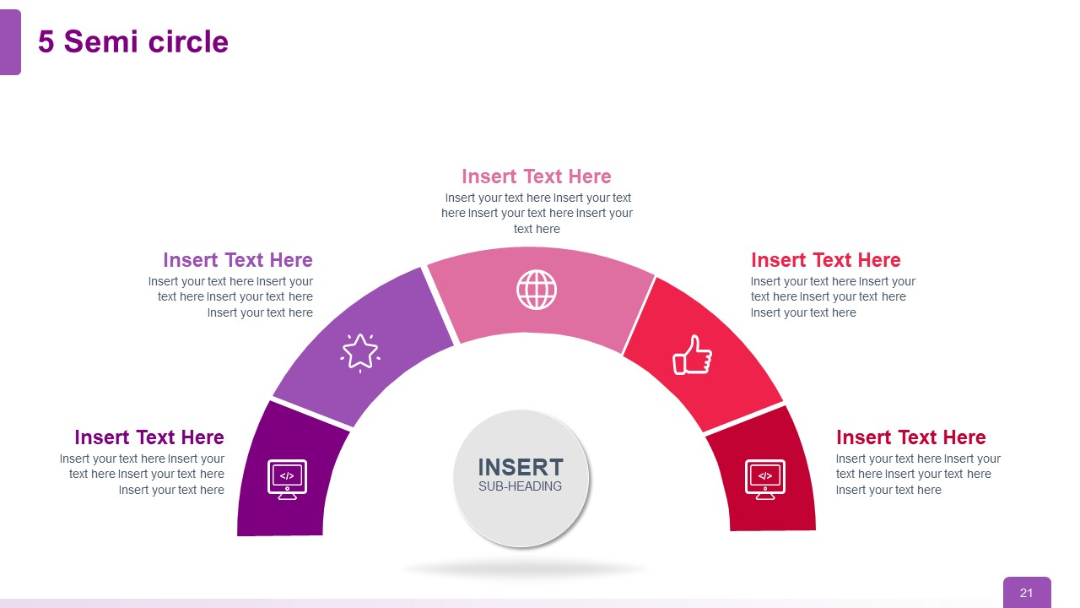
A semi-circle layout split into 5 colored segments (purple to red), each with an icon and placeholder text. Central circular element for subheading.
PRO
Grid with tick and cross marks inside cells. Simplified decision or comparison matrix with two rows and eight columns.
PRO
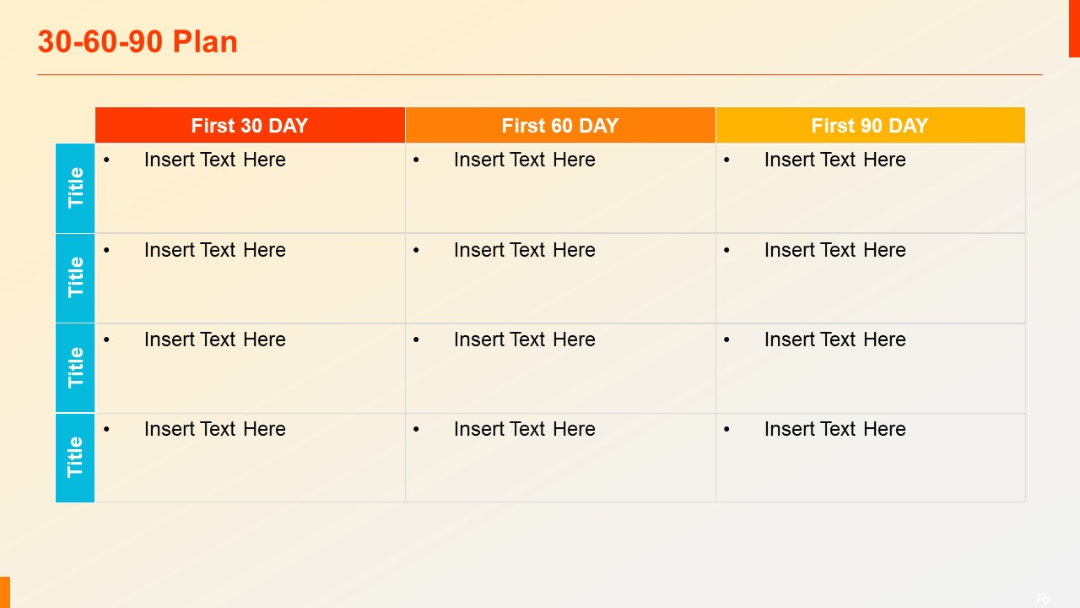
Grid table with rows for tasks and three columns for 30, 60, and 90-day activities.
PRO
Two-part segmented circle infographic in the center, each half labeled 1 and 2 with adjacent text boxes.

PRO
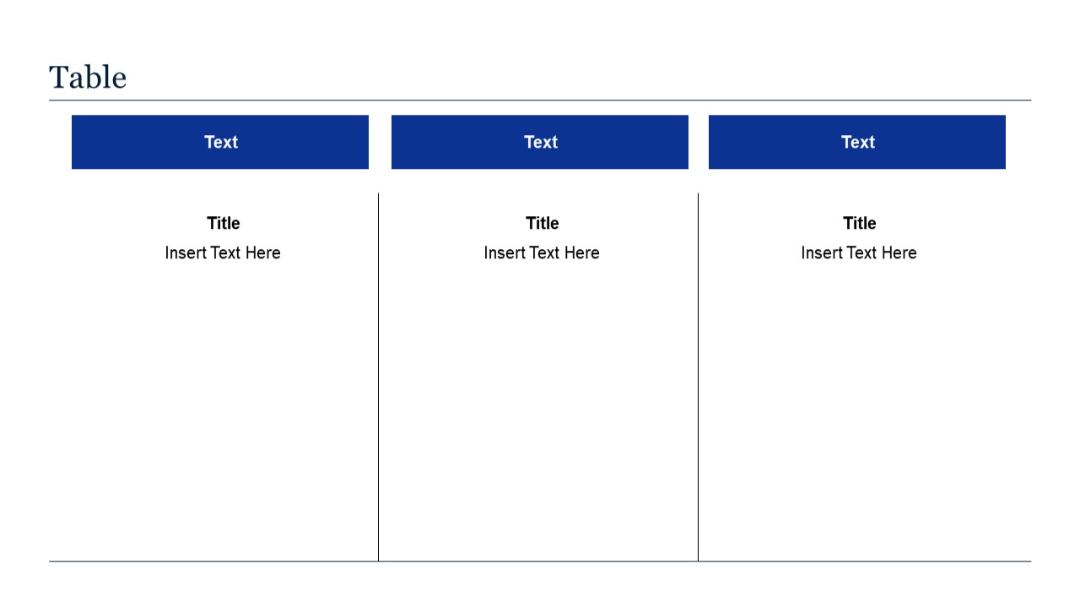
Three-column layout with vertical segmentation; each column includes a blue header and a title with text below. Visually separated into three blocks.
PRO
Time-based agenda in a linear, left-aligned format with colored circles and play-style directional markers.

PRO
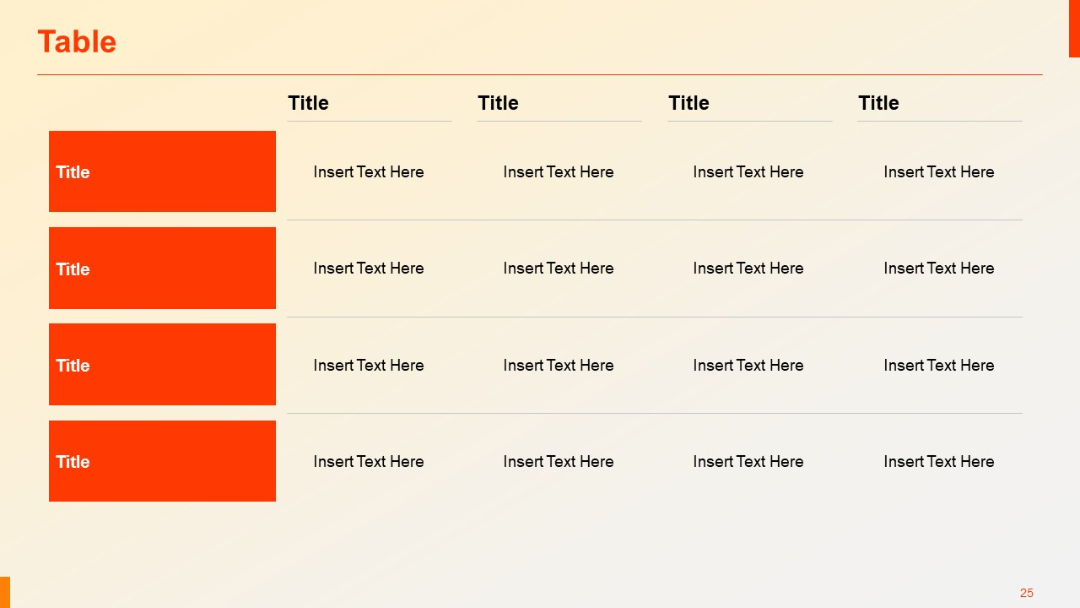
Similar to Slide 24 but includes four rows, maintaining the same structure with left-aligned red category labels and four right-aligned content columns.
PRO
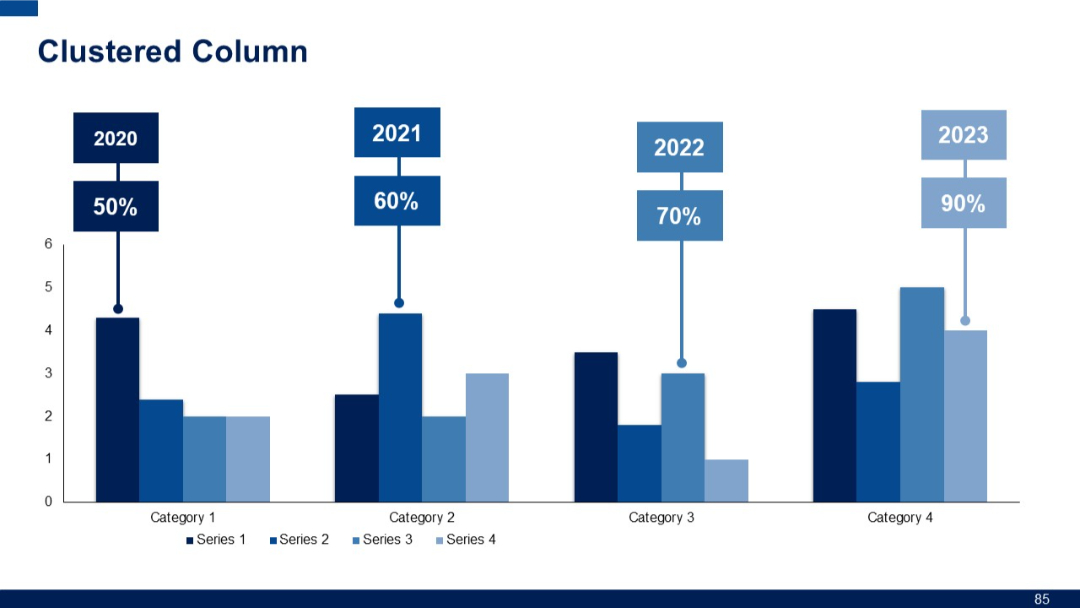
Clustered column chart across four categories with callout boxes above each column indicating year and corresponding percentage.
PRO
3D-style staircase graphic with five color-coded rectangular steps stacked vertically from bottom to top, each labeled from Step 1 to Step 5.

PRO
Vertical timeline layout with checkmarks and lines connecting text blocks on the right.
PRO
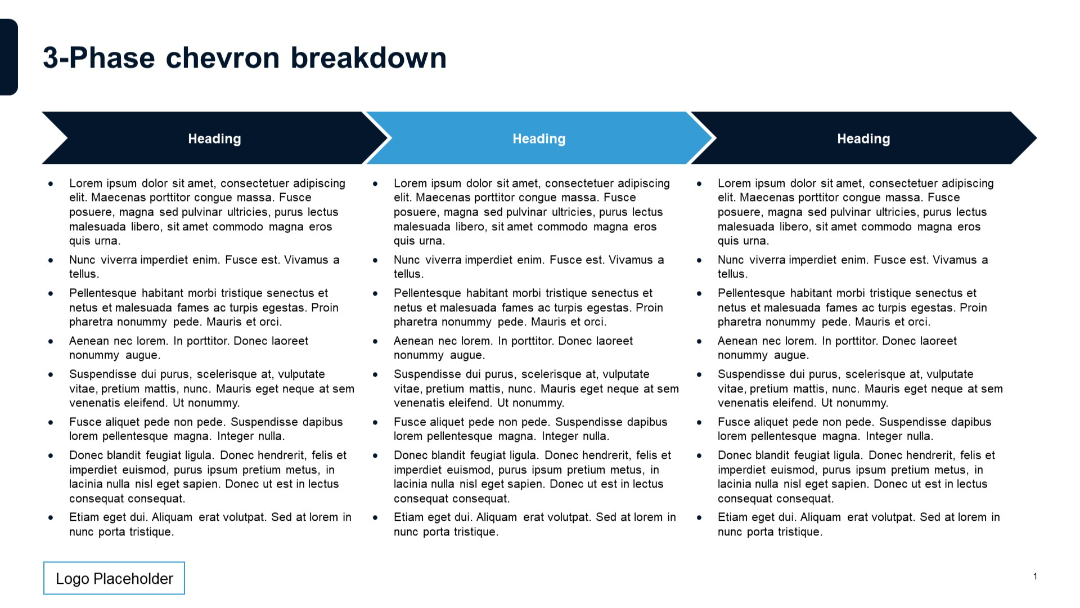
Three horizontal chevrons pointing right, each with a title inside. Below each chevron is a bulleted list of text in three evenly spaced columns. Blue and dark blue alternating colors for chevrons. Logo placeholder bottom left.
PRO
Two-column checklist layout with purple headers and check icons for each point; equal spacing and mirrored columns.
PRO
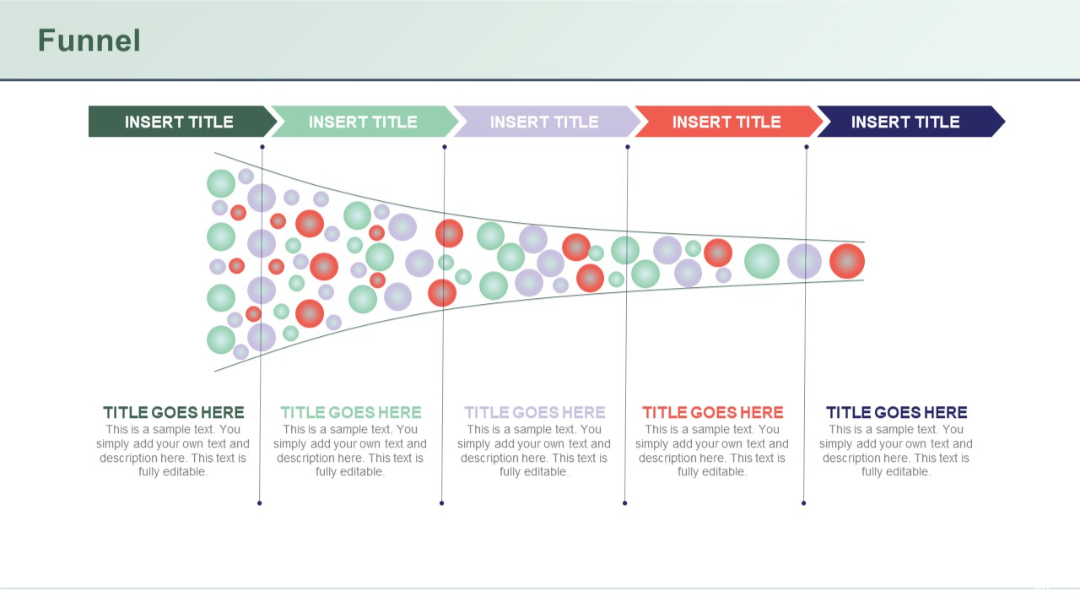
Funnel visual with multiple dots flowing through five stages, each with a title and description below.
PRO
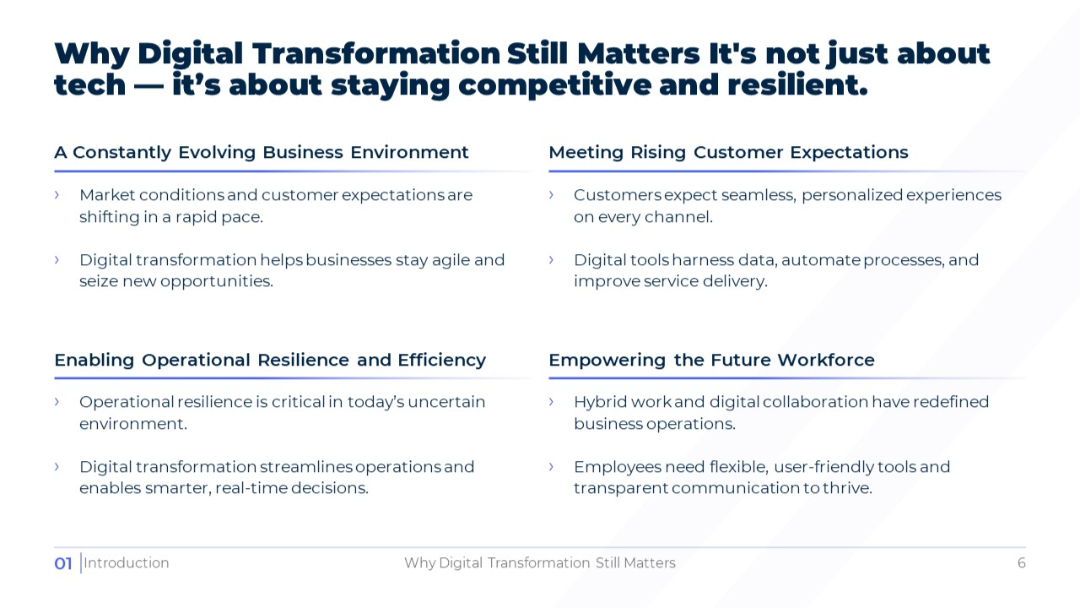
Four quadrant layout with paired headings: business environment, customer expectations, resilience, and workforce. Bullet points under each. Consistent color and spacing.
PRO
A radial diagram split into 8 colored wedges, surrounding a central circle labeled "Header." Text descriptions are placed outside each wedge.

PRO
Full-slide dark blue background with the word "Tables" in white and a thin horizontal line leading to a white dot. Branding and logo placeholder in lower left.

PRO
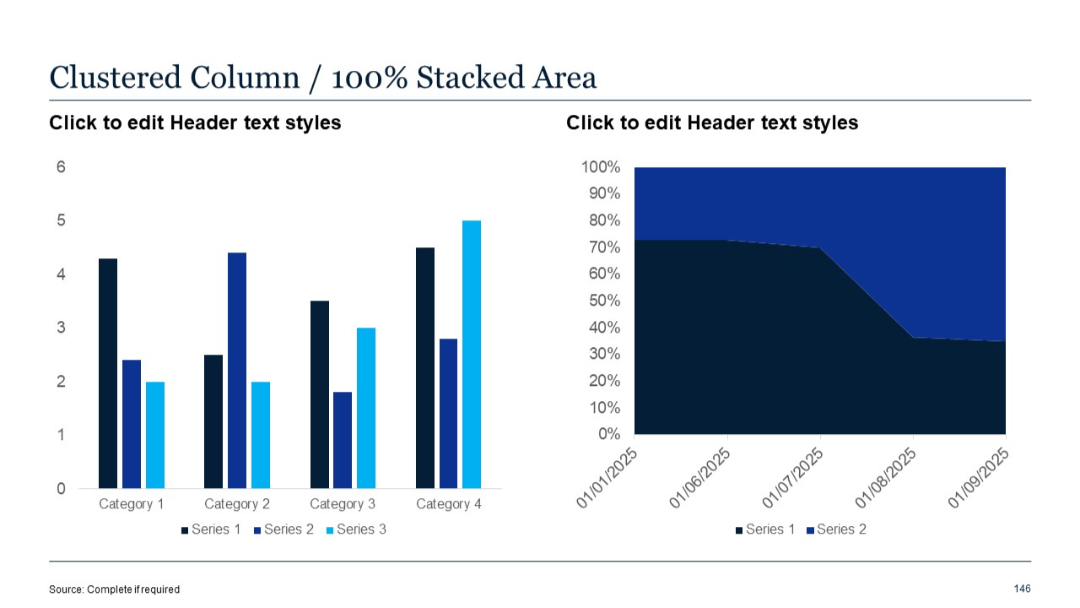
Left shows clustered columns (3 series), right presents a 100% stacked area chart. Vertical comparison on left, proportional timeline on right.
PRO
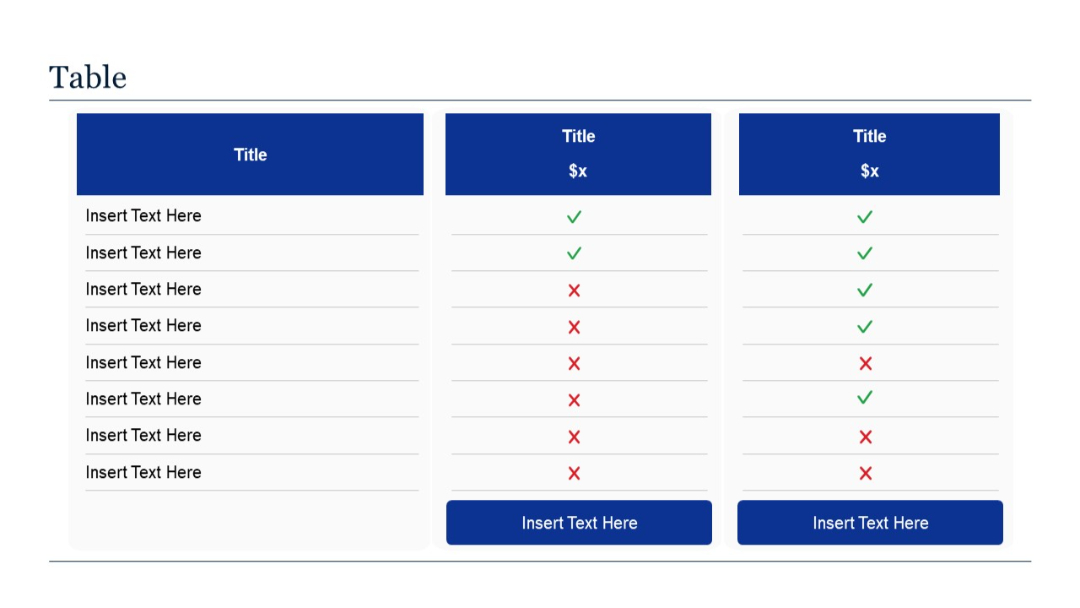
A 3-column vertical comparison table. First column lists features; next two columns use checkmarks (green) and crosses (red) to indicate feature presence.
PRO
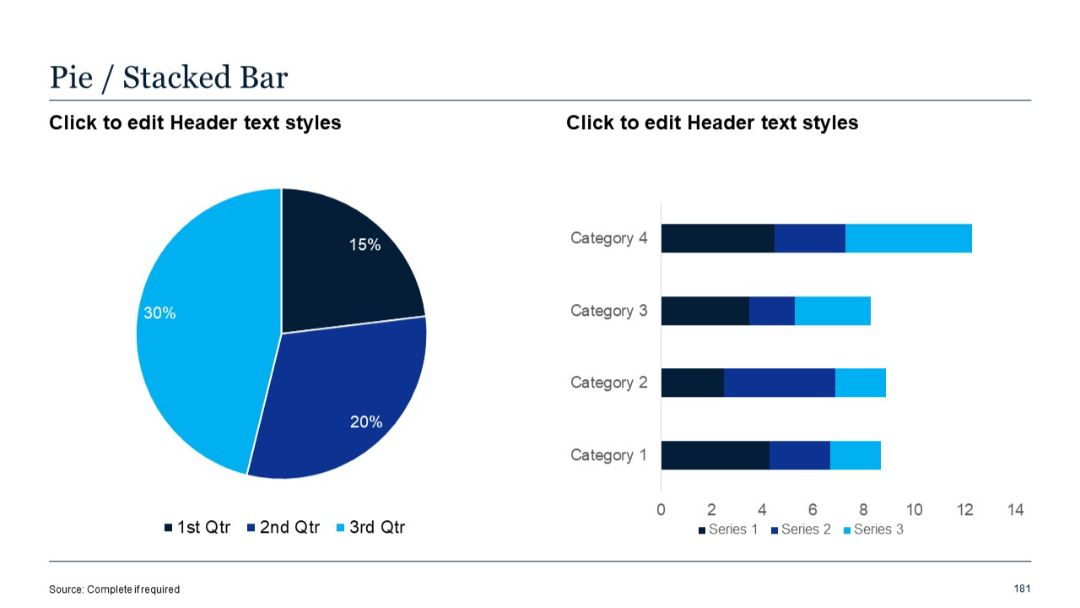
Split layout: left side features a pie chart with three labeled segments; right side shows a horizontal stacked bar chart with four categories and three data series.
PRO
A classic waterfall chart with columns labeled from Category 1 to 8, indicating increases, decreases, and totals through color-coded bars.

PRO
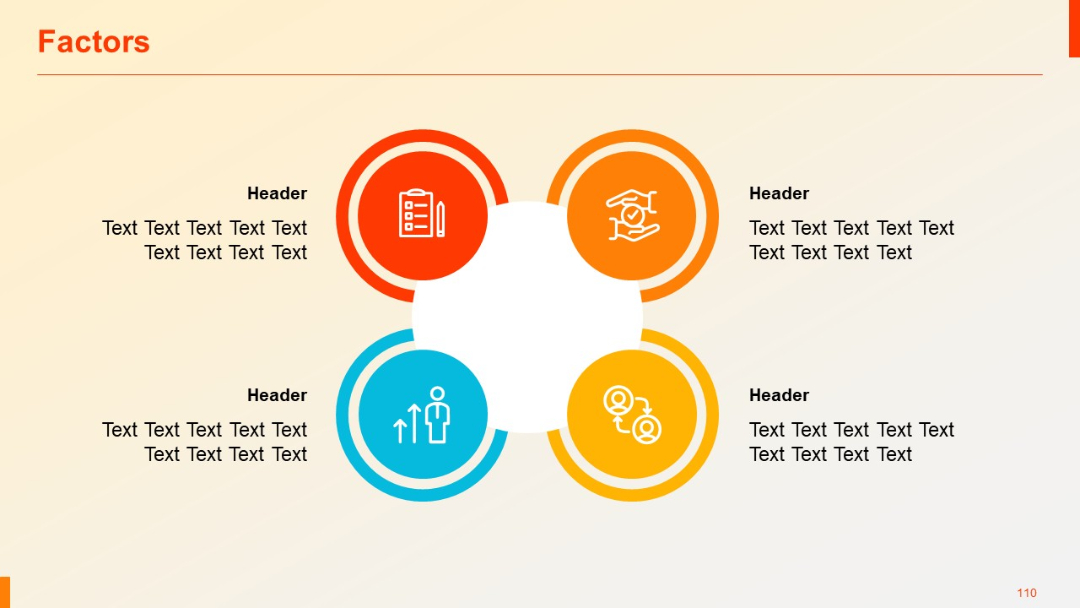
Four circular icons in a closed loop around a central white space; each icon has corresponding header and text blocks on the outer side.
PRO
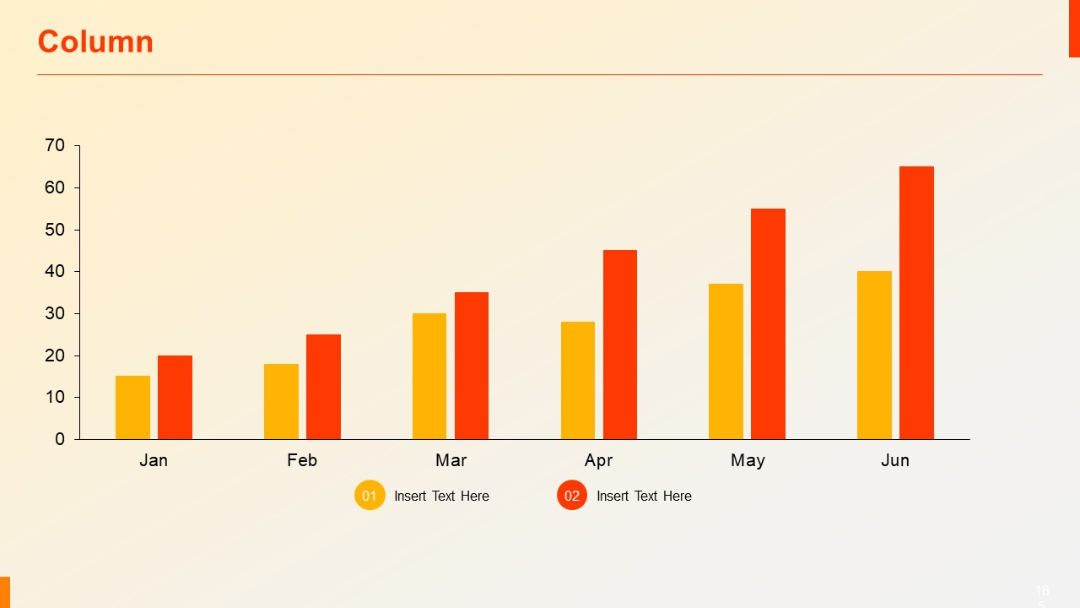
Basic vertical column chart showing values for six months (Jan–Jun) using two color series. Clean and minimal design with icons below chart.
PRO
Expanded table with 4 rows and 5 columns, identical structure to Slide 22, allowing more entries for comparative analysis.

PRO
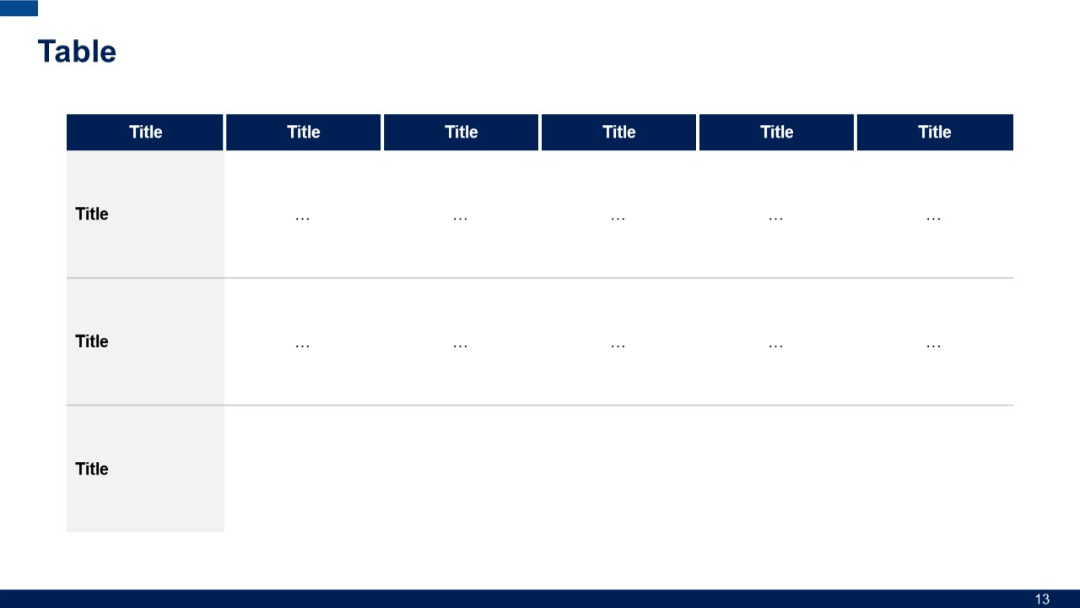
A horizontal table with a top header row in blue and two data rows. Leftmost column is wider for row titles. Grid lines separate sections and includes three rows for entries. Header is blue; cells have dotted placeholders.
PRO
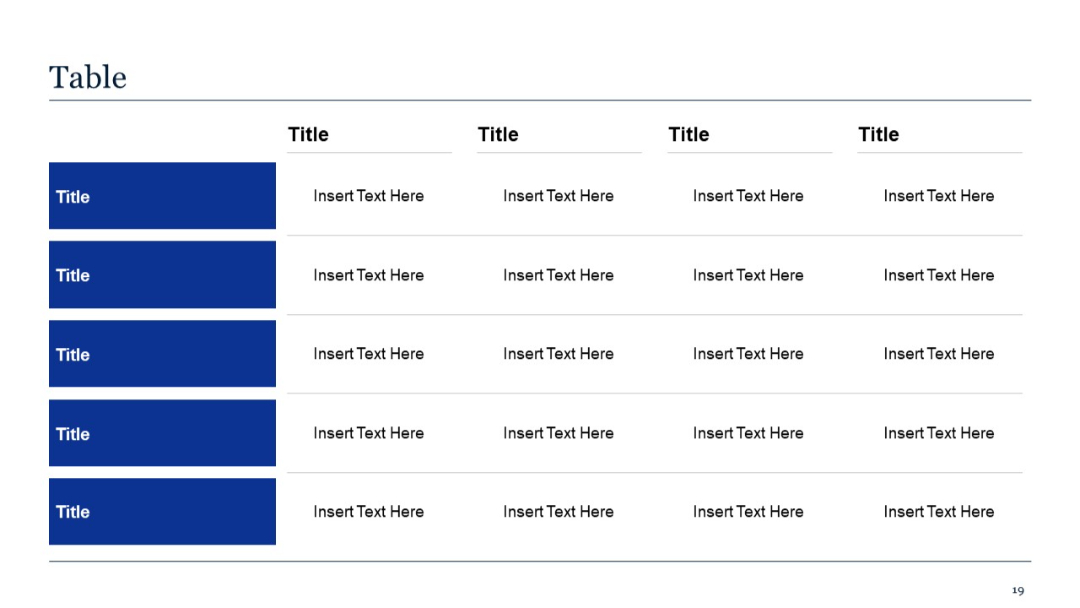
Four-column version of the side-by-side format, using consistent formatting with shaded headers and underlined section titles. Clean and symmetrical design.
PRO
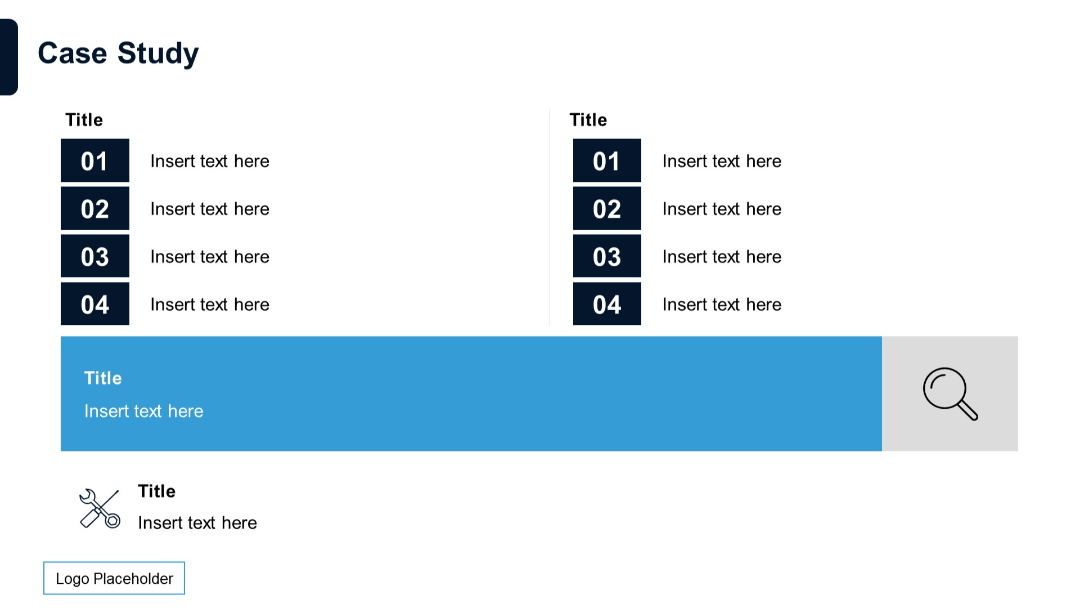
Split layout with two columns of numbered lists (01–04) in dark boxes followed by a blue-highlighted horizontal block and an icon section below.
PRO
Vertical list with large colored numbers on the left and matching colored text lines across.