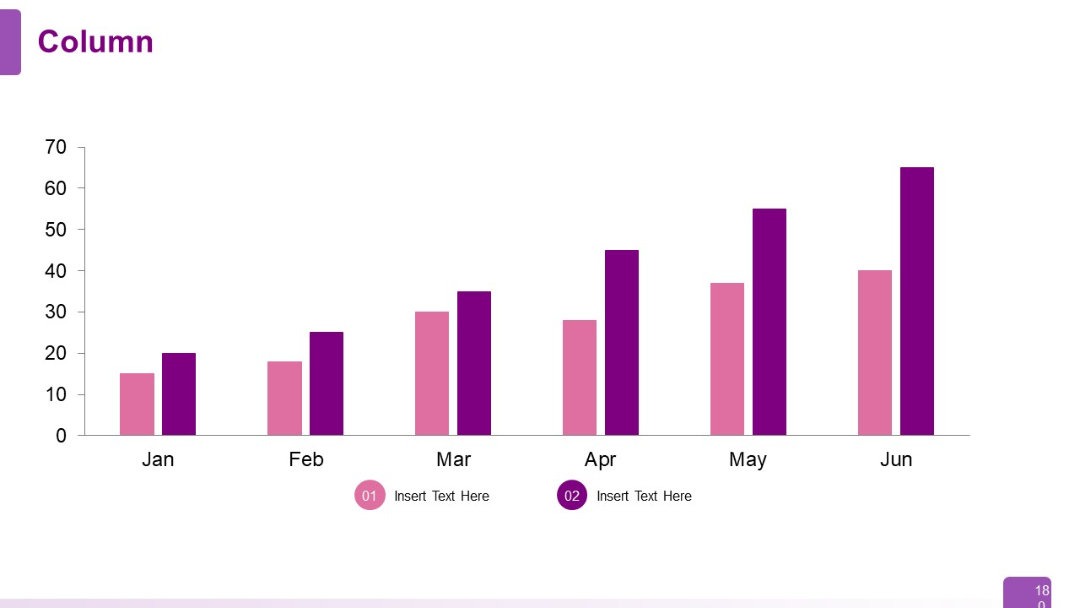
PRO
Vertical column chart displaying six months of data (Jan–Jun), with two series per month in distinct colors. Below are icon-based annotations (01 and 02).
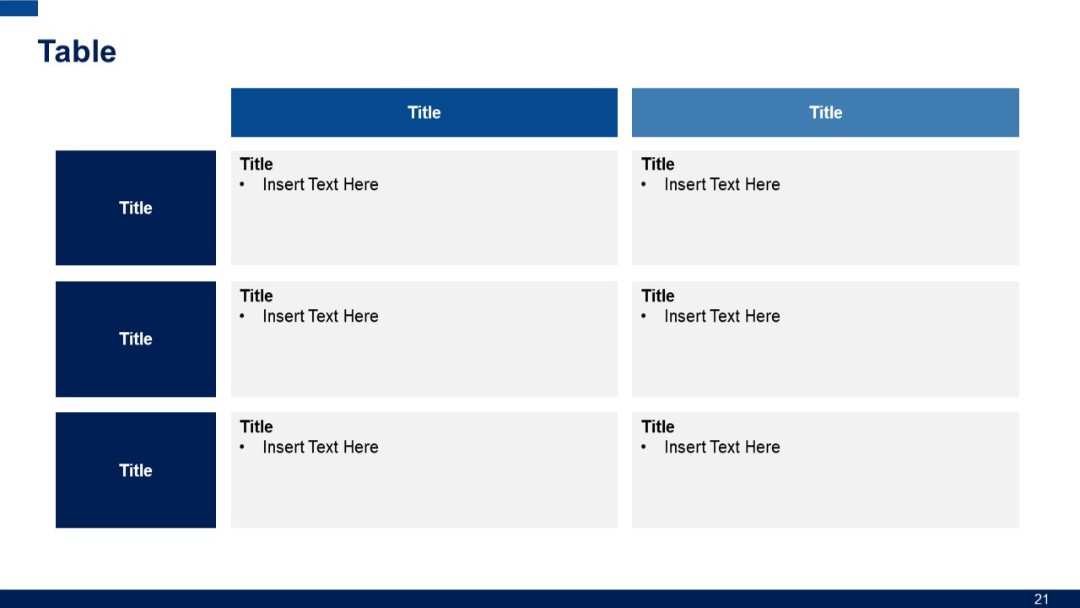
PRO
3x3 grid-style table with bolded column and row headers in dark blue, light gray content boxes, and bullet point placeholder text.
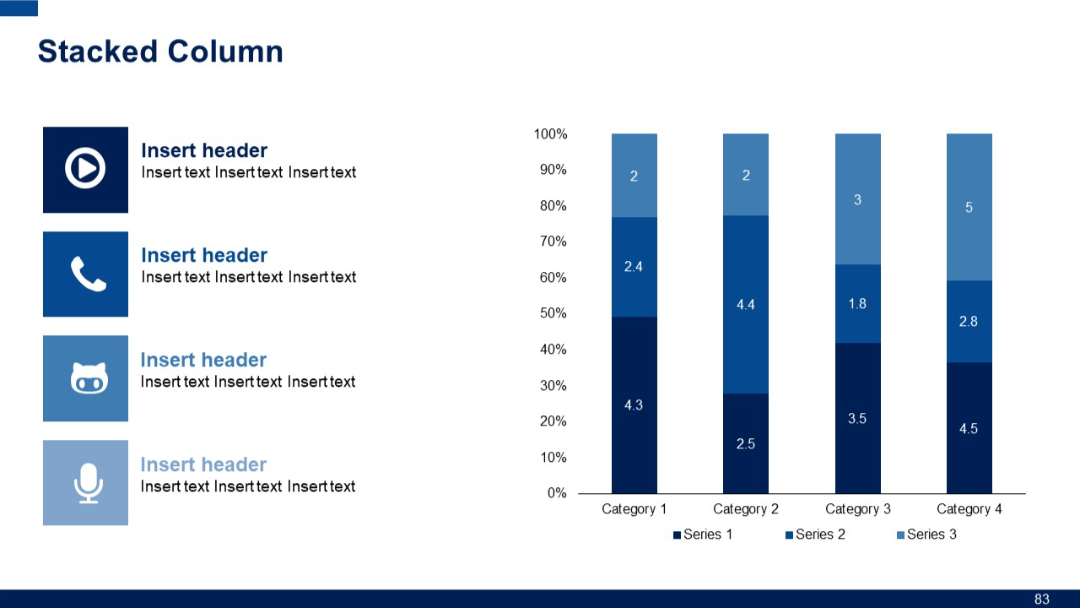
PRO
Left side features four icons with headers and subtext. Right side displays a 100% stacked column chart with value labels for three series across four categories.
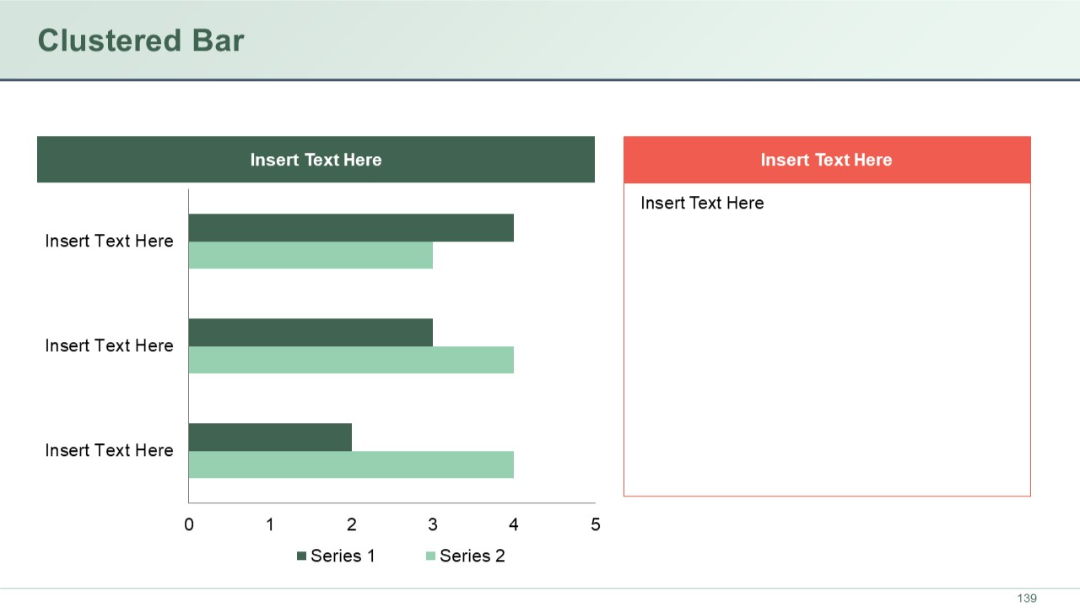
PRO
Horizontal clustered bar chart on the left; two large vertical content boxes on the right. Simplified layout with series differentiation by color.
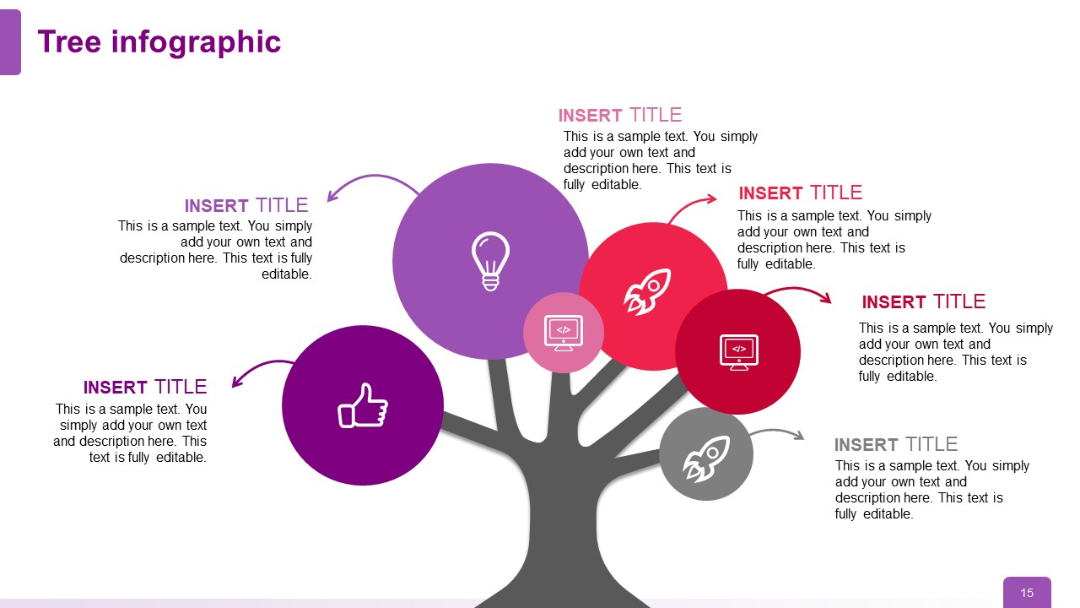
PRO
Six icons arranged symmetrically on the tree (lightbulb, rocket, thumbs up, computer, computer, rocket); vibrant and varied color scheme adds contrast.
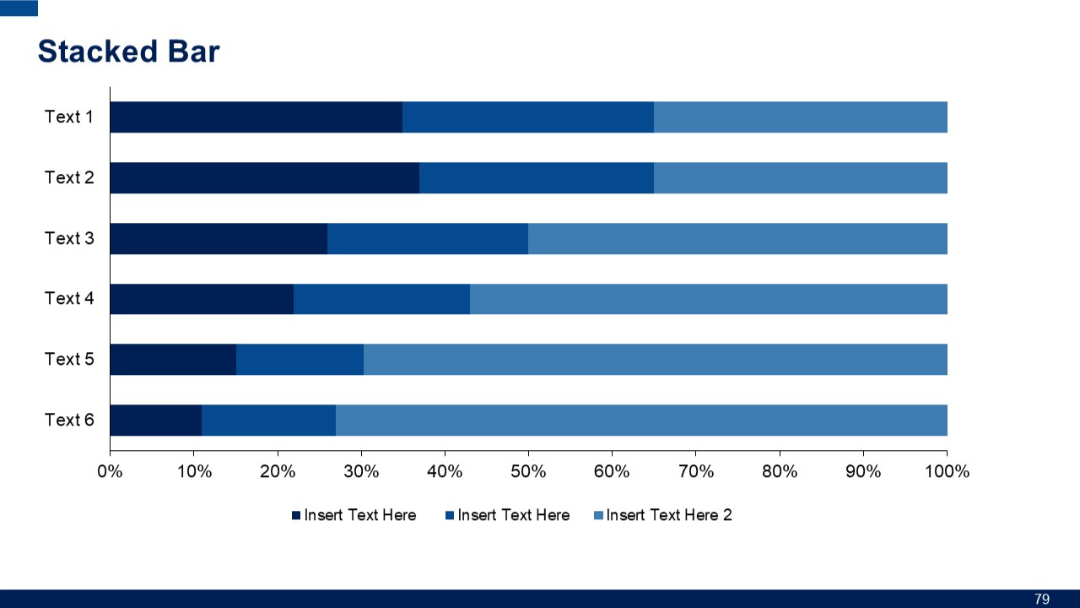
PRO
Stacked horizontal bar chart with six entries. Each bar is segmented into three colors representing different text inputs.
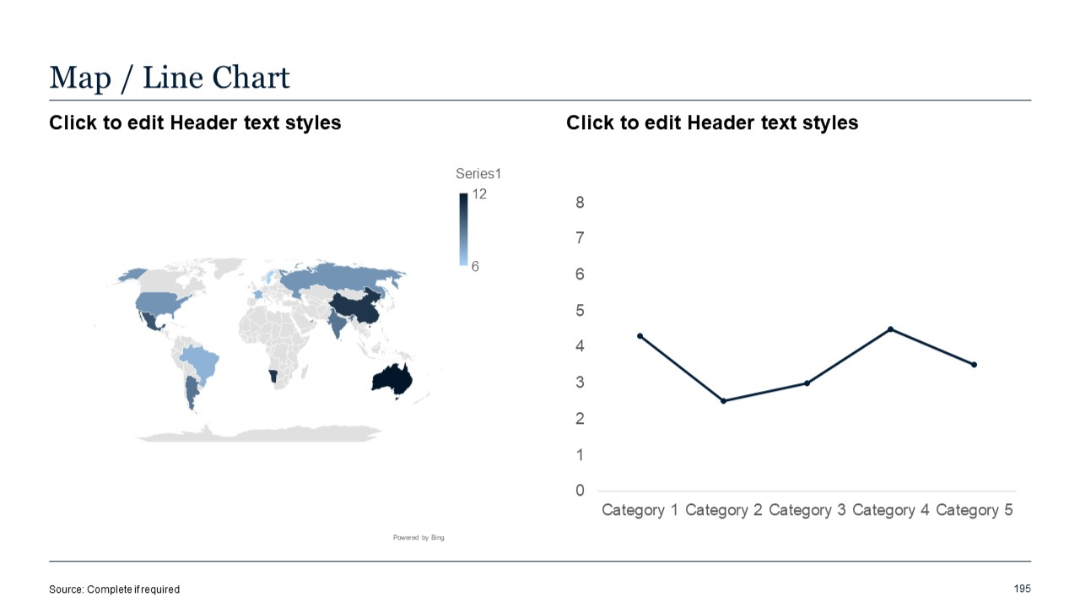
PRO
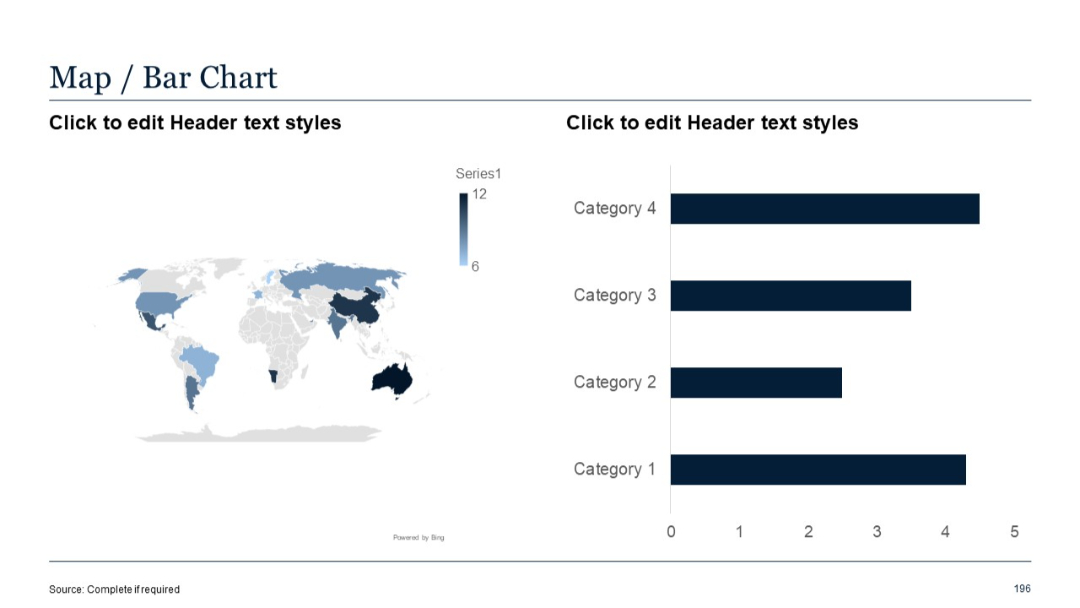
Left: world map heatmap; Right: line chart displaying trends across five categories. Clean layout.
PRO
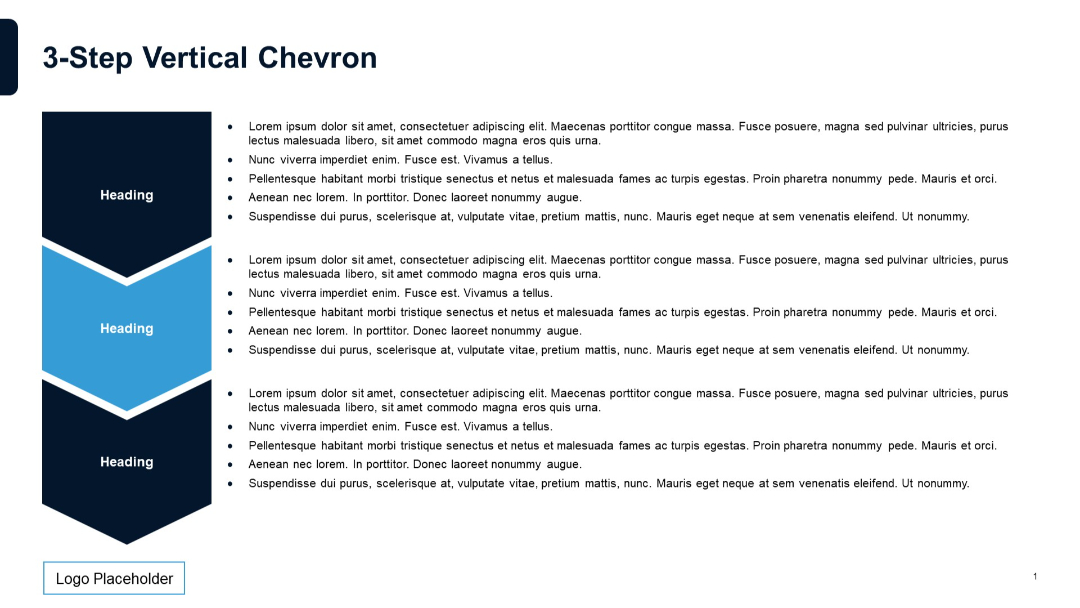
Three vertically stacked chevrons on the left in alternating colors. To the right of each chevron is a bulleted list. Vertical alignment offers a top-down process view. Logo in bottom left.
PRO
Table with 5 columns and 5 rows. Bold left-side headers, grid lines, and dark blue blocks for headers. Clean and structured format.

PRO
Three-column layout with numbered headers, titles, and colored content blocks.

PRO
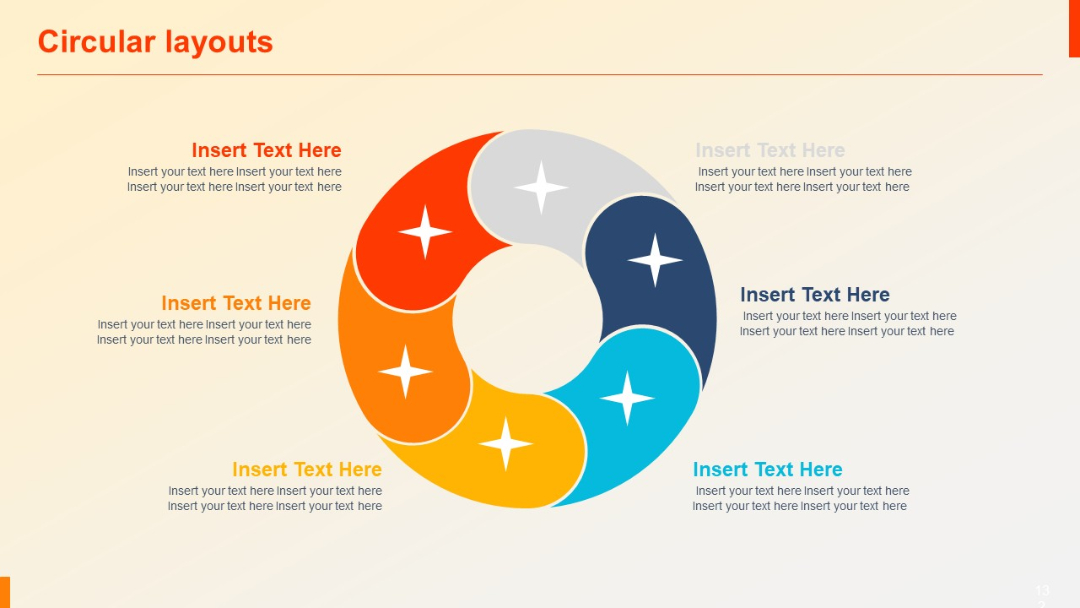
Six-part circular swirl with icons in each segment and supporting text labels placed outside in a radial pattern.
PRO
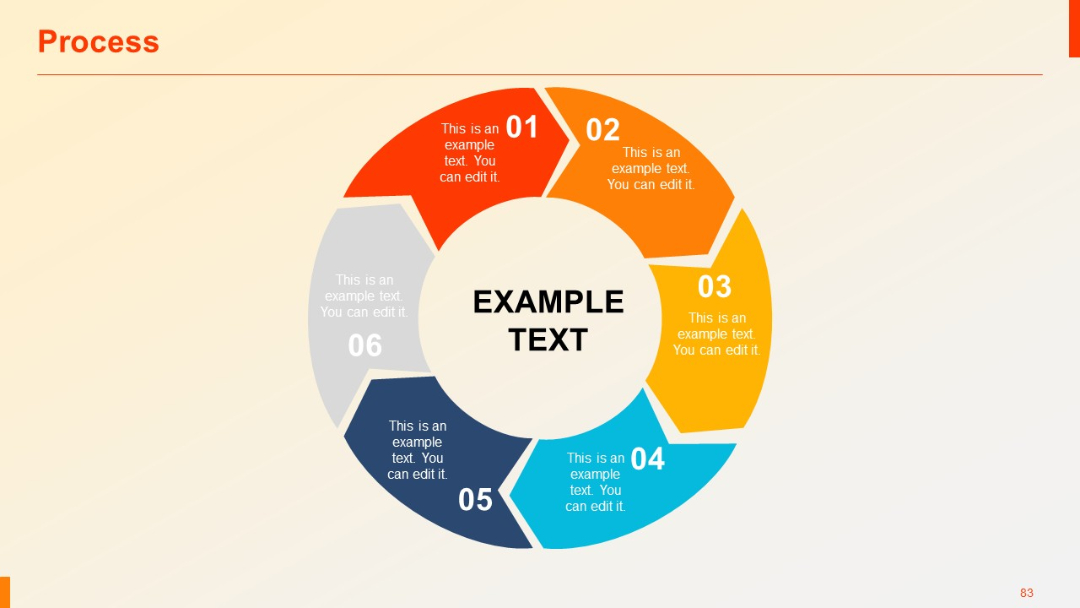
Circular, clockwise infographic with six numbered segments surrounding a central text area. Gradient and colored wedges provide visual segmentation.
PRO
Curved left-side blue section labeled “Title” with radial checklist lines extending to the right; circular checkmarks indicate completion.
PRO
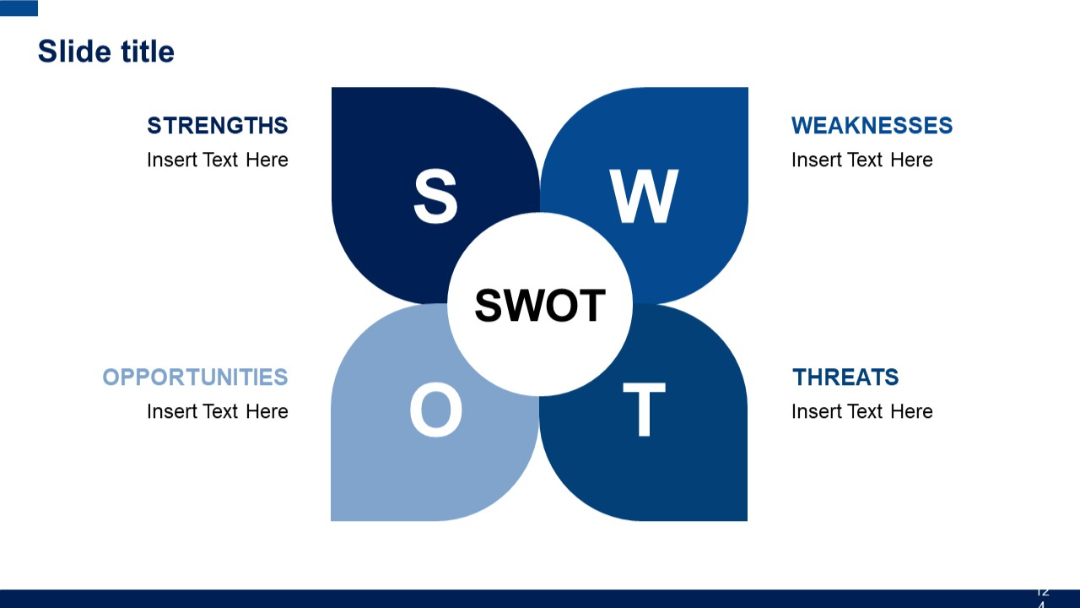
Flower-petal-style SWOT diagram with four rounded quadrants around a central circle labeled "SWOT". Bold blue color scheme.
PRO
Horizontal stacked purple bars with white circular icons on the left for bullet points. Bold and clean.
PRO
Four-part ring layout with quadrant division and light center, using icons and bold colors.

PRO
Simple title slide with large section number "03" and title "Graphic Slides" over a green gradient background.

PRO
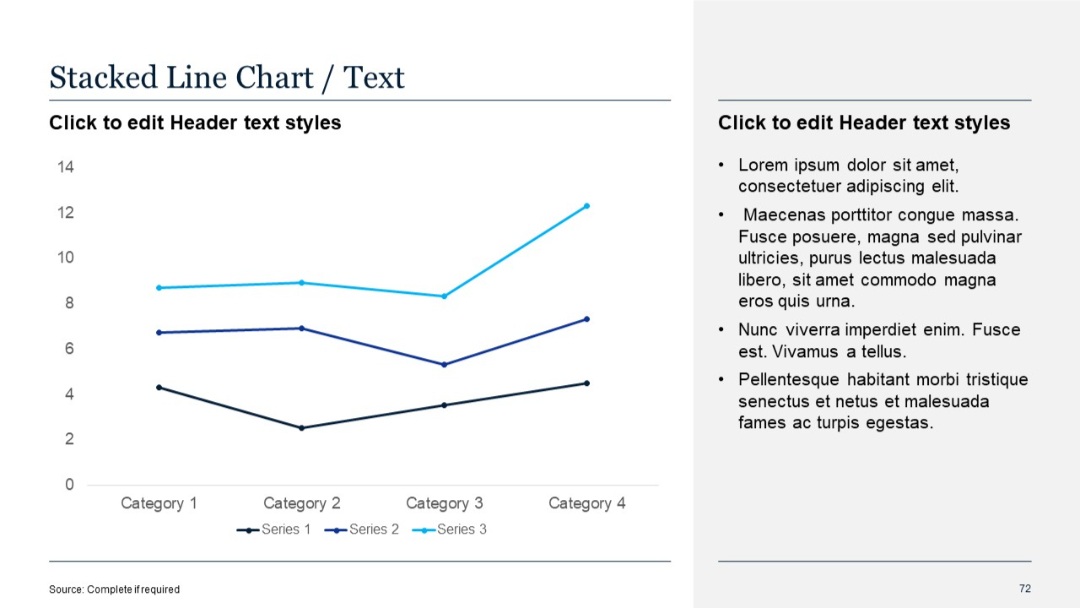
Similar split layout; features a stacked line chart on the left and bullet text on the right. Uses different line colors to represent three series.
PRO
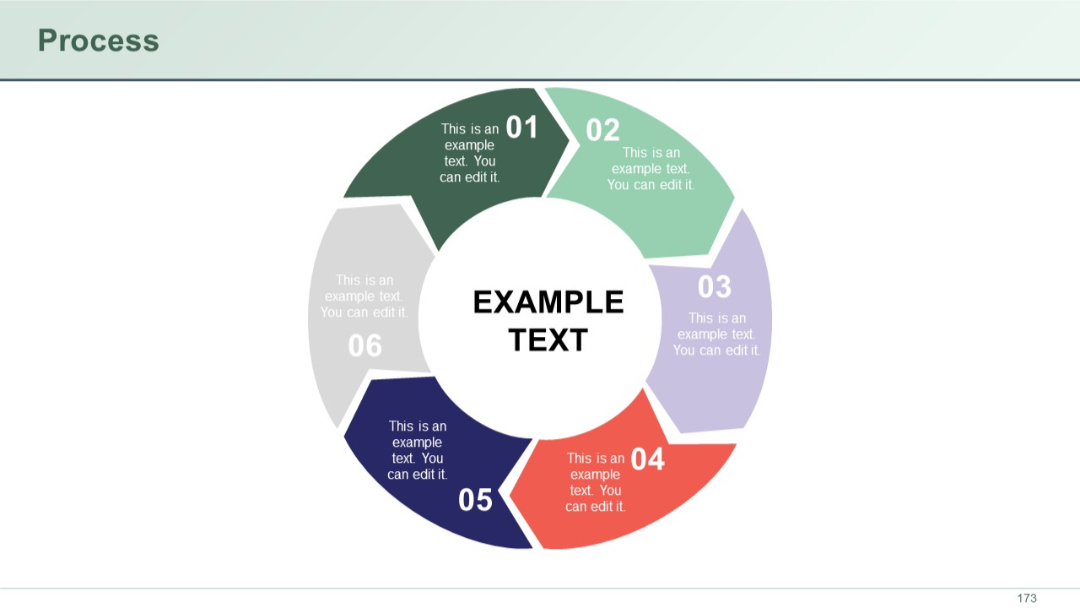
Circular radial diagram with six arrow-shaped segments surrounding a central circle labeled "Example Text."
PRO
Left: world map with heat shading; Right: horizontal bar chart comparing values across four categories.
PRO
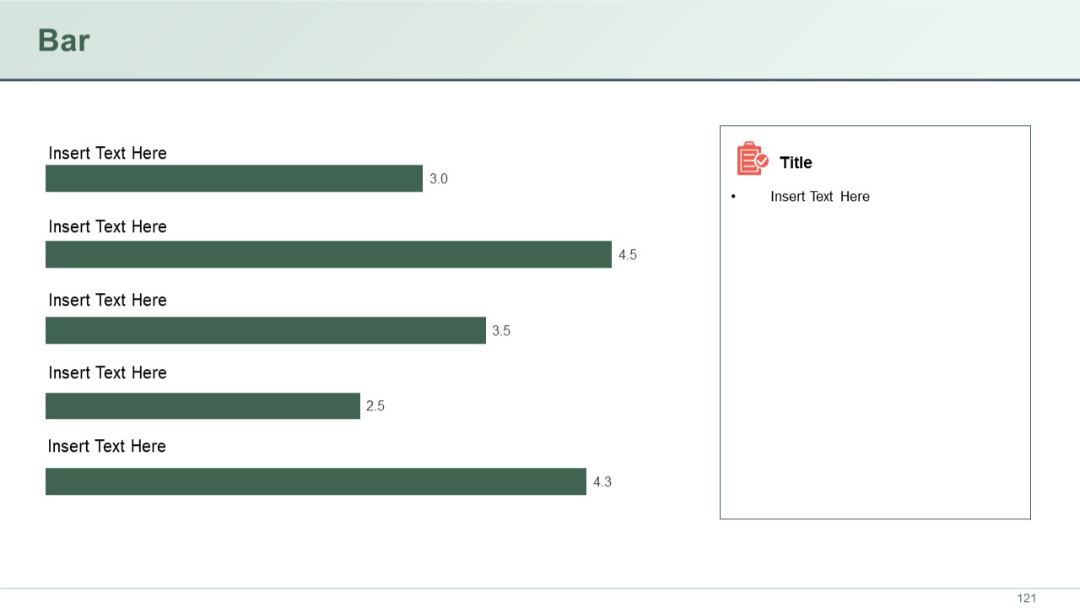
Left-aligned horizontal bar chart with five dark green bars of varying lengths and numerical labels. Right panel with icon and placeholder text.
PRO
Dark blue background with wave pattern at bottom right; large slide number and subtitle in white text, aligned left.

PRO
Semi-circular three-part arc diagram with a central circular heading. Text boxes and icons surround the arcs.

PRO
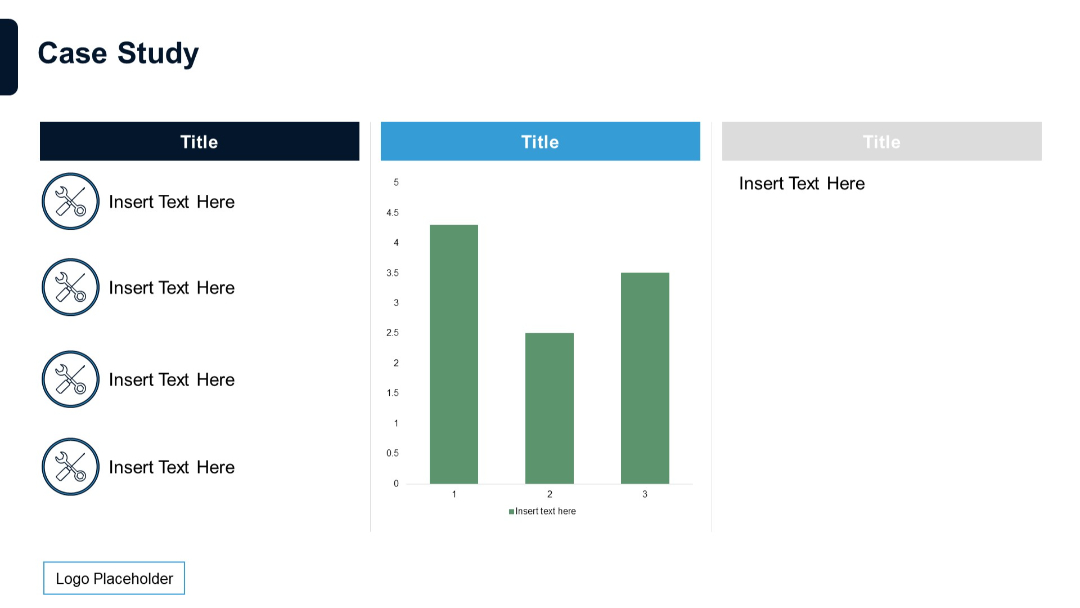
Split layout with three columns: icon-based bullet list, central bar chart, and a faded section with placeholder text.
PRO
Full image background with lower-third text overlay and icon; clean and modern layout.

PRO
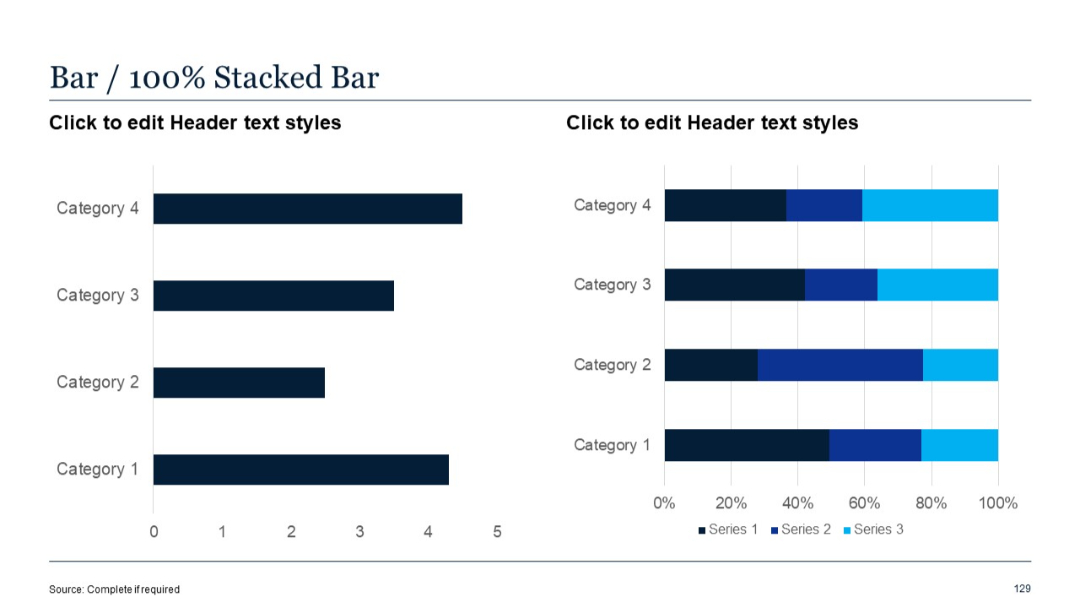
Left: simple bar chart; Right: 100% stacked bar chart. Bars are horizontal with three-color series breakdown.
PRO
Four icons connected by right-facing arrows indicating flow or progression. Headings and descriptive text below each icon.
PRO
Vertical circular icons numbered 1 to 4, each linked below a larger header circle. Text placed beneath each number.
PRO
List of 5 items with gear-shaped icons numbered 01–05 on the left. Each item has a bolded title and description text.
PRO
Two-row, two-column grid with horizontal color-coded bars and circular icons to the left of each header.