My Account
My Slides
Search by Category
Companies
Slide Type
Use Case
Industry
Pricing
Templates
View All Templates
Download Template Slides
✦ AI
AI Prompt Library
AI Search
Feedback
Login
Logout
Get Started
Browse all Slides
Browse all Slides
Create a FREE Account
Instant access to 1,000+ real slides from top companies like McKinsey, BCG, Goldman Sachs, Google and many more!
First Name
Last Name
Email
Password
I agree to all
Terms & Privacy Policy
Thank you! Your submission has been received!
Oops! Something went wrong while submitting the form.
Have an account?
Sign in
Saved Slides
Total No. of slides saved
0
↻ Refresh
✖ Clear all
Includes a column chart showing NNA generation since end-2015 and bullet points detailing collaboration highlights with Private Banking.
Strategic Planning
Financial Services
The slide emphasizes the importance of collaboration with Private Banking, showcasing significant asset generation and outlining strategic priorities for growth.
Collaboration, Private Banking, NNA, Asset Generation, Strategic Priorities
false
Strategic Planning
Financial Services
Mixed Chart
Credit Suisse
Add to my slides
Remove from favorites
This slide features an image of people collaborating over a tablet on the right, with the rest of the slide divided into text sections. The layout is clean, with white text on a red background for the headings and black text for the body. The image is captioned, contributing to the overall narrative.
Regulatory and Compliance
Government & Public Sector
Discusses the collaborative investments in R&D for the Tempest program and its implications for technological development and defense, suitable for presentations on government-industry partnerships and investment strategies.
Collaboration, R&D, Defense Technology, Investment, Government-Industry Partnerships
false
Regulatory and Compliance
Government & Public Sector
Vertical Flow
PwC/Strategy&
Add to my slides
Remove from favorites
Displays pie charts to show the percentages of buyers purchasing different categories of products in collaborations.
Product and Service Analysis
Retail & E-commerce
Details top-purchased product categories in luxury brand collaborations, such as handbags and sneakers.
Collaborations, luxury products, purchasing behavior, handbags, sneakers, consumer preferences, top products
false
Product and Service Analysis
Retail & E-commerce
Multiple Chart
BCG
Add to my slides
Remove from favorites
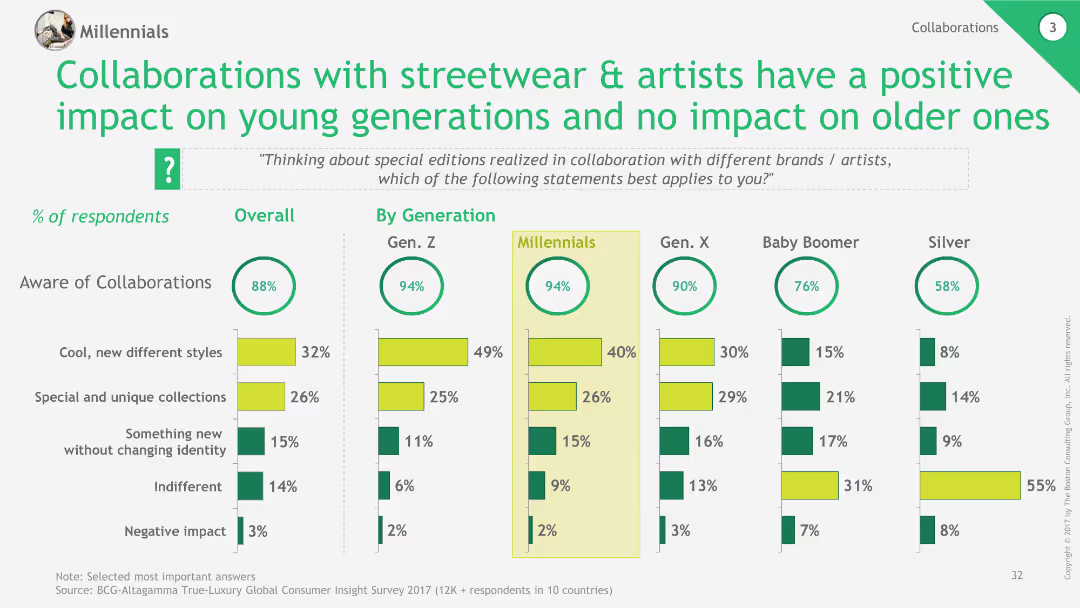
Column charts showing awareness and perceptions of collaborations by generation, with positive impact noted for younger generations.
Market Analysis and Trends
Retail & E-commerce
This slide discusses the impact of collaborations with streetwear and artists on different generations, highlighting positive reception among younger consumers.
collaborations, streetwear, generational impact, luxury, retail
false
Market Analysis and Trends
Retail & E-commerce
Multiple Chart
BCG
Add to my slides
Remove from favorites
The slide features icons and percentages indicating types of stakeholders companies are collaborating with, set against a green background.
Strategic Planning
Agriculture & Food Production
Discusses current collaborations in the food ecosystem, noting primary collaborations with suppliers and producers, followed by academia and government. Relevant for studies on ecosystem management.
Collaboration, Stakeholders, Suppliers, Producers, Ecosystem Management
false
Strategic Planning
Agriculture & Food Production
Multiple Chart
Deloitte
Add to my slides
Remove from favorites
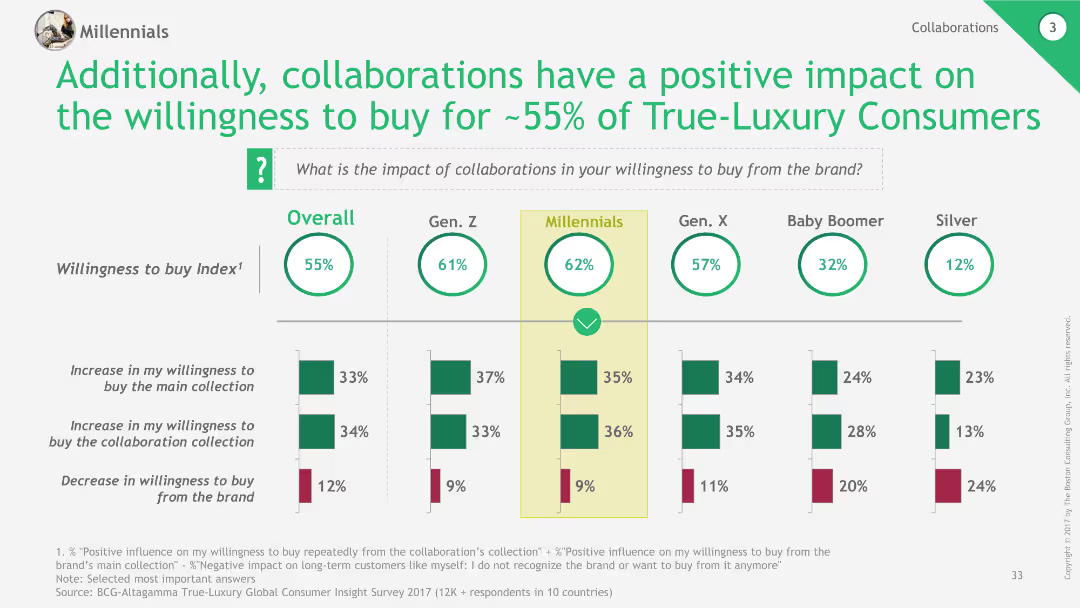
Column chart illustrating the impact of collaborations on willingness to buy among True-Luxury Consumers, segmented by generation.
Market Analysis and Trends
Retail & E-commerce
The slide highlights the positive influence of brand collaborations on consumers' willingness to buy, particularly among younger generations.
collaborations, willingness to buy, luxury, consumer behavior, retail
false
Market Analysis and Trends
Retail & E-commerce
Multiple Chart
BCG
Add to my slides
Remove from favorites
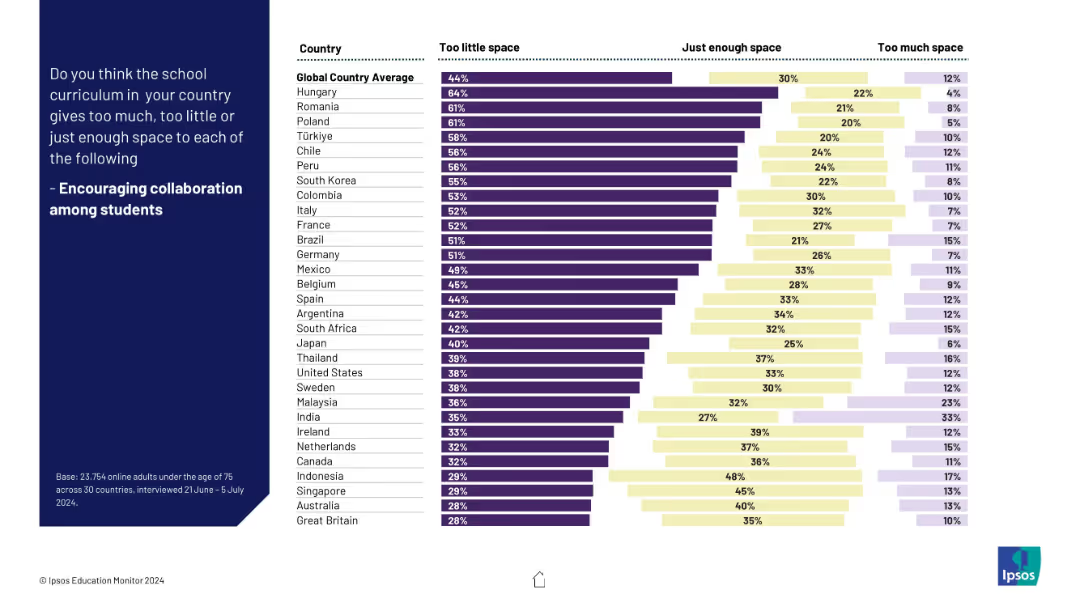
Horizontal bar chart with three color segments per country; ordered by “Too little space” ranking.
Market Analysis and Trends
Education & Training
The slide ranks countries based on how much space the public thinks is given to fostering collaboration in education. A majority feel collaboration is not emphasized enough, with wide disparity between nations.
collaboration, teamwork, education policy, global survey, classroom practices, curriculum gaps, student interaction, Ipsos, education trends
false
Market Analysis and Trends
Education & Training
Mixed Chart
IPSOS
Add to my slides
Remove from favorites
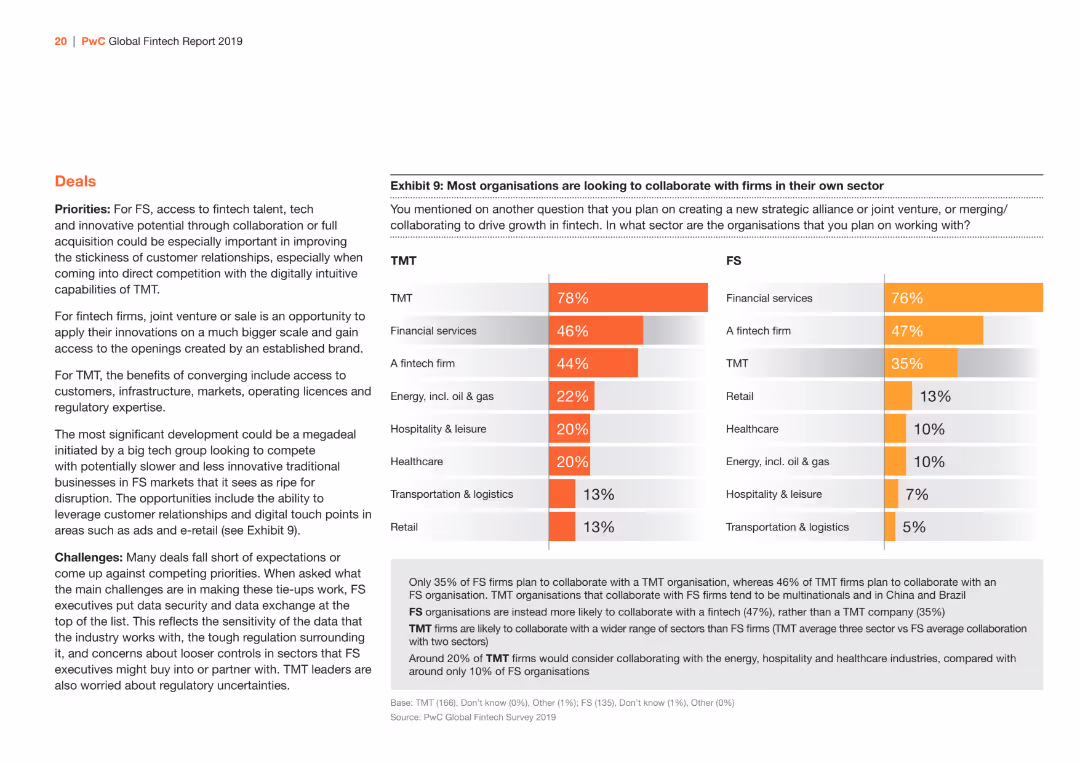
The slide presents two column charts side by side, depicting collaboration preferences of TMT and FS organizations in their sectors. The bars are in orange and gray shades for differentiation.
Strategic Planning
Financial Services
It highlights sectors where TMT and FS organizations are looking to collaborate, showing percentages for various industries like TMT, financial services, and fintech.
Collaboration, TMT, FS, Sectors, Strategic, Graph
false
Strategic Planning
Financial Services
Multiple Chart
PwC/Strategy&
Add to my slides
Remove from favorites
A bar graph slide with horizontal bars of varying lengths indicating levels of focus on different types of work and collaboration. The background is clean, allowing the graph and the descriptive text on the left to stand out. The use of grayscale with selective yellow highlights creates visual interest.
Organizational Structure and Change
Professional Services
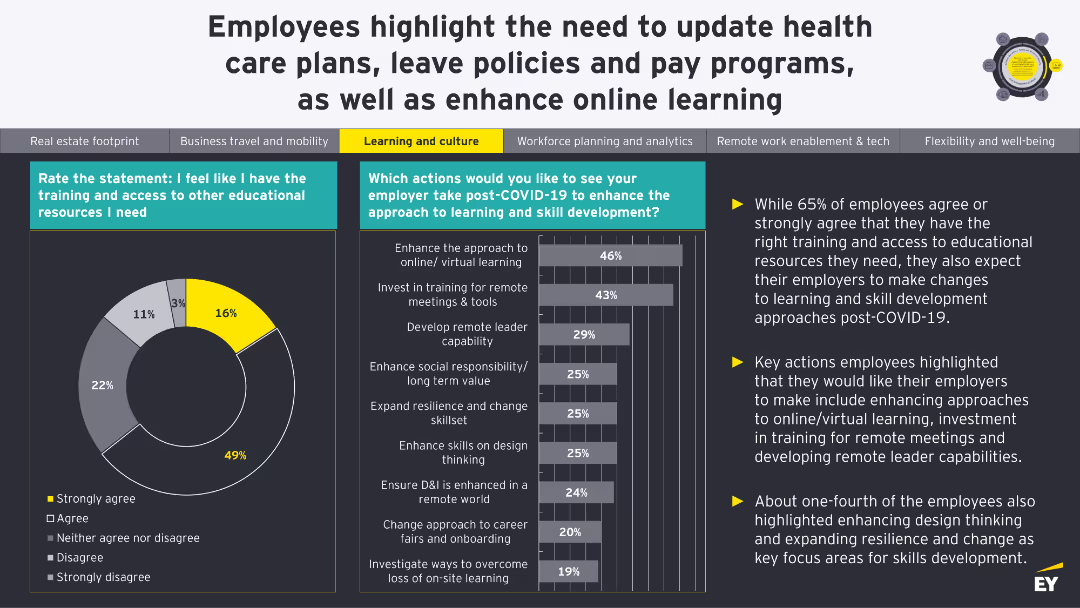
This slide examines shifts in collaboration and independent work trends over the past two years. It employs a bar graph to display the proportionate change in focus, serving as an analytical tool for companies reassessing their collaborative practices in light of remote and hybrid work experiences.
Collaboration, Trends, Remote Work, Hybrid Work, Organizational Change
false
Organizational Structure and Change
Professional Services
Single Chart
EY
Add to my slides
Remove from favorites
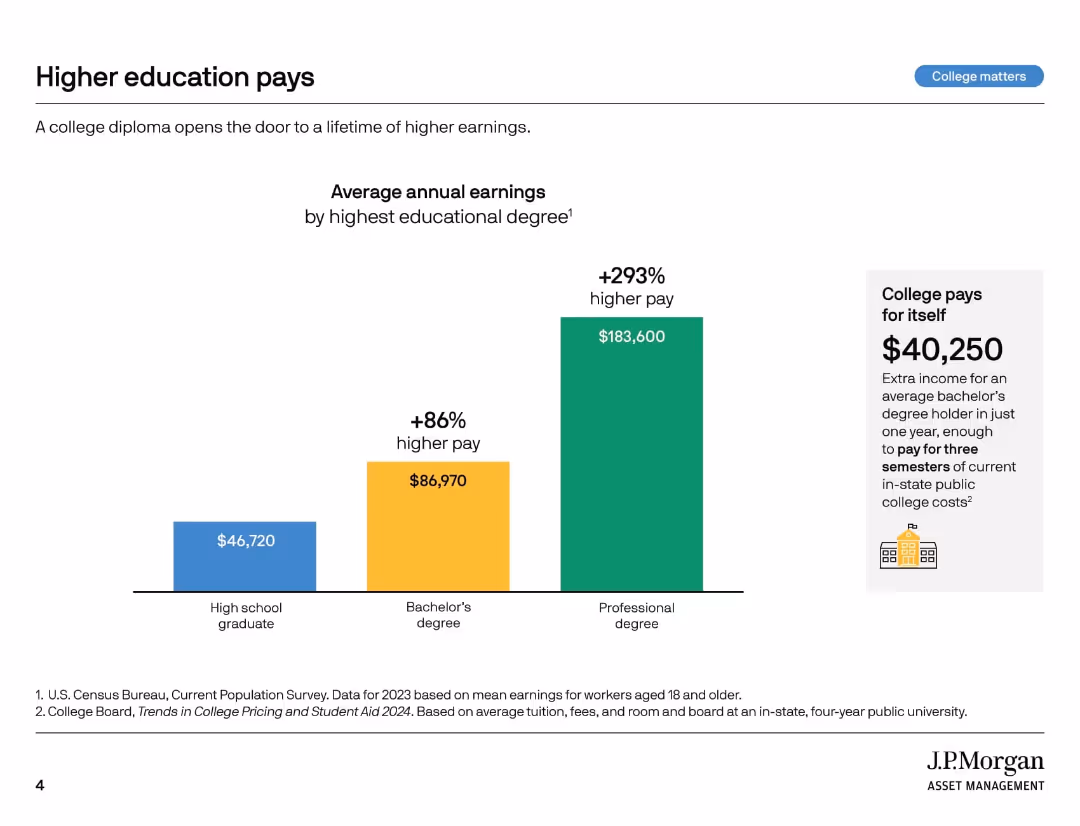
Bar chart with 3 vertical bars comparing average earnings by education level. Callout box emphasizes return on investment.
Market Analysis and Trends
Education & Training
This slide demonstrates how higher education levels correlate with increased earnings, emphasizing that a college degree provides a financial return. A bachelor's degree results in 86% higher pay, and the earnings from a professional degree are even greater.
college earnings, higher education, income comparison, ROI, degree value, pay gap, tuition payoff, bachelor’s degree, professional degree, education benefits
false
Market Analysis and Trends
Education & Training
Mixed Chart
JP Morgan
Add to my slides
Remove from favorites
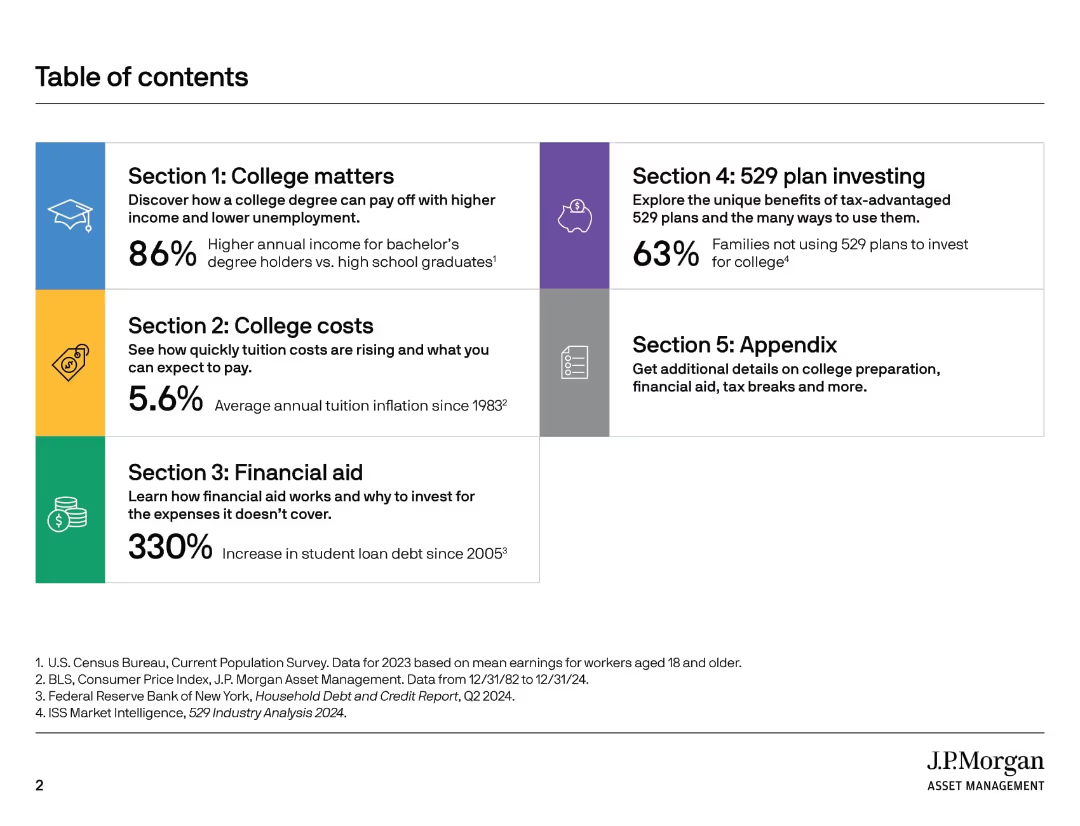
A clean grid layout with five colored blocks indicating major sections. Icons and large font percentages highlight key points.
Strategic Planning
Education & Training
The table of contents outlines five major sections of a presentation related to college education topics, including cost, value, financial aid, and tax-advantaged plans. It uses icons and stats to preview each section's key theme.
college planning, education cost, financial aid, 529 plans, presentation guide, tuition inflation, student loans, college value, savings plan, income statistics
false
Strategic Planning
Education & Training
Agenda
JP Morgan
Add to my slides
Remove from favorites
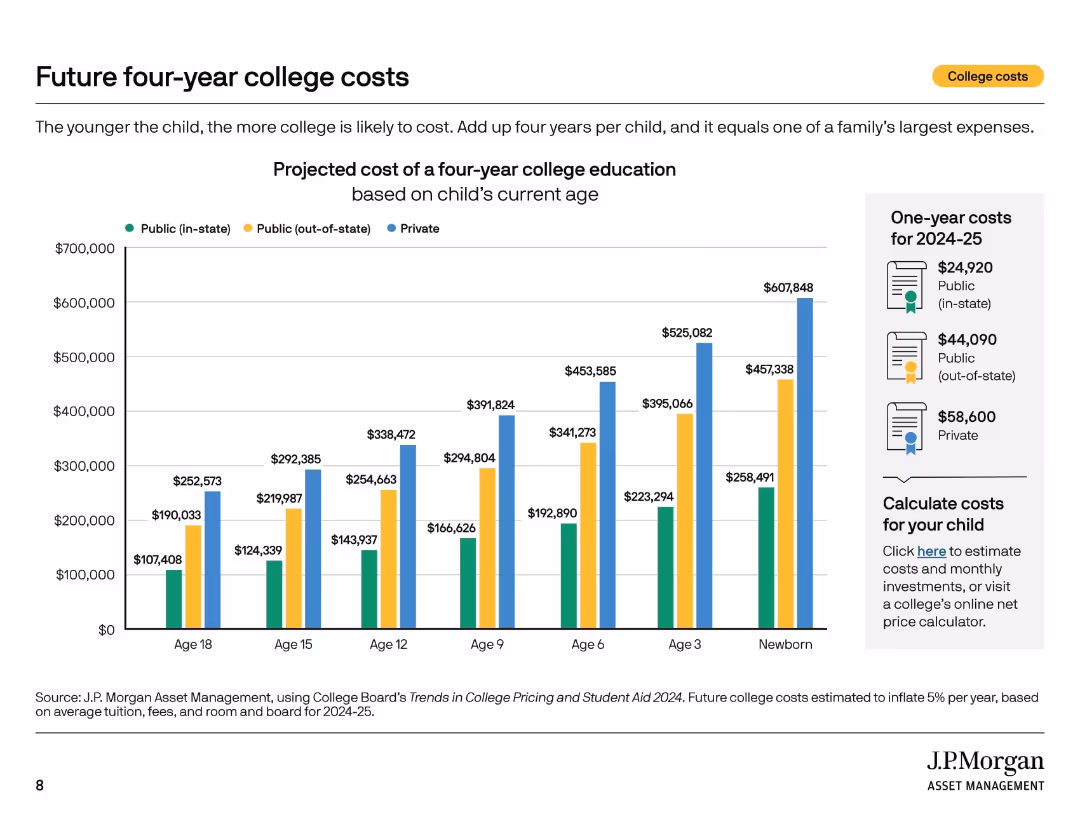
Multi-bar chart displaying projected college costs by child’s current age and institution type. Sidebar includes one-year cost summary.
Strategic Planning
Education & Training
This slide presents the projected cost of four-year college education, showing how costs increase for younger children. It breaks down expenses by public in-state, public out-of-state, and private institutions, with estimates through college entry age.
college projections, education savings, tuition planning, cost forecast, child age, public vs private, higher education cost, inflation, future planning
false
Strategic Planning
Education & Training
Mixed Chart
JP Morgan
Add to my slides
Remove from favorites
Includes four vertical column charts in varying shades of green, showing importance rankings of different factors in college selection from two student groups.
Human Resources and Talent Management
Education & Training
Demonstrates what factors students consider important when selecting a college, with a focus on the differences between first-gen and continuing-gen students.
college selection, students, factors, first-gen, preferences
false
Human Resources and Talent Management
Education & Training
Multiple Chart
BCG
Add to my slides
Remove from favorites
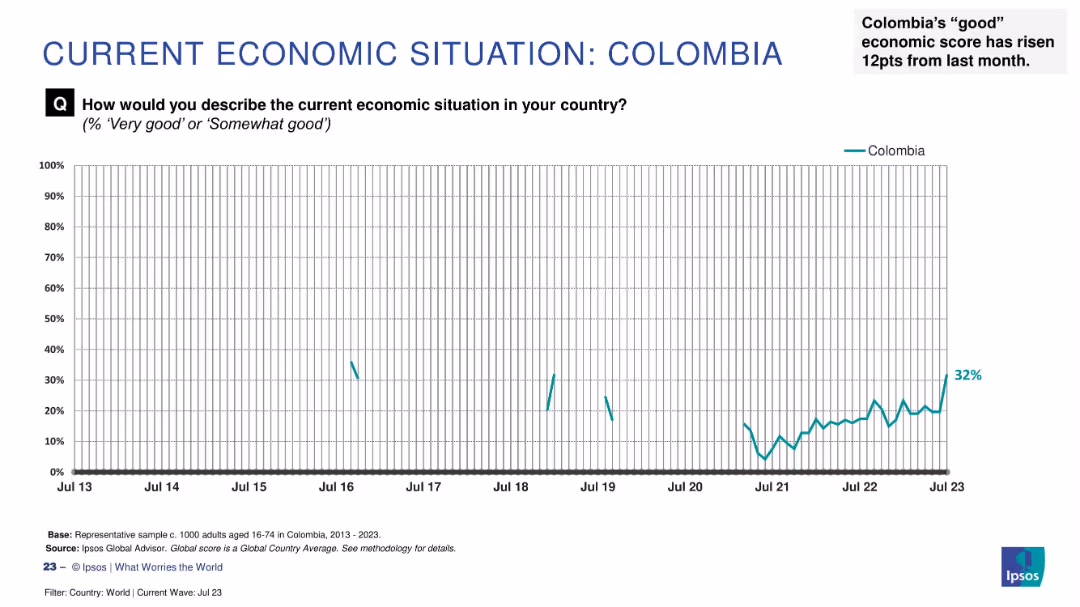
Line graph showing sentiment trend from 2013 to July 2023, marked with latest score (32%) and key annotation.
Market Analysis and Trends
Financial Services
The slide tracks public perception of Colombia’s economic situation over a decade, emphasizing a sharp 12-point rise in July 2023, the most significant increase across surveyed countries that month.
Colombia, economic perception, Ipsos, trend analysis, public sentiment, 2023 data, line chart, economic optimism, monthly change, economic outlook
false
Market Analysis and Trends
Financial Services
Single Chart
IPSOS
Add to my slides
Remove from favorites
The slide features three charts: one column chart for real GDP, and two line charts for consumption and investment, and international trade data.
Market Analysis and Trends
Financial Services
This slide offers a snapshot of Colombia's economy, covering real GDP growth, consumption and investment patterns, and international trade statistics as of 4Q23.
Colombia, economic snapshot, GDP, consumption, investment, trade
false
Market Analysis and Trends
Financial Services
Multiple Chart
JP Morgan
Add to my slides
Remove from favorites
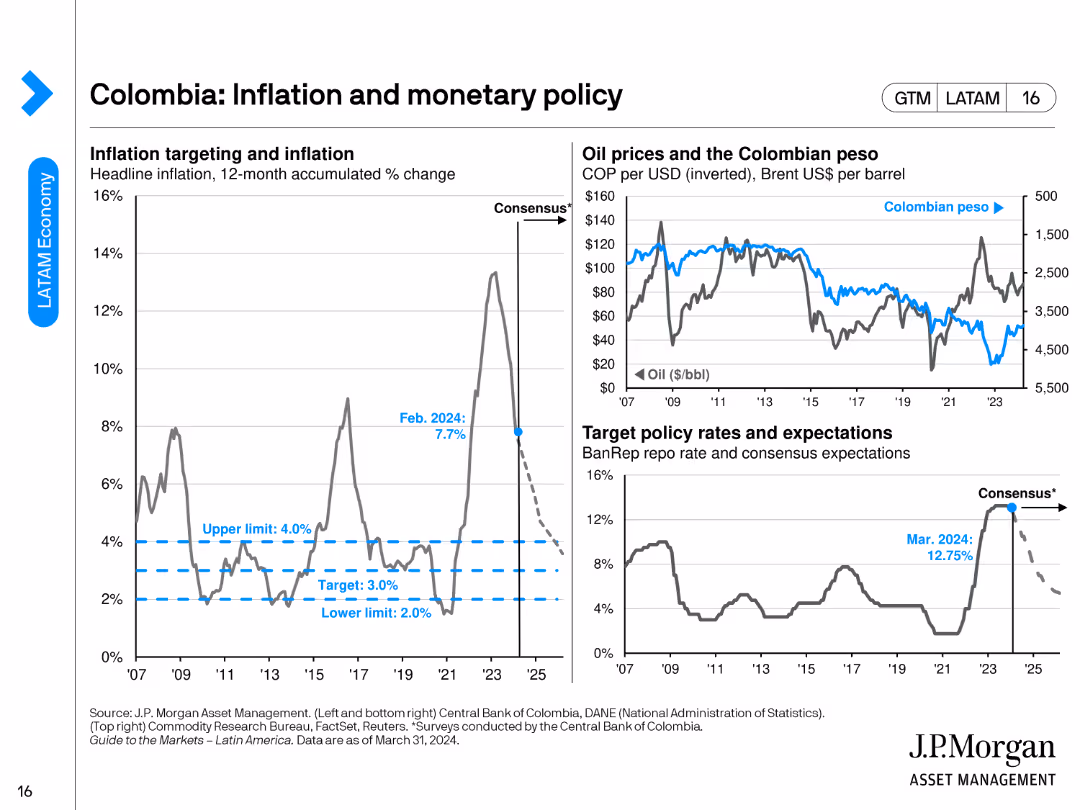
The slide includes three charts: a line chart for inflation targeting, another for oil prices vs. the Colombian peso, and a chart for target policy rates.
Regulatory and Compliance
Financial Services
This slide discusses Colombia's inflation and monetary policy, highlighting inflation targeting, oil prices, and target policy rates as of February 2024.
Colombia, inflation, monetary policy, oil prices, policy rates
false
Regulatory and Compliance
Financial Services
Multiple Chart
JP Morgan
Add to my slides
Remove from favorites
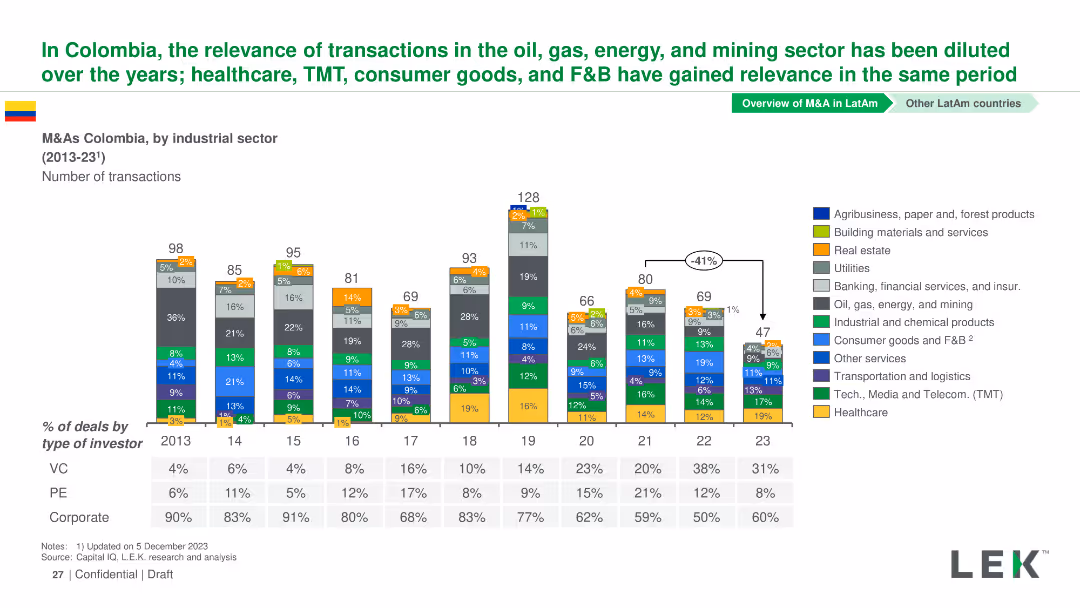
Column chart showing the number of M&A transactions by industrial sector in Colombia from 2013-2023. Sectors are color-coded and detailed in a legend.
Market Analysis and Trends
Financial Services
This slide analyzes M&A transactions in Colombia by industrial sector from 2013-2023, noting the rise in sectors like healthcare and TMT.
Colombia, M&A, Industrial Sectors, Transactions, Trends
false
Market Analysis and Trends
Financial Services
Mixed Chart
LEK
Add to my slides
Remove from favorites
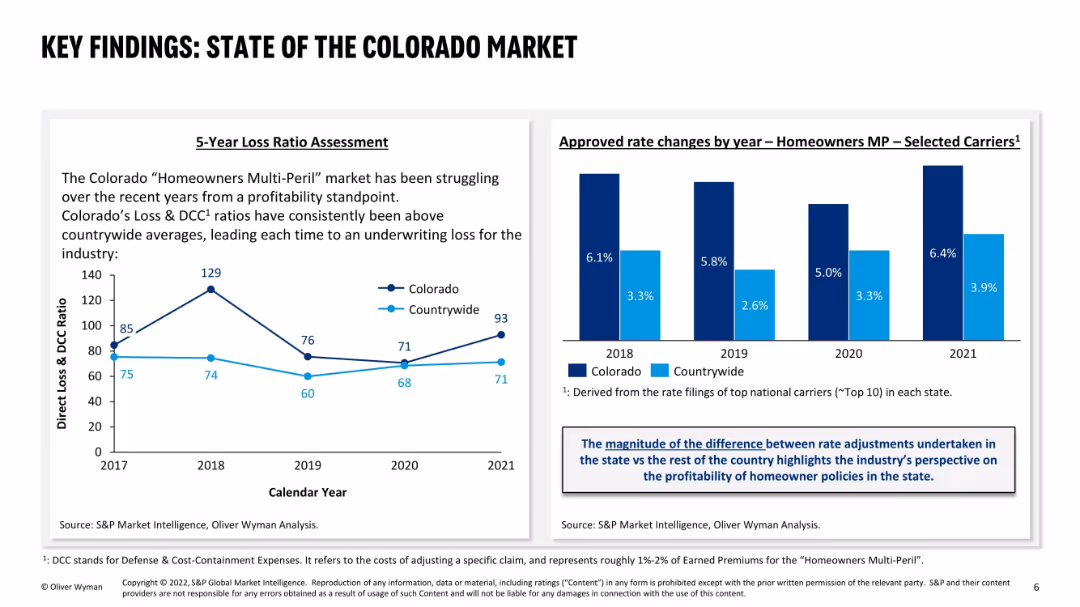
Two-column layout: left side has a 5-year loss ratio line graph; right side has a bar graph of approved rate changes; uses dark and light blue for comparison between Colorado and countrywide; includes explanatory text boxes.
Market Analysis and Trends
Financial Services
This slide evaluates Colorado’s “Homeowners Multi-Peril” insurance market, revealing persistent underwriting losses due to higher loss ratios compared to national averages. It also shows a consistent trend of higher rate increases in Colorado, reflecting industry efforts to offset losses.
Colorado market, loss ratio, homeowners insurance, rate changes, underwriting loss, profitability, MP, state comparison, DCC, carrier performance
false
Market Analysis and Trends
Financial Services
Multiple Chart
Oliver Wyman
Add to my slides
Remove from favorites
Map-focused slide with minimal text, showing wildfire risk areas overlaid on a geographic map of Colorado. Emphasis on populated corridors.
Risk Assessment and Management
Environmental Services & Sustainability
Displays the eastern wildfire risk band in Colorado, emphasizing how close it runs to densely populated areas such as Denver and Colorado Springs. This visual highlights the spatial risk proximity between wildfire-prone zones and urban populations.
Colorado, wildfire, risk map, population, Denver, Colorado Springs, GIS
false
Risk Assessment and Management
Environmental Services & Sustainability
Graphic
Oliver Wyman
Add to my slides
Remove from favorites
A column chart showing the percentage of companies that have provided cybercrime training to employees in the last 12 months across various countries.
Risk Assessment and Management
Technology & Software
The slide shows data on the prevalence of cybercrime training in companies over the past year, broken down by country.
column chart, companies, training, cybercrime, awareness, survey, Europe
false
Risk Assessment and Management
Technology & Software
Single Chart
IPSOS
Add to my slides
Remove from favorites
A column chart with various color-coded segments indicating employees' awareness of cybercrime risks in SMEs across different countries.
Risk Assessment and Management
Technology & Software
The slide evaluates employees' awareness of cybercrime risks in SMEs, showing data for various European countries.
column chart, employees, cybercrime, awareness, SMEs, survey, Europe
false
Risk Assessment and Management
Technology & Software
Single Chart
IPSOS
Add to my slides
Remove from favorites
A column chart comparing current online privacy concerns to one year ago across various global regions, indicating changes in concern levels.
Risk Assessment and Management
Technology & Software
The slide assesses the change in online privacy concerns over the past year in different regions, showing the percentage increase or decrease.
column chart, online privacy, concern, comparison, regions, survey, global
false
Risk Assessment and Management
Technology & Software
Single Chart
IPSOS
Add to my slides
Remove from favorites
A column chart showing the concern levels about online privacy across different regions, with a focus on the percentages of very concerned and somewhat concerned.
Risk Assessment and Management
Technology & Software
The slide highlights global concerns about online privacy, comparing regions such as LATAM, Middle East, APAC, and Europe.
column chart, online privacy, concern, regions, survey, global
false
Risk Assessment and Management
Technology & Software
Single Chart
IPSOS
Add to my slides
Remove from favorites
A column chart displaying the factors contributing to increased online privacy concerns, including cyber criminals, internet companies, and governments.
Risk Assessment and Management
Technology & Software
The slide explores various factors that have heightened online privacy concerns, with data segmented by different influencing factors.
column chart, online privacy, concerns, factors, survey, global
false
Risk Assessment and Management
Technology & Software
Single Chart
IPSOS
Add to my slides
Remove from favorites
A column chart with multiple color-coded segments representing varying levels of cybercrime awareness among SMEs across different countries.
Risk Assessment and Management
Technology & Software
The slide surveys SMEs' awareness levels about cybercrime risks, highlighting differences across various European countries.
column chart, SMEs, cybercrime, awareness, survey, Europe
false
Risk Assessment and Management
Technology & Software
Single Chart
IPSOS
Add to my slides
Remove from favorites
The slide displays a combined pie chart and bar graph, accompanied by bullet points to the left that provide context and explain the visual data.
Market Analysis and Trends
Industrial & Manufacturing
Analyzes the overall economic contribution of Combat Air activities, including the Tempest programme, to the UK economy.
Combat Air, GVA, Economic Contribution, Tempest Programme, Pie Chart
false
Market Analysis and Trends
Industrial & Manufacturing
Mixed Chart
PwC/Strategy&
Add to my slides
Remove from favorites
The layout includes a title and two columns of text, one for economic contribution details and the other for graphic representation of the same. The design is streamlined, with clear differentiation between sections.
Financial Performance
Government & Public Sector
Provides a comprehensive breakdown of the economic contributions of the Tempest partners’ activities, focusing on job creation and GVA contributions, making it apt for discussions on economic strategies in defense and related financial planning.
Combat Air, Tempest, GVA, Jobs, Economic Strategy, Defense
false
Financial Performance
Government & Public Sector
Text Only
PwC/Strategy&
Add to my slides
Remove from favorites
A diagrammatic slide with labeled tech clusters indicating their roles as Infrastructure, Enablers, and Applications. Uses a simple black and white scheme for a professional, analytical look.
Strategic Planning
Technology & Software
This slide demonstrates the exponential growth due to the combinatorial effects of technology across industries. It helps in understanding how the convergence of various tech advancements enables new business models and innovation, making it essential for strategic discussions about technological investments and industry evolution.
Combinatorial Effects, Technology, Growth, Innovation, Business Models, Investment, Industry Evolution
false
Strategic Planning
Technology & Software
Framework
McKinsey
Add to my slides
Remove from favorites
The slide includes a column chart comparing the combined ratios for different insurance segments between 2017 and 2018. Color-coded for clarity.
Financial Performance
Financial Services
Analyzes profitability in insurance sectors, showing loss making trends despite rate increases. Focuses on segments like Reinsurance and Property for detailed assessment.
combined ratio, profitability, insurance segments, 2018, loss making
false
Financial Performance
Financial Services
Mixed Chart
PwC/Strategy&
Add to my slides
Remove from favorites
Slide shows multiple bar charts comparing "Commerce laggards" and "Commerce leaders" across various aspects of commerce.
Technology and Digital Transformation
Retail & E-commerce
Slide presents comparative data on multi-channel selling, purchase processes, and customer feedback among commerce leaders and laggards.
commerce, multi-channel, customer feedback, purchase process, bar chart
false
Technology and Digital Transformation
Retail & E-commerce
Multiple Chart
BCG
Add to my slides
Remove from favorites
The slide has a central blue graphic with three sections describing aspects of commerce platforms, purchasing power, and benefits spend, with logos of partner companies.
Financial Performance
Technology & Software
Highlights the value delivered through commerce platforms and partnerships, focusing on customer purchasing power and strategic benefits.
commerce platforms, purchasing power, partnerships, financial value, customer engagement, proprietary platforms
false
Financial Performance
Technology & Software
Diagram
JP Morgan
Add to my slides
Remove from favorites
A column chart showcases commercial work done in Australia from FY07 to FY25 with actual data and projections. The chart includes annotations and a legend explaining scenario colors.
Market Analysis and Trends
Real Estate & Construction
Analyzes the growth trends in the Australian commercial sector, projecting future activities and the influence of economic changes on market conditions.
commercial, Australia, growth trends, projections, economic changes
false
Market Analysis and Trends
Real Estate & Construction
Mixed Chart
Deloitte
Add to my slides
Remove from favorites
This slide is text-heavy, balanced with icons on the left and detailed bullet points on the right, highlighting key aspects of a business model in commercial banking. The layout is clean and uses corporate blue and grey tones.
Strategic Planning
Financial Services
It outlines the strengths of the commercial banking business model, with focus areas such as client focus, industry leadership, and strong financial performance. The slide can be used in strategic business discussions or presentations to investors to showcase the bank's positioning and strategy.
commercial banking, business model, client focus, financial performance, strategy, industry leadership
false
Strategic Planning
Financial Services
Table
JP Morgan
Add to my slides
Remove from favorites
Texts with adjacent icons, highlighting various strategies and achievements of J.P.Morgan's Commercial Banking division.
Operational Efficiency
Financial Services
Emphasizes J.P.Morgan's strategies in client franchise expansion, innovation, enhancing client experience, and financial results. Aimed at showcasing business strategies and operational excellence.
commercial banking, client franchise, innovation, client experience, data-driven, team empowerment, financial results, ROE
false
Operational Efficiency
Financial Services
Header Vertical
JP Morgan
Add to my slides
Remove from favorites
This slide features six sections, each with an icon, a heading, and bullet points. The layout is balanced, with two columns.
Financial Performance
Financial Services
The slide outlines key strategic pillars for commercial banking, such as global reach and investment results, aiming to showcase competitive advantages and growth strategies of JPMorgan Chase.
commercial banking, strategy, growth, investment, JPMorgan
false
Financial Performance
Financial Services
Header Vertical
JP Morgan
Add to my slides
Remove from favorites
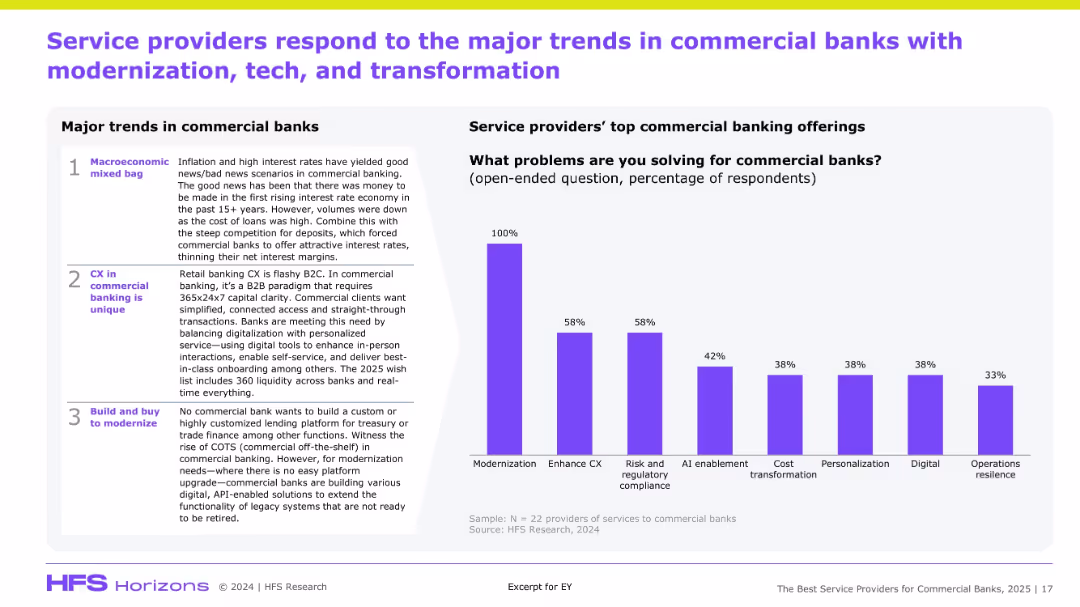
Two-column layout: left has major trends, right has a bar chart of service offerings; clean structured design with clear sectioning.
Market Analysis and Trends
Financial Services
This slide highlights the key commercial banking trends—macroeconomic conditions, unique CX needs, and modernization demands. The right-hand chart displays what banks expect from service providers, with modernization, CX enhancement, and regulatory compliance topping the list. The goal is to map demand signals from banks to vendor capabilities.
Commercial banks, modernization, CX, AI, compliance, vendor services
false
Market Analysis and Trends
Financial Services
Mixed Chart
Accenture
Add to my slides
Remove from favorites
Images of mobile devices and graphs represent new client solutions like TravelBank and RTP. Text explains the benefits of each service.
Product and Service Analysis
Financial Services
Discusses innovative solutions offered to commercial clients, focusing on tech-driven management and real-time payments, targeting underrepresented markets and large corporations.
Commercial Clients, TravelBank, RTP
false
Product and Service Analysis
Financial Services
Mixed Chart
Goldman Sachs
Add to my slides
Remove from favorites
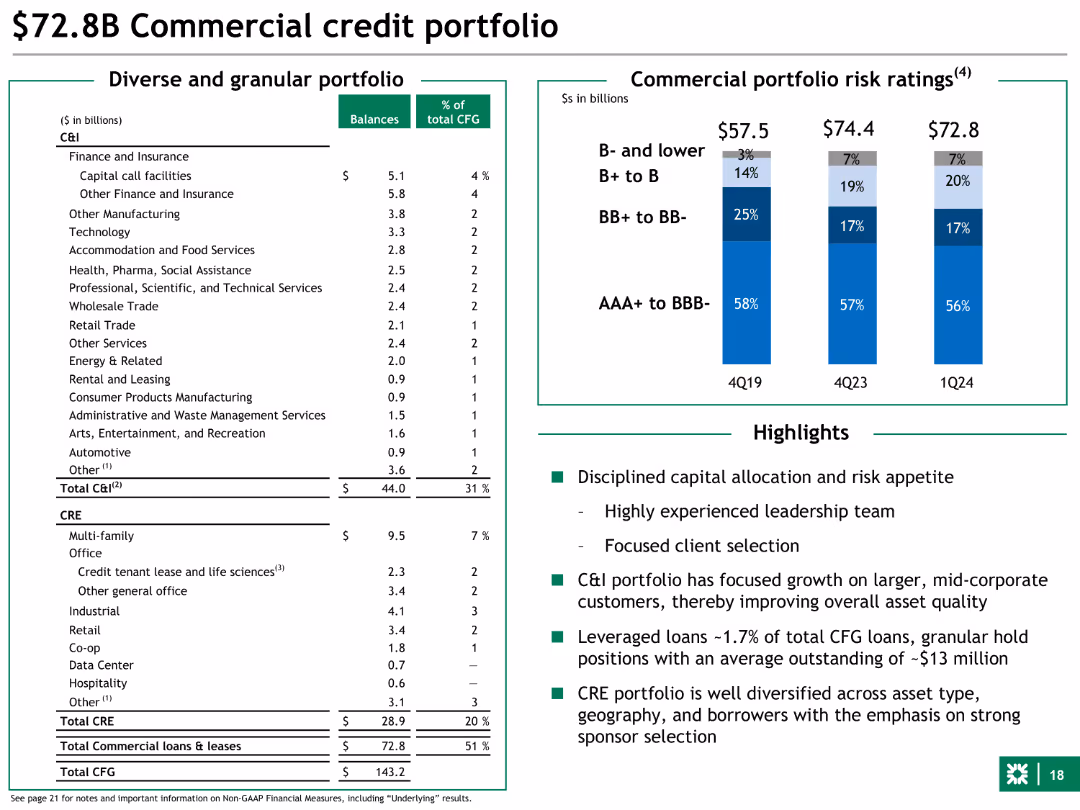
Column chart and tables showing diverse and granular portfolio with balances. Includes risk ratings and highlights key points. Uses green for emphasis.
Financial Performance
Financial Services
This slide provides an overview of the commercial credit portfolio, highlighting diversification, balances, and risk ratings. It emphasizes disciplined capital allocation.
commercial credit, portfolio, diversification, balances, risk
false
Financial Performance
Financial Services
Mixed Chart
Barclays
Add to my slides
Remove from favorites
Features a pie chart and several bar charts showing job titles, average account premiums, respondents' ages, and years in the insurance industry for commercial lines-focused underwriters.
Market Analysis and Trends
Financial Services
Detailed demographic and financial profile of commercial lines-focused underwriters, covering aspects like job roles, premium sizes, age groups, and industry tenure.
commercial lines, insurance, demographics, job roles, premiums, age distribution, tenure, financial analysis
false
Market Analysis and Trends
Financial Services
Multiple Chart
Accenture
Add to my slides
Remove from favorites
The slide showcases multiple column charts with financial metrics such as invested assets, deposits, loans, and revenues across different business units. It features clear numerical data and graphical elements.
Strategic Planning
Financial Services
It highlights the commercial momentum by presenting key financial metrics, emphasizing growth in invested assets, net new money, and other financial indicators.
commercial momentum, financial metrics, assets, deposits, loans
false
Strategic Planning
Financial Services
Multiple Chart
UBS
Add to my slides
Remove from favorites
Features a column chart presenting commercial work put in place in New Zealand from FY07 to FY25, showcasing actual past data and future estimates under three economic scenarios. Includes a succinct title, annotations, and a color-coded legend.
Market Analysis and Trends
Real Estate & Construction
The slide forecasts commercial work trends in New Zealand, illustrating pre-pandemic levels and future expectations influenced by economic factors, useful for industry stakeholders to assess market conditions.
commercial, New Zealand, trends, forecasts, economic factors
false
Market Analysis and Trends
Real Estate & Construction
Mixed Chart
Deloitte
Add to my slides
Remove from favorites
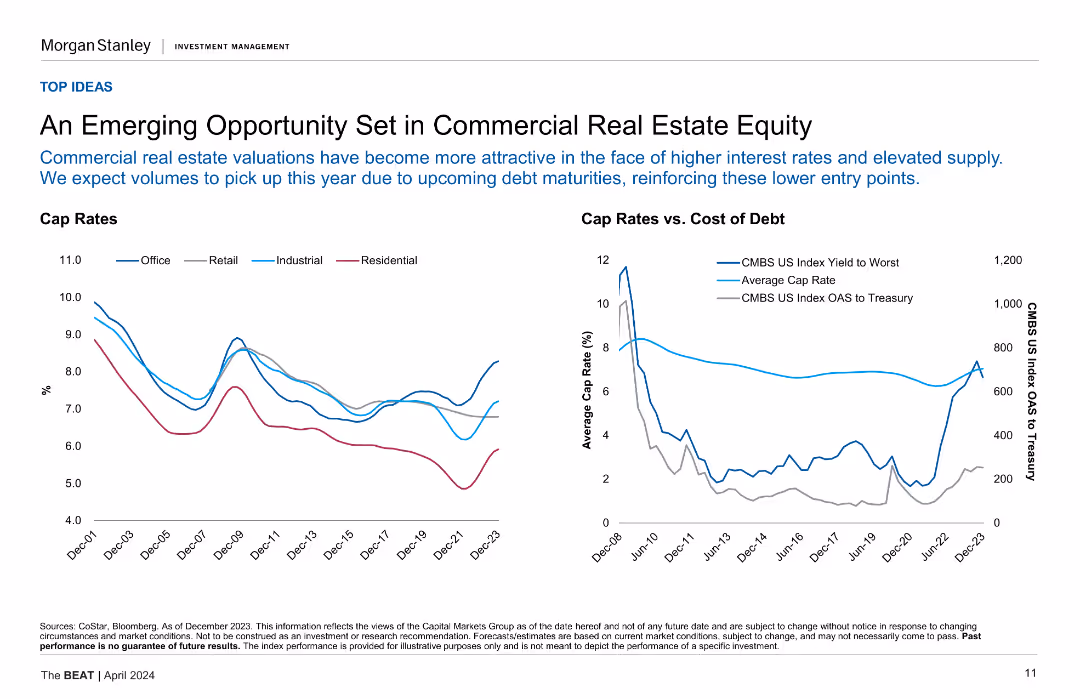
Two line charts showing cap rates for different property types and cap rates vs. cost of debt.
Market Analysis and Trends
Real Estate & Construction
This slide explores the opportunities in commercial real estate equity, highlighting the relationship between cap rates and the cost of debt across various sectors.
Commercial Real Estate, Cap Rates, Cost of Debt, Market Analysis, Opportunities
false
Market Analysis and Trends
Real Estate & Construction
Multiple Chart
Morgan Stanley
Add to my slides
Remove from favorites
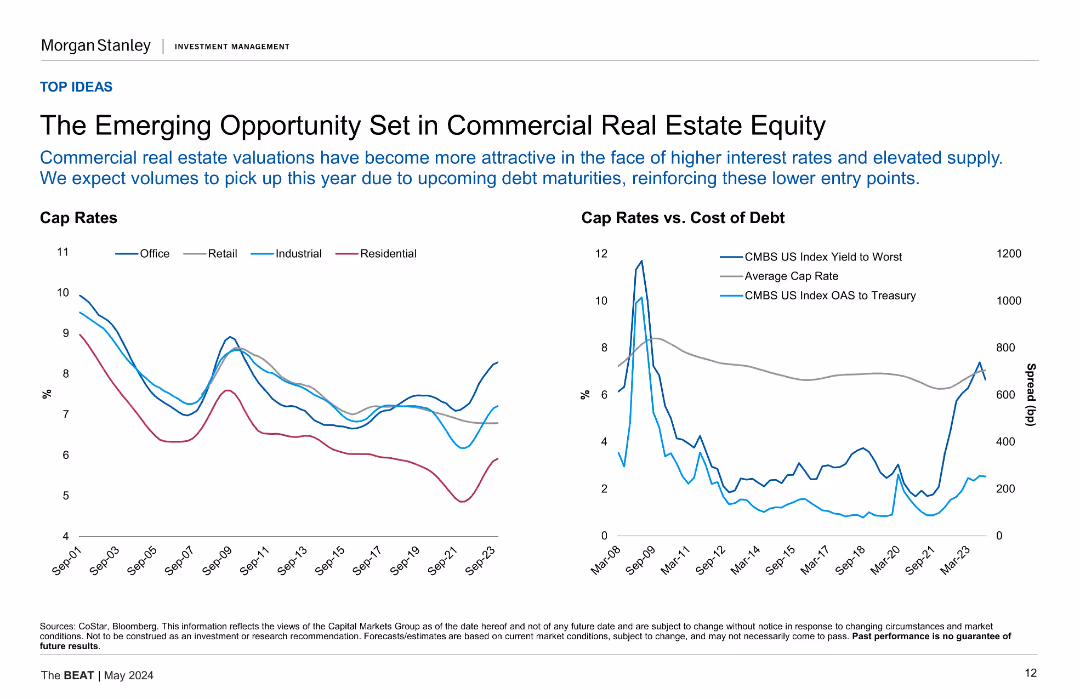
Shows two line charts. The left chart compares cap rates across different property types from September 2001 to September 2023. The right chart shows cap rates versus cost of debt for the same period.
Market Analysis and Trends
Real Estate & Construction
The slide highlights the attractiveness of commercial real estate equity due to higher interest rates and upcoming debt maturities, suggesting increased volumes in the coming year.
Commercial Real Estate, Cap Rates, Debt, Interest Rates, Market Opportunity, Real Estate Investment
false
Market Analysis and Trends
Real Estate & Construction
Multiple Chart
Morgan Stanley
Add to my slides
Remove from favorites
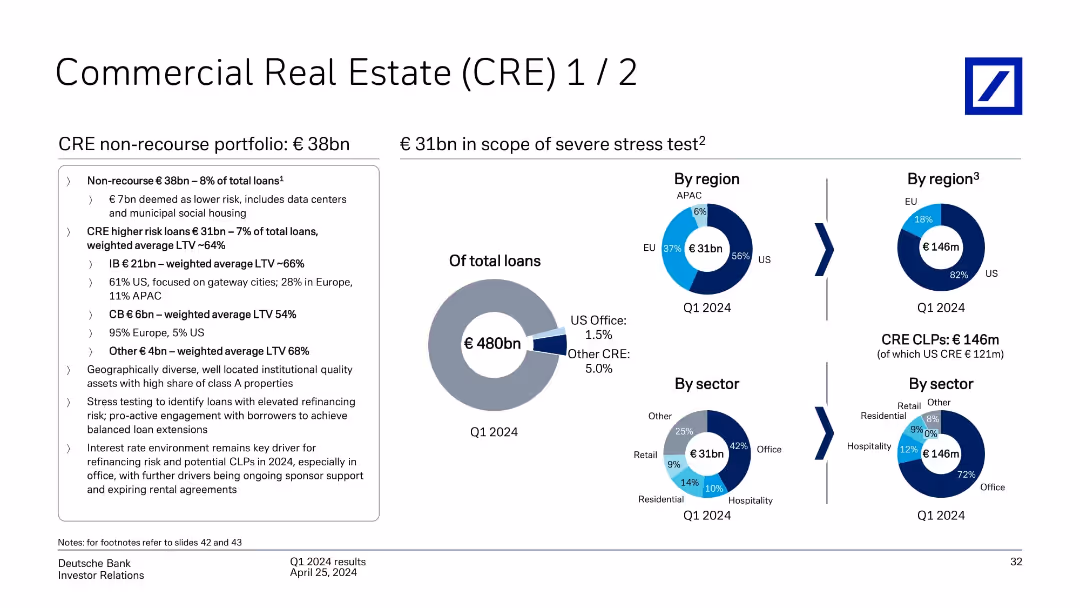
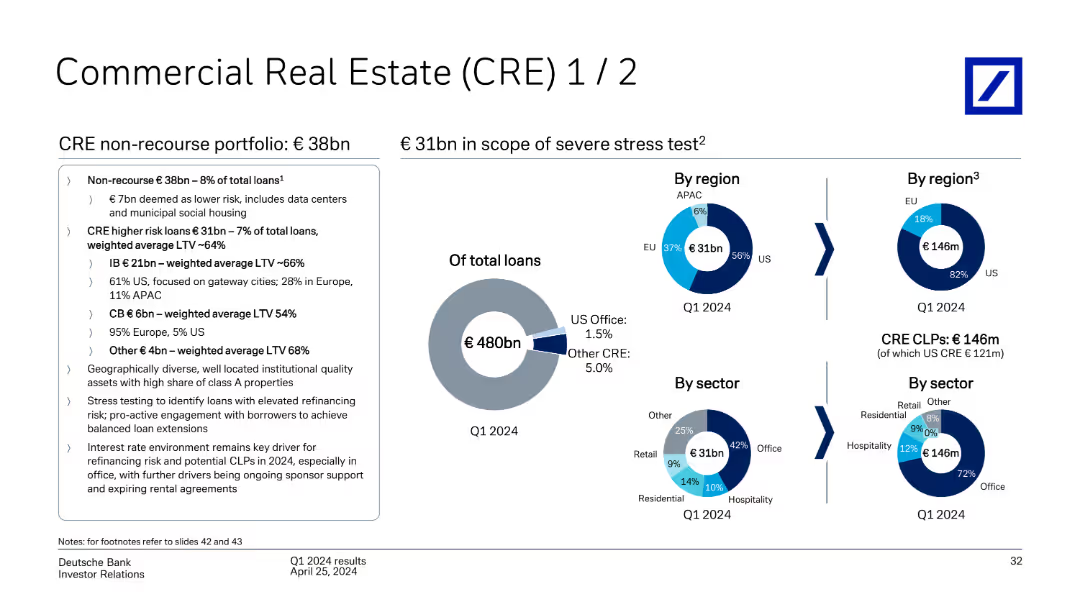
Multiple pie charts showing CRE exposure by region and sector, including stress test coverage; supported by bullet-point analysis and totals.
Risk Assessment and Management
Financial Services
Provides an overview of Deutsche Bank’s €38bn non-recourse CRE exposure and €31bn in scope for stress testing. Highlights include U.S. office concentration, LTV averages, and sector/region breakdowns. Emphasizes refinancing risks and ongoing risk mitigation strategies in a rising rate environment.
commercial real estate, CRE exposure, non-recourse, stress testing, refinancing risk, LTV, Deutsche Bank
false
Risk Assessment and Management
Financial Services
Mixed Chart
Deutsche Bank
Add to my slides
Remove from favorites
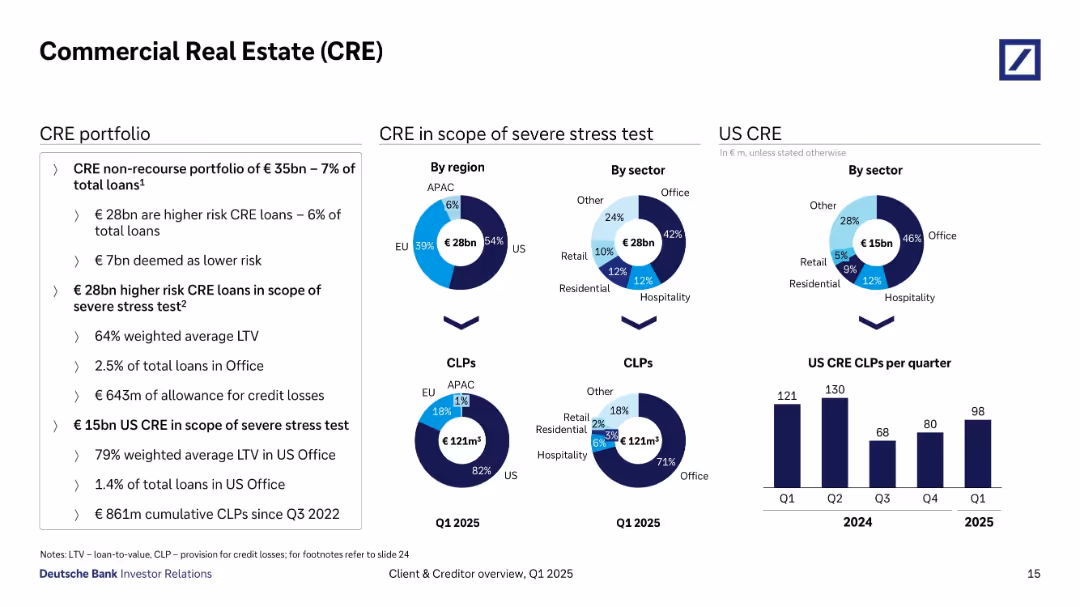
Multi-chart layout: pie charts, bar chart, and detailed text box on left.
Risk Assessment and Management
Financial Services
Provides an in-depth view of Deutsche Bank’s €35bn CRE loan portfolio, detailing risk categorization, geographic and sectoral exposure, and stress testing. Key stats include €28bn in higher risk loans, 64% LTV average, and €861m in cumulative CLPs. US CRE exposure and quarterly CLPs are visualized, emphasizing loan stress testing and sector distribution.
commercial real estate, CRE, loan stress test, US office, CLP, loan risk, loan-to-value, Deutsche Bank, Q1 2025, sector exposure
false
Risk Assessment and Management
Financial Services
Multiple Chart
Deutsche Bank
Add to my slides
Remove from favorites
This slide contains pie charts and text detailing Deutsche Bank's CRE portfolio, including non-recourse loans and higher risk loans, segmented by region (US, EU, APAC) and sector (Office, Retail, etc.) as of Q1 2024.
Market Analysis and Trends
Real Estate & Construction
The slide provides an overview of Deutsche Bank's commercial real estate portfolio as of Q1 2024, highlighting non-recourse and higher risk loans, and breaking down the portfolio by region and sector.
commercial real estate, CRE, non-recourse loans, higher risk loans, region, sector, Deutsche Bank, Q1 2024
false
Market Analysis and Trends
Real Estate & Construction
Multiple Chart
Deutsche Bank
Add to my slides
Remove from favorites
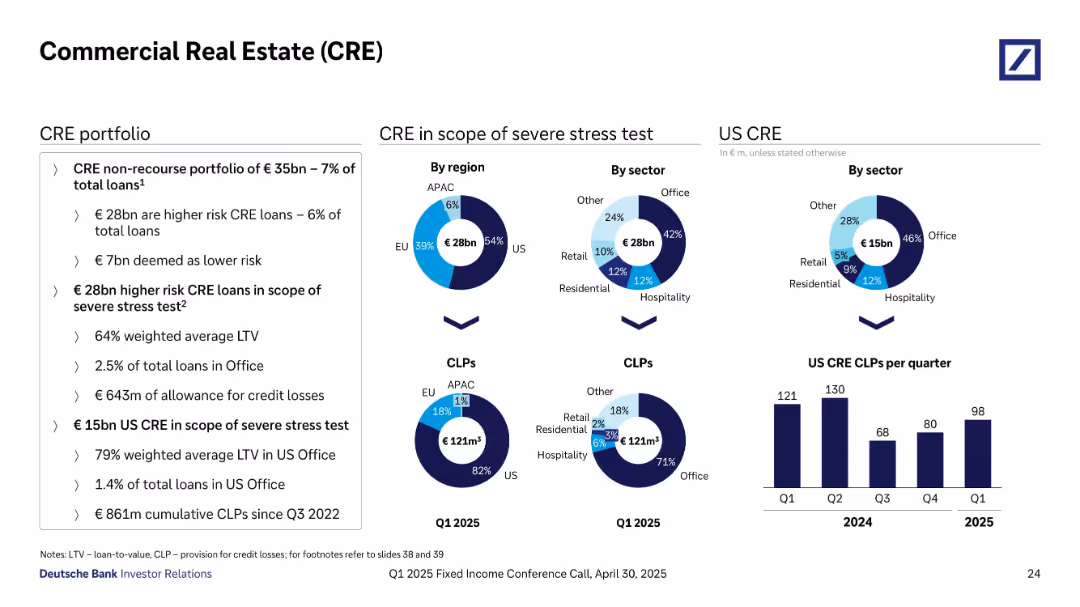
Boxed section with three donut charts and one bar chart for US CRE CLPs; key metrics on left.
Risk Assessment and Management
Financial Services
This slide covers the €35bn CRE portfolio, with €28bn considered high risk and under stress test. It breaks down exposure by region and sector, highlighting US office space as the largest risk factor, and includes cumulative provisions of €861m for US CRE since Q3 2022.
commercial real estate, CRE, stress test, US exposure, LTV, credit losses, sector risk, office loans
false
Risk Assessment and Management
Financial Services
Multiple Chart
Deutsche Bank
Add to my slides
Remove from favorites
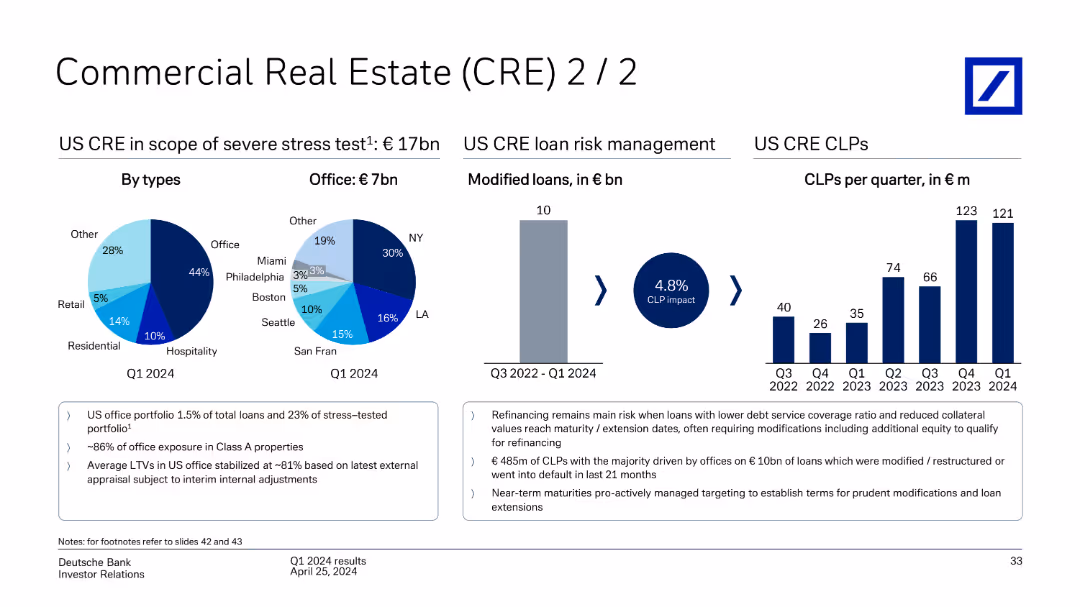
This slide features pie charts and bar charts detailing US CRE loans under severe stress test, segmented by types (Office, Retail, etc.) and risk management, including modified loans and CLPs per quarter from Q3 2022 to Q1 2024.
Market Analysis and Trends
Real Estate & Construction
The slide discusses Deutsche Bank's US commercial real estate loans under severe stress test, detailing loan types, risk management strategies, and CLPs per quarter from Q3 2022 to Q1 2024.
commercial real estate, CRE, stress test, US loans, risk management, modified loans, CLPs, Deutsche Bank, Q1 2024
false
Market Analysis and Trends
Real Estate & Construction
Multiple Chart
Deutsche Bank
Add to my slides
Remove from favorites
Includes pie charts and bullet points detailing non-recourse portfolio composition, regional loan distribution, and sector breakdown.
Investment Analysis
Real Estate & Construction
Highlights key metrics in commercial real estate portfolio, focusing on non-recourse loans, region-based distribution, and sector engagement, suitable for investment analysis.
commercial real estate, investment, non-recourse, loans, regional distribution, sectors
false
Investment Analysis
Real Estate & Construction
Multiple Chart
Deutsche Bank
Add to my slides
Remove from favorites
The slide employs a donut chart and a simple table to depict the distribution of commercial real estate loans. It is complemented by a blue and gray color scheme that adds visual clarity to the categorical distribution.
Market Analysis and Trends
Real Estate & Construction
Specialized for real estate professionals and investors, the slide analyzes commercial real estate loan distributions and investment grades, facilitating discussions on portfolio risk and investment opportunities within the commercial real estate sector.
commercial real estate, loans, investment grade, real estate distribution, portfolio risk
false
Market Analysis and Trends
Real Estate & Construction
Mixed Chart
Goldman Sachs
Add to my slides
Remove from favorites
Integrates pie charts and text blocks. Blue and grey tones highlight different regions and sectors in real estate.
Risk Assessment and Management
Real Estate & Construction
Offers an analysis of non-recourse loans and exposure in CRE by region and sector, highlighting financial risks and market conditions.
Commercial real estate, loans, stress test, market analysis, risk assessment, regions, sectors
false
Risk Assessment and Management
Real Estate & Construction
Multiple Chart
Deutsche Bank
Add to my slides
Remove from favorites
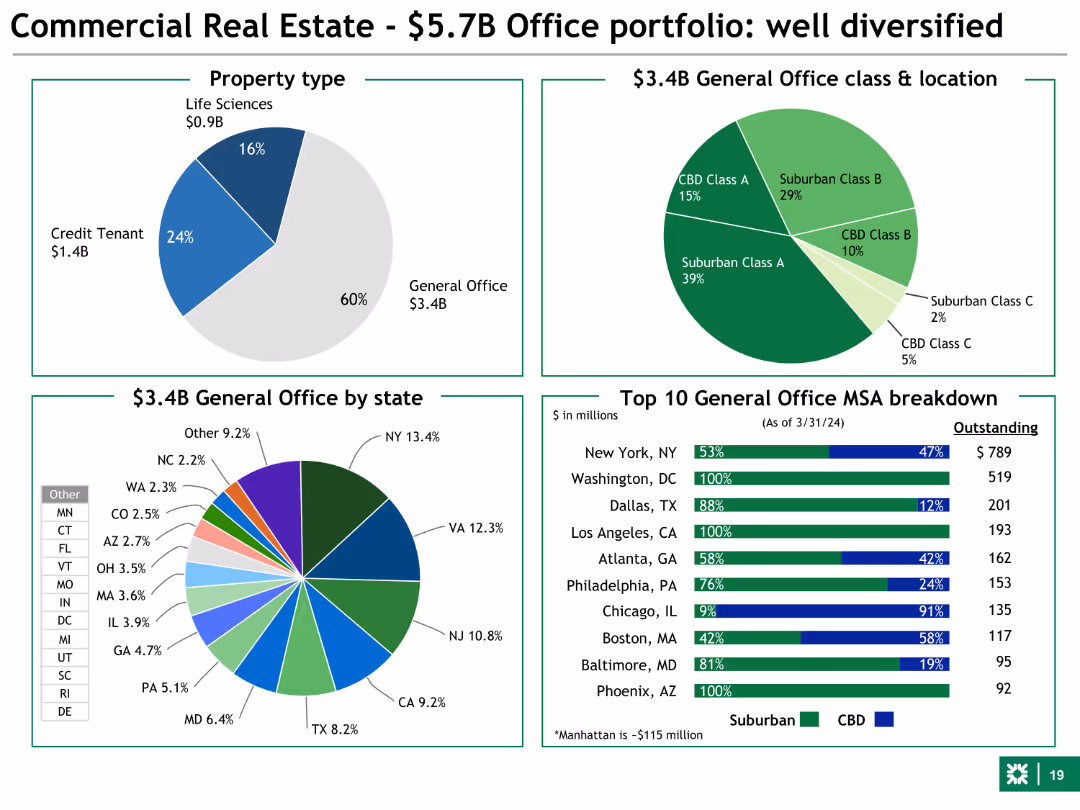
Pie charts and bar charts showing property types, office class & location, and MSA breakdown. Uses various colors to distinguish different data segments.
Market Analysis and Trends
Financial Services
This slide focuses on the commercial real estate office portfolio, showing the distribution of property types, class, and geographic breakdown. It highlights diversification.
commercial real estate, office, property types, diversification, geographic
false
Market Analysis and Trends
Financial Services
Multiple Chart
Barclays
Add to my slides
Remove from favorites
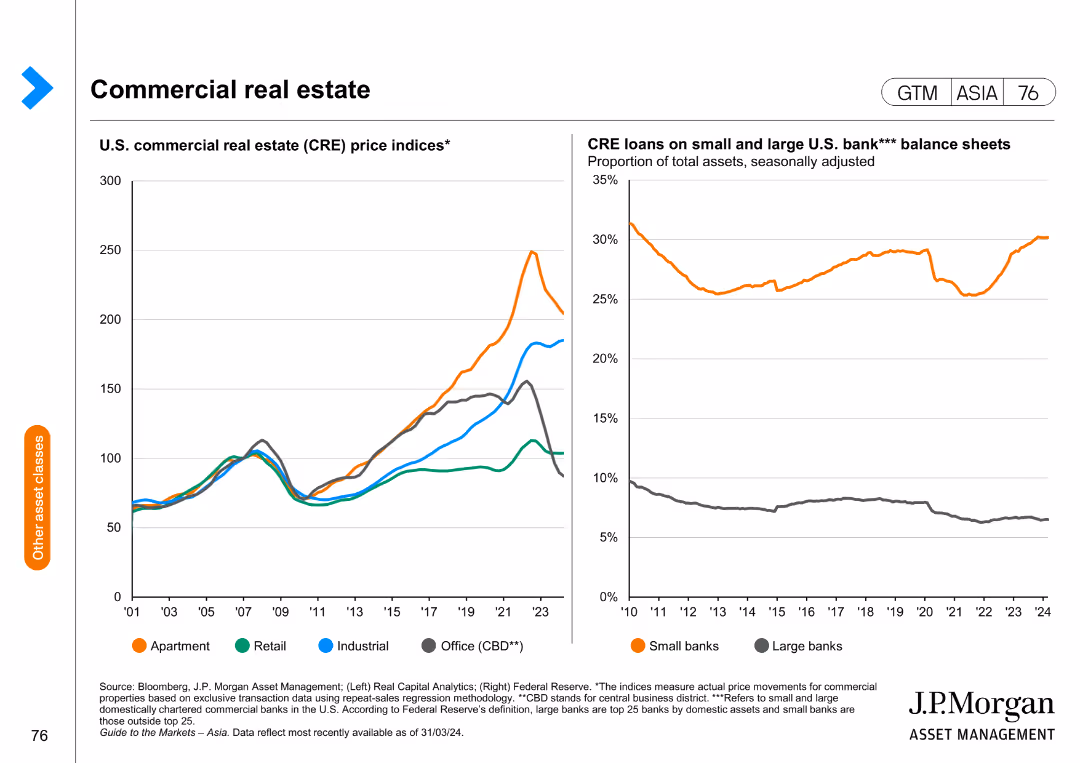
The slide features two line charts; one shows price indices for different types of U.S. commercial real estate, and the other shows the proportion of CRE loans on small and large banks' balance sheets.
Market Analysis and Trends
Real Estate & Construction
This slide analyzes trends in commercial real estate prices and the distribution of related loans, providing insights into market health and lending practices.
commercial real estate, price indices, loans, banking, market trends
false
Market Analysis and Trends
Real Estate & Construction
Multiple Chart
JP Morgan
Add to my slides
Remove from favorites
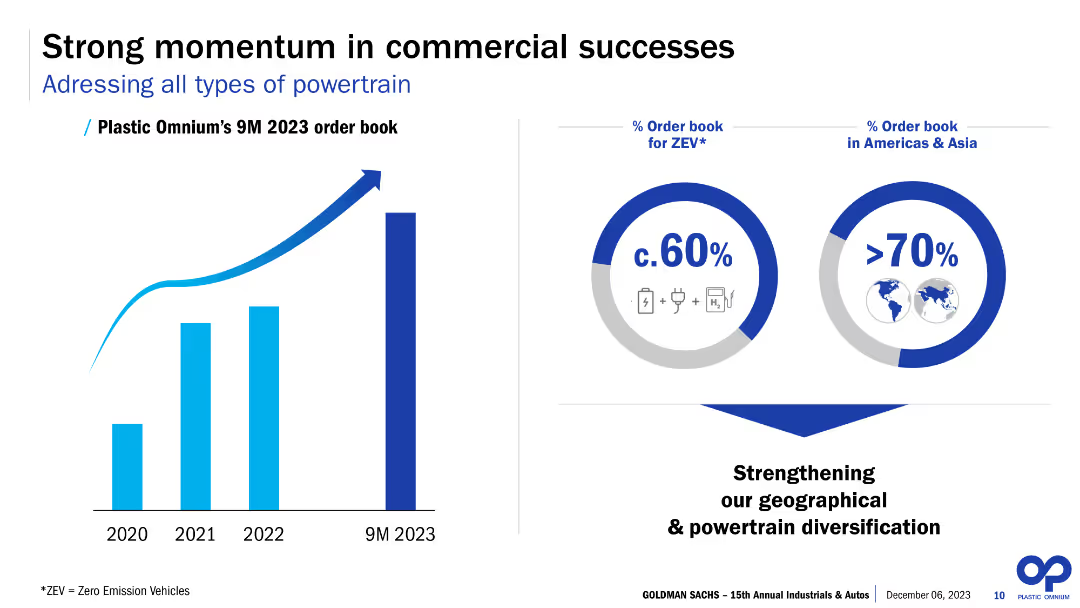
The slide features a column chart showing the 9-month order book from 2020 to 2023, with additional infographics showing percentages of the order book for Zero Emission Vehicles (ZEV) and regional distribution in Americas and Asia.
Market Analysis and Trends
Industrial & Manufacturing
The slide highlights the commercial success and strong momentum in the order book for 2023, with a significant portion dedicated to Zero Emission Vehicles. It emphasizes geographical and powertrain diversification, reflecting on the company’s strategic focus on sustainable and diversified growth.
Commercial success, ZEV, order book, regional distribution, Americas, Asia, powertrain, diversification, market momentum, sustainable growth
false
Market Analysis and Trends
Industrial & Manufacturing
Multiple Chart
Goldman Sachs
Add to my slides
Remove from favorites
The slide contains two charts. The left line chart shows U.S. goods imports by location. The right bar chart displays company plans to relocate out of China.
Competitive Landscape
Transportation & Logistics
This slide examines the commercial relationship between the U.S. and China, focusing on import locations and companies' relocation plans.
Commercial, U.S., China, Imports, Relocation
false
Competitive Landscape
Transportation & Logistics
Multiple Chart
JP Morgan
Add to my slides
Remove from favorites
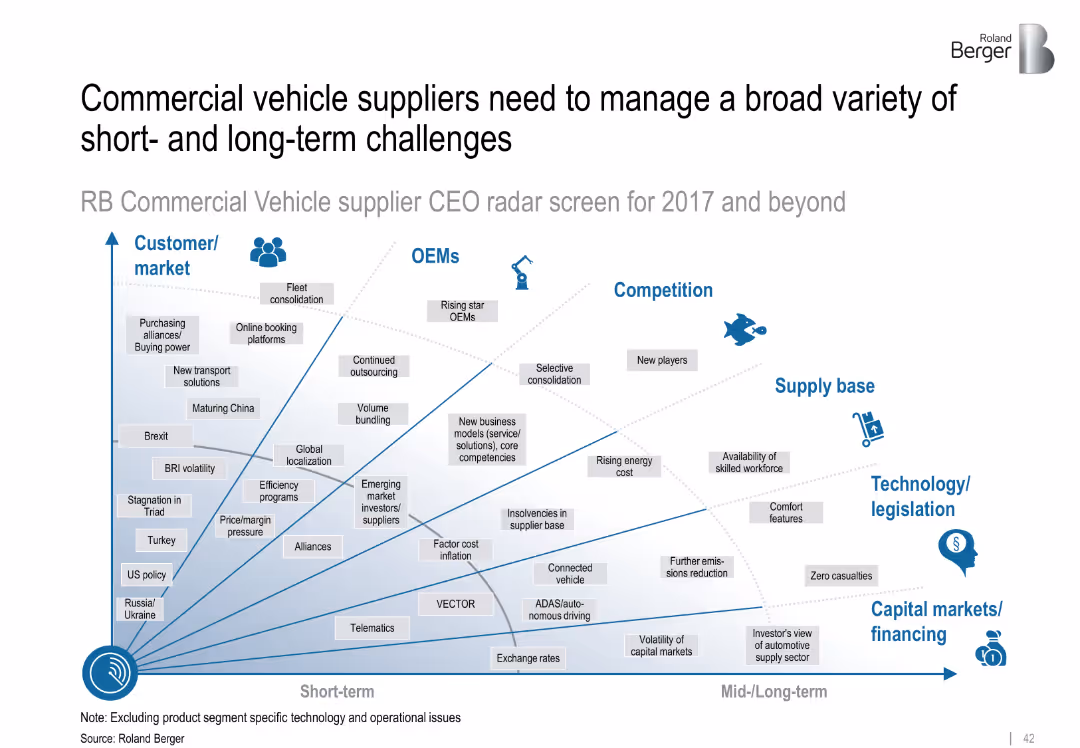
Radar-style layout categorizing short- vs. long-term challenges across six strategic dimensions (e.g., OEMs, competition, supply base)
Strategic Planning
Transportation & Logistics
Outlines the primary external and internal challenges faced by commercial vehicle suppliers in 2017 and beyond. Includes topics like outsourcing, rising costs, energy trends, ADAS, and skilled workforce availability.
commercial vehicles, strategic planning, supply chain, OEMs, challenges, outsourcing, legislation, competition
false
Strategic Planning
Transportation & Logistics
Diagram
Roland Berger
Add to my slides
Remove from favorites
Stacked bar graphs displaying levels of employee commitment against how informed, connected, and heard they feel.
Strategic Planning
Professional Services
Analyzes the correlation between employee information, connection, and acknowledgment with their commitment to change initiatives.
commitment, employees, change, information
false
Strategic Planning
Professional Services
Multiple Chart
Bain
Add to my slides
Remove from favorites
The slide includes a column chart and bullet points comparing the willingness of various industries to commit to radical changes post-COVID-19, highlighting differences in approach among sectors like banking, healthcare, and technology.
Market Analysis and Trends
Professional Services
The slide analyzes the commitment levels across industries to post-COVID-19 transformations, showing which sectors are more likely to adopt radical changes and which prefer a "watch-and-wait" approach.
commitment, industries, post-COVID-19, transformation, approach
false
Market Analysis and Trends
Professional Services
Multiple Chart
EY
Add to my slides
Remove from favorites
The slide includes a line chart depicting the Bloomberg Commodity Index total returns and a table showing current commodity prices and their changes over time.
Market Analysis and Trends
Financial Services
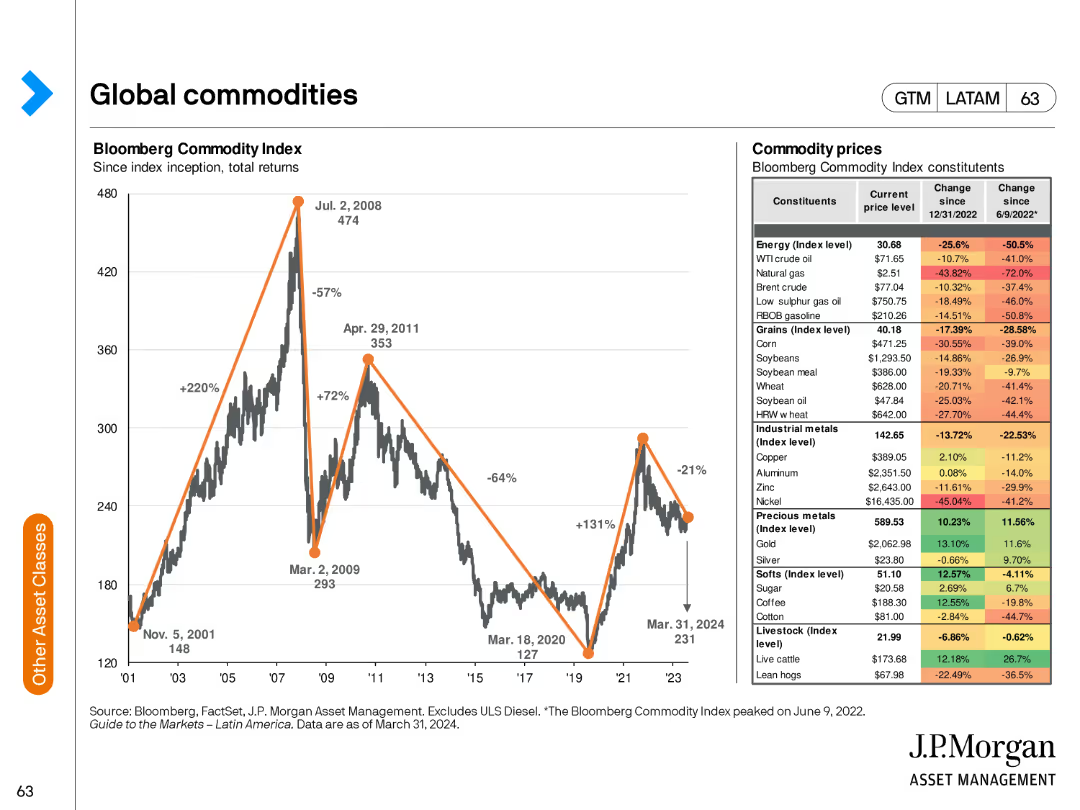
This slide provides an overview of the global commodities market, focusing on the Bloomberg Commodity Index and the price changes of various commodities.
commodities, Bloomberg Index, total returns, prices, market overview
false
Market Analysis and Trends
Financial Services
Mixed Chart
JP Morgan
Add to my slides
Remove from favorites
Features multiple bar charts illustrating the investment needs and technology drivers for various commodities to meet future demand. Colored bars represent different commodities.
Risk Assessment and Management
Environmental Services & Sustainability
Discusses the sustainability of commodity demand under current extraction rates and potential technological influences, important for risk management in resource allocation.
commodities, demand sustainability, bar chart, resource management, investment needs, technology drivers, risk assessment
false
Risk Assessment and Management
Environmental Services & Sustainability
Multiple Chart
McKinsey
Add to my slides
Remove from favorites
Features a column chart with details on commodities trading results. Each segment is labeled with its value, and a side box lists key factors influencing the outcomes. The slide is clean with a consistent color scheme, employing blue and gray tones, and clear text for easy reading.
Risk Assessment and Management
Financial Services
The slide outlines the performance in commodities and global markets, with key drivers such as net interest and trading income, detailing areas like commodities, equities, and operating expenses, ideal for assessing risk and performance in commodity trading.
commodities, global markets, trading, performance, risk assessment, net interest, equity, operating expenses
false
Risk Assessment and Management
Financial Services
Mixed Chart
Goldman Sachs
Add to my slides
Remove from favorites
Contains two line charts, one showing real US 10-year Treasury yield vs. gold prices, and the other displaying commodity prices rebased to January 2007.
Market Analysis and Trends
Energy & Utilities
The slide examines the relationship between real US 10-year Treasury yields and gold prices, as well as tracking commodity prices over time, highlighting trends in different sectors.
commodities, gold, Treasury yield, prices, trends
false
Market Analysis and Trends
Energy & Utilities
Multiple Chart
JP Morgan
Add to my slides
Remove from favorites
The slide combines textual information with visuals like icons and graphs. There is a bar graph on the left and bullet points on the right, separated by vertical dividers. Logos and small graphics highlight specific points.
Industry Overview
Financial Services
It presents an overview of the commodities and global markets division, highlighting net profit contribution, client activity, and specialized finance. It includes accolades to emphasize expertise and achievements, supported by visual representations of key financial data.
commodities, markets, finance, global, net profit, client activity, specialization, awards
false
Industry Overview
Financial Services
Mixed Chart
Morgan Stanley
Add to my slides
Remove from favorites
Column chart with additional financial metrics on the right, along with detailed narrative explanations.
Risk Assessment and Management
Financial Services
The slide evaluates the commodities and global markets sectors, detailing the strong underlying client business and positioning for future opportunities. It’s beneficial for risk assessment and informing about strategic positioning in response to market conditions, tailored for risk managers and investment strategists.
commodities, markets, risk, client business, opportunities
false
Risk Assessment and Management
Financial Services
Mixed Chart
Morgan Stanley
Add to my slides
Remove from favorites
A bar chart and a matrix comparing the global commodities mining production and the importance of commodities for sustainable energy technologies.
Market Analysis and Trends
Energy & Utilities
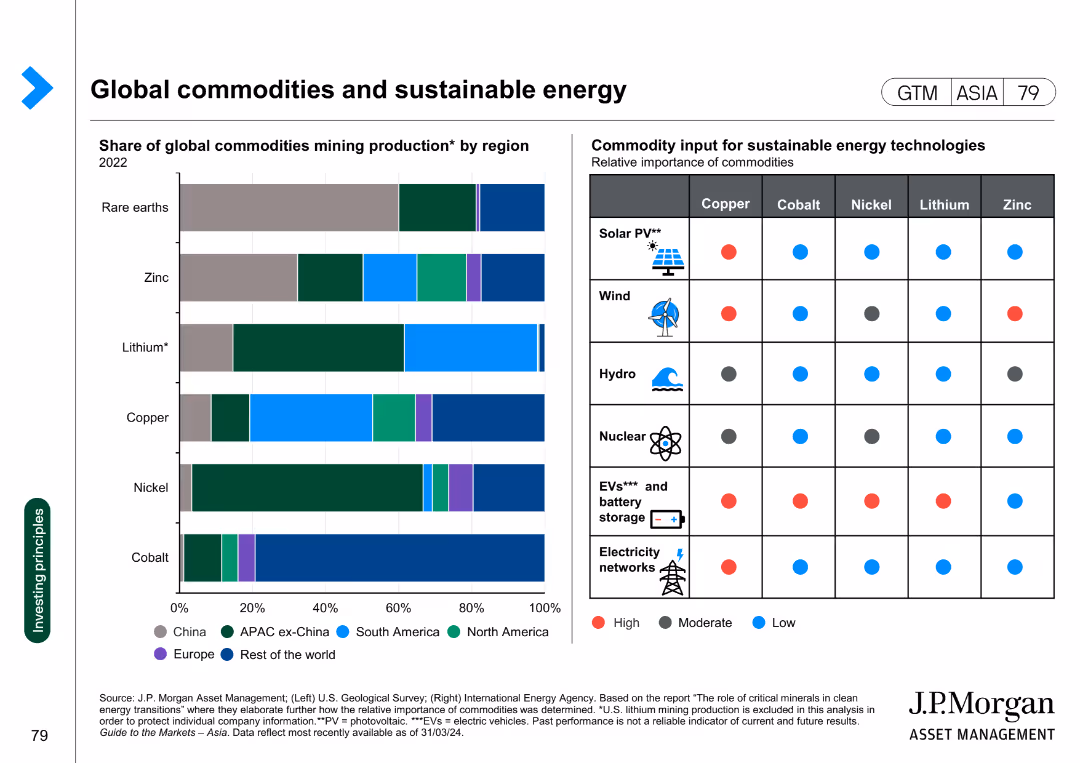
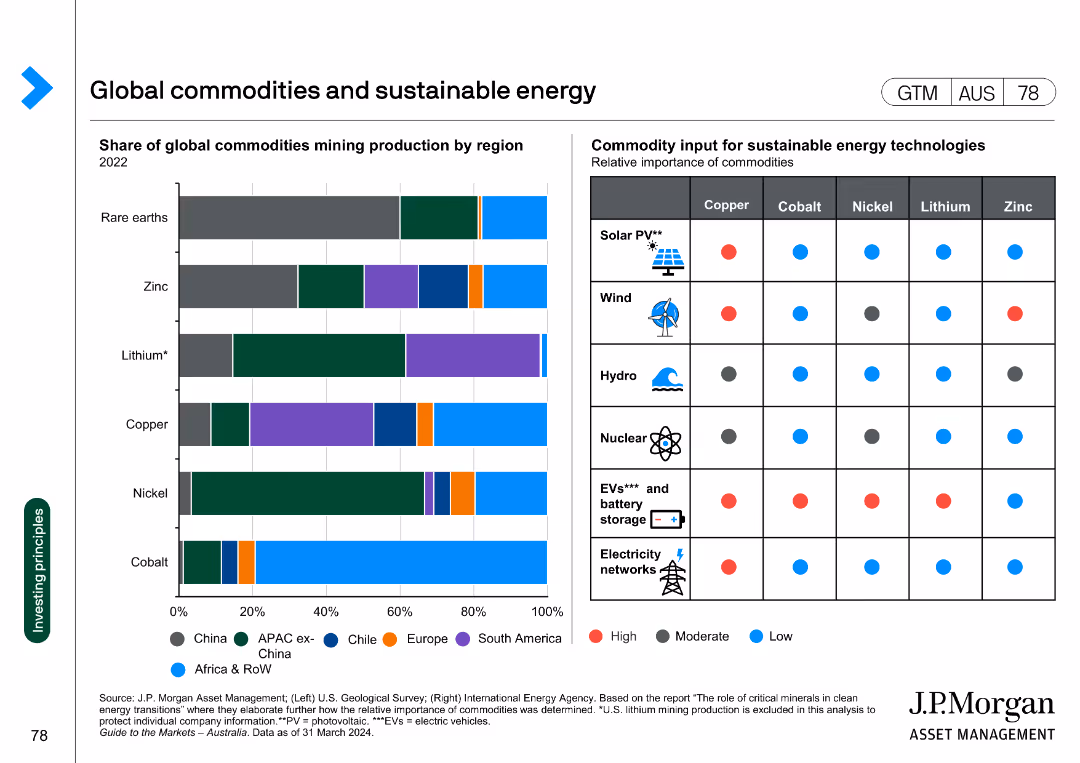
This slide presents the share of global commodities mining production by region in 2022 and the relative importance of various commodities in sustainable energy technologies.
commodities, mining, sustainable energy, production, importance
false
Market Analysis and Trends
Energy & Utilities
Mixed Chart
JP Morgan
Add to my slides
Remove from favorites
A combination of a bar chart and a matrix. The bar chart shows the share of global commodities mining production by region. The matrix indicates the relative importance of various commodities for sustainable energy technologies.
Market Analysis and Trends
Energy & Utilities
The slide displays the global production of key commodities and their importance in sustainable energy technologies, highlighting regions and specific uses like solar, wind, and EVs.
commodities, sustainable energy, mining, global production, renewable technologies
false
Market Analysis and Trends
Energy & Utilities
Mixed Chart
JP Morgan
Add to my slides
Remove from favorites
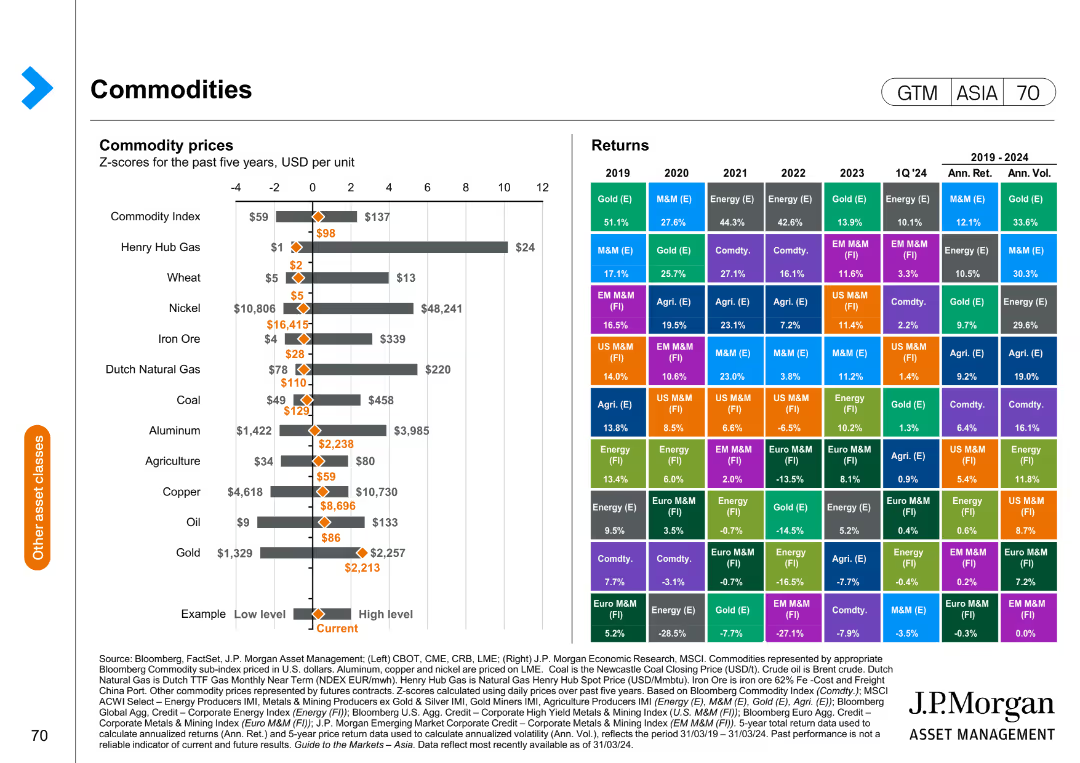
The slide contains a mixed chart with a horizontal bar chart on the left showing commodity prices and a matrix on the right displaying annual returns by commodity type from 2019 to 2024.
Market Analysis and Trends
Energy & Utilities
This slide compares commodity prices and historical returns, providing insights into market trends and performance across different commodity types.
commodity prices, market trends, historical returns, performance analysis, energy
false
Market Analysis and Trends
Energy & Utilities
Mixed Chart
JP Morgan
Add to my slides
Remove from favorites
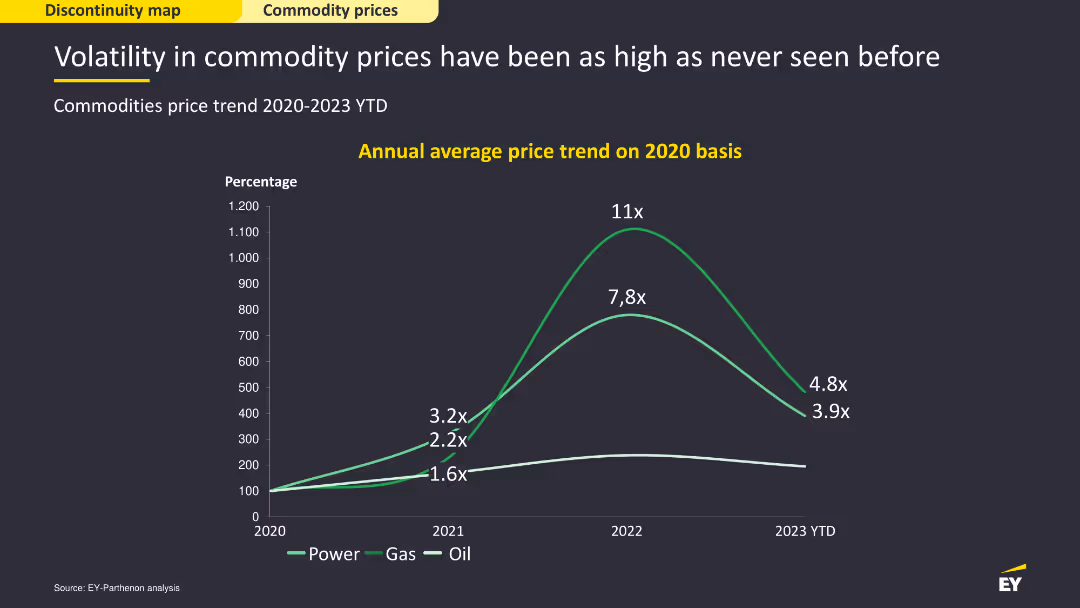
Line chart showing annual average price trends for power, gas, and oil on a 2020 basis from 2020-2023 YTD. Moderate complexity, effectively visualizing commodity price volatility over the years.
Market Analysis and Trends
Financial Services
This slide analyzes the volatility in commodity prices, particularly in power, gas, and oil. It discusses the trends in average prices from 2020 to 2023 YTD, highlighting the significant fluctuations in commodity markets.
Commodity prices, power, gas, oil, volatility
false
Market Analysis and Trends
Financial Services
Single Chart
EY
Add to my slides
Remove from favorites
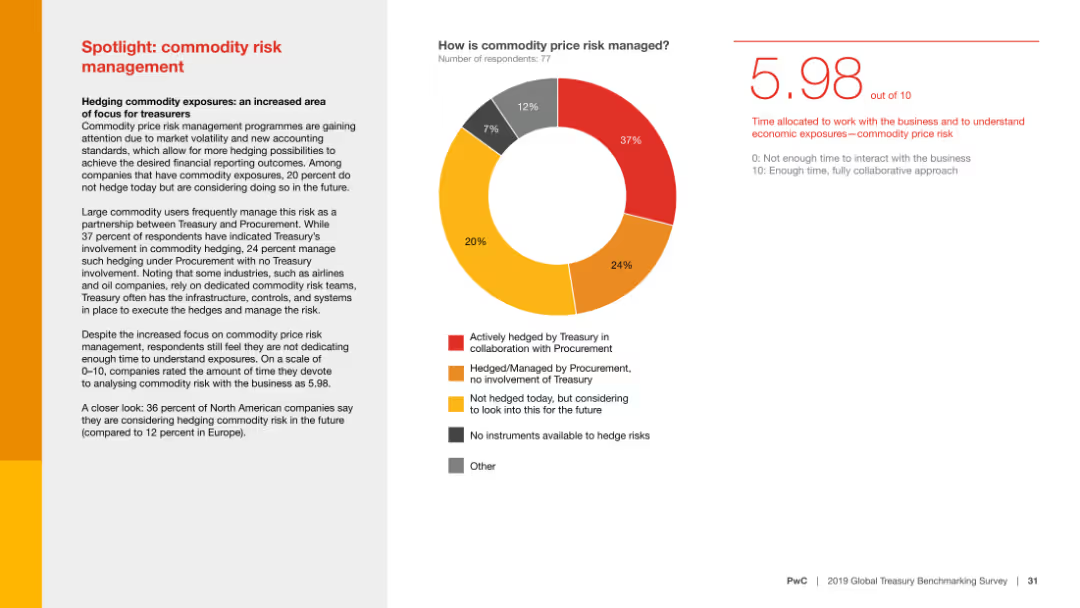
The slide features a pie chart depicting how commodity price risk is managed, accompanied by text discussing the importance of hedging commodity exposures and the level of involvement of Treasury in this process.
Risk Assessment and Management
Financial Services
This slide highlights the focus on commodity price risk management, showing how organizations manage these risks and the Treasury's role in this process, stressing the need for better risk understanding.
Commodity risk, risk management, Treasury, hedging, financial services, commodity exposures, procurement, risk understanding, survey, financial trends
false
Risk Assessment and Management
Financial Services
Mixed Chart
PwC/Strategy&
Add to my slides
Remove from favorites
The slide contains two bar charts comparing commodity supply shortages and price pressures for various commodities between Jan 2023 and Feb 2023.
Market Analysis and Trends
Industrial & Manufacturing
The slide provides an overview of current commodity supply and price pressures, emphasizing changes over the past months and future outlooks.
commodity supply, price pressures, manufacturing, market trends, industrial
false
Market Analysis and Trends
Industrial & Manufacturing
Multiple Chart
Accenture
Add to my slides
Remove from favorites
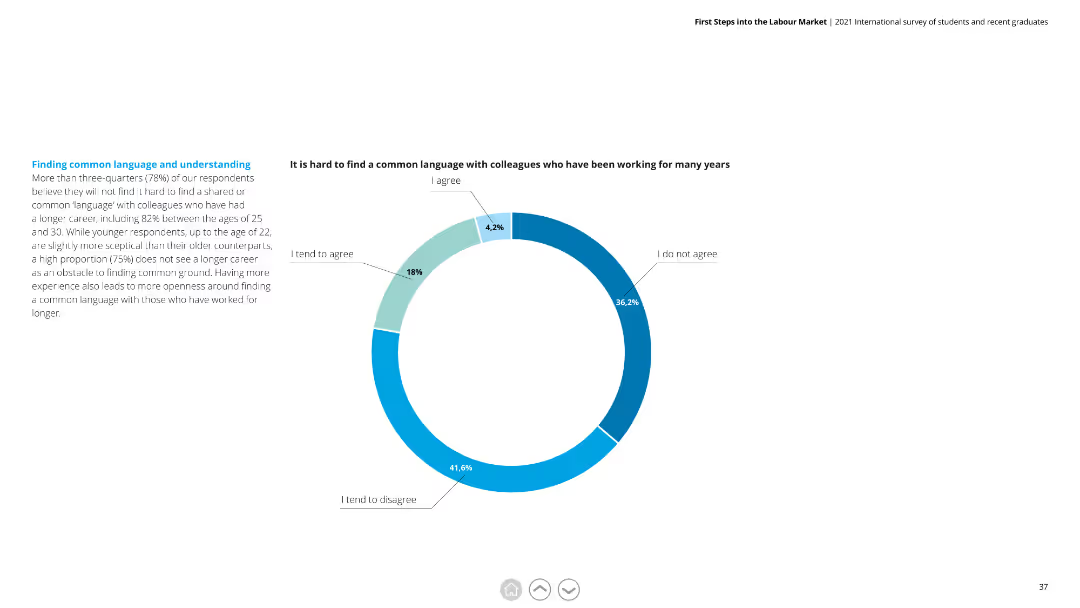
The slide displays a pie chart with different segments represented in blue hues. The text is split into two columns, one providing context and the other offering a detailed explanation.
Human Resources and Talent Management
Professional Services
Discusses the challenges of finding a common language with colleagues who have worked for many years. Emphasizes the importance of shared language in professional settings.
common language, colleagues, years, challenges, professional, shared language, respondents
false
Human Resources and Talent Management
Professional Services
Mixed Chart
Deloitte
Add to my slides
Remove from favorites
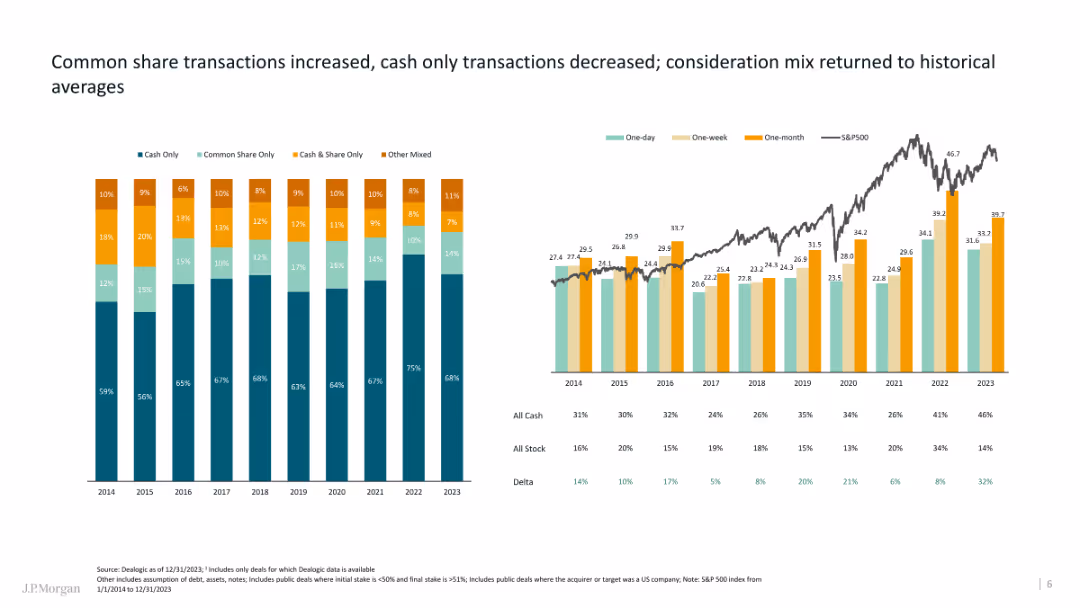
The slide features a series of column charts displaying data on transaction types over time and performance metrics.
Financial Performance
Financial Services
The slide details the trends in common share transactions versus cash transactions, highlighting historical averages.
Common share, transactions, column charts, historical data, trends
false
Financial Performance
Financial Services
Multiple Chart
JP Morgan
Add to my slides
Remove from favorites
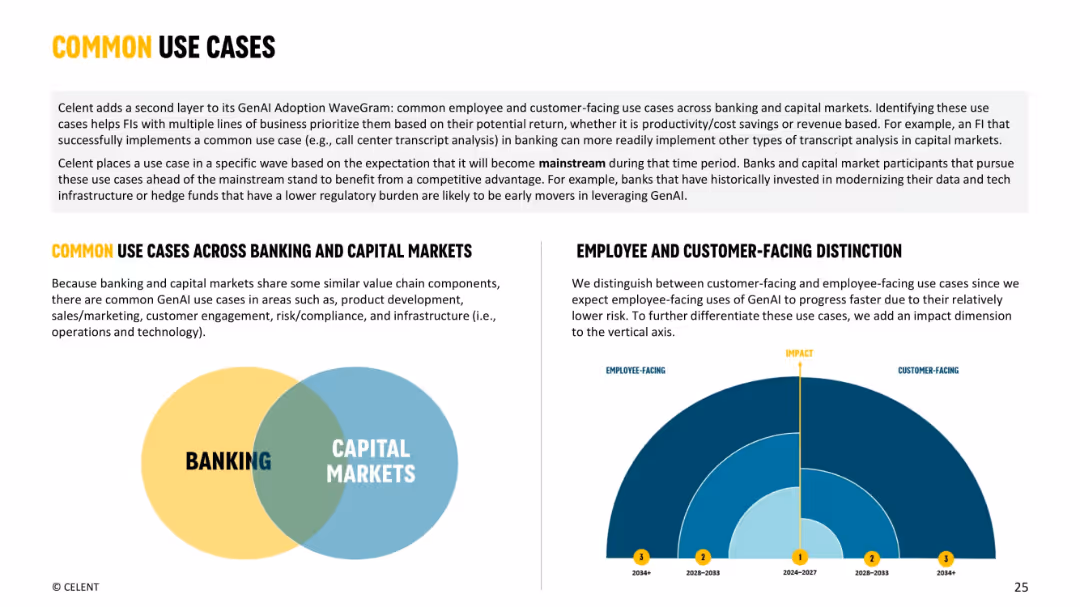
Clean, two-column layout with Venn diagram (Banking & Capital Markets) and semi-circular impact axis (employee vs. customer facing) repeated from slide 1. Uses bold yellow for headings and black for text.
Industry Overview
Financial Services
Highlights common GenAI use cases across banking and capital markets, stressing shared value chain elements and the importance of early GenAI adoption. Describes the wave-based framework and the importance of separating customer-facing and employee-facing use cases based on adoption readiness, impact, and risk profile.
common use cases, banking, capital markets, GenAI, impact, segmentation, value chain
false
Industry Overview
Financial Services
Mixed Chart
Oliver Wyman
Add to my slides
Remove from favorites
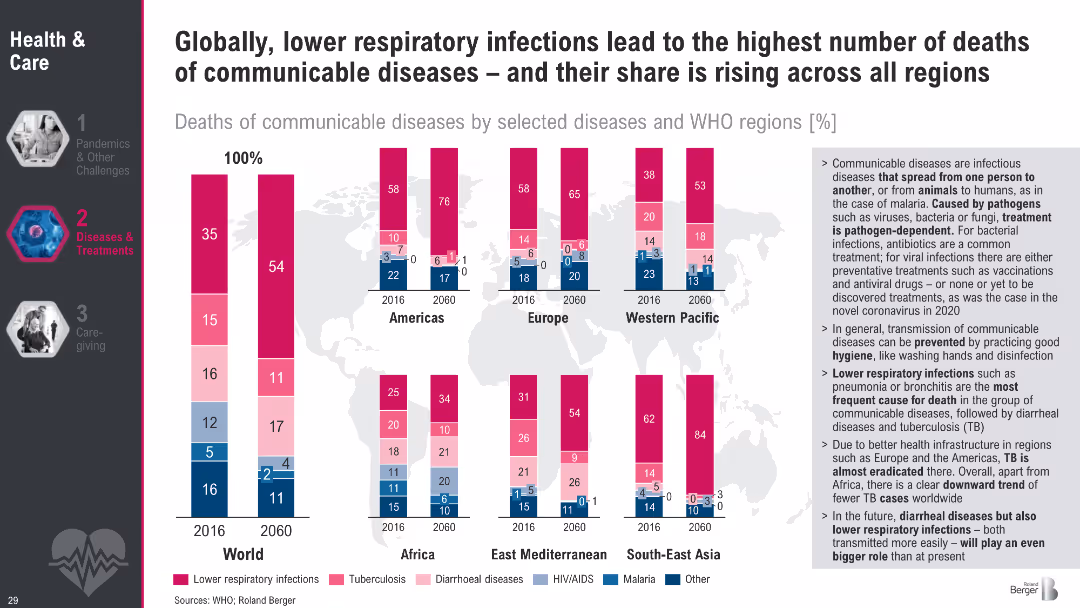
Stacked bar charts by region showing share of communicable disease deaths (2016 vs. 2060); color-coded by disease
Industry Overview
Healthcare & Pharmaceuticals
The slide shows that lower respiratory infections are the leading cause of communicable disease deaths globally. Despite progress in some areas, their share is expected to rise in most regions by 2060.
communicable diseases, respiratory infections, TB, WHO, global health, mortality trends, infection control, projections
false
Industry Overview
Healthcare & Pharmaceuticals
Multiple Chart
Roland Berger
Add to my slides
Remove from favorites
The slide features a column chart displaying council members' responses regarding the impact of communication during acquisitions. There is an image of a high-rise building on the right.
Mergers and Acquisitions
Professional Services
Discusses the role of communication in various phases of acquisition: pre-acquisition scoping, execution, and integration.
Communication, Acquisition, Integration, Strategy, Professional Services
false
Mergers and Acquisitions
Professional Services
Mixed Chart
IPSOS
Add to my slides
Remove from favorites
This slide includes a column chart rating the difficulty of communicating climate impact ideas across different industries, complemented by insight boxes.
Organizational Structure and Change
Environmental Services & Sustainability
Discusses the challenges industries face in communicating the impact of their climate-related business practices to customers and partners.
communication challenges, climate impact, industry comparison, business strategy, environmental concerns
false
Organizational Structure and Change
Environmental Services & Sustainability
Mixed Chart
Deloitte
Add to my slides
Remove from favorites
Presents detailed radial diagrams mapping the usage of communication channels across different industries and regions. Utilizes a clear, structured layout with varied icons and color coding to represent each channel and industry distinctly.
Technology and Digital Transformation
Telecommunications
Provides a comprehensive overview of how various communication channels are utilized across industries and regions, highlighting trends in customer interaction preferences. Essential for businesses in technology and professional services aiming to optimize their communication strategies.
communication channels, industry analysis, regional trends, technology, customer interaction
false
Technology and Digital Transformation
Telecommunications
Multiple Chart
Deloitte
Add to my slides
Remove from favorites
With a green backdrop, this slide features three main points and their corresponding icons on the left and benefits of clear communication on the right.
Human Resources and Talent Management
Technology & Software
Focuses on the importance of transparent communication regarding compensation packages and tools that can be utilized for this purpose.
communication, compensation, transparency, motivation, offer letter, incentive plan, handbook
false
Human Resources and Talent Management
Technology & Software
Header Vertical
Kearney
Add to my slides
Remove from favorites
The slide features a graph plotting 'Support for the change' against 'Time', marked with phases from 'Awareness' to 'Embedded'. Red dots are connected by a rising curve, with text annotations indicating stages of change acceptance. The background is white, with a minimalist design and red textual highlights.
Organizational Structure and Change
Professional Services
This slide portrays a change curve model, demonstrating how communication leads to understanding, followed by engagement, and culminating in commitment. It outlines the phases of adopting change, from awareness to the change being fully embedded in behavior.
communication, engagement, commitment, change curve, adoption process
false
Organizational Structure and Change
Professional Services
Single Chart
Bain
Add to my slides
Remove from favorites
Two-column layout with bullet points on awareness building and freight group formation; large central logo and iconography.
Strategic Planning
Transportation & Logistics
This slide outlines the dual pillars of the UIC action plan: communication and creation of a Central Asia rail freight group. It highlights tasks like lobbying, transparency, regulatory support, and technical standardization to drive regional freight development.
communication, freight group, UIC, Central Asia, regulation, strategy, awareness
false
Strategic Planning
Transportation & Logistics
Framework
Roland Berger
Add to my slides
Remove from favorites
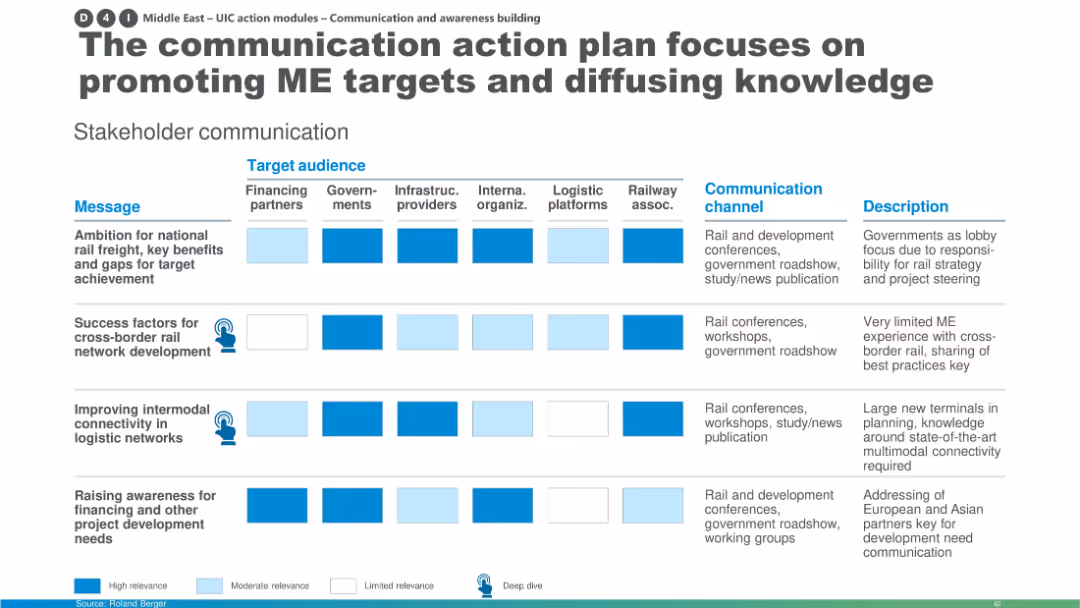
Matrix-style stakeholder communication table with message rows and audience columns; icons indicate deep dives.
Strategic Planning
Transportation & Logistics
This stakeholder communication matrix for the Middle East highlights key messages about rail freight ambitions and development needs. It identifies relevant audiences and communication channels, aiming to improve awareness and share best practices in cross-border development.
communication plan, Middle East rail, stakeholder mapping, infrastructure awareness, logistics, best practices, financing, intermodal connectivity
false
Strategic Planning
Transportation & Logistics
Table
Roland Berger
Add to my slides
Remove from favorites
The slide presents a two-column text format with a small section in the lower right corner depicting a U.S. map with colored dots indicating branch locations. The colors correspond to a legend identifying various cities. The layout is well-organized and easy to follow.
Financial Performance
Financial Services
Highlights the expansion of community centers and the role of Community Managers. It discusses trust-building with clients and providing financial education, with a focus on minority communities. The map shows branch locations across the U.S.
Community Banking, Financial Education, Branch Expansion, Trust-Building, Minority Communities, U.S. Map, Community Managers
false
Financial Performance
Financial Services
Boxed
JP Morgan
Add to my slides
Remove from favorites
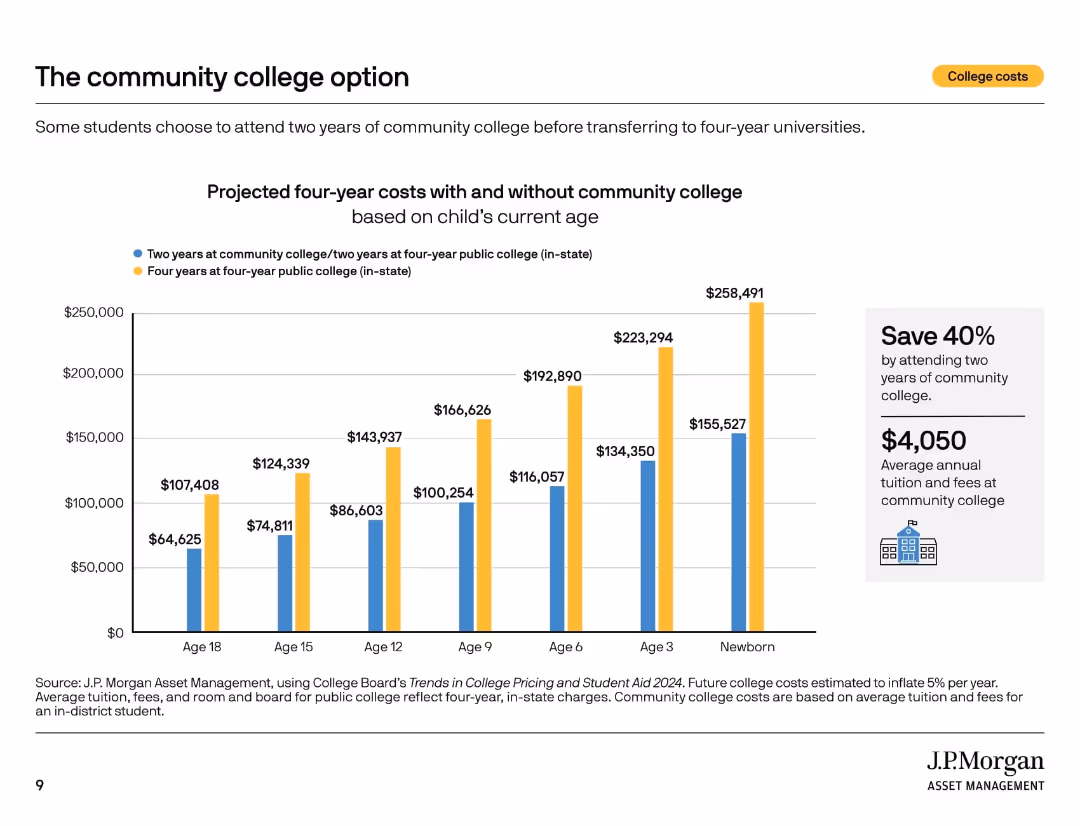
Bar chart comparing projected costs for two college pathways: community college then university vs four-year university.
Investment Analysis
Education & Training
This slide shows the cost-saving advantage of attending community college for two years before transferring to a four-year university. It emphasizes potential 40% savings and provides a cost breakdown across different child age groups.
community college, education savings, transfer strategy, tuition comparison, cost reduction, college path, public college, financial strategy, planning tips
false
Investment Analysis
Education & Training
Mixed Chart
JP Morgan
Add to my slides
Remove from favorites
This slide features two vertical column charts comparing the transfer intentions of first-gen versus continuing-gen students at community colleges, in shades of green.
Human Resources and Talent Management
Education & Training
The slide analyzes the transfer intentions of community college students, emphasizing the confidence levels between different student demographics.
community college, students, transfer, first-gen, intentions
false
Human Resources and Talent Management
Education & Training
Multiple Chart
BCG
Add to my slides
Remove from favorites
The slide combines a comprehensive narrative on community development with a pie chart on the left side displaying funding allocation. There is also an image depicting urban housing, tying back to the slide's theme of community support and development.
Financial Performance
Financial Services
The slide highlights JPMorgan Chase's commitment to community development, focusing on the allocation of funds to support home ownership and affordable housing. The urban housing image conveys the practical impact of these investments. Typically, this slide would be used to illustrate the company's efforts in enhancing community living standards and its role in societal development.
community development, funding, home ownership, affordable housing, urban living, JPMorgan Chase
false
Financial Performance
Financial Services
Mixed Chart
JP Morgan
Add to my slides
Remove from favorites
Photos of branch interiors and community engagement. Data boxes outline community strategy and roles.
Strategic Planning
Financial Services
Bank's approach to community engagement through tailored branch formats and local strategy implementation.
Community Engagement, Branch Evolution, Tailoring Execution, Local Strategy, Financial Services
false
Strategic Planning
Financial Services
Table
JP Morgan
Add to my slides
Remove from favorites
The slide features large numerical data points with accompanying icons representing various aspects of community engagement. It includes figures for donations, volunteer hours, and corporate contributions, arranged in a clean, visually appealing format.
Performance Metrics and KPIs
Government & Public Sector
This slide summarizes Booz Allen's community engagement efforts in FY23, providing key metrics such as total donations, volunteer hours, and corporate charitable contributions. It emphasizes the scope and impact of the company's social responsibility initiatives.
community engagement, FY23, donations, volunteer hours, corporate contributions
false
Performance Metrics and KPIs
Government & Public Sector
Header Vertical
Booz Allen Hamilton
Add to my slides
Remove from favorites
The slide includes a headline with bold text, a section of detailed text explaining community engagement, and a table showing community investment values for FY21, FY22, and FY23. Logos of partner organizations are included at the bottom.
Strategic Planning
Government & Public Sector
This slide highlights Booz Allen's commitment to community engagement by partnering with various charitable organizations. It details financial contributions and pro bono services provided, emphasizing the company's investment in community resilience.
community, engagement, investment, resilience, FY23
false
Strategic Planning
Government & Public Sector
Table
Booz Allen Hamilton
Add to my slides
Remove from favorites
The slide features a two-column layout with a bold title. The left column contains a table with financial contributions, and the right column lists partner spotlights with bullet points.
Client Case Studies
Professional Services
This slide showcases Booz Allen's community support and partnerships, highlighting financial and pro bono contributions to various organizations, underlining the company's commitment to community resilience and partnership.
community, engagement, resilience, partnerships, contribution
false
Client Case Studies
Professional Services
Table
Booz Allen Hamilton
Add to my slides
Remove from favorites
Features column charts and statistics on community engagement, volunteer hours, and the impact of community hubs on quality of life.
Operational Efficiency
Government & Public Sector
Assesses the impact of community hubs on participant engagement and quality of life improvements, detailing volunteer contributions and personal benefits.
Community hubs, engagement, quality of life, volunteer hours, personal benefits
false
Operational Efficiency
Government & Public Sector
Multiple Chart
Deloitte
Add to my slides
Remove from favorites
The slide features three column charts and line icons in a well-organized layout. Green highlights and infographics are used to emphasize key data points.
Industry Overview
Education & Training
This slide presents data on the impact of community hubs on English language improvement and confidence boosting for immigrants. It utilizes various data visualizations to show improvements in language skills and the consequential increase in employment and social satisfaction.
community hubs, language improvement, confidence, employment, social connections
false
Industry Overview
Education & Training
Multiple Chart
Deloitte
Add to my slides
Remove from favorites
Includes icons and brief descriptions of three initiatives: building digital skills, employability, and sports opportunities.
Strategic Planning
Education & Training
Describes initiatives aimed at building skills and employment opportunities in communities, with a focus on digital skills, employability, and sports.
community, skills, employability, digital, sports, development, education, training, financial services
false
Strategic Planning
Education & Training
Pillar
Barclays
Add to my slides
Remove from favorites
A comparative column chart illustrating car commute statistics, combining car usage with other means, commute frequency, distance, and car tenure across regions.
Market Analysis and Trends
Transportation & Logistics
Provides insights into the commuting habits of EV owners in different regions, focusing on car usage, combination with other transport means, and typical commute.
commute, car usage, regional comparison, EV owners, survey
false
Market Analysis and Trends
Transportation & Logistics
Multiple Chart
PwC/Strategy&
Add to my slides
Remove from favorites
Includes bar charts showing commute times and primary work locations. Key findings are provided in bullet points.
Market Analysis and Trends
Professional Services
Analyzes how office attributes like commute time and primary work location influence employee preferences, including tenure at the current company.
Commute time, Work location, Employee preferences, Tenure, Office attributes
false
Market Analysis and Trends
Professional Services
Multiple Chart
EY
Add to my slides
Remove from favorites
This slide includes a table with bar charts comparing commuting habits, car tenure, and daily travel distances of EV sceptics across APAC, EMEA, and North America. Colors and percentages are clearly marked.
Market Analysis and Trends
Transportation & Logistics
The slide examines the commuting patterns and car ownership tenure of EV sceptics, highlighting differences across regions. It aims to identify key mobility challenges that affect EV adoption.
commuting habits, car tenure, daily travel, EV sceptics, regional analysis
false
Market Analysis and Trends
Transportation & Logistics
Multiple Chart
PwC/Strategy&
Add to my slides
Remove from favorites
The slide features column charts detailing the frequency of commuting trips across different waves and regions post-crisis.
Market Analysis and Trends
Transportation & Logistics
Explores regional differences in commuting habits during and after a global crisis.
commuting, regional, frequency, crisis, habits
false
Market Analysis and Trends
Transportation & Logistics
Multiple Chart
McKinsey
Add to my slides
Remove from favorites
This slide provides a diagram and bullet points to explain the tangible impacts of company culture, featuring icons and a blue and teal color palette. Text is well organized and visually distinct.
Organizational Structure and Change
Professional Services
Emphasizing the practical effects of company culture, this slide could be part of a presentation advocating for the development of a strong organizational culture and its positive outcomes.
company culture, impact, organizational, development, outcomes, engagement, satisfaction, performance, motivation, improvement
false
Organizational Structure and Change
Professional Services
Header Vertical
Kearney
Add to my slides
Remove from favorites
Contains text with icons and a circular diagram, using a green and white color scheme. The layout is well-structured and clear.
Organizational Structure and Change
Professional Services
Highlights the importance of personnel in driving the company's evolution, suitable for discussions on company culture and human resources.
Company Culture, Organic Growth, Accountability, Integrity
false
Organizational Structure and Change
Professional Services
Mixed Chart
Morgan Stanley
Add to my slides
Remove from favorites
Combination of text, percentage circles, and visual comparisons highlighting differences in optimism about company culture between employees and employers post-pandemic.
Human Resources and Talent Management
Professional Services
This slide examines the impact of the pandemic on company culture, showing increased employee optimism versus declining employer optimism, and significant staff turnover.
Company culture, pandemic impact, employee optimism, employer pessimism, staff turnover
false
Human Resources and Talent Management
Professional Services
Multiple Chart
EY
Add to my slides
Remove from favorites
This slide includes a donut chart, column chart, and text blocks. The left side presents company culture changes, and the right side shows productivity agreement levels.
Organizational Structure and Change
Professional Services
Discusses changes in company culture and productivity measurement since the pandemic, highlighting survey results and country-specific differences.
company culture, productivity, pandemic, survey, organizational change
false
Organizational Structure and Change
Professional Services
Multiple Chart
EY
Add to my slides
Remove from favorites
Previous
Next
You don't have any favorites yet.
Please wait loading your favorites slides...
Create a FREE account to continue browsing
Receive Instant Access to 1,000+ slides from companies like McKinsey, Google, and Goldman Sachs
First Name
Last Name
Email
Password
I agree to all
Terms & Privacy Policy
Thank you! Your submission has been received!
Oops! Something went wrong while submitting the form.
Have an account?
Sign in
Upgrade to PRO to Save slides
Advanced Search and Filters
Access to 15,000+ slides
Access to Category Pages
Save/Bookmark Slides
PowerPoint Template Library
Pick a Plan
MONTHLY
$12/month
Billed every month, Cancel anytime.
YEARLY
$9/year
Billed $108 annually, Cancel anytime.
Checkout for $12/month
Checkout for $108/yr
Secured by Stripe | AES-256 bit encryption