My Account
My Slides
Search by Category
Companies
Slide Type
Use Case
Industry
Pricing
Templates
View All Templates
Download Template Slides
✦ AI
AI Prompt Library
AI Search
Feedback
Login
Logout
Get Started
Browse all Slides
Browse all Slides
Create a FREE Account
Instant access to 1,000+ real slides from top companies like McKinsey, BCG, Goldman Sachs, Google and many more!
First Name
Last Name
Email
Password
I agree to all
Terms & Privacy Policy
Thank you! Your submission has been received!
Oops! Something went wrong while submitting the form.
Have an account?
Sign in
Saved Slides
Total No. of slides saved
0
↻ Refresh
✖ Clear all
This slide presents column charts and bar charts to illustrate the current perception of crypto assets' role in the financial ecosystem, including levels of belief in their importance.
Market Analysis and Trends
Financial Services
The slide details the decline in the belief that crypto assets currently play a key role in the financial system, comparing data from 2023 to 2022, and breaking down responses by demographics.
current role, crypto assets, financial ecosystem, belief, demographics
false
Market Analysis and Trends
Financial Services
Mixed Chart
IPSOS
Add to my slides
Remove from favorites
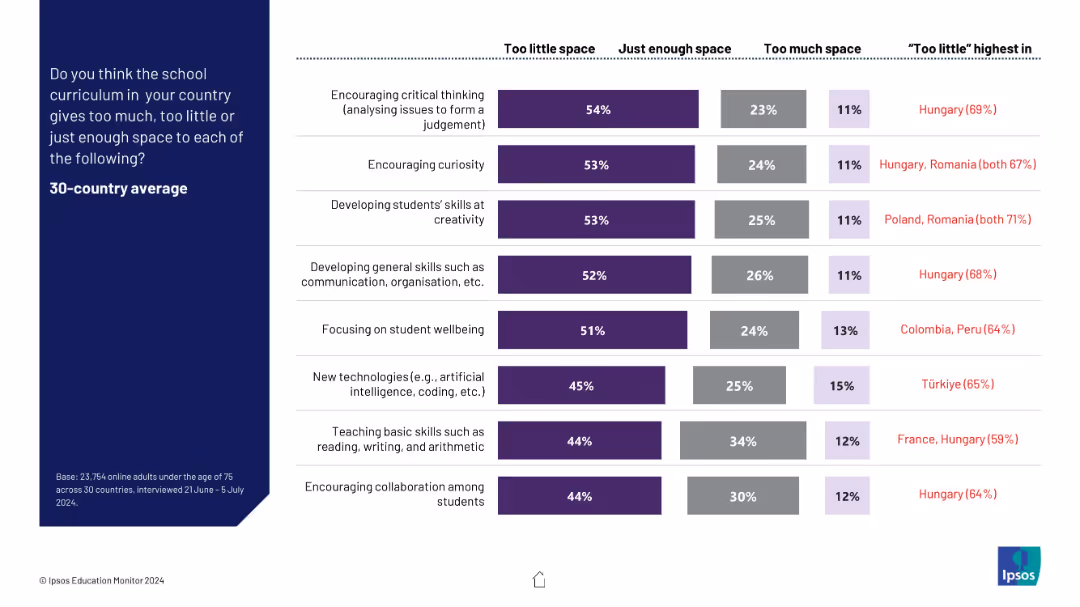
Stacked bar chart for each curriculum area, segmented by “Too little,” “Just enough,” and “Too much.” Highlights “Too little” leaders.
Product and Service Analysis
Education & Training
This slide captures public opinion on the sufficiency of space dedicated to various educational priorities in the curriculum. Most respondents feel areas like critical thinking, curiosity, and creativity receive too little attention.
curriculum content, critical thinking, skill development, public opinion, education design
false
Product and Service Analysis
Education & Training
Mixed Chart
IPSOS
Add to my slides
Remove from favorites
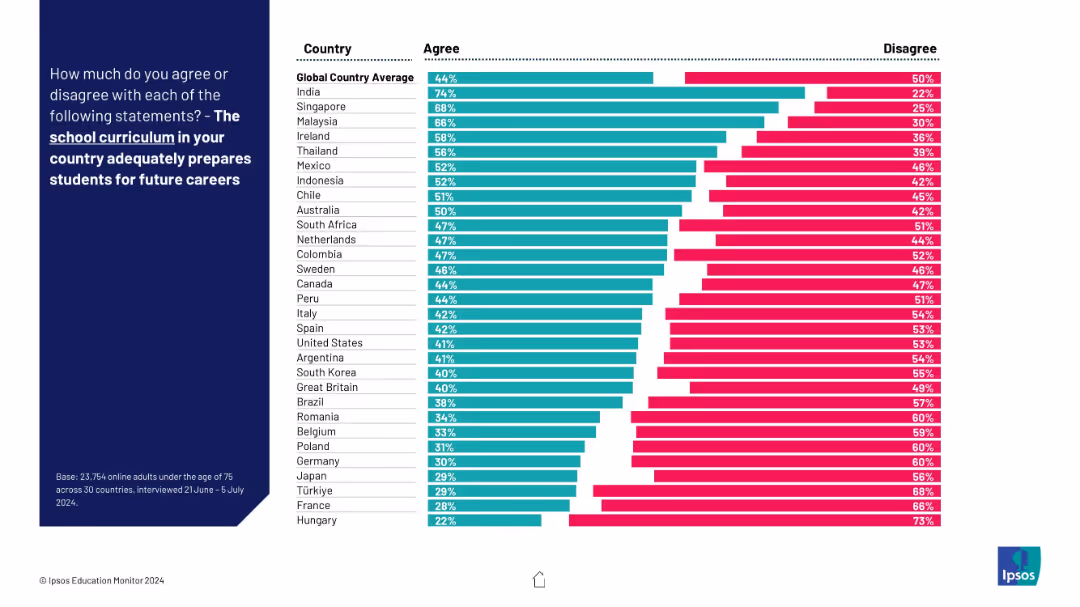
Country comparison bar chart with clear contrast in agree/disagree segments. Layout is consistent with other slides.
Strategic Planning
Education & Training
The slide illustrates perceptions of school curriculum adequacy by country. India and Singapore show highest confidence, while Hungary scores lowest. The global average is 44% agreement.
curriculum effectiveness, future career readiness, international comparison, school systems
false
Strategic Planning
Education & Training
Mixed Chart
IPSOS
Add to my slides
Remove from favorites
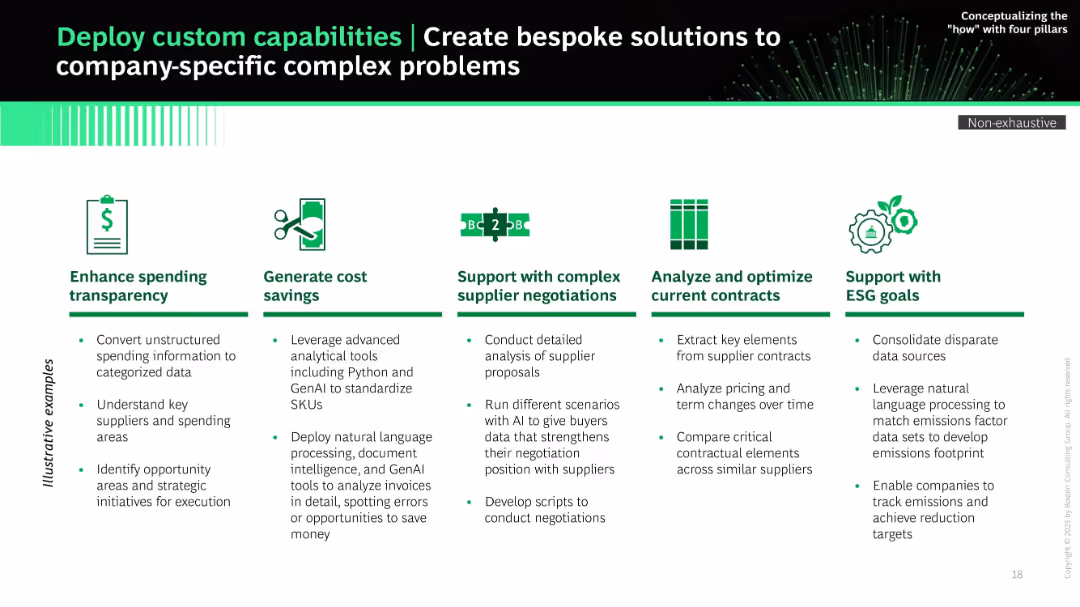
Horizontal column layout with icons and bullet lists under five use cases (e.g., ESG, cost savings). Green and black color palette.
Product and Service Analysis
Technology & Software
The slide outlines how custom GenAI solutions can address company-specific procurement challenges such as ESG compliance, supplier negotiations, cost analysis, and spending transparency. Use cases are well-illustrated with practical examples and supported by AI-driven data analytics.
custom AI, ESG, transparency, contract analysis, supplier negotiation, GenAI, procurement solutions
false
Product and Service Analysis
Technology & Software
Pillar
BCG
Add to my slides
Remove from favorites
The slide includes a dashboard with pie charts and column charts, showcasing customer accounts, revenue per product, and revenue per customer type, all displayed clearly.
Financial Performance
Energy & Utilities
The slide offers insights into customer accounts and revenue distribution by product and customer type, using various graphical representations to illustrate the data effectively.
customer accounts, revenue, product, customer type, utilities
false
Financial Performance
Energy & Utilities
Multiple Chart
EY
Add to my slides
Remove from favorites
The slide features a column chart comparing budgets allocated to customer acquisition versus retention, with summary statistics and illustrative arrows.
Market Analysis and Trends
Professional Services
Analyzes the budget allocation between customer acquisition and retention, highlighting a greater focus on acquisition in terms of budgetary spending.
customer acquisition, retention, budgets, analysis, comparison
false
Market Analysis and Trends
Professional Services
Mixed Chart
Deloitte
Add to my slides
Remove from favorites
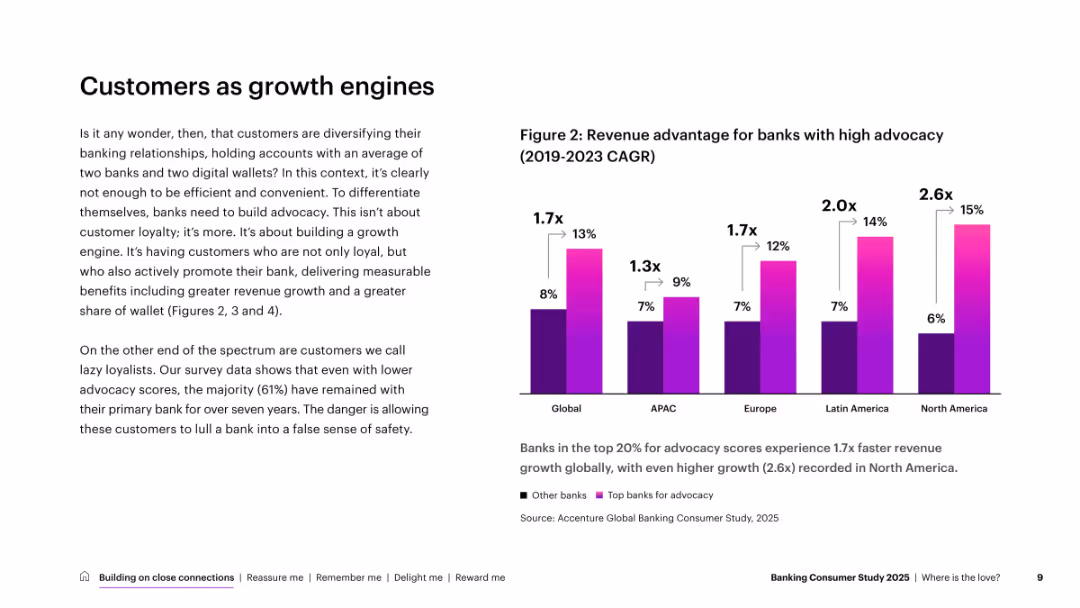
Left-side text and right-side vertical bar chart comparing revenue growth by region for banks with high advocacy. Minimalist layout.
Market Analysis and Trends
Financial Services
Discusses the value of customer advocacy in driving revenue. Shows high-advocacy banks achieve significantly better growth, especially in North America. Encourages cultivating promoters over just retaining loyalists.
customer advocacy, growth, revenue, banking, loyalty, regions
false
Market Analysis and Trends
Financial Services
Mixed Chart
Accenture
Add to my slides
Remove from favorites
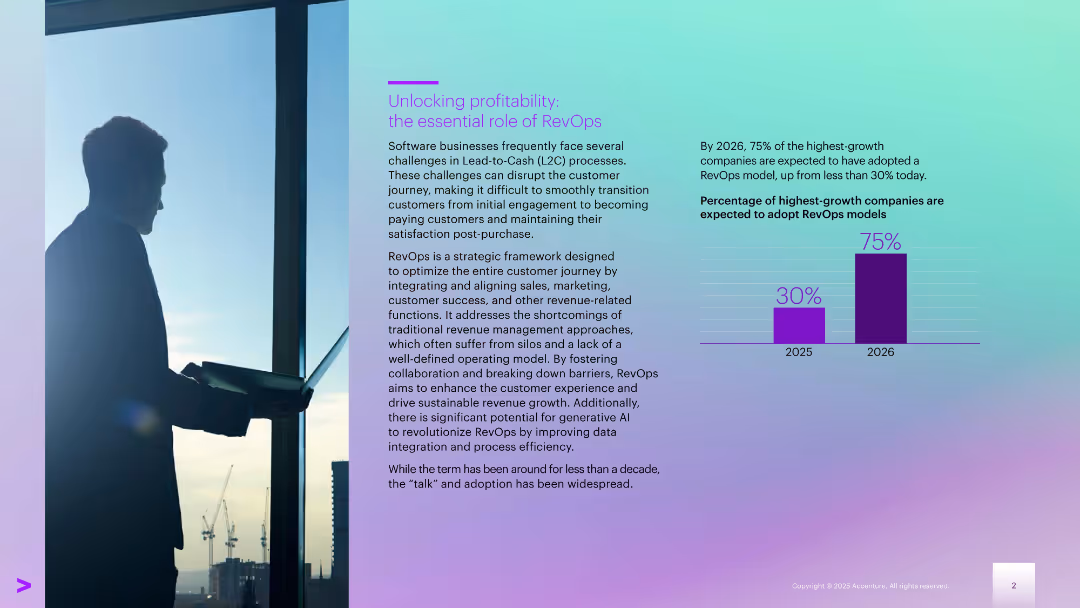
Left-aligned text with a city-view silhouette; right side includes a bar chart comparing 2025–2026 data
Technology and Digital Transformation
Technology & Software
Explains RevOps as a strategic model for optimizing the revenue journey. Notes the expected jump in adoption by high-growth companies (from 30% in 2025 to 75% in 2026). Focus is on aligning internal teams to improve customer success and revenue generation.
customer awareness, interest rates, banking satisfaction, pricing, savings, financial behavior
false
Technology and Digital Transformation
Technology & Software
Mixed Chart
Accenture
Add to my slides
Remove from favorites
The slide features a pie chart breaking down revenue by market sectors, with a list of specific client types.
Investment Analysis
Professional Services
Shows revenue sources by sector, focusing on defense, civil, global, and intelligence markets.
Customer base, revenue distribution, defense, civil, intelligence, global markets
false
Investment Analysis
Professional Services
Single Chart
Booz Allen Hamilton
Add to my slides
Remove from favorites
The slide features a pie chart breaking down the customer base by sector: Defense, Civil, Intelligence, and Global Commercial. Each sector has additional details listed alongside. The layout is clean and informative.
Customer and Market Segmentation
Professional Services
This slide outlines Booz Allen's diverse customer base across various sectors, including Defense, Civil, Intelligence, and Global Commercial. It highlights the company's broad reach and specialization in different market segments.
customer base, segmentation, defense, civil, intelligence
false
Customer and Market Segmentation
Professional Services
Mixed Chart
Booz Allen Hamilton
Add to my slides
Remove from favorites
This slide features bar charts and a line chart detailing reasons for customer contact and priorities, with textual explanations in boxes. The design is clean and informative, using shades of blue and green to differentiate data points.
Customer and Market Segmentation
Professional Services
Discusses the primary reasons customers contact service centers and their care priorities, based on a survey. Key insights support businesses in refining customer service strategies to better meet customer needs and preferences, especially in diverse regions.
customer contact, service priorities, survey analysis, customer care, segmentation
false
Customer and Market Segmentation
Professional Services
Multiple Chart
Deloitte
Add to my slides
Remove from favorites
The slide is content-rich with a comparative chart across industries, using a dark background and multiple colors to differentiate sectors. Each industry is represented by a horizontal bar, making the data comparison clear and easy to interpret.
Strategic Planning
Retail & E-commerce
This comparative slide offers a forward-looking analysis of various industries' intended approaches to customer data sales by 2026, useful in strategic planning sessions where data handling policies are crucial.
Customer Data, Industry Comparison, 2026, Data Sales Strategy, Strategic Planning, Policy
false
Strategic Planning
Retail & E-commerce
Single Chart
Kearney
Add to my slides
Remove from favorites
Slide shows a line chart with a stability in the integration effectiveness of customer data across channels, with industry comparisons.
Technology and Digital Transformation
Professional Services
Reviews the ongoing challenge of integrating customer data across channels, relevant for risk assessment and digital transformation in tech and healthcare.
customer data, integration, technology, healthcare, digital transformation, risk assessment, challenge, stability
false
Technology and Digital Transformation
Professional Services
Mixed Chart
Deloitte
Add to my slides
Remove from favorites
The slide showcases a dashboard with multiple data visualizations, including line and bar charts, detailing customer debt, active debt, and highest debt customers.
Financial Performance
Energy & Utilities
This slide details customer debt metrics, including total debt amount, active debt, and highest debt customers, presented through various graphical elements for clear understanding.
customer debt, active debt, highest debt, utilities, metrics
false
Financial Performance
Energy & Utilities
Multiple Chart
EY
Add to my slides
Remove from favorites
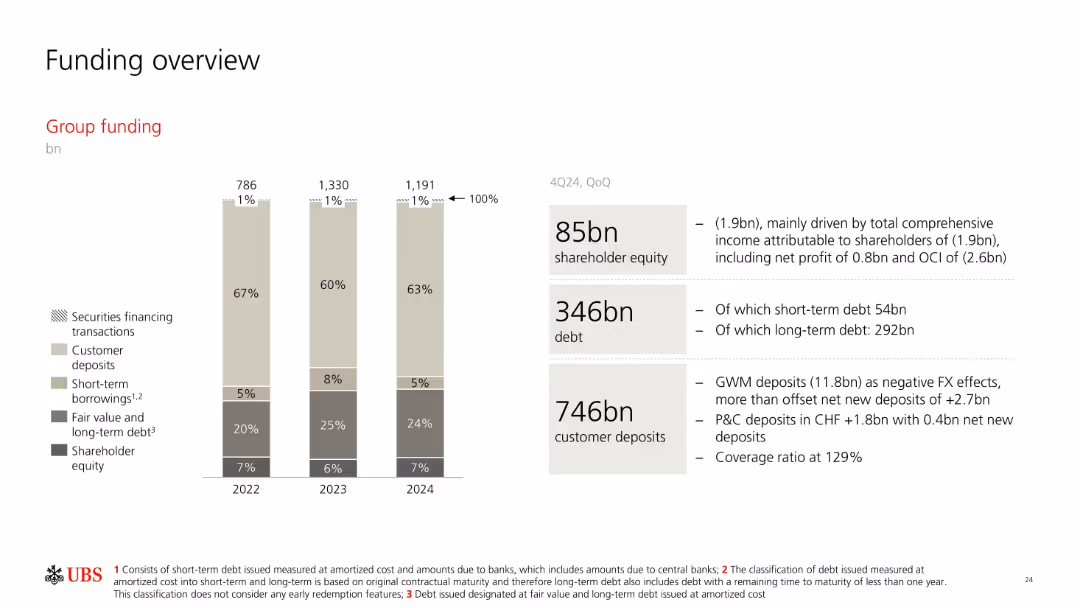
Vertical stacked bar chart (2022–2024) on the left with percentage allocations; large text boxes on the right summarizing key figures. Muted color scheme, clear segmentation, minimalistic style.
Financial Performance
Financial Services
Shows the evolution of UBS's group funding composition from 2022 to 2024, breaking down sources such as customer deposits, short- and long-term debt, and shareholder equity. Right section provides a quarterly update for Q4 2024 including detailed changes in equity, debt, and customer deposits.
customer deposits, debt, shareholder equity, Q4 2024, funding, UBS
false
Financial Performance
Financial Services
Mixed Chart
UBS
Add to my slides
Remove from favorites
The slide features two column charts showing the Net Promoter Score, cross-selling of products to mortgage customers, and the benefits of Chase deposit customers opening a mortgage. Text and legends explain the charts.
Customer and Market Segmentation
Financial Services
It discusses customer engagement strategies, depicted by net promoter scores, product cross-selling, and customer loyalty benefits. Such data help in understanding customer satisfaction and cross-sell success rates in mortgage and banking services.
customer engagement, net promoter, cross-selling, mortgage, loyalty
false
Customer and Market Segmentation
Financial Services
Multiple Chart
JP Morgan
Add to my slides
Remove from favorites
Slide features a title, three sets of column charts, and bullet points. Charts depict engagement metrics like spend engagement, product adoption, and customer satisfaction. Colors vary from gray, blue, to green for visual distinction.
Market Analysis and Trends
Financial Services
The slide is used to show how customer engagement can lead to better relationships and growth within Chase. It highlights the correlation between engagement metrics and likelihood to adopt more products, profitability, and satisfaction.
Customer Engagement, Relationship Growth, Profitability, Product Adoption, Satisfaction, Metrics, Financial Services, Data Visualization, Comparative Analysis, Chase
false
Market Analysis and Trends
Financial Services
Multiple Chart
JP Morgan
Add to my slides
Remove from favorites
Features two column charts displaying percentages of revenue from after-sales and add-on sales services. The charts are shaded in blue with varying heights.
Operational Efficiency
Environmental Services & Sustainability
This slide highlights unexploited areas of customer engagement through after-sales and add-on services, reflecting on the economic potential lost in not maximizing material and energy regeneration.
customer engagement, revenue, after-sales, add-on sales, material regeneration, energy, sustainability
false
Operational Efficiency
Environmental Services & Sustainability
Multiple Chart
Accenture
Add to my slides
Remove from favorites
Features three column charts comparing the annual sales, revenue, and attrition rates between customers who redeem Ultimate Rewards® once, multiple times, or not at all. There's a clear focus on the benefits of engagement.
Client Case Studies
Financial Services
Analyzes the positive impact of the Ultimate Rewards® program on customer engagement, showing how redeemers contribute to higher sales and revenue and lower attrition rates.
customer engagement, rewards program, sales, revenue, attrition
false
Client Case Studies
Financial Services
Multiple Chart
JP Morgan
Add to my slides
Remove from favorites
This slide displays a structured flow diagram illustrating three stages of customer episode design with connected circular nodes and sequential steps.
Strategic Planning
Professional Services
Outlines the agile approach in designing customer interaction episodes, highlighting the step-by-step process in a cross-functional team setting. Useful for strategic business planning.
customer episodes, agile, design approach, strategic planning, cross-functional
false
Strategic Planning
Professional Services
Diagram
Bain
Add to my slides
Remove from favorites
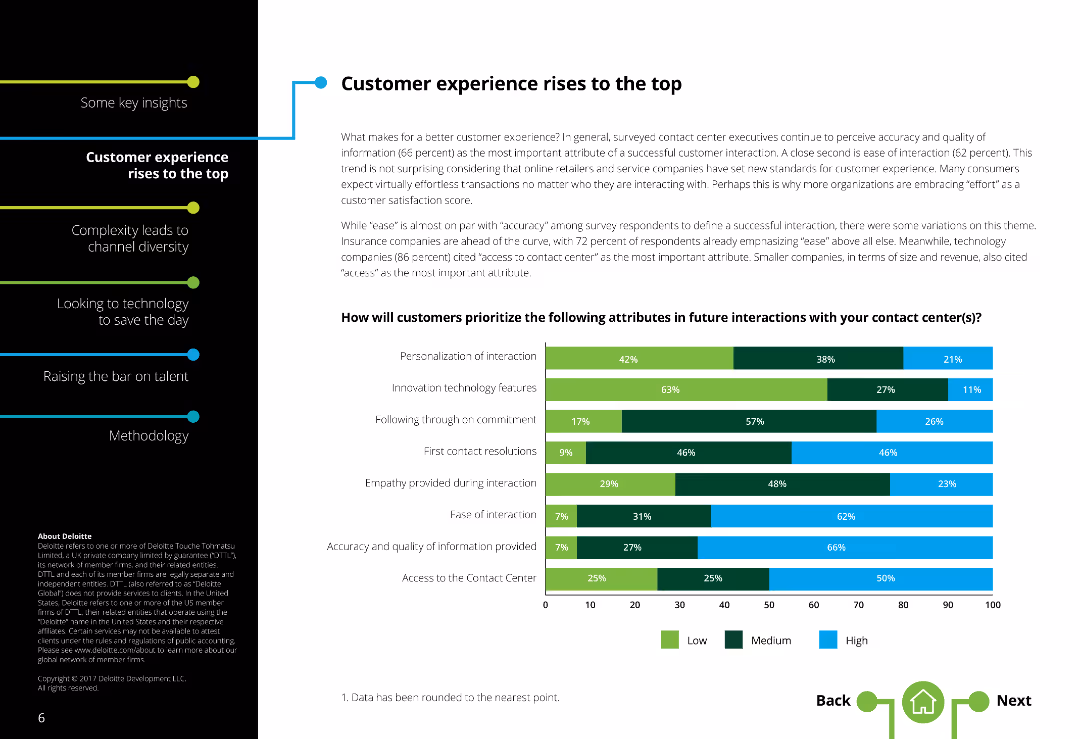
The slide has a two-column layout with text on the left and a horizontal bar chart on the right. There is moderate text density.
Market Analysis and Trends
Professional Services
The slide discusses the importance of customer experience in contact centers, highlighting attributes like ease, accuracy, and access.
Customer experience, Contact centers, Customer satisfaction, Service quality, Ease of interaction, Accuracy, Access, Personalization
false
Market Analysis and Trends
Professional Services
Mixed Chart
Deloitte
Add to my slides
Remove from favorites
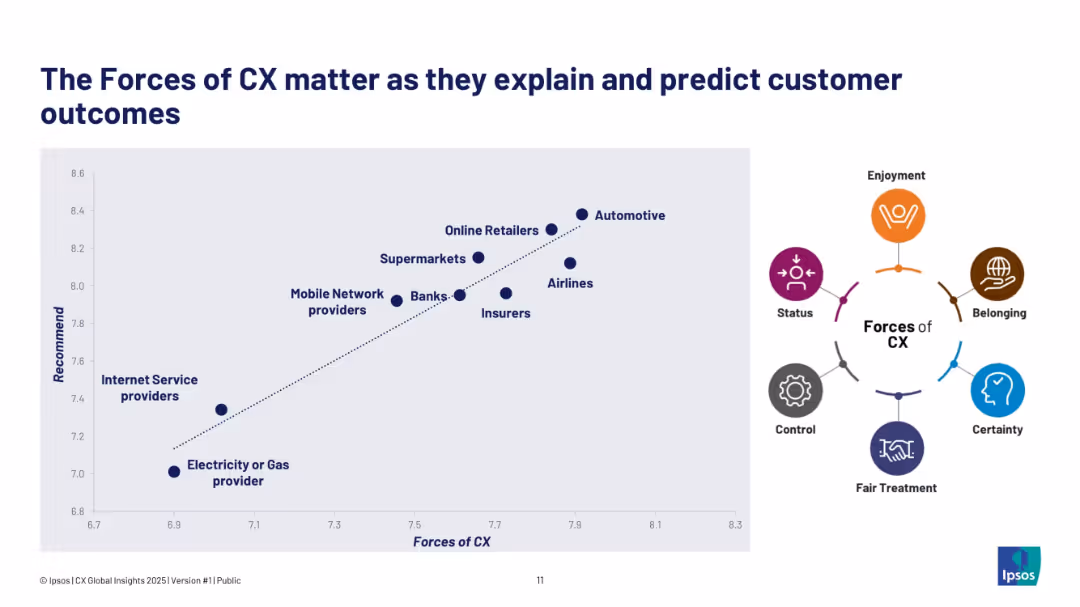
Scatter plot chart correlating CX forces and recommendation levels; icons on right depict 6 forces of CX.
Customer and Market Segmentation
Consumer Goods
The slide presents a correlation between CX forces (e.g., enjoyment, status, fairness) and brand recommendations. Sectors like automotive and online retail score high, reinforcing the importance of emotional and rational drivers in customer satisfaction and advocacy.
customer experience, CX drivers, recommendations, emotional forces
false
Customer and Market Segmentation
Consumer Goods
Mixed Chart
IPSOS
Add to my slides
Remove from favorites
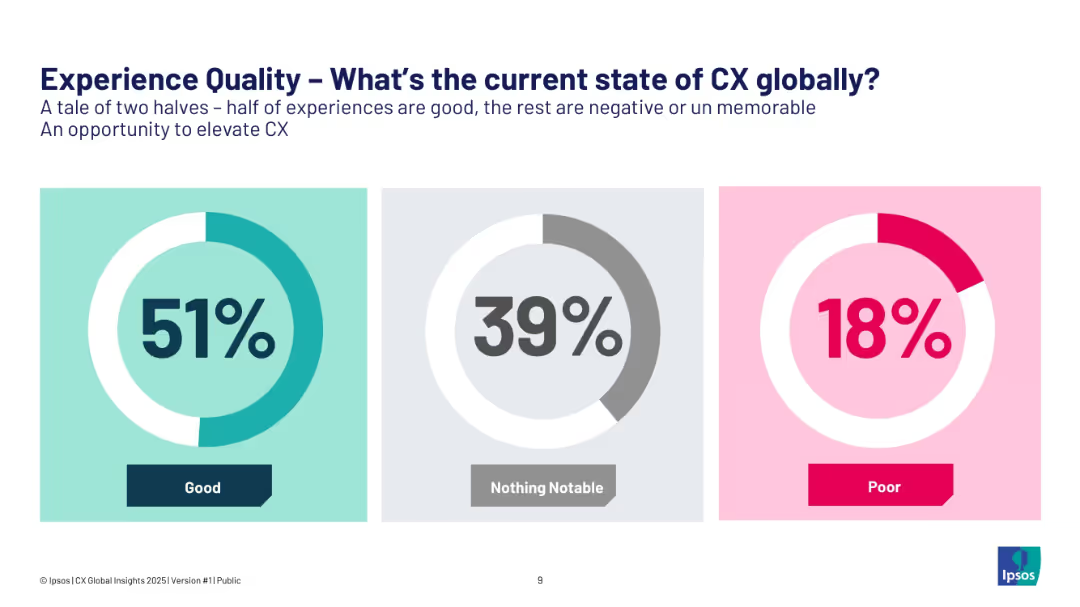
Three circular infographics showing experience quality percentages: Good (51%), Notable (39%), Poor (18%).
Performance Metrics and KPIs
Consumer Goods
This visual summarizes global customer experience quality. While 51% of experiences are rated good, the remaining are either unmemorable or poor, suggesting an opportunity to improve CX and drive better outcomes through enhanced emotional and functional engagement.
customer experience, CX, feedback, global insights, satisfaction
false
Performance Metrics and KPIs
Consumer Goods
Single Chart
IPSOS
Add to my slides
Remove from favorites
Diagram showcasing five components of an integrated customer experience toolkit, involving digital and organizational elements.
Technology and Digital Transformation
Professional Services
Details a toolkit for enhancing customer experience through digital transformation, emphasizing the integration of feedback loops and digital interactions.
Customer Experience, Digital, Strategy
false
Technology and Digital Transformation
Professional Services
Linear Flow
Bain
Add to my slides
Remove from favorites
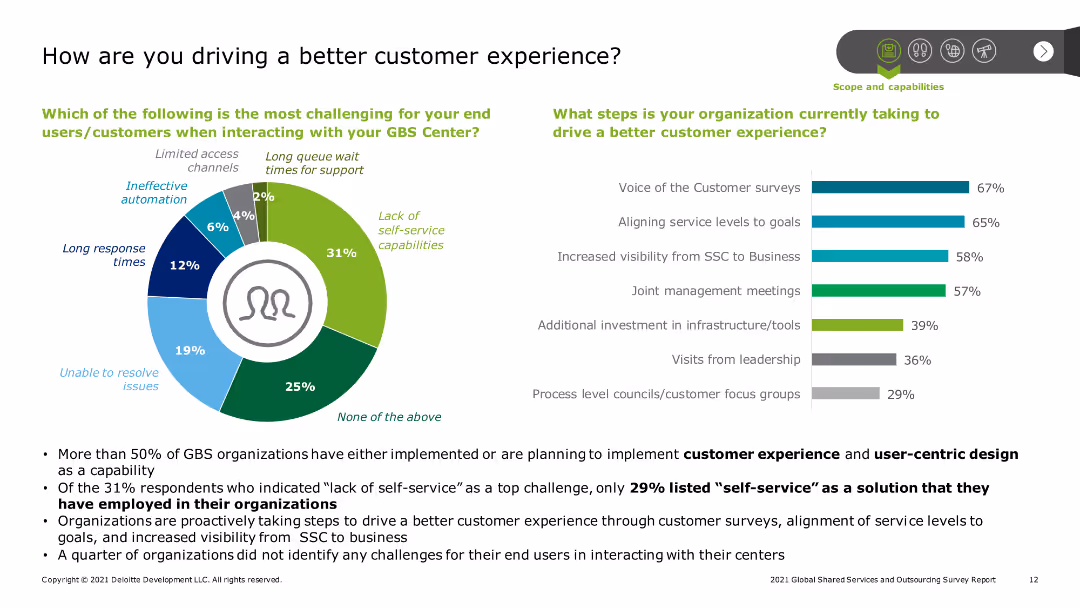
The slide features a pie chart on the left depicting challenges faced by customers interacting with GBS centers, such as long response times and lack of self-service capabilities. On the right, a bar chart lists steps organizations are taking to improve customer experience.
Strategic Planning
Professional Services
The slide explores challenges and improvement steps related to customer experience in GBS centers. It identifies major pain points like long response times and lack of self-service, and details actions being taken, such as surveys, aligning service levels, and increased visibility.
Customer experience, GBS centers, interaction challenges, improvement steps, long response times, self-service capabilities, surveys, service alignment
false
Strategic Planning
Professional Services
Multiple Chart
Deloitte
Add to my slides
Remove from favorites
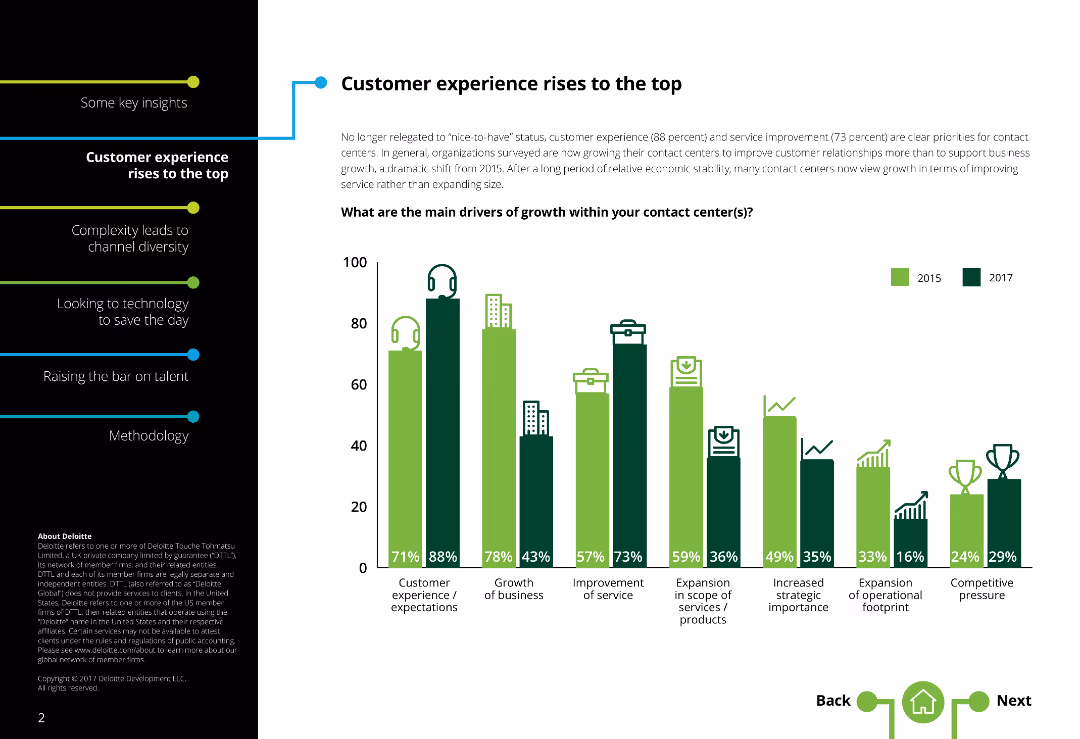
This slide includes a column chart comparing various drivers of growth in contact centers across different years, with icons representing each driver.
Market Analysis and Trends
Professional Services
The slide highlights key drivers of growth within contact centers, emphasizing customer experience and service improvement. It compares data from different years and includes insights into how companies prioritize different growth factors, such as customer expectations, business growth, and service improvement.
Customer experience, growth drivers, contact centers, column chart, service improvement
false
Market Analysis and Trends
Professional Services
Single Chart
Deloitte
Add to my slides
Remove from favorites
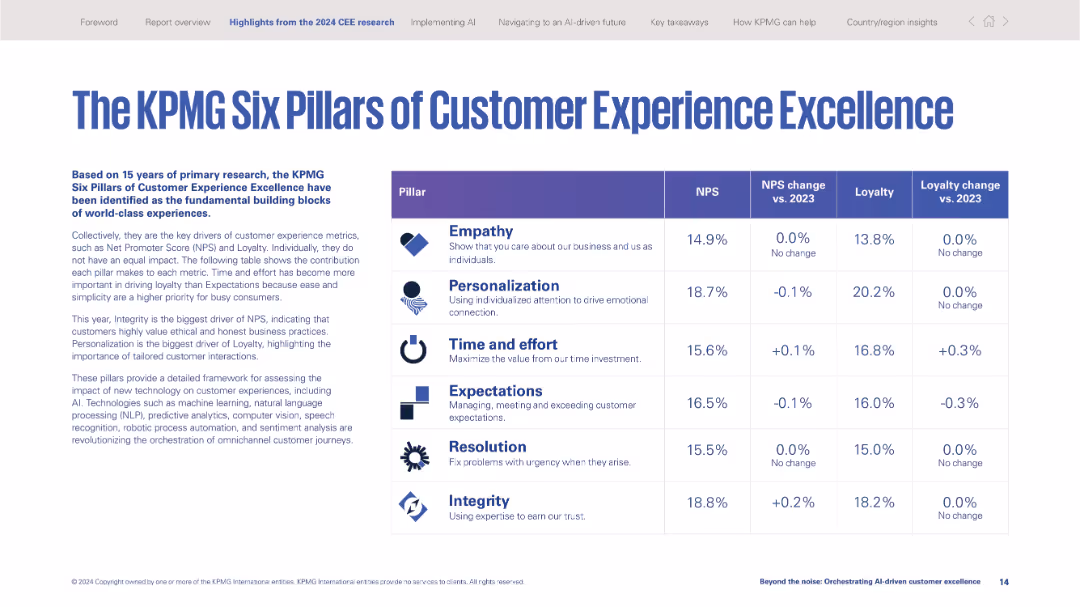
Table format listing six pillars with corresponding metrics (NPS, loyalty) and year-over-year changes.
Performance Metrics and KPIs
Professional Services
Summarizes KPMG's customer experience framework: Empathy, Personalization, Time and Effort, Expectations, Resolution, and Integrity. Shows data impact on NPS and loyalty metrics, emphasizing value alignment.
customer experience, KPIs, NPS, loyalty, empathy, personalization, integrity, KPMG framework, performance
false
Performance Metrics and KPIs
Professional Services
Table
KPMG
Add to my slides
Remove from favorites
This slide presents bar charts comparing marketing budget allocation for customer experience across different company sizes and revenues, with a clear, structured layout.
Market Analysis and Trends
Professional Services
It examines the allocation of marketing budgets towards customer experience initiatives, segmented by company size and revenue, offering strategic insights.
customer experience, marketing, budget, analysis
false
Market Analysis and Trends
Professional Services
Multiple Chart
Deloitte
Add to my slides
Remove from favorites
Grid-style layout with data points, stats, and textual commentary about customer experience trends by sector.
Market Analysis and Trends
Professional Services
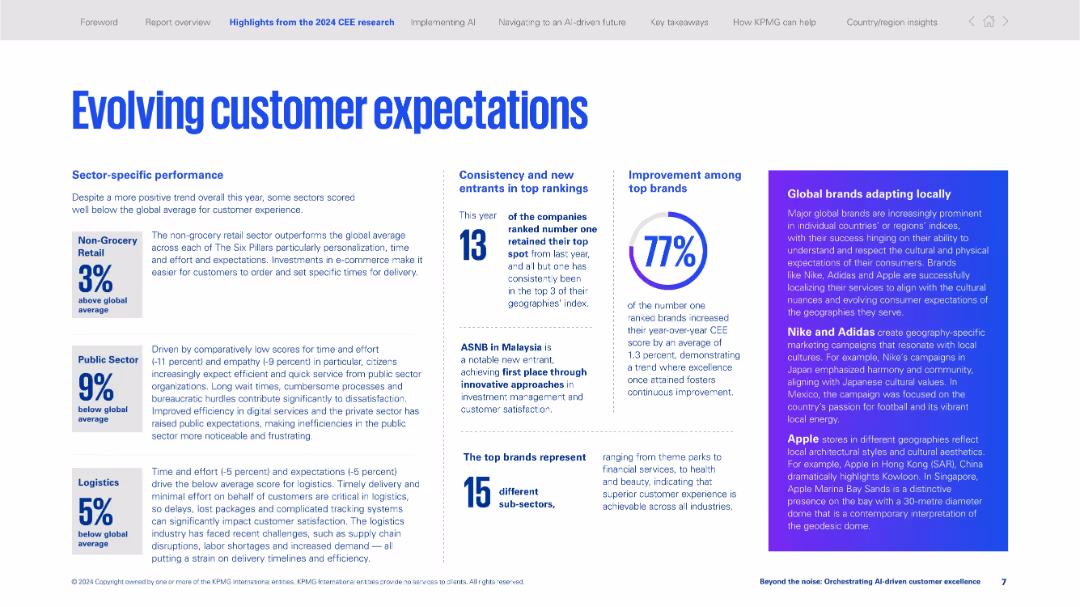
Analyzes customer experience across sectors such as retail, public, and logistics. Discusses emerging consumer expectations and brand localization strategies. Provides CEE performance benchmarks and brand highlights.
customer experience, sector trends, logistics, retail, public sector, localization, brand strategy, global brands, expectations
false
Market Analysis and Trends
Professional Services
Mixed Chart
KPMG
Add to my slides
Remove from favorites
This slide compares current customer experience metrics with future goals using bullet points and lists, divided by a central arrow indicating direction.
Strategic Planning
Financial Services
This slide compares current customer service ratings and future improvement areas for a bank, emphasizing the need for more resilient platforms and a tailored servicing model to achieve best-in-class customer experiences, thus guiding strategic customer service enhancements.
Customer Experience, Service Quality, Improvement
false
Strategic Planning
Financial Services
Linear Flow
Barclays
Add to my slides
Remove from favorites
Split-screen layout with explanatory text on left and curved arc diagram on right showing use case progression over time.
Strategic Planning
Financial Services
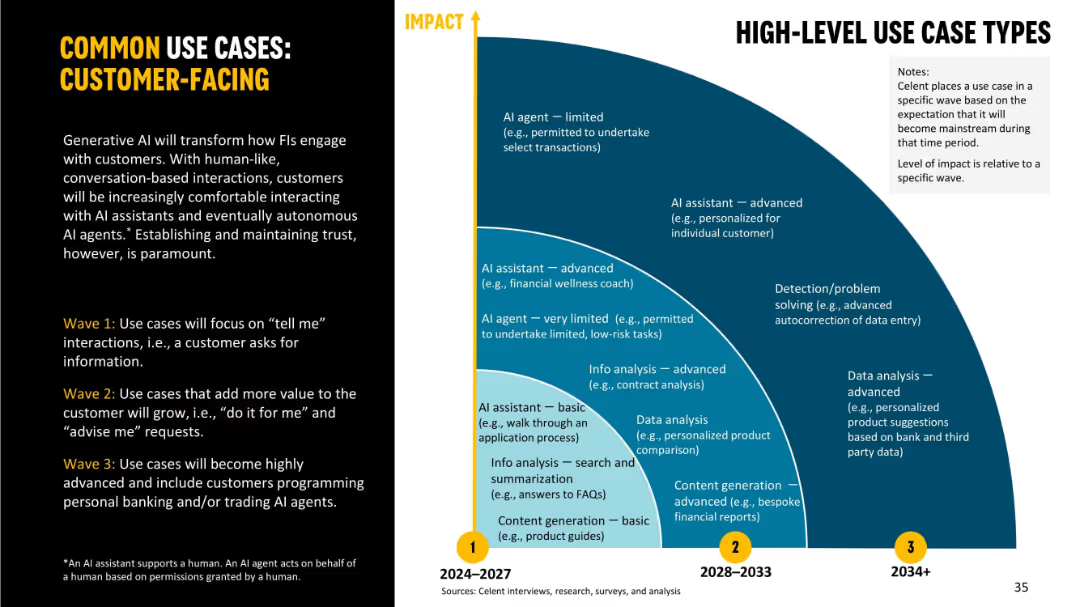
Highlights how GenAI will change customer engagement in financial institutions over three waves. Shows the transition from simple FAQ bots to advanced AI agents managing financial interactions, improving trust and personalization.
customer-facing, GenAI, AI assistant, personalization, financial services, roadmap
false
Strategic Planning
Financial Services
Mixed Chart
Oliver Wyman
Add to my slides
Remove from favorites
The slide features a combination of a pie chart and speech bubbles showing the anticipated importance of customer feedback within companies, with percentages for each aspect.
Market Analysis and Trends
Professional Services
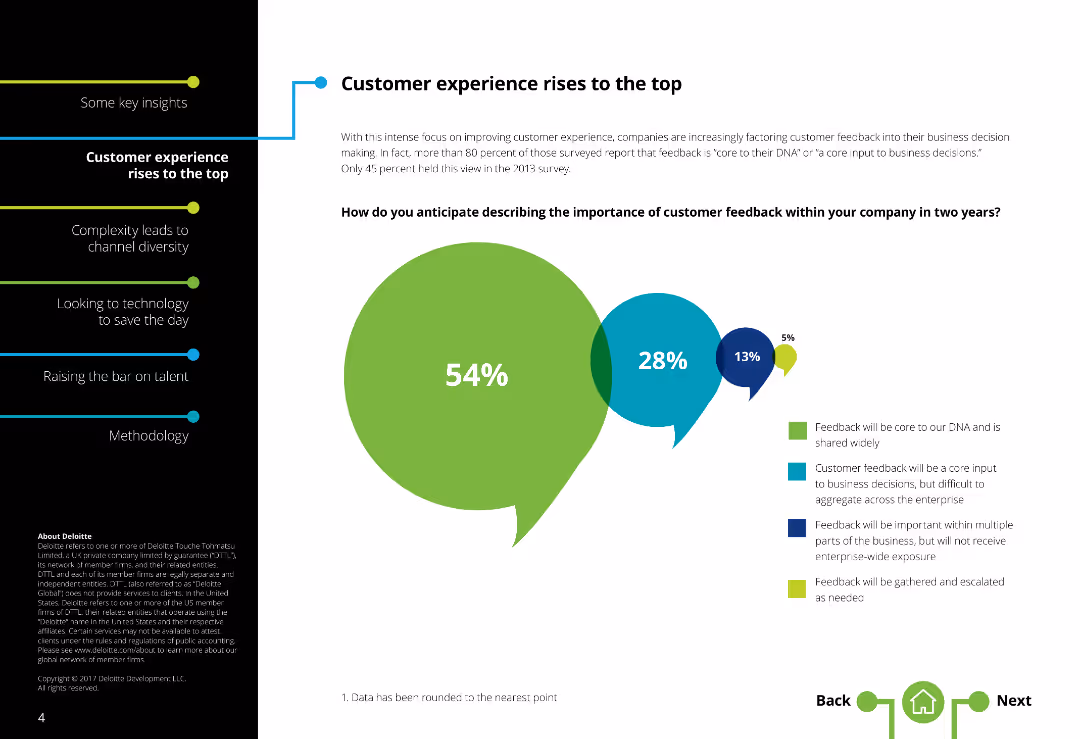
The slide discusses the anticipated significance of customer feedback in business decision-making. It presents survey data indicating how companies plan to incorporate customer feedback into their core processes, highlighting the percentage of respondents who view feedback as crucial for future business decisions.
Customer feedback, business decisions, survey, pie chart, speech bubbles
false
Market Analysis and Trends
Professional Services
Single Chart
Deloitte
Add to my slides
Remove from favorites
This slide features various icons and column charts displaying effective methods for capturing customer feedback in contact centers, with percentage data for each method.
Market Analysis and Trends
Professional Services
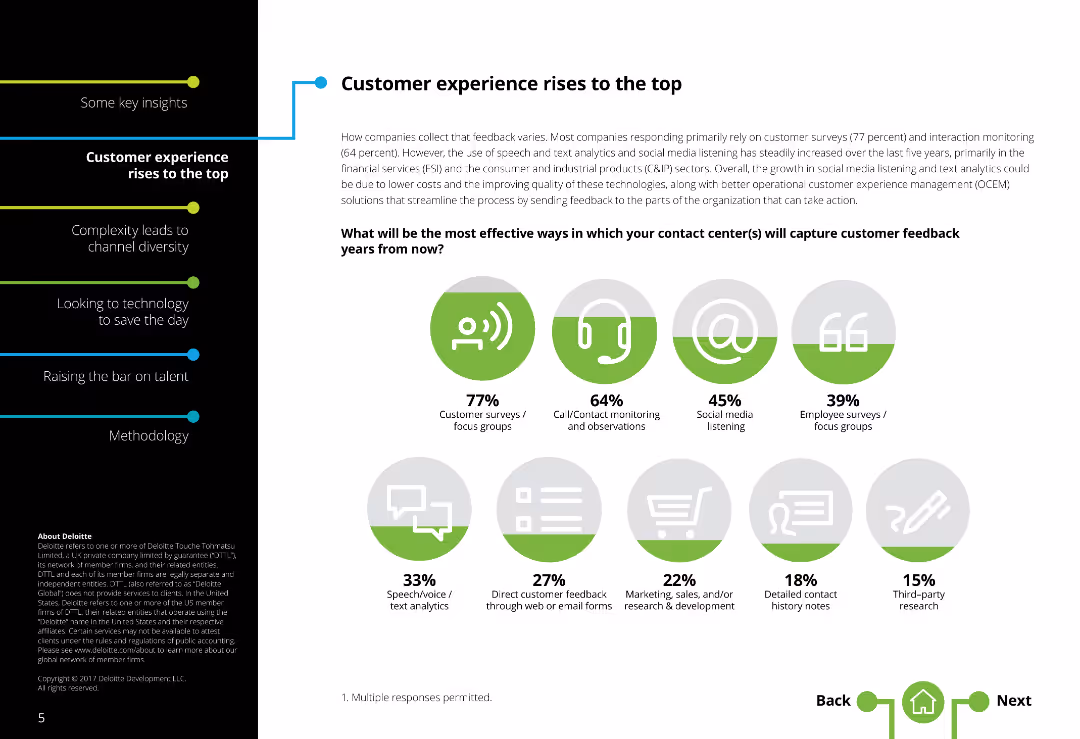
The slide outlines the most effective ways for contact centers to capture customer feedback. It includes survey data showing the prevalence of different methods such as customer surveys, call/contact monitoring, social media listening, and employee focus groups, presented with corresponding icons and column charts.
Customer feedback, contact centers, survey methods, column charts, engagement
false
Market Analysis and Trends
Professional Services
Single Chart
Deloitte
Add to my slides
Remove from favorites
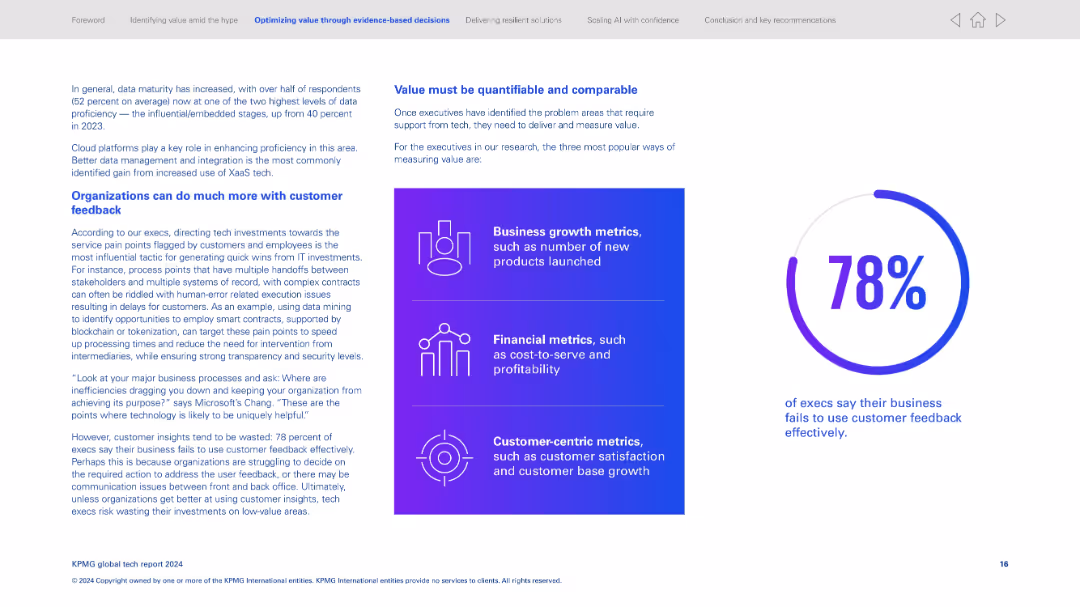
Two-column design; left side has textual insights, right features three metric types in a purple gradient box and a large stat circle.
Customer and Market Segmentation
Technology & Software
Explains the gap in using customer feedback effectively—78% of execs acknowledge the shortfall. Encourages using data and smart contracts to target customer pain points. Identifies how value is commonly measured via business, financial, and customer metrics.
Customer feedback, value metrics, smart contracts, process improvement, data utilization, business impact, satisfaction, ROI
false
Customer and Market Segmentation
Technology & Software
Mixed Chart
KPMG
Add to my slides
Remove from favorites
This slide features a column chart displaying the growth of consumer and small business CCB customers over a period from 2019 to 2022, with an 8% increase highlight. It also contains a list of key financial statistics with arrows indicating upward or downward trends, presented in a clear and professional manner.
Financial Performance
Financial Services
The slide analyzes the significant growth of consumer and small business customers over several years, highlighting success in different financial metrics. It's likely used to demonstrate market performance and customer base expansion to stakeholders.
Customer Growth, CCB, Small Business, Financial Statistics, Market Performance, Consumer Base
false
Financial Performance
Financial Services
Single Chart
JP Morgan
Add to my slides
Remove from favorites
Contains text descriptions and bullet points with a sidebar example of an Indian alcohol beverage manufacturer, a QR code, and percentage growth figures.
Market Analysis and Trends
Professional Services
Describes strategies for leveraging customer insights to develop and prioritize demand spaces, illustrated by a case study with positive growth outcomes.
Customer Insights, Demographics, Market Segmentation, Demand Spaces, Growth Strategy
false
Market Analysis and Trends
Professional Services
Text Only
BCG
Add to my slides
Remove from favorites
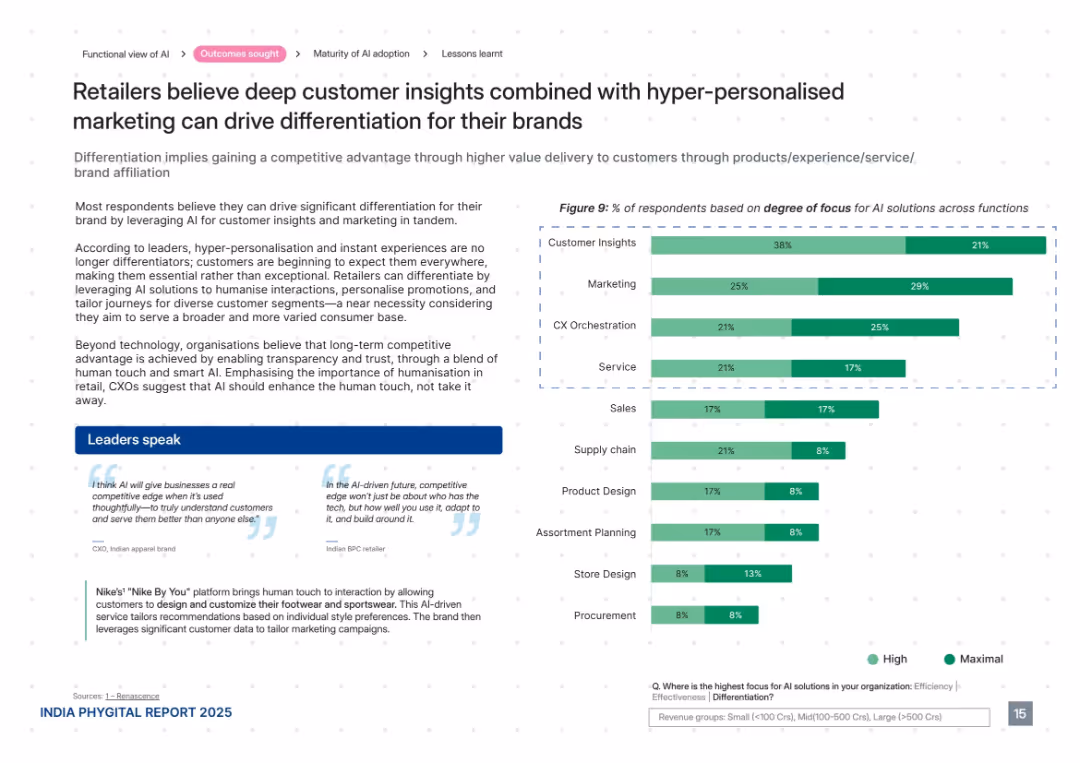
Light layout with a stacked bar chart on the right, detailed textual insights on the left, and multiple quotes at the bottom. Clean structure with green-highlighted callout.
Customer and Market Segmentation
Retail & E-commerce
This slide explains how customer insights combined with hyper-personalized marketing help brands differentiate. It stresses the need for humanized AI experiences, emphasizing trust and personalization. The bar chart shows high focus on insights, marketing, and CX orchestration. Leaders advocate blending data with empathy for customer loyalty.
customer insights, personalization, brand differentiation, trust, CX orchestration, retail AI, empathy, segmentation
false
Customer and Market Segmentation
Retail & E-commerce
Mixed Chart
PwC/Strategy&
Add to my slides
Remove from favorites
The slide features flowcharts with different stages of a customer journey in car buying. It integrates text blocks with directional arrows.
Industry Overview
Technology & Software
This slide visualizes the customer journey in car buying, highlighting market understanding, customer acquisition, risk management, and relationship enhancement as key stages, aimed at optimizing customer experience.
customer journey, car buying, market understanding, risk management, relationship building
false
Industry Overview
Technology & Software
Linear Flow
Barclays
Add to my slides
Remove from favorites
Flowchart mapping challenges in customer journey touchpoints, colored coded and detailed annotations.
Strategic Planning
Professional Services
Analyzes customer journey challenges, identifying key areas for improvement in marketing and customer service strategies across the sales process.
customer journey, challenges, marketing
false
Strategic Planning
Professional Services
Multiple Chart
BCG
Add to my slides
Remove from favorites
The slide is visually balanced, featuring a customer journey flowchart on the left and two sets of bulleted lists on the right describing commerce experiences and core capabilities.
Strategic Planning
Financial Services
Discusses strategies for engaging customers through commerce, with a focus on providing end-to-end customer experiences and driving merchant value.
customer journey, commerce, engagement, experiences, capabilities, value creation, financial strategy
false
Strategic Planning
Financial Services
Diagram
JP Morgan
Add to my slides
Remove from favorites
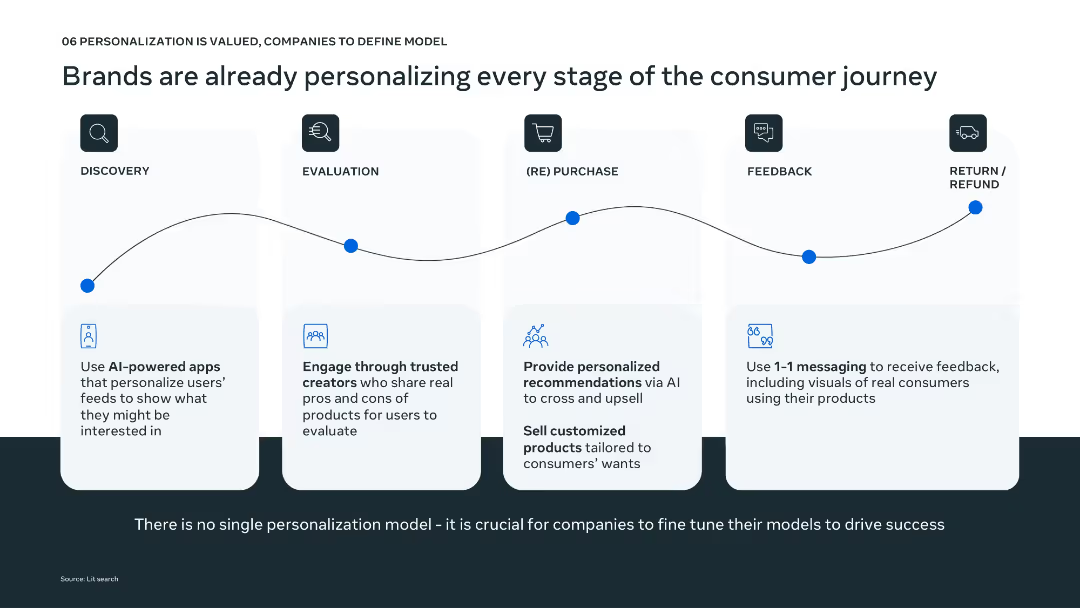
Timeline layout from discovery to refund; icons and minimal text explain personalization strategies at each stage.
Technology and Digital Transformation
Technology & Software
Shows how brands are applying personalization across the consumer journey using tools like AI-powered discovery, trusted evaluation, personalized recommendations, 1:1 feedback loops, and tailored return processes. Highlights the importance of model tuning for effective execution.
customer journey, personalization, AI tools, feedback, discovery
false
Technology and Digital Transformation
Technology & Software
Pillar
Bain
Add to my slides
Remove from favorites
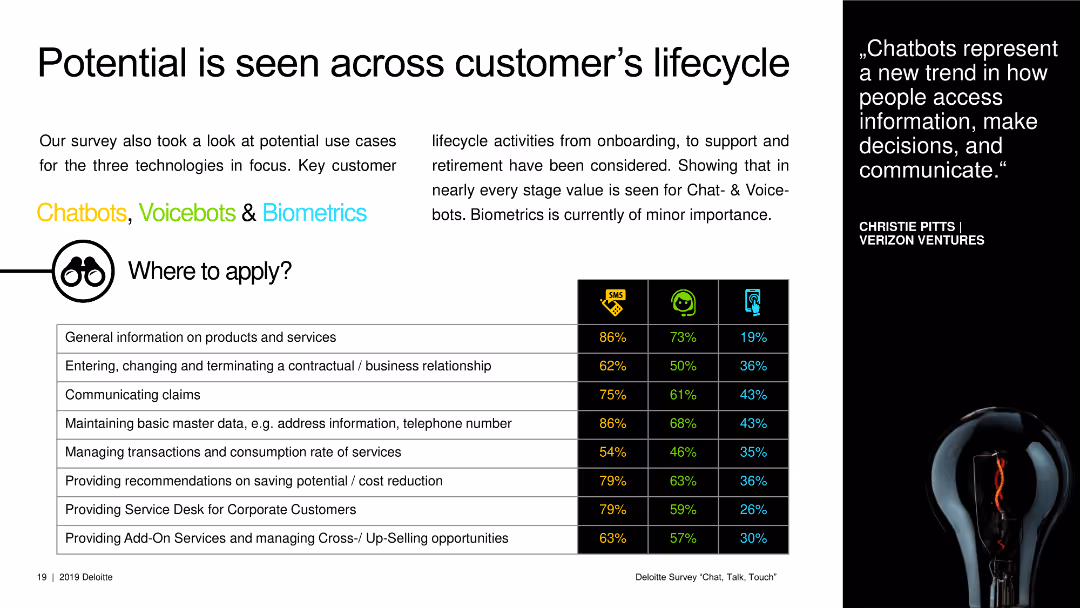
A text slide with a table showing the percentage of potential use cases for chatbots, voicebots, and biometrics across lifecycles.
Market Analysis and Trends
Technology & Software
The slide examines potential use cases for chatbots, voicebots, and biometrics throughout the customer lifecycle.
customer lifecycle, potential use cases, chatbots, voicebots, biometrics, market analysis
false
Market Analysis and Trends
Technology & Software
Table
Deloitte
Add to my slides
Remove from favorites
The slide provides demographic information and wealth distribution across customer life cycles, using column chart and a life cycle curve. It illustrates the number of affluent adults and their corresponding liquid wealth in tranches. The slide is clean, with contrasting colors for different data segments, primarily green and grey. Textual descriptions accompany each visual, providing context. The Quilter logo is visible in the corner.
Customer and Market Segmentation
Financial Services
The slide explores the wealth distribution among UK adults and opportunities for wealth management services throughout the customer lifecycle, suitable for discussions on market segmentation and service offering development.
Customer Lifecycle, Wealth Management, Demographic Analysis, Market Segmentation, Asset Bands, Financial Services, Quilter, Customer Wealth
false
Customer and Market Segmentation
Financial Services
Mixed Chart
Morgan Stanley
Add to my slides
Remove from favorites
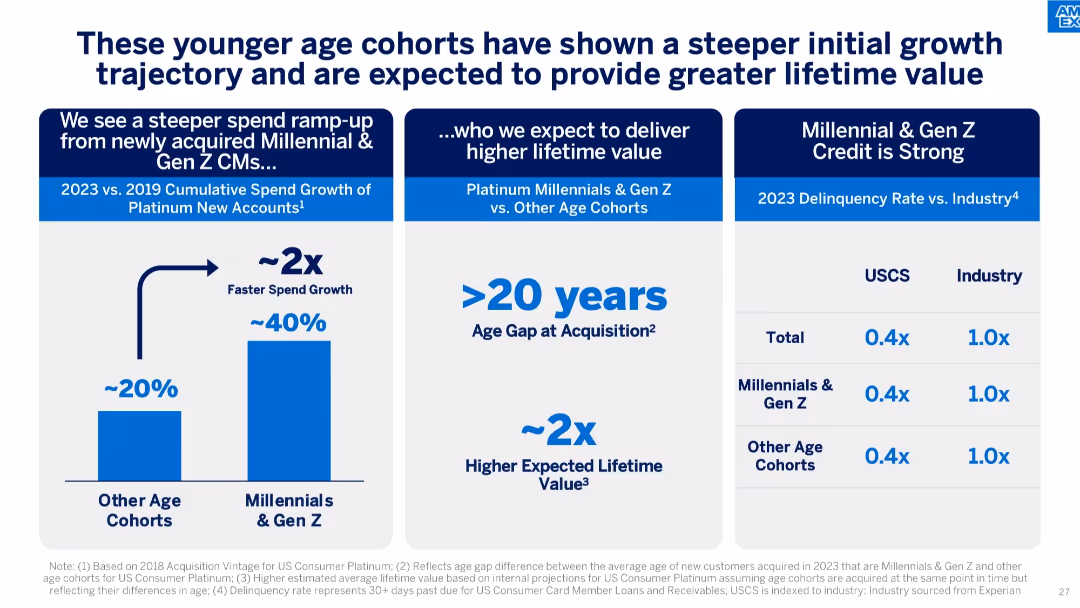
Triple-panel design comparing spend growth, age gap, and delinquency rate by age cohort.
Strategic Planning
Financial Services
Shows that Millennials and Gen Z ramp up spending faster and have lower delinquency rates, with an expected higher lifetime value due to younger acquisition age.
customer lifetime value, millennials, gen Z, spend growth, age gap, credit performance, delinquency
false
Strategic Planning
Financial Services
Mixed Chart
McKinsey
Add to my slides
Remove from favorites
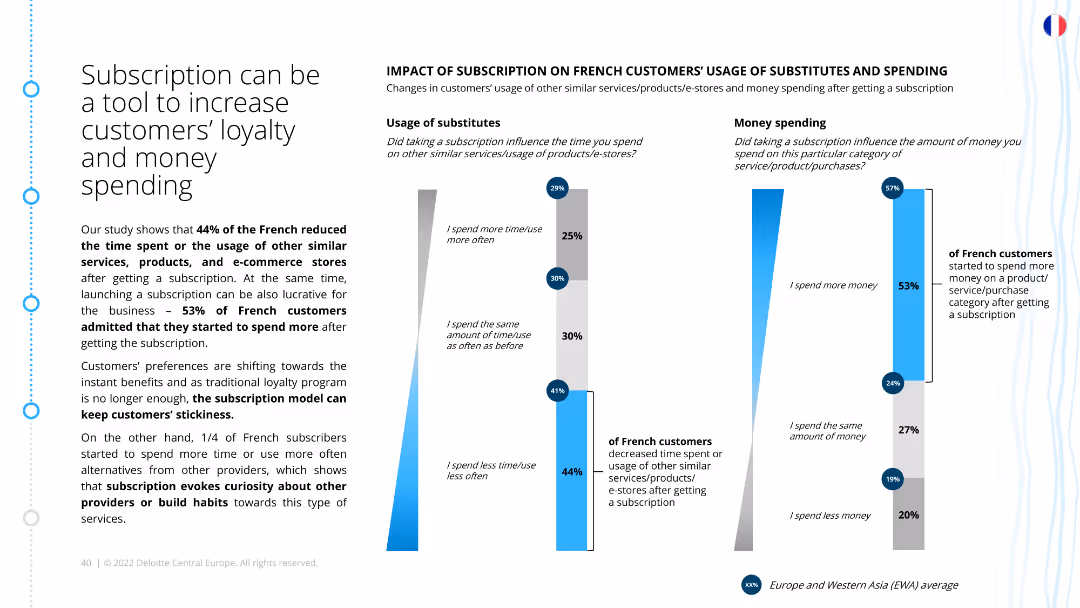
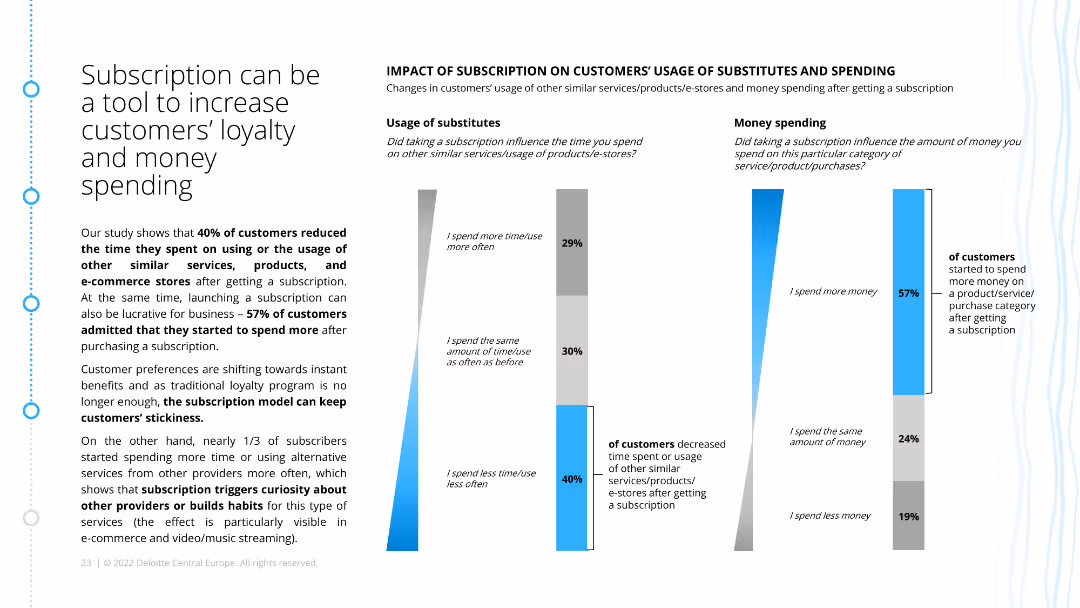
The slide features a bar chart and a column chart. The bar chart shows changes in the usage of substitutes after getting a subscription, and the column chart illustrates changes in spending habits among French customers after subscribing to services or products.
Strategic Planning
Consumer Goods
The slide presents findings on how subscriptions can enhance customer loyalty and spending. It shows that a significant portion of French customers reduced their use of substitutes and increased their spending after subscribing, indicating the effectiveness of subscription models.
Customer loyalty, spending habits, subscription impact, substitutes usage, French market, customer retention, spending increase, loyalty strategy
false
Strategic Planning
Consumer Goods
Multiple Chart
Deloitte
Add to my slides
Remove from favorites
Bar chart and global comparison panel showcasing top strategic actions for customer loyalty and technology initiatives.
Strategic Planning
Professional Services
This slide focuses on strategic priorities for boosting customer loyalty through product offerings and technology, comparing with global data.
Customer loyalty, strategic priorities, technology, product offerings, global comparison, actions, initiatives
false
Strategic Planning
Professional Services
Multiple Chart
EY
Add to my slides
Remove from favorites
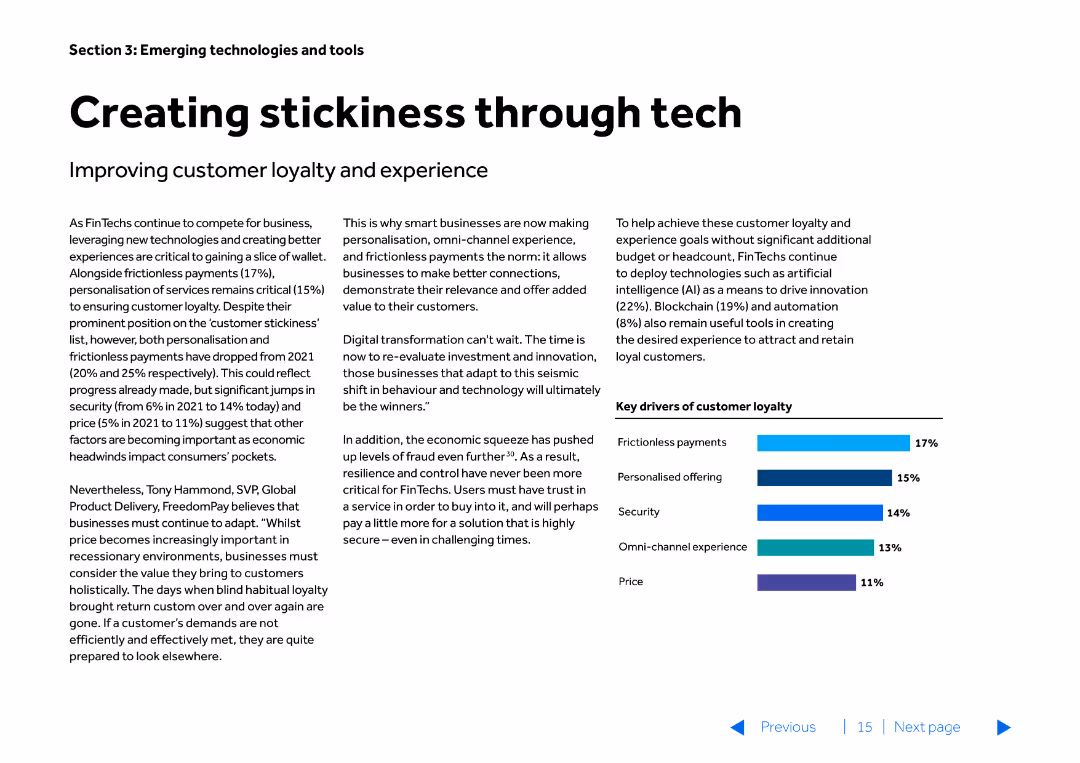
The slide contains a mix of text and a small bar chart at the bottom right. It discusses key drivers of customer loyalty with a focus on technology solutions.
Customer and Market Segmentation
Financial Services
Highlights how technology can enhance customer loyalty and experience, detailing the importance of personalisation, omni-channel experience, and security.
customer loyalty, technology, personalisation, omni-channel, security
false
Customer and Market Segmentation
Financial Services
Mixed Chart
Barclays
Add to my slides
Remove from favorites
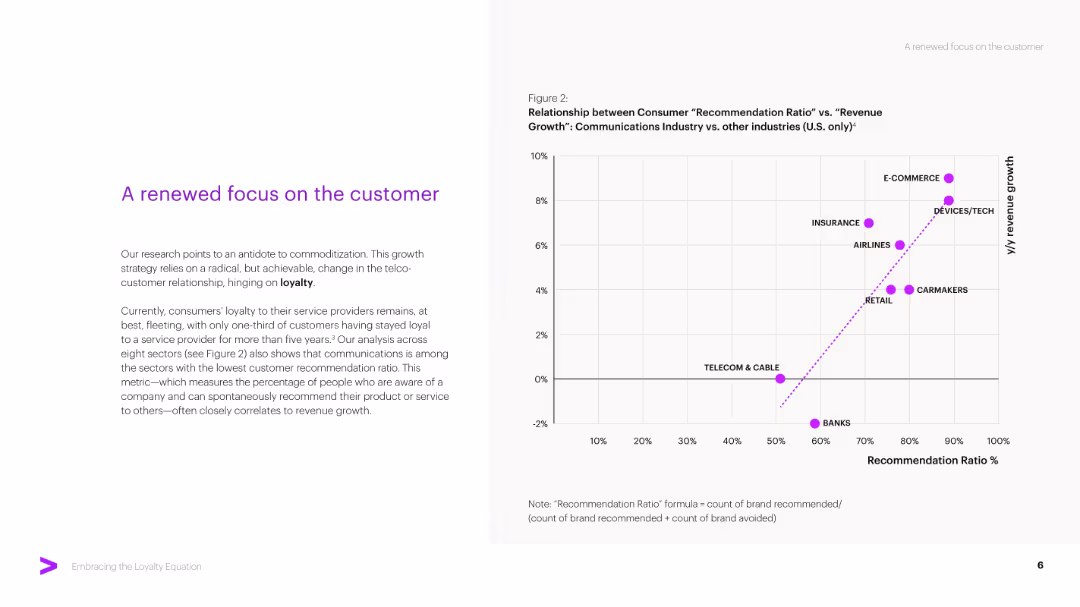
Left-side narrative emphasizes loyalty; right-side scatter plot of “Recommendation Ratio” vs. “Revenue Growth” across sectors.
Customer and Market Segmentation
Telecommunications
This slide highlights the low customer loyalty in telecom versus other industries and shows a direct correlation between customer recommendation rates and revenue growth. It makes the case for telecom providers to prioritize loyalty as a revenue driver.
Customer Loyalty, Telecom, Recommendation Ratio, Revenue Growth, Telco, Consumer Trust, Market Insights
false
Customer and Market Segmentation
Telecommunications
Mixed Chart
Accenture
Add to my slides
Remove from favorites
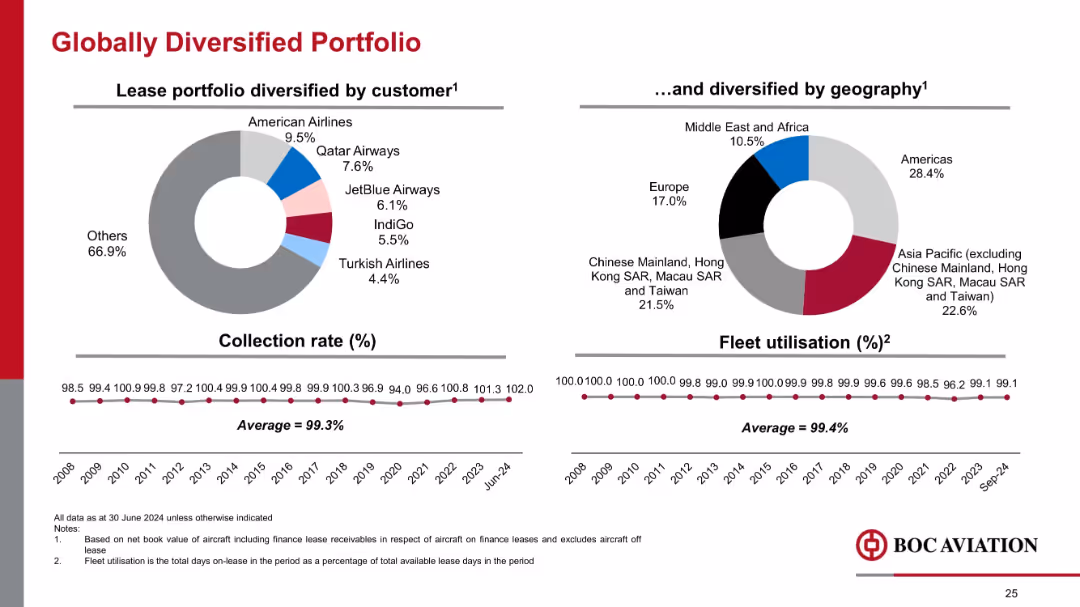
Side-by-side pie charts showing customer and geographic distribution; timeline graphs beneath; minimalist layout
Risk Assessment and Management
Financial Services
Emphasizes portfolio diversification across customers and regions. Shows a strong collection rate (99.3%) and high fleet utilization (99.4%), indicating low credit risk and operational reliability across markets.
customer mix, geography, utilization, collection rate, diversification, aviation portfolio, risk management
false
Risk Assessment and Management
Financial Services
Multiple Chart
Goldman Sachs
Add to my slides
Remove from favorites
Column chart on customer outreach and circular flow diagram for branch team roles. Muted colors with blue highlights.
Strategic Planning
Financial Services
Transition to proactive customer engagement and integrated branch team roles in various banking services.
Customer Outreach, Integrated Teams, Wealth Management, Relationship Development, Proactive Engagement, Branch Network
false
Strategic Planning
Financial Services
Mixed Chart
JP Morgan
Add to my slides
Remove from favorites
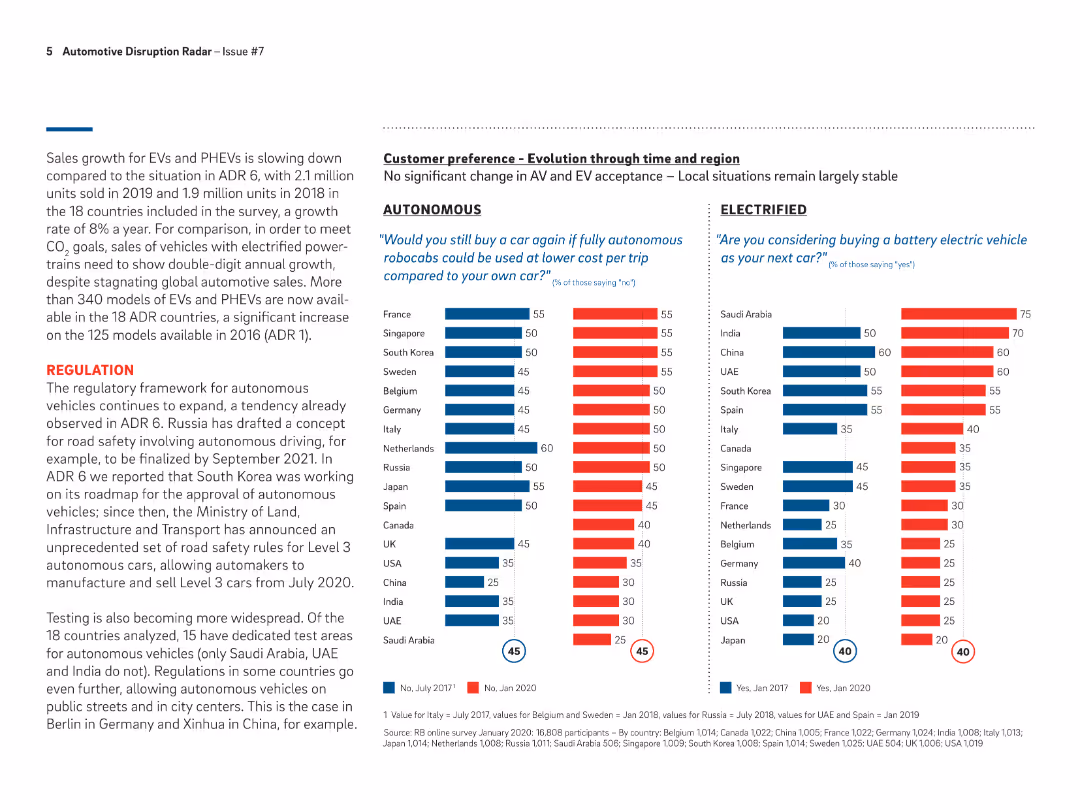
Bar charts comparing customer preferences for autonomous vehicles and electric vehicles across different regions and time periods, from 2017 to 2020.
Customer and Market Segmentation
Transportation & Logistics
Analyzes customer preferences for autonomous and electric vehicles in various countries, showing changes in acceptance and interest levels over time.
customer preference, autonomous vehicles, electric vehicles, regions
false
Customer and Market Segmentation
Transportation & Logistics
Multiple Chart
Roland Berger
Add to my slides
Remove from favorites
Utilizes a column chart to compare marketer concerns about customer data privacy across different types of data. The design is straightforward, using shades of grey to represent different levels of concern, with clear labeling and an insights section that explains the significance of the findings.
Regulatory and Compliance
Professional Services
This slide assesses the level of concern marketers have regarding customer privacy, particularly useful in discussions about regulatory compliance and risk management in sectors like banking and finance where data sensitivity is high. Provides a basis for understanding industry attitudes towards privacy concerns.
customer privacy, data sensitivity, regulatory compliance, finance, risk management
false
Regulatory and Compliance
Professional Services
Mixed Chart
Deloitte
Add to my slides
Remove from favorites
Graphs and stats display current customer relationships and future improvement plans.
Customer and Market Segmentation
Financial Services
Details current state and strategic plans for enhancing customer relationships in banking.
customer relationships, banking, strategic plans, improvement
false
Customer and Market Segmentation
Financial Services
Multiple Chart
Barclays
Add to my slides
Remove from favorites
Utilizes pie charts and supporting text to represent customer satisfaction and engagement levels in consumer and business banking.
Performance Metrics and KPIs
Financial Services
Aimed at showcasing high levels of customer satisfaction and engagement, often used to persuade stakeholders of the bank's strong customer relationship.
customer satisfaction, banking, engagement, retention, loyalty, consumer banking, business banking, performance, metrics, KPIs
false
Performance Metrics and KPIs
Financial Services
Multiple Chart
JP Morgan
Add to my slides
Remove from favorites
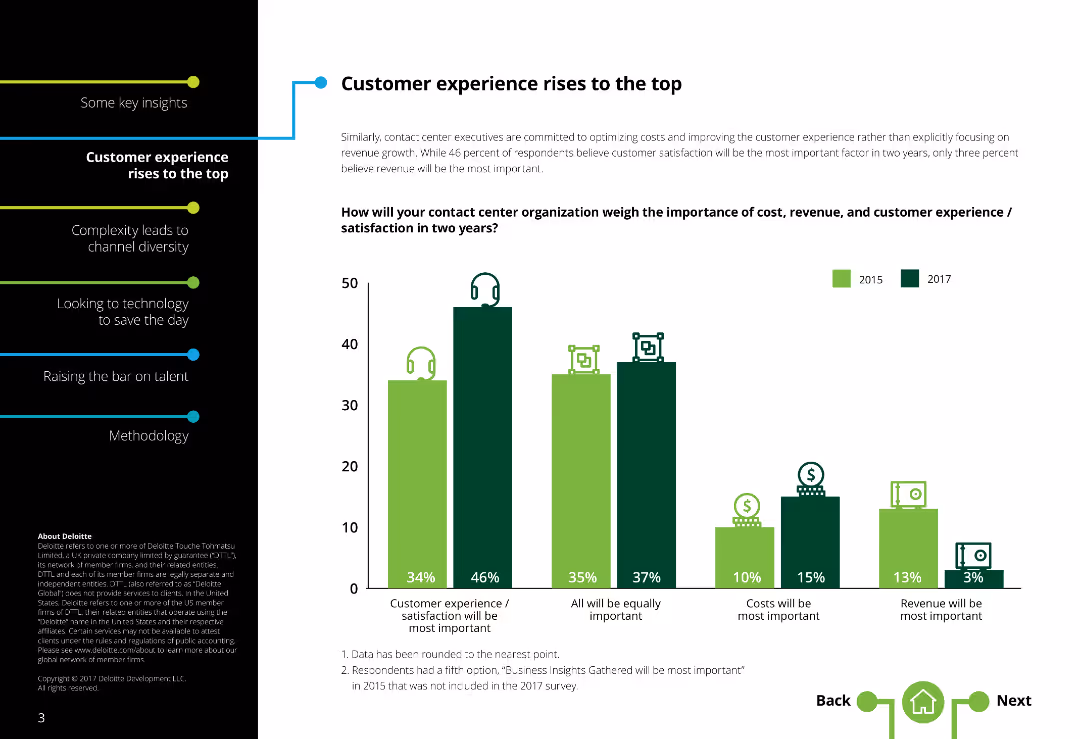
The slide contains a column chart showing the importance of cost, revenue, and customer satisfaction in contact centers over time, with icons representing each factor.
Market Analysis and Trends
Professional Services
This slide focuses on how contact center organizations prioritize cost, revenue, and customer satisfaction. It compares survey data across different years to show trends and shifts in importance placed on each factor by respondents. The chart illustrates the varying emphasis on customer experience, revenue growth, and cost management.
Customer satisfaction, contact centers, cost, revenue, column chart
false
Market Analysis and Trends
Professional Services
Single Chart
Deloitte
Add to my slides
Remove from favorites
The slide features bar graphs reflecting consumer satisfaction levels across various digital service categories.
Performance Metrics and KPIs
Technology & Software
Assesses customer satisfaction with digital services, implying the importance of quality service provision for maintaining high satisfaction levels.
customer satisfaction, digital services, service quality, e-commerce, food delivery, video, music, ride-hailing
false
Performance Metrics and KPIs
Technology & Software
Single Chart
Bain
Add to my slides
Remove from favorites
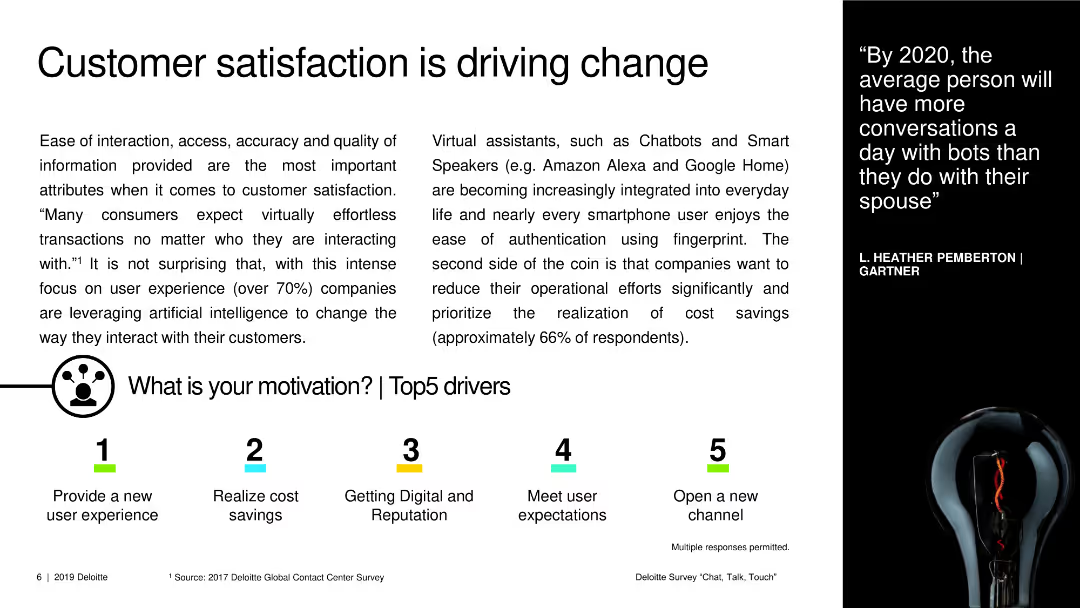
A text slide with a mix of textual content and small graphical icons, emphasizing customer satisfaction and its drivers.
Strategic Planning
Technology & Software
The slide discusses the importance of customer satisfaction and lists top drivers such as new user experience and cost savings.
customer satisfaction, drivers, strategic planning, user experience, cost savings, technology
false
Strategic Planning
Technology & Software
Linear Flow
Deloitte
Add to my slides
Remove from favorites
Multiple column charts, clear section divisions, professional layout in blues and greens.
Customer and Market Segmentation
Telecommunications
Details a three-step process to analyze and implement improvements in customer service based on satisfaction data.
customer satisfaction, improvement process, analysis
false
Customer and Market Segmentation
Telecommunications
Multiple Chart
Deloitte
Add to my slides
Remove from favorites
The slide is split into three sections: a pie chart on the left shows the percentage of primary bank customers, and two columns on the right list key satisfaction and engagement metrics. It utilizes a clean and straightforward design with minimal color use for emphasis.
Customer and Market Segmentation
Financial Services
Addressing customer engagement, this slide provides key metrics on satisfaction, loyalty, and digital engagement, illustrating the bank's strong customer relationships. It highlights the high retention and recommendation rates, showcasing the bank's focus on maintaining high customer satisfaction and loyalty levels.
Customer satisfaction, Loyalty, Engagement, Primary bank, Retention rate, Digital activity, Banking services
false
Customer and Market Segmentation
Financial Services
Mixed Chart
JP Morgan
Add to my slides
Remove from favorites
The slide includes text boxes, bullet points, and a column chart visualizing customer and employee satisfaction ratings across different regions. It has a clean, structured design with green and blue color highlights.
Operational Efficiency
Professional Services
Outlines the methodology of a 2022 customer service excellence survey, emphasizing the importance of understanding customer and employee satisfaction across industries and regions. Useful for companies aiming to improve service quality through targeted strategies.
customer satisfaction, methodology, survey, operational efficiency, service quality
false
Operational Efficiency
Professional Services
Mixed Chart
Deloitte
Add to my slides
Remove from favorites
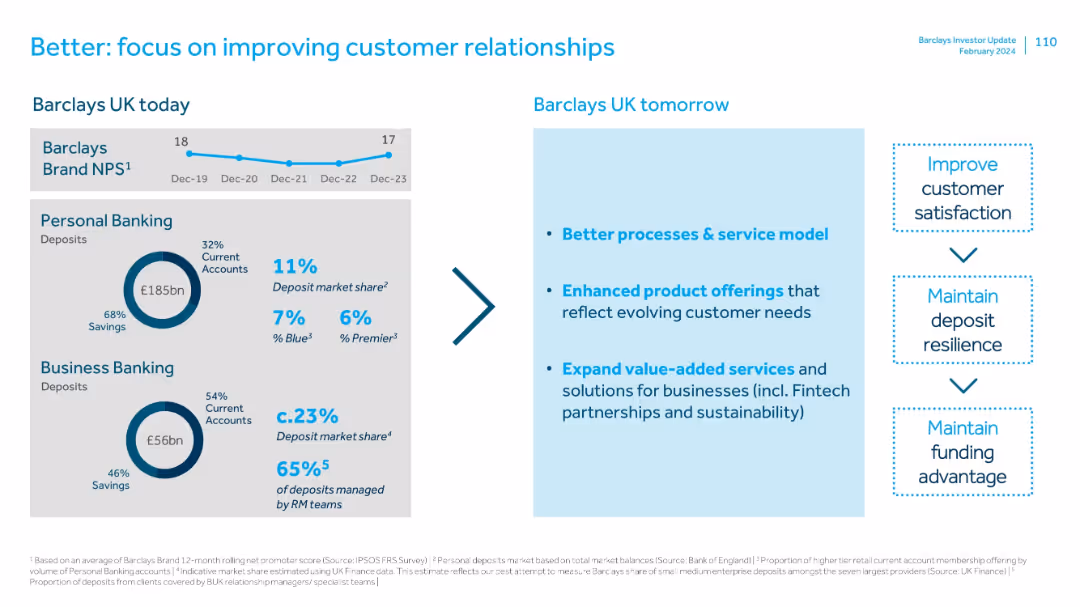
Split design: left side with NPS score and deposit data; right side lists strategic initiatives and goals in a flow diagram.
Human Resources and Talent Management
Financial Services
Demonstrates initiatives to improve customer satisfaction through enhanced services, better processes, and value-added solutions. Shows past metrics and future targets for strengthening deposit resilience.
customer satisfaction, service model, deposits, NPS, fintech, Barclays
false
Human Resources and Talent Management
Financial Services
Multiple Chart
Barclays
Add to my slides
Remove from favorites
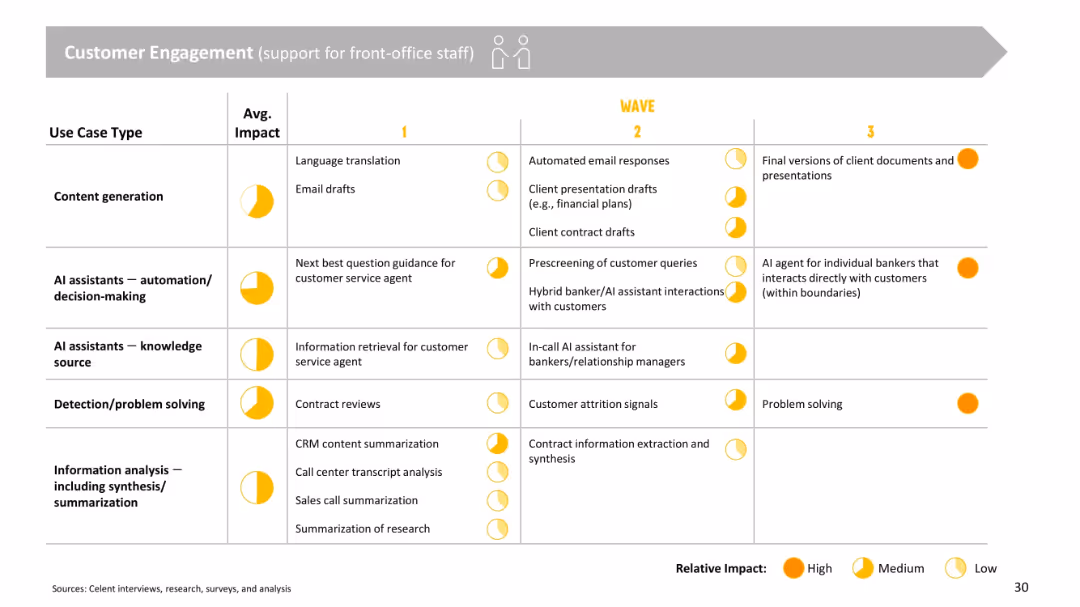
Continuation of table format focused on front-office staff. Shows use cases like email drafting, call summaries, AI guidance for customer reps, and summarization.
Customer and Market Segmentation
Financial Services
Emphasizes GenAI use cases that support front-line staff and improve customer engagement. Covers enhancements in content, decision-making, and automation, evolving to include AI agents directly interacting with customers in later waves.
customer service, AI guidance, automation, document generation, GenAI, summarization
false
Customer and Market Segmentation
Financial Services
Single Chart
Oliver Wyman
Add to my slides
Remove from favorites
This slide presents a table in varying shades of blue, each representing different industries and showing the impact of 'timely offers' and 'knowledgeable customer service' on purchase decisions, based on a consumer survey.
Operational Efficiency
Professional Services
Highlights the effectiveness of AI-enhanced customer service strategies across various industries, from automotive to banking. The data suggests that knowledgeable customer service and timely offers are pivotal in influencing purchase decisions.
customer service, AI, retail, automotive, banking, purchase decisions
false
Operational Efficiency
Professional Services
Table
Deloitte
Add to my slides
Remove from favorites
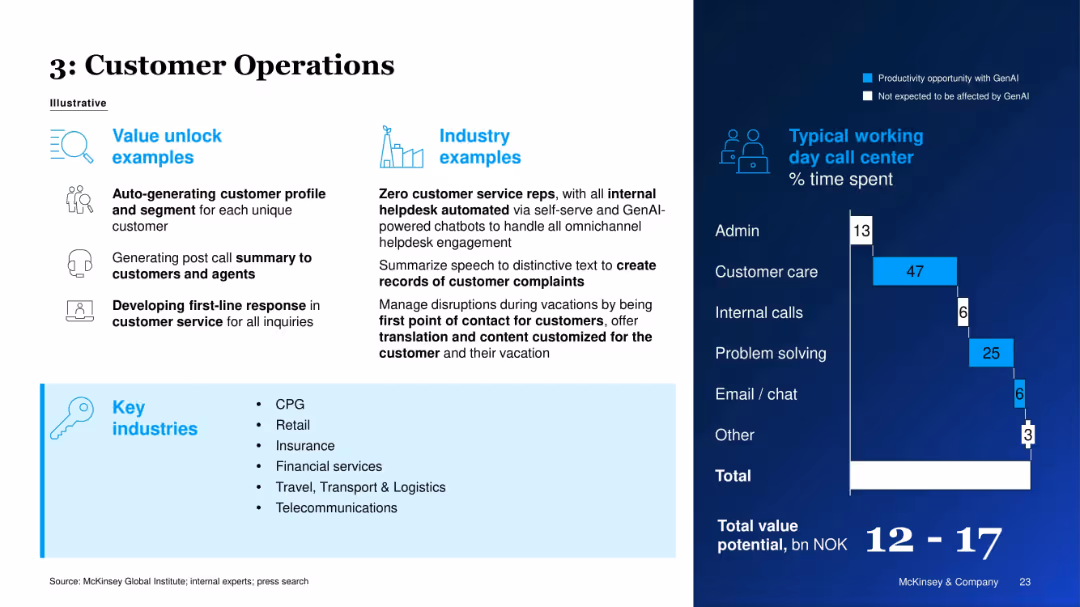
Left panel outlines use cases and industries; right panel displays typical call center time use.
Customer and Market Segmentation
Telecommunications
The slide demonstrates how GenAI can streamline customer service through automated profiling, summaries, and response generation. A call center agent's time distribution is analyzed to show where GenAI improves efficiency.
Customer Service, Call Center, GenAI, Efficiency, Segmentation, Automation, Industry Use Case, Time Savings
false
Customer and Market Segmentation
Telecommunications
Mixed Chart
McKinsey
Add to my slides
Remove from favorites
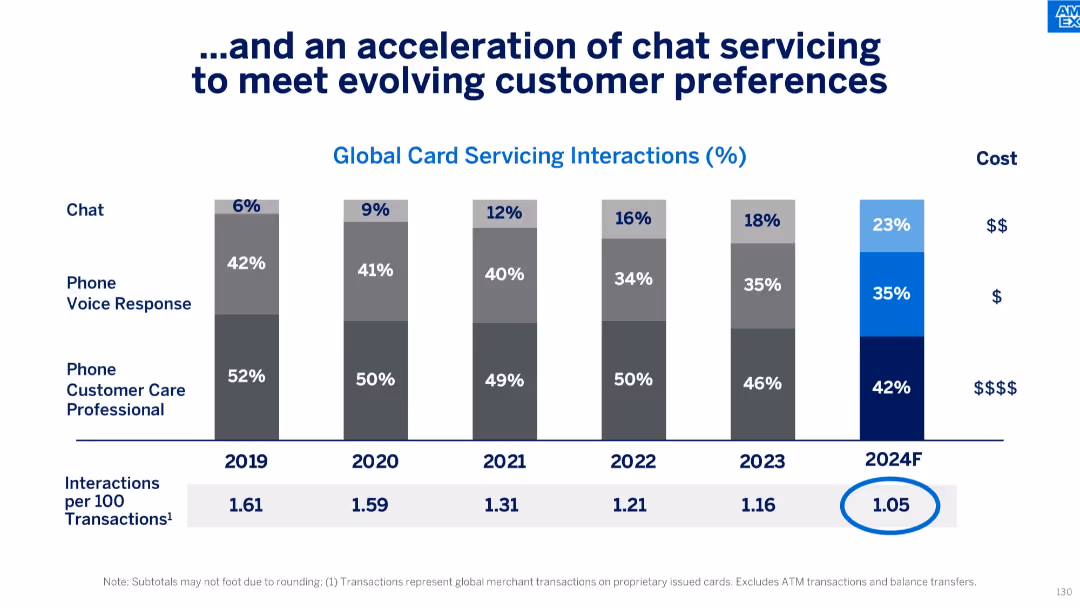
Vertical bar chart showing % breakdown of global card servicing interactions by channel (Chat, Phone Voice Response, Customer Care Professional) from 2019–2024F, along with associated costs and interaction per transaction metric.
Operational Efficiency
Financial Services
The slide highlights a shift in customer service preferences toward chat interactions, increasing from 6% in 2019 to a forecasted 23% in 2024. It also correlates interaction types with costs and shows a steady decline in interactions per 100 transactions, implying greater servicing efficiency.
customer service, chat, servicing, digital shift, cost efficiency, forecasting, interactions, voice response, professional care, card services
false
Operational Efficiency
Financial Services
Single Chart
McKinsey
Add to my slides
Remove from favorites
A map highlighting customer satisfaction ratings in Europe with associated pie charts displaying average satisfaction ratings by region. The slide is visually organized with distinct color coding for different European regions.
Market Analysis and Trends
Professional Services
Provides a geographic breakdown of customer service satisfaction within Europe, showcasing where companies excel or underperform in customer relations. Essential for businesses operating across Europe to identify regional strengths and weaknesses in customer service.
customer service, Europe, satisfaction ratings, geographic analysis, regional differences
false
Market Analysis and Trends
Professional Services
Multiple Chart
Deloitte
Add to my slides
Remove from favorites
Bar chart and infographic style icons, simple and clean layout with blue highlights.
Customer and Market Segmentation
Telecommunications
Discusses future investments and priorities in customer service, including automation and self-service options.
customer service, future planning, investment
false
Customer and Market Segmentation
Telecommunications
Multiple Chart
Deloitte
Add to my slides
Remove from favorites
Radar charts for various industries, uses a clean layout with green and blue tones.
Customer and Market Segmentation
Telecommunications
Evaluates priority strategies for customer service across different industries and regions.
customer service, industry priorities, strategy
false
Customer and Market Segmentation
Telecommunications
Multiple Chart
Deloitte
Add to my slides
Remove from favorites
Contains column charts and descriptive text comparing the structure of customer service centers and their impact on customer satisfaction. The layout is structured and uses a combination of blue, green, and gray tones.
Organizational Structure and Change
Professional Services
Evaluates how different organizational structures within customer service centers influence customer and employee satisfaction, suggesting optimal arrangements for higher satisfaction levels. Critical for companies reviewing their internal setups for efficiency and effectiveness in customer interactions.
customer service, organizational impact, satisfaction, structure analysis, service efficiency
false
Organizational Structure and Change
Professional Services
Multiple Chart
Deloitte
Add to my slides
Remove from favorites
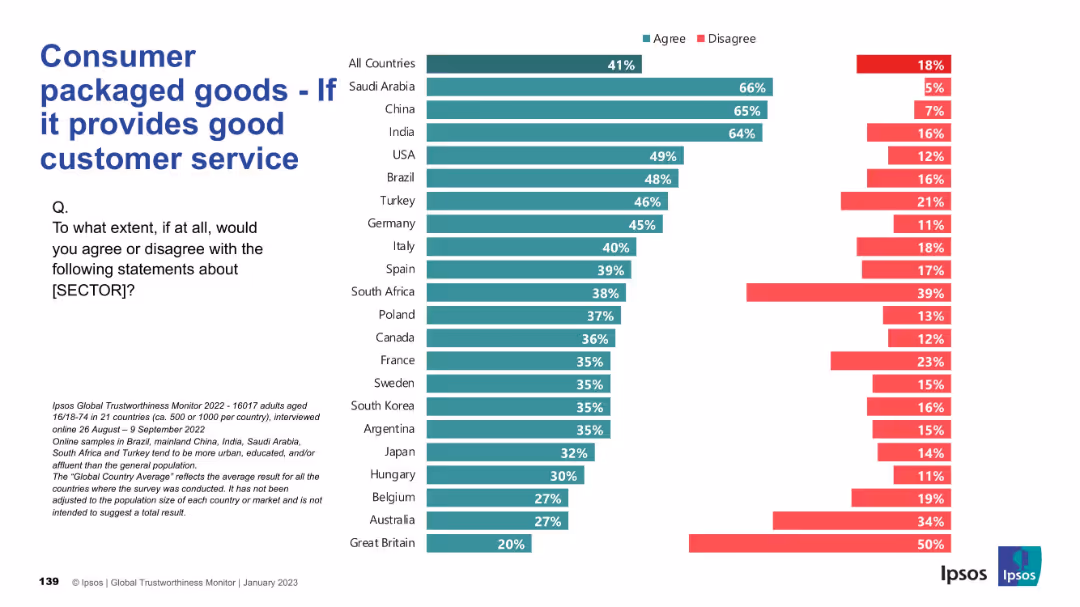
Chart with country-wise agreement/disagreement about CPG sector’s customer service quality.
Performance Metrics and KPIs
Consumer Goods
This slide evaluates consumer sentiment toward the CPG industry’s customer service, with green bars representing positive perceptions by country.
customer service, satisfaction, CPG, performance, Ipsos, trust, perception, survey, responsiveness, consumer expectations
false
Performance Metrics and KPIs
Consumer Goods
Mixed Chart
IPSOS
Add to my slides
Remove from favorites
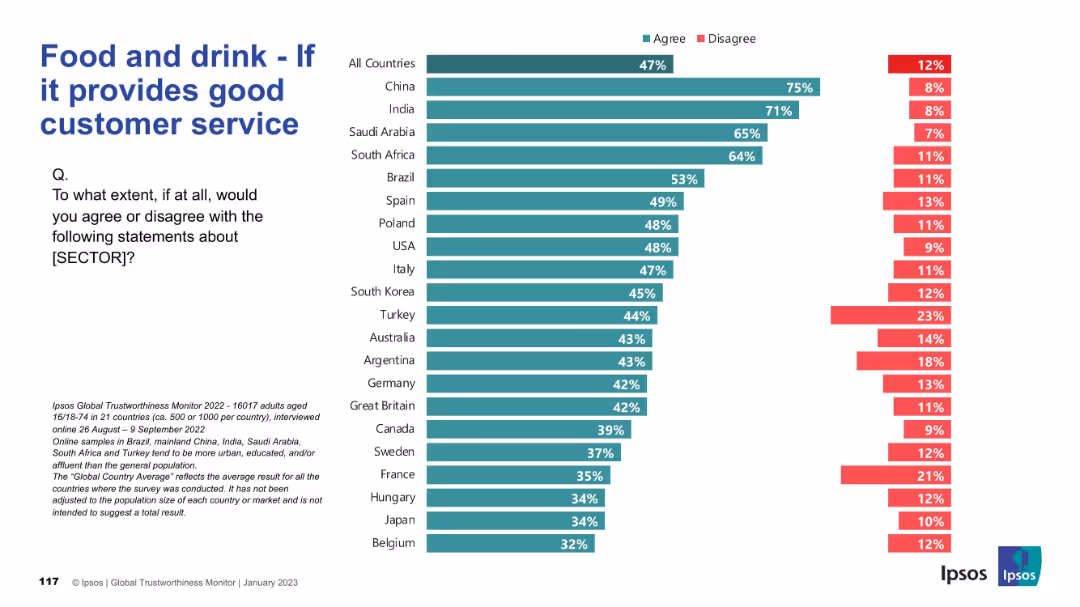
Horizontal bar chart by country reflecting public perception of sector’s customer service.
Customer and Market Segmentation
Consumer Goods
The slide displays perceptions on the quality of customer service in the food and drink industry. China and India report the highest satisfaction, with overall positive sentiment higher in emerging markets.
customer service, satisfaction, food sector, public opinion, global comparison, Ipsos survey, countries, consumer experience
false
Customer and Market Segmentation
Consumer Goods
Mixed Chart
IPSOS
Add to my slides
Remove from favorites
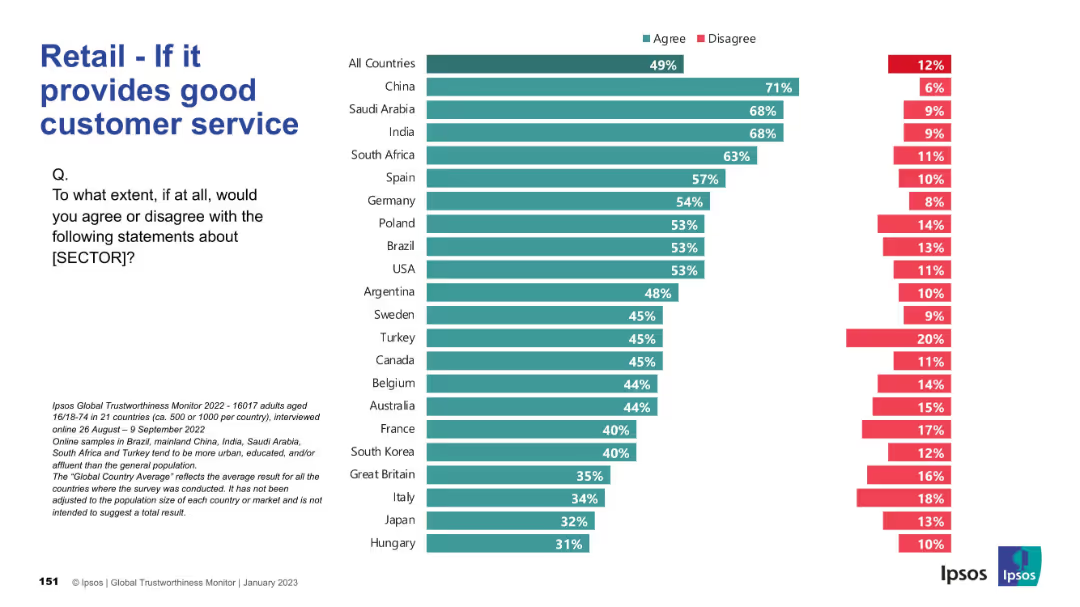
Chart showing country-by-country agreement on service quality; structured visual layout.
Performance Metrics and KPIs
Retail & E-commerce
Reflects consumer perception of customer service quality in the retail sector. China, Saudi Arabia, and India lead, suggesting strong service reputations there.
customer service, satisfaction, performance, Ipsos, countries, quality
false
Performance Metrics and KPIs
Retail & E-commerce
Mixed Chart
IPSOS
Add to my slides
Remove from favorites
Slide with bar charts and diagrams showcasing digital customer service innovations in the energy sector, including examples like PowerShop.
Customer and Market Segmentation
Energy & Utilities
Discusses how digital innovation can transform customer services in the energy sector, offering integrated solutions and energy management.
customer services, digital innovation, energy sector, integrated solutions, PowerShop, energy management
false
Customer and Market Segmentation
Energy & Utilities
Mixed Chart
Accenture
Add to my slides
Remove from favorites
Contains multiple column charts and graphs, modern layout with clear separation of sections, vibrant use of teal and gray
Customer and Market Segmentation
Telecommunications
Explains tool rating by employees and how inquiries are assigned. Discusses the balance of automatic vs manual tasks.
customer service, technology, tools, inquiries, automation
false
Customer and Market Segmentation
Telecommunications
Multiple Chart
Deloitte
Add to my slides
Remove from favorites
The slide features two bar charts. One shows the impact of subscriptions on the usage of substitutes, and the other shows the effect on customer spending. Both charts indicate significant changes post-subscription.
Market Analysis and Trends
Consumer Goods
This slide examines the impact of subscriptions on customer behavior, particularly in terms of reduced use of substitutes and increased spending. It underscores the role of subscriptions in customer loyalty and spending habits.
customer spending, subscriptions, substitutes, behavior analysis, loyalty, ecommerce, retail
false
Market Analysis and Trends
Consumer Goods
Multiple Chart
Deloitte
Add to my slides
Remove from favorites
A column chart with descending bars from left to right is featured, showing revenue over years. There's a large text block on the left and a circled section on the right highlighting key points in a red outline.
Customer and Market Segmentation
Industrial & Manufacturing
This slide details the financial impact of customer support on the installed fleet, quantifying future cash generation. It is suitable for financial analysis presentations to highlight the value and long-term revenue contribution from customer support activities.
Customer Support, Financial Impact, Fleet, Long-Term Value, Revenue
false
Customer and Market Segmentation
Industrial & Manufacturing
Mixed Chart
Goldman Sachs
Add to my slides
Remove from favorites
Contains a column chart depicting levels of customer trust across different economic sectors, with a data table beneath summarizing the results. The chart is straightforward with a clear, color-coded categorization of ratings, complemented by a descriptive insights section that provides analysis on the data shown.
Client Case Studies
Professional Services
This slide offers an analysis of customer trust levels across various sectors, revealing high trust ratings for brands compared to industry averages. It's useful for case studies in marketing strategy, showcasing the effectiveness of brand management practices and consumer relationship strategies.
customer trust, brand management, marketing, industry comparison, insights
false
Client Case Studies
Professional Services
Mixed Chart
Deloitte
Add to my slides
Remove from favorites
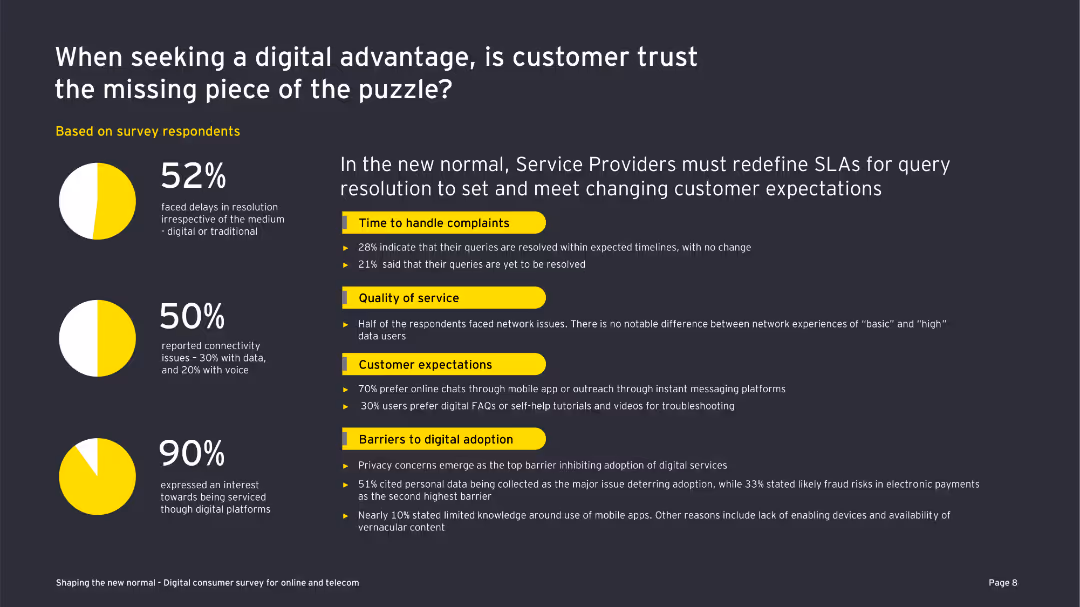
This slide features text with bullet points, emphasizing key survey findings. The layout is simple yet informative.
Market Analysis and Trends
Telecommunications
The slide highlights the importance of customer trust in the digital era, presenting survey data on complaint resolution, service quality, and expectations.
customer trust, digital advantage, survey findings, service quality, complaint resolution, customer expectations, telecom, COVID-19
false
Market Analysis and Trends
Telecommunications
Multiple Chart
EY
Add to my slides
Remove from favorites
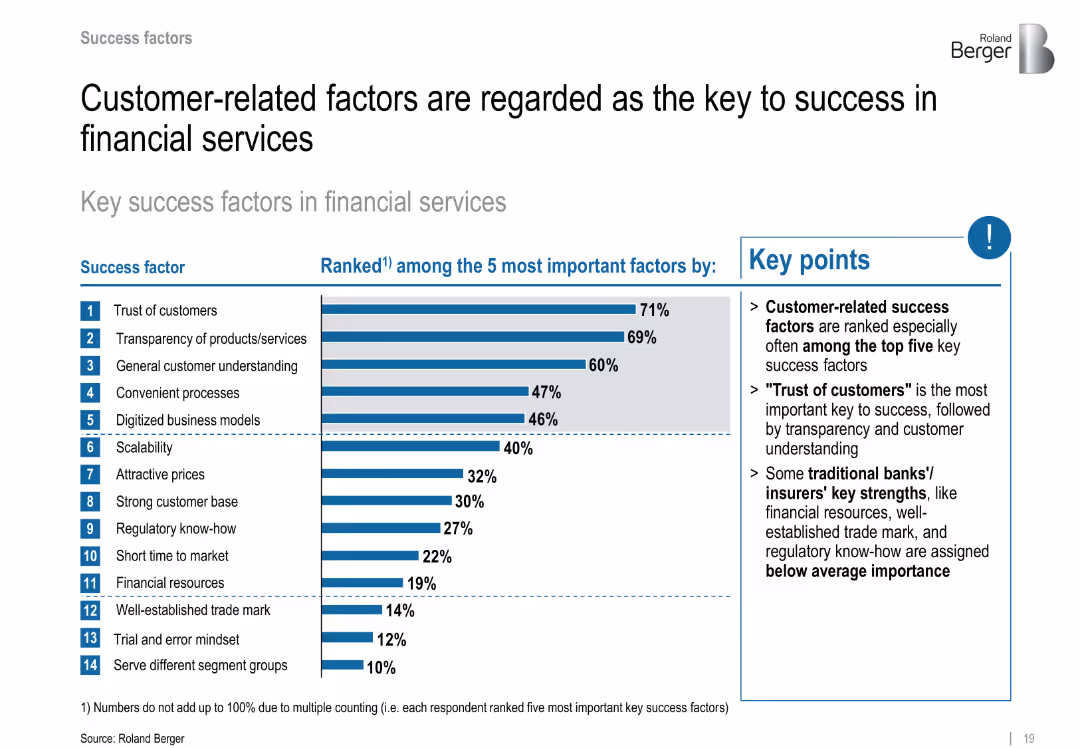
Ranked bar chart showing key success factors; highlights top 14 elements including customer trust
Performance Metrics and KPIs
Financial Services
Emphasizes customer trust, transparency, and understanding as top factors for FinTech success. Traditional factors like regulatory know-how rank lower.
customer trust, transparency, success drivers, FinTech priorities, performance factors
false
Performance Metrics and KPIs
Financial Services
Mixed Chart
Roland Berger
Add to my slides
Remove from favorites
Includes diagrams and bullet points describing the customer value delivery and collaboration in each phase of business model transformation.
Strategic Planning
Environmental Services & Sustainability
Discusses the importance of customer value delivery and collaboration in different phases of business transformation. It is ideal for detailed strategic planning and implementation discussions focusing on enhancing customer engagement and collaboration throughout transformation phases.
Customer value, Collaboration, Business model transformation, Strategic planning, Phase analysis, Engagement, Implementation, Business operations, Resource management, Scalability
false
Strategic Planning
Environmental Services & Sustainability
Table
Accenture
Add to my slides
Remove from favorites
A two-part slide with a mix of blue bar graphs and green checkmarks detailing key factors in customer consideration and metrics of customer engagement and retention. It's a clean, balanced layout with accessible visuals and focused content.
Customer and Market Segmentation
Financial Services
This slide illustrates the factors influencing customer decisions to switch banks and how JPMorgan Chase & Co.'s customer value proposition impacts retention and resiliency. It could be used in presentations to highlight the importance of customer-centric strategies in banking and how they translate into business performance.
Customer Value, Proposition, Banking, Retention, Resiliency, JPMorgan Chase & Co., Switching, Factors, Performance, Strategy
false
Customer and Market Segmentation
Financial Services
Mixed Chart
JP Morgan
Add to my slides
Remove from favorites
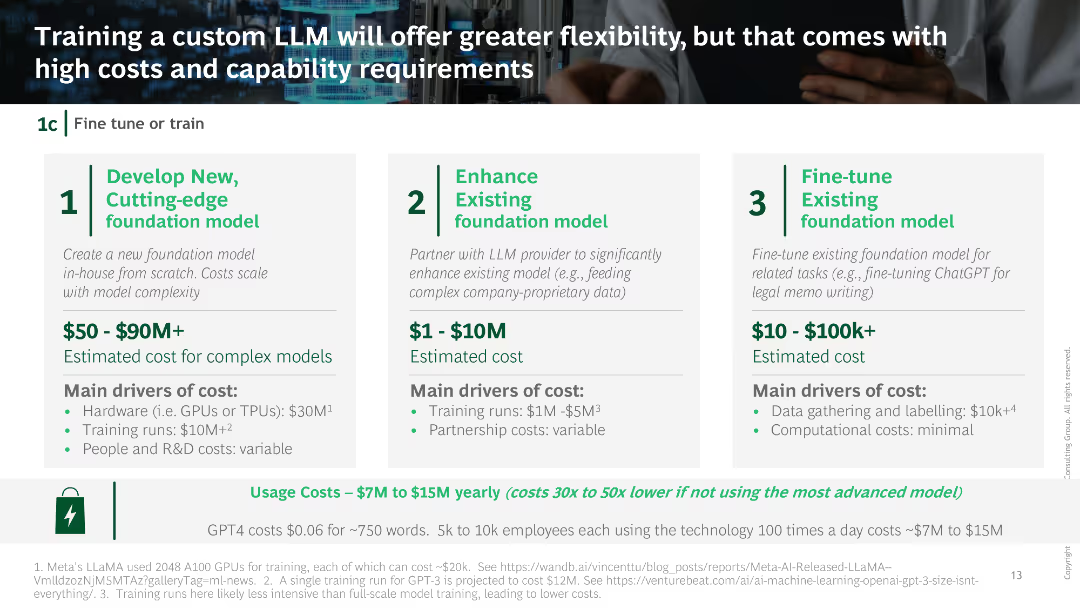
Comparison of costs and drivers for developing new, enhancing existing, and fine-tuning foundation models, with detailed cost estimates and main cost factors.
Technology and Digital Transformation
Technology & Software
The slide compares different approaches to training custom language models, detailing the associated costs, benefits, and key cost drivers for each approach.
Custom LLM, Training costs, Model enhancement, Cost drivers, Flexibility
false
Technology and Digital Transformation
Technology & Software
Linear Flow
BCG
Add to my slides
Remove from favorites
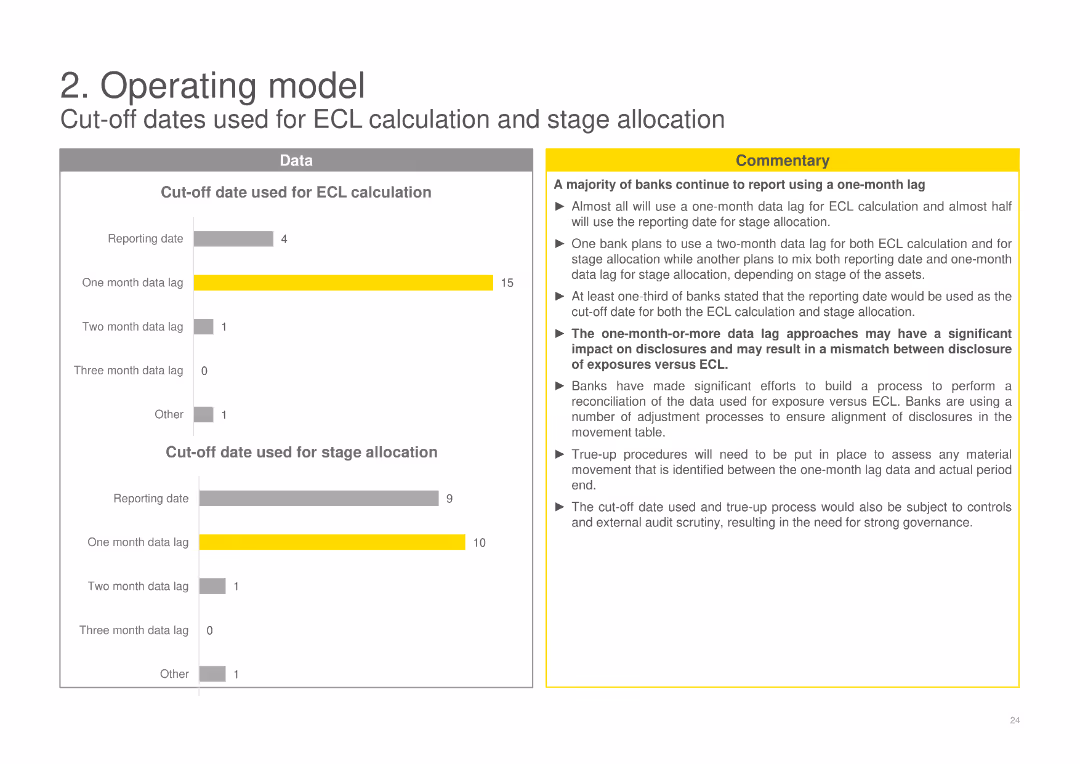
Contains column charts detailing the cut-off dates used for ECL calculation and stage allocation, with a commentary discussing the implications of different cut-off dates and the resulting impact on disclosures and ECL calculations.
Operational Efficiency
Financial Services
Analyzes the cut-off dates used for ECL calculation and stage allocation, discussing how different cut-off dates impact financial disclosures and the accuracy of ECL calculations in the context of IFRS 9 requirements.
cut-off dates, ECL calculation, stage allocation, IFRS 9, financial disclosures
false
Operational Efficiency
Financial Services
Multiple Chart
EY
Add to my slides
Remove from favorites
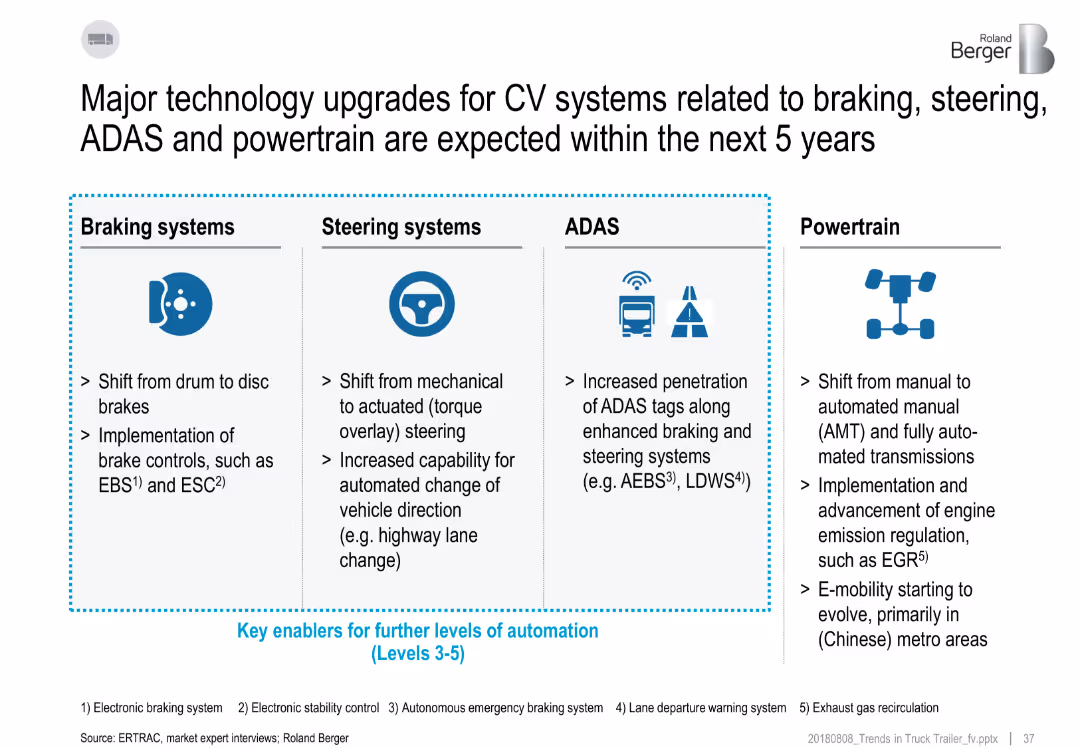
4-column layout detailing advancements in braking, steering, ADAS, and powertrain systems; includes icons and bullet points
Technology and Digital Transformation
Industrial & Manufacturing
This slide outlines expected advancements in commercial vehicle systems over five years. Braking will shift to disc systems, steering will become actuated, ADAS will expand with automated features, and powertrains will move to automation and e-mobility. These are seen as enablers for higher vehicle automation levels.
CV systems, braking, steering, ADAS, powertrain, automation, trends, upgrades
false
Technology and Digital Transformation
Industrial & Manufacturing
Pillar
Roland Berger
Add to my slides
Remove from favorites
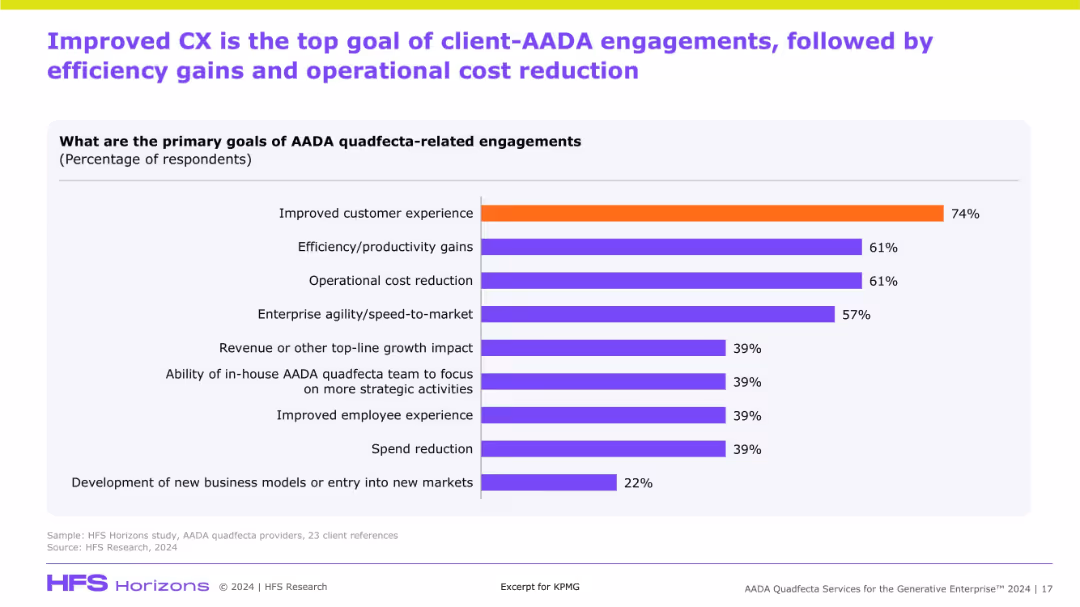
Horizontal bar chart showing top goals of AADA initiatives, ranked by percentage. Emphasizes customer experience, efficiency, and cost reduction.
Performance Metrics and KPIs
Artificial Intelligence
This slide summarizes client priorities in AADA initiatives, with customer experience ranked highest, followed by operational efficiency and cost reduction. It indicates the business outcomes driving adoption of AADA technologies.
CX, AADA, KPIs, cost reduction, efficiency, client goals, transformation, customer focus
false
Performance Metrics and KPIs
Artificial Intelligence
Single Chart
KPMG
Add to my slides
Remove from favorites
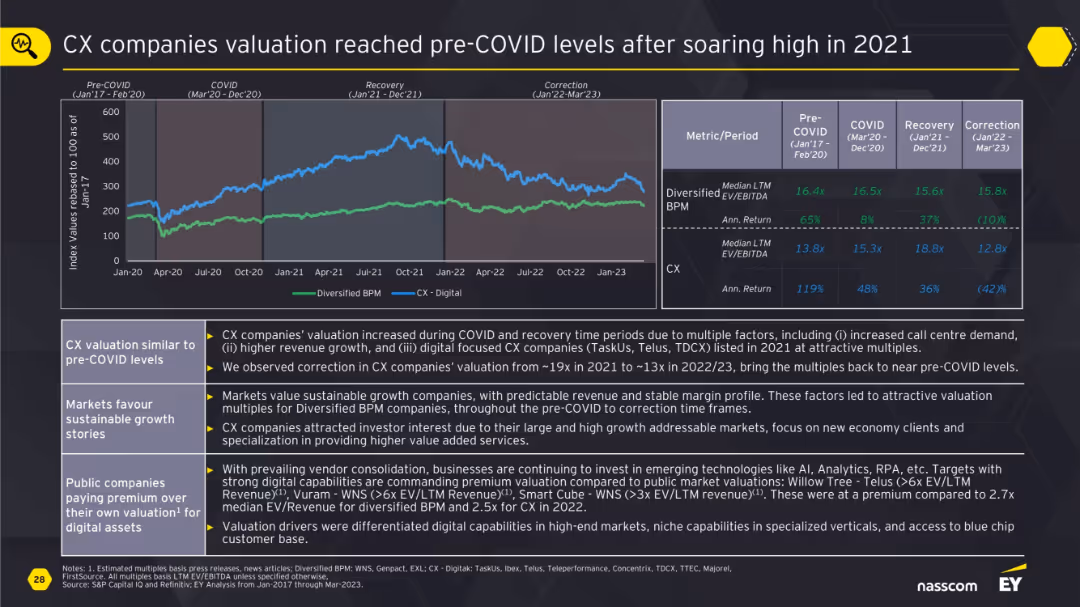
Line chart of Diversified BPM vs CX-Digital with a metrics table on valuation and returns over four phases; annotated analysis below.
Financial Performance
Professional Services
This slide shows how CX companies saw a valuation surge during COVID and recovery phases due to digital expansion and demand growth. By 2023, valuations corrected back to pre-COVID levels. Diversified BPM firms with stable margins maintained better valuation profiles, while CX companies still commanded premium due to niche digital capabilities.
CX, BPM, valuation, digital growth, COVID impact, returns, premium, public markets
false
Financial Performance
Professional Services
Mixed Chart
EY
Add to my slides
Remove from favorites
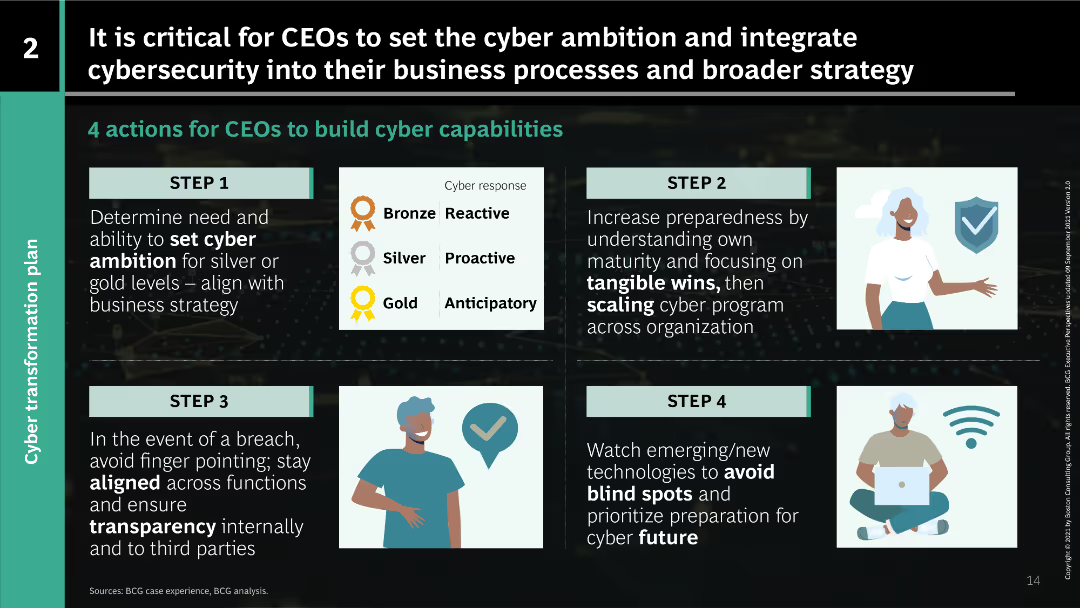
The slide features a step-by-step guide for CEOs to build cyber capabilities, including setting cyber ambition levels (bronze, silver, gold) and integrating cybersecurity into business strategy.
Strategic Planning
Professional Services
This slide provides a framework for CEOs to enhance their organization's cybersecurity by setting appropriate cyber ambition levels and integrating cybersecurity measures into broader business strategies.
cyber ambition, CEOs, cybersecurity, business strategy, framework, professional services, BCG
false
Strategic Planning
Professional Services
Linear Flow
BCG
Add to my slides
Remove from favorites
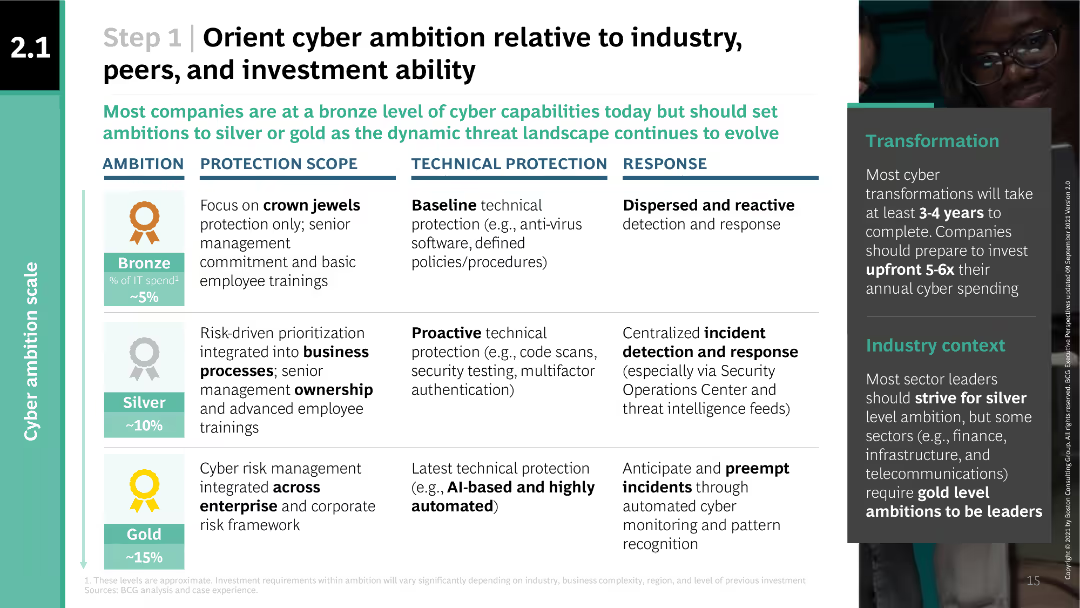
The slide features a table outlining different levels of cyber ambition (bronze, silver, gold) and their corresponding protection scope, technical protection, and response measures.
Strategic Planning
Professional Services
This slide helps organizations align their cyber ambition with industry standards, peer benchmarks, and investment capabilities. It provides detailed descriptions of bronze, silver, and gold levels of cyber ambition and their respective cybersecurity measures.
cyber ambition, industry standards, investment, protection scope, technical protection, response measures, BCG
false
Strategic Planning
Professional Services
Table
BCG
Add to my slides
Remove from favorites
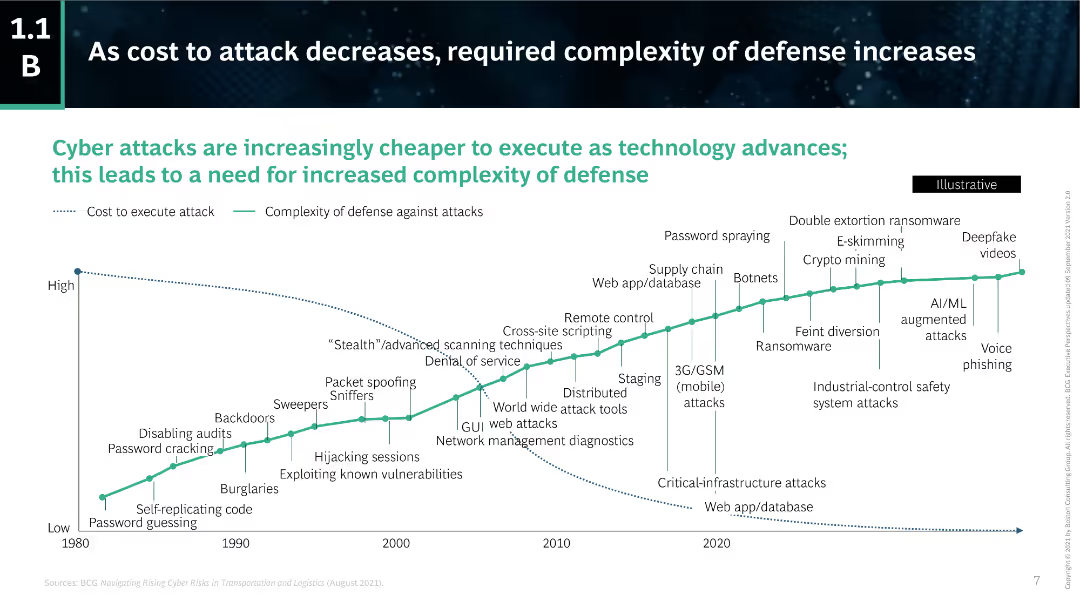
The slide features a line chart showing the decreasing cost to execute attacks and the increasing complexity of defense measures over time. The chart is accompanied by explanatory text.
Technology and Digital Transformation
Technology & Software
This slide illustrates how advancements in technology have decreased the cost of executing cyber attacks while increasing the complexity required for defense. It emphasizes the need for improved cybersecurity measures.
cyber attacks, defense complexity, cost decrease, technology advancements, cybersecurity, line chart, trends, BCG
false
Technology and Digital Transformation
Technology & Software
Single Chart
BCG
Add to my slides
Remove from favorites
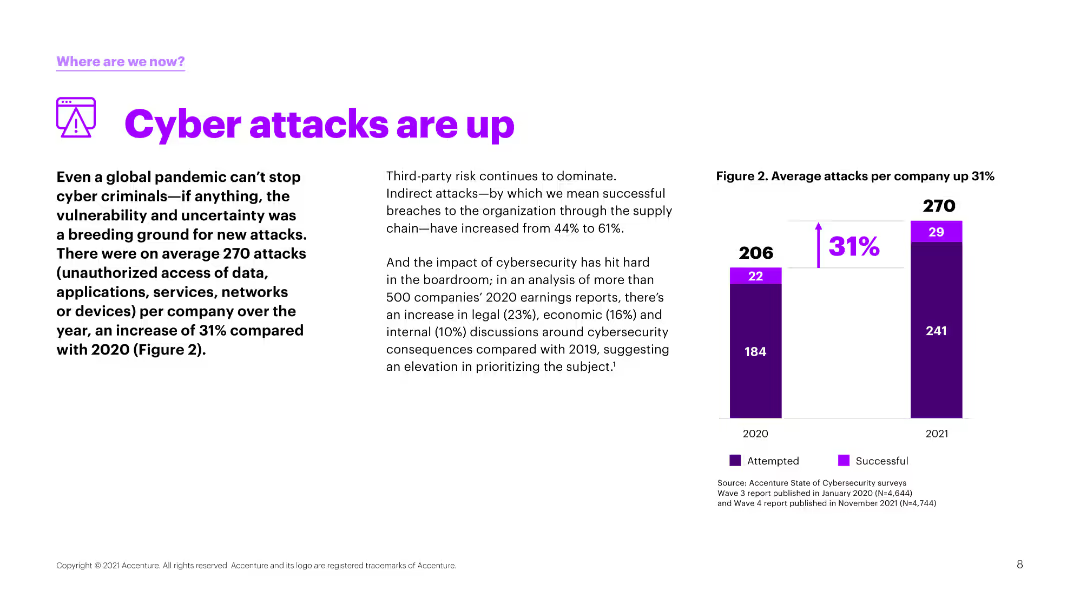
Text and a column chart comparing the average number of cyber attacks per company between 2020 and 2021. The chart uses purple for data representation.
Risk Assessment and Management
Technology & Software
The slide discusses the increase in cyber attacks during the pandemic, highlighting that the average attacks per company rose by 31%. It also mentions the impact of these attacks on various sectors.
cyber attacks, increase, pandemic, comparison, impact
false
Risk Assessment and Management
Technology & Software
Mixed Chart
Accenture
Add to my slides
Remove from favorites
Bar chart showing the total number of significant cyberattacks by country from 2006 to 2020, and a column chart comparing estimated losses from disasters in the US.
Risk Assessment and Management
Technology & Software
The slide discusses the increasing frequency and impact of cyberattacks, particularly targeting the USA. It presents data on significant cyberattacks globally and compares the economic losses from cyberattacks to other major disasters, emphasizing the substantial risks and costs associated with cybersecurity breaches.
Cyberattacks, Security, Economic Costs, USA
false
Risk Assessment and Management
Technology & Software
Multiple Chart
Roland Berger
Add to my slides
Remove from favorites
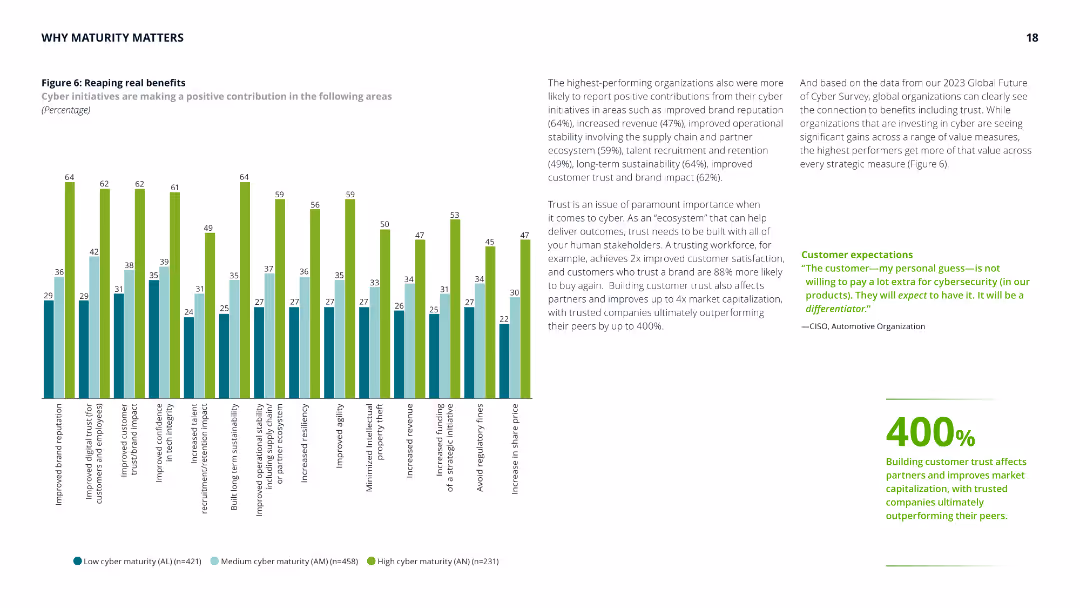
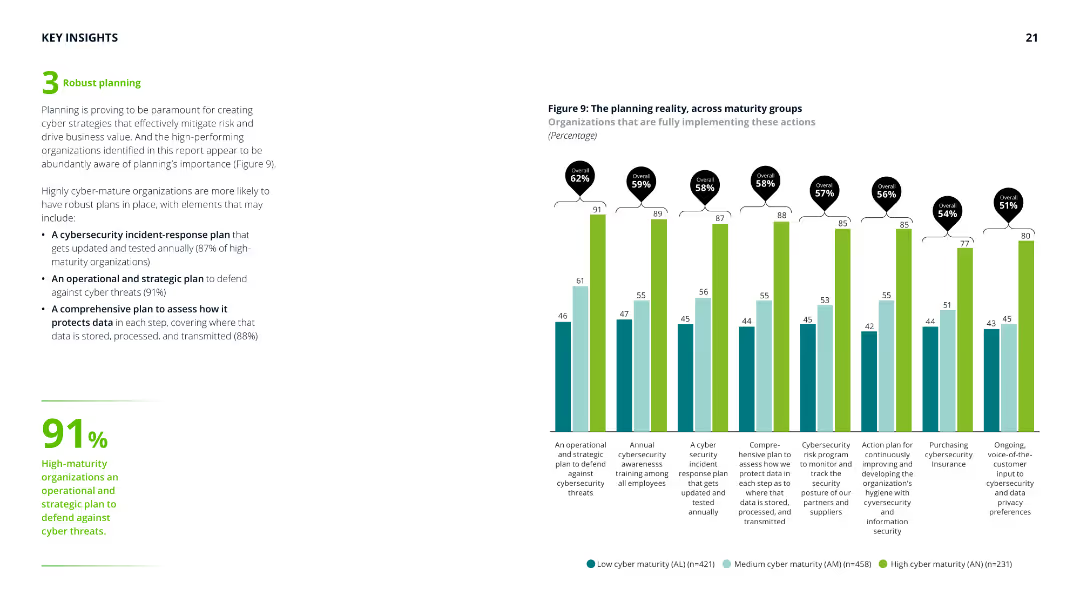
This slide contains a column chart with green and blue bars representing different maturity groups. Text on the right elaborates on the benefits of cyber initiatives.
Performance Metrics and KPIs
Technology & Software
Highlights the positive contributions of cyber initiatives, such as improved brand reputation and revenue, supported by survey data and commentary on trust and performance.
Cyber benefits, brand reputation, revenue, customer trust, performance
false
Performance Metrics and KPIs
Technology & Software
Mixed Chart
Deloitte
Add to my slides
Remove from favorites
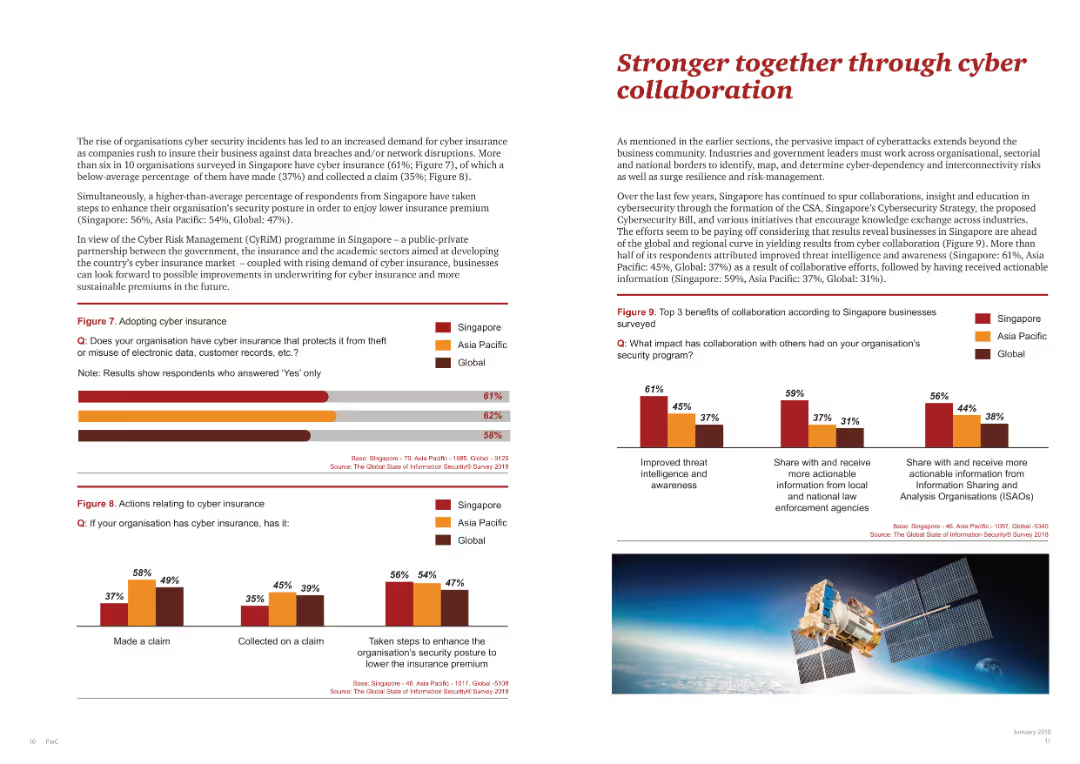
This slide shows two bar charts, one on adopting cyber insurance and another on the benefits of cyber collaboration.
Risk Assessment and Management
Telecommunications
Highlights the importance of collaboration in cybersecurity, showcasing benefits and adoption rates of cyber insurance across regions.
cyber collaboration, cyber insurance, survey benefits, regional data, security measures
false
Risk Assessment and Management
Telecommunications
Multiple Chart
PwC/Strategy&
Add to my slides
Remove from favorites
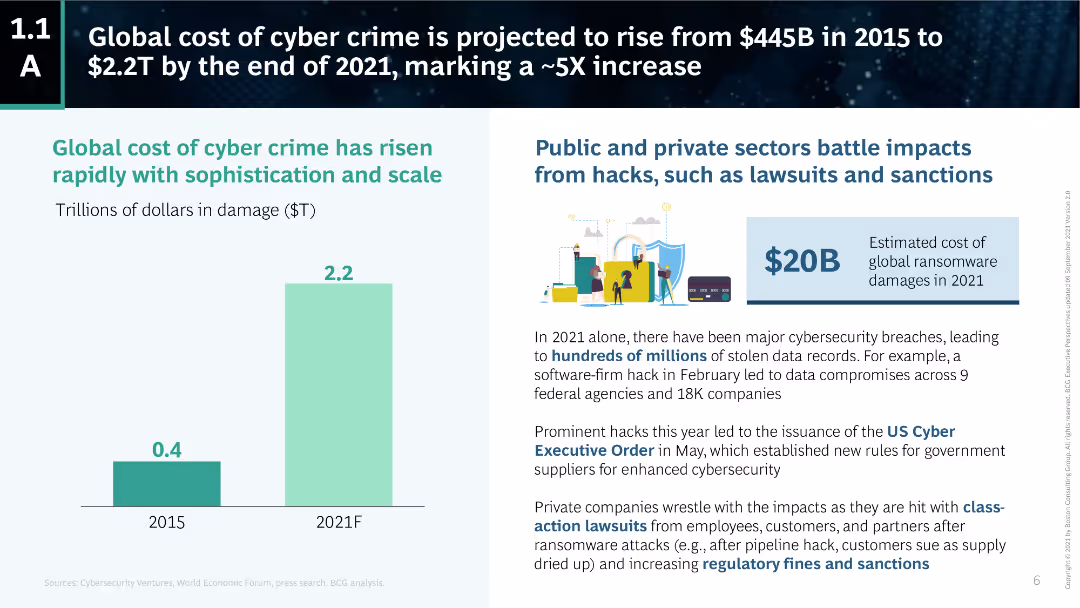
The slide includes a column chart showing the projected rise in the global cost of cyber crime from 2015 to 2021. Accompanying text provides context and additional data points.
Risk Assessment and Management
Technology & Software
This slide discusses the rapid rise in the cost of cyber crime, projected to increase from $445 billion in 2015 to $2.2 trillion by the end of 2021. It highlights the implications for public and private sectors.
cyber crime, cost increase, 2015-2021, projections, public and private sectors, cybersecurity, financial impact, column chart, BCG
false
Risk Assessment and Management
Technology & Software
Mixed Chart
BCG
Add to my slides
Remove from favorites
Features a column chart with green and blue bars representing different maturity groups' views on cyber's importance to digital initiatives.
Technology and Digital Transformation
Technology & Software
Discusses the importance of cyber in digital transformation initiatives, with data on how various maturity groups view its significance, focusing on areas like AI and IoT.
Cyber evolution, digital transformation, AI, IoT, maturity groups
false
Technology and Digital Transformation
Technology & Software
Mixed Chart
Deloitte
Add to my slides
Remove from favorites
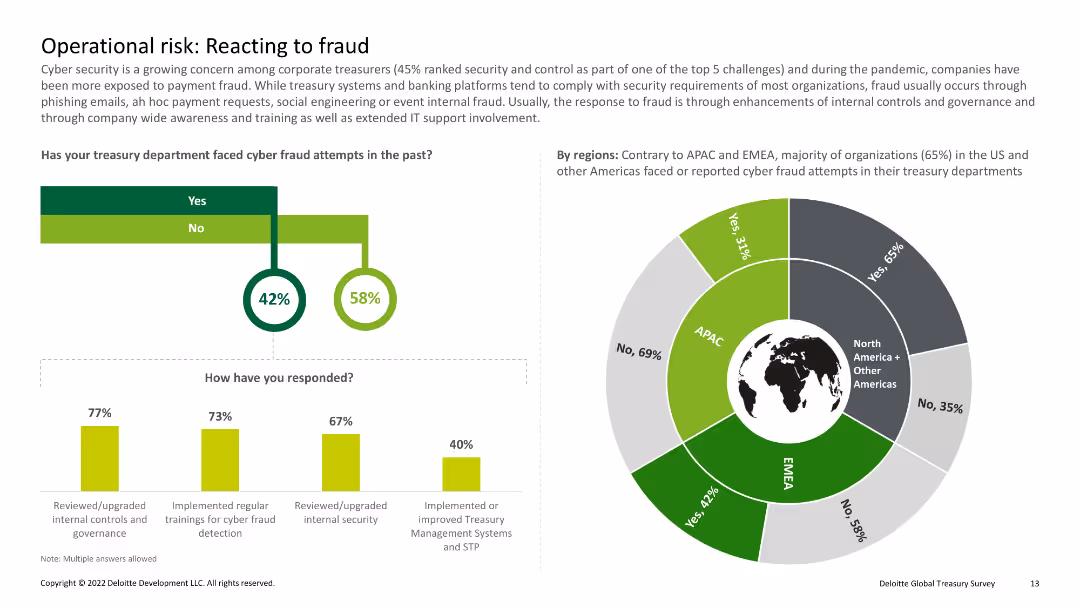
Column chart showing 42% 'Yes' and 58% 'No' for cyber fraud attempts; Pie chart comparing regions (APAC, EMEA, Americas) on cyber fraud attempts; bar charts for response methods
Risk Assessment and Management
Financial Services
Discusses the response to cyber fraud in treasury departments, highlighting regional differences and common preventive measures.
Cyber fraud, treasury, regions, responses, fraud attempts
false
Risk Assessment and Management
Financial Services
Multiple Chart
Deloitte
Add to my slides
Remove from favorites
The slide has a white background with green and black text. It includes a column chart on the right showing different maturity groups' views on cyber importance.
Strategic Planning
Technology & Software
Outlines five key focus areas for the future of cyber, emphasizing leadership, scenario planning, and the role of AI in cyber strategies, supported by survey data.
Cyber future, leadership, scenario planning, AI risk, digital transformation
false
Strategic Planning
Technology & Software
Mixed Chart
Deloitte
Add to my slides
Remove from favorites
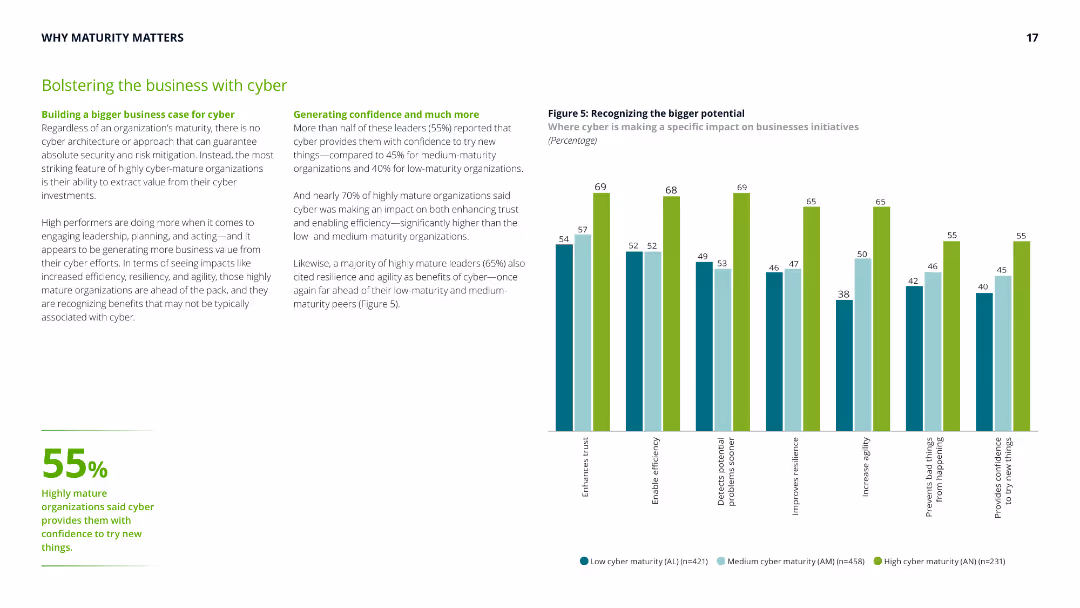
The slide has a white background with green and blue text. It features a column chart displaying various percentages related to cyber impacts on business initiatives.
Strategic Planning
Technology & Software
Discusses how highly mature organizations leverage cyber efforts to bolster business, generating confidence and efficiency, with statistics on cyber impact on initiatives.
Cyber impact, business case, confidence, efficiency, strategic planning
false
Strategic Planning
Technology & Software
Mixed Chart
Deloitte
Add to my slides
Remove from favorites
Light background with green accents, a bar chart on the left showing positive contributions of cyber initiatives, explanatory text on the right.
Operational Efficiency
Technology & Software
The slide discusses the positive contributions of cyber initiatives, such as improved brand reputation and operational stability, with survey data supporting these benefits.
Cyber initiatives, benefits, operational stability, survey, bar chart
false
Operational Efficiency
Technology & Software
Mixed Chart
Gartner
Add to my slides
Remove from favorites
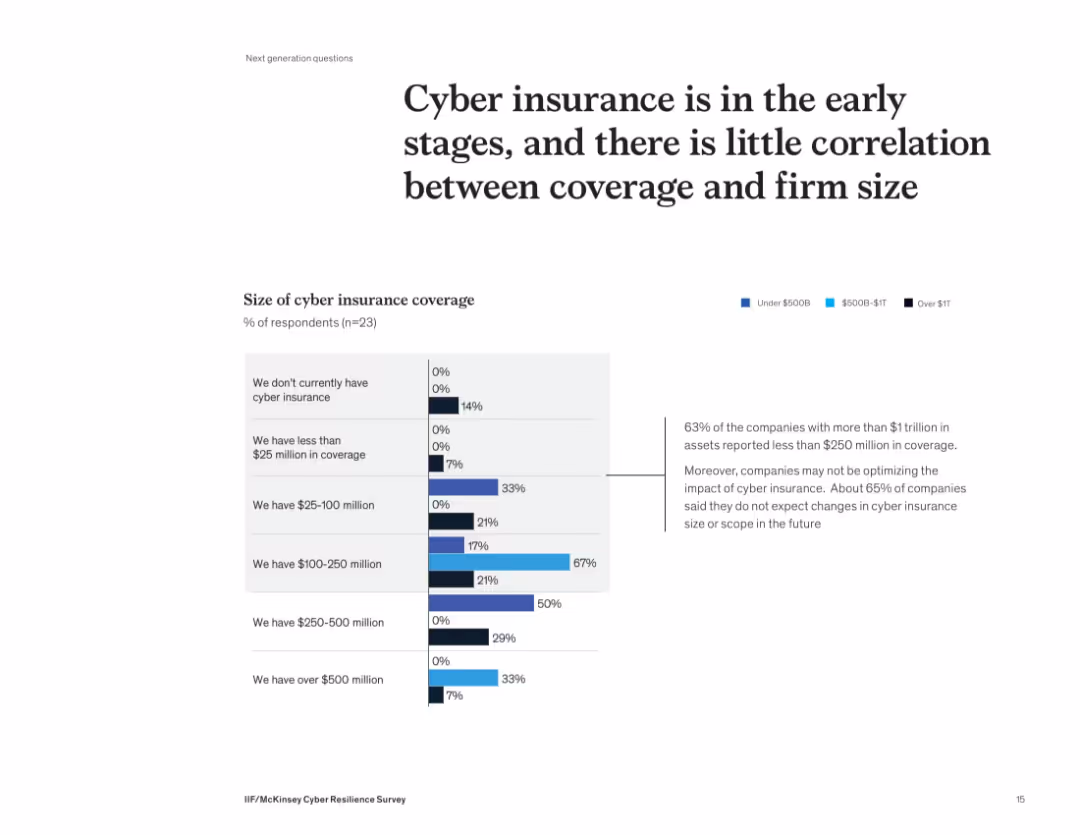
Stacked bar chart segmented by firm size showing coverage levels; with insight box on right side
Risk Assessment and Management
Financial Services
The slide presents survey results indicating that many firms, regardless of size, have low levels of cyber insurance coverage. 63% of firms with over $1 trillion in assets have less than $250M in coverage. Despite increasing risks, 65% of respondents do not foresee changes in coverage size or scope.
cyber insurance, coverage, risk, firm size, underinsured, survey, McKinsey, exposure, financial services
false
Risk Assessment and Management
Financial Services
Mixed Chart
McKinsey
Add to my slides
Remove from favorites
Previous
Next
You don't have any favorites yet.
Please wait loading your favorites slides...
Create a FREE account to continue browsing
Receive Instant Access to 1,000+ slides from companies like McKinsey, Google, and Goldman Sachs
First Name
Last Name
Email
Password
I agree to all
Terms & Privacy Policy
Thank you! Your submission has been received!
Oops! Something went wrong while submitting the form.
Have an account?
Sign in
Upgrade to PRO to Save slides
Advanced Search and Filters
Access to 15,000+ slides
Access to Category Pages
Save/Bookmark Slides
PowerPoint Template Library
Pick a Plan
MONTHLY
$12/month
Billed every month, Cancel anytime.
YEARLY
$9/year
Billed $108 annually, Cancel anytime.
Checkout for $12/month
Checkout for $108/yr
Secured by Stripe | AES-256 bit encryption