My Account
My Slides
Search by Category
Companies
Slide Type
Use Case
Industry
Pricing
Templates
View All Templates
Download Template Slides
✦ AI
AI Prompt Library
AI Search
Feedback
Login
Logout
Get Started
Browse all Slides
Browse all Slides
Create a FREE Account
Instant access to 1,000+ real slides from top companies like McKinsey, BCG, Goldman Sachs, Google and many more!
First Name
Last Name
Email
Password
I agree to all
Terms & Privacy Policy
Thank you! Your submission has been received!
Oops! Something went wrong while submitting the form.
Have an account?
Sign in
Saved Slides
Total No. of slides saved
0
↻ Refresh
✖ Clear all
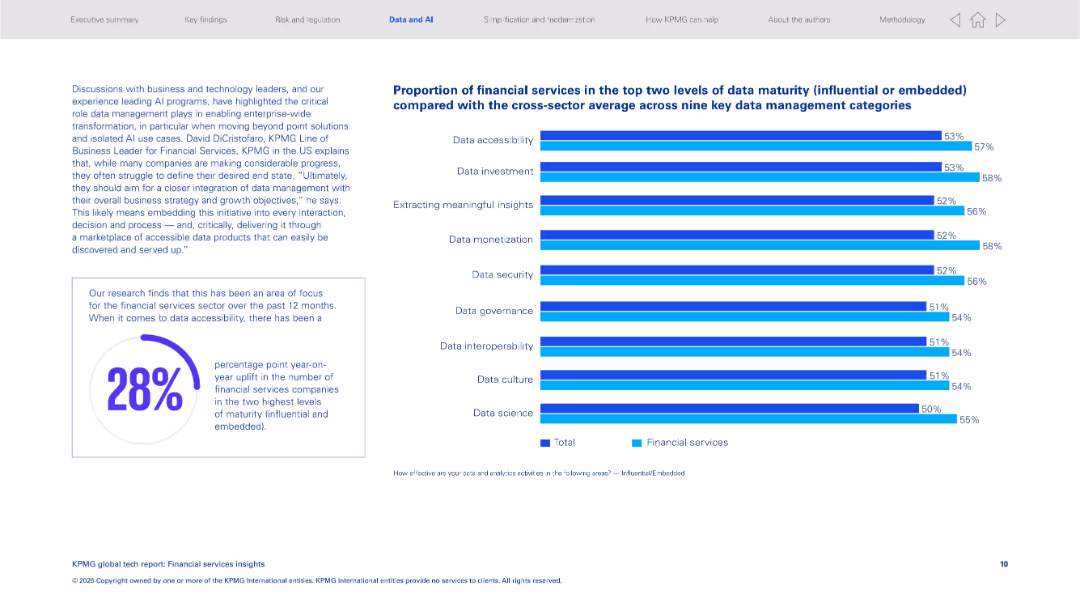
Left: narrative box and 28% statistic in circle; right: bar chart with 9 data categories showing financial services vs total sector average.
Performance Metrics and KPIs
Financial Services
Analyzes financial services data maturity across nine categories, showing significant improvements, especially in accessibility. It emphasizes integrating data management with business objectives for enterprise-wide transformation.
data maturity, accessibility, financial services, data governance, insights, business alignment
false
Performance Metrics and KPIs
Financial Services
Multiple Chart
KPMG
Add to my slides
Remove from favorites
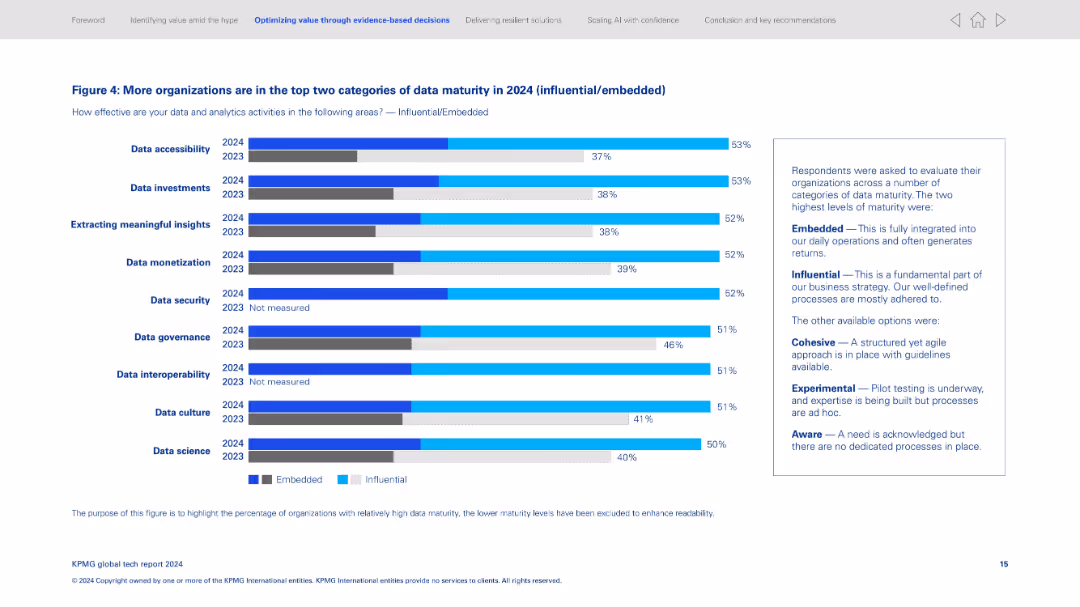
Bar chart-heavy slide; shows comparison between 2023 and 2024 across various data-related categories; explanation box on the right.
Performance Metrics and KPIs
Technology & Software
Demonstrates the rise in data maturity with more organizations achieving influential or embedded levels. Lists categories like data accessibility, investments, and insights. Accompanying text defines the maturity categories and contextualizes improvements.
Data maturity, embedded systems, influential processes, data governance, analytics improvement, benchmarks, comparison chart, data evaluation
false
Performance Metrics and KPIs
Technology & Software
Mixed Chart
KPMG
Add to my slides
Remove from favorites
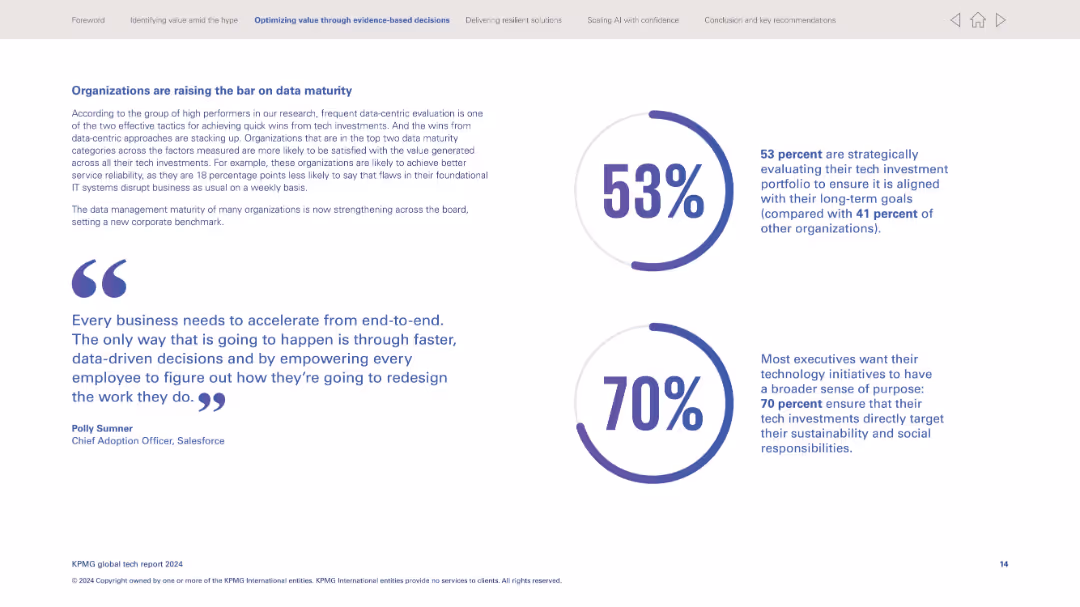
Clean two-column layout with statistics on the right in circular visuals; large quote block adds emphasis; minimalist and modern design.
Performance Metrics and KPIs
Technology & Software
Discusses the growing maturity in data management and how strategic, data-centric evaluation drives tech investment success. Cites that 53% align tech portfolios with long-term goals and 70% connect tech with sustainability goals.
Data maturity, strategic alignment, tech portfolio, sustainability, evidence-based decisions, long-term goals, quote, Salesforce
false
Performance Metrics and KPIs
Technology & Software
Mixed Chart
KPMG
Add to my slides
Remove from favorites
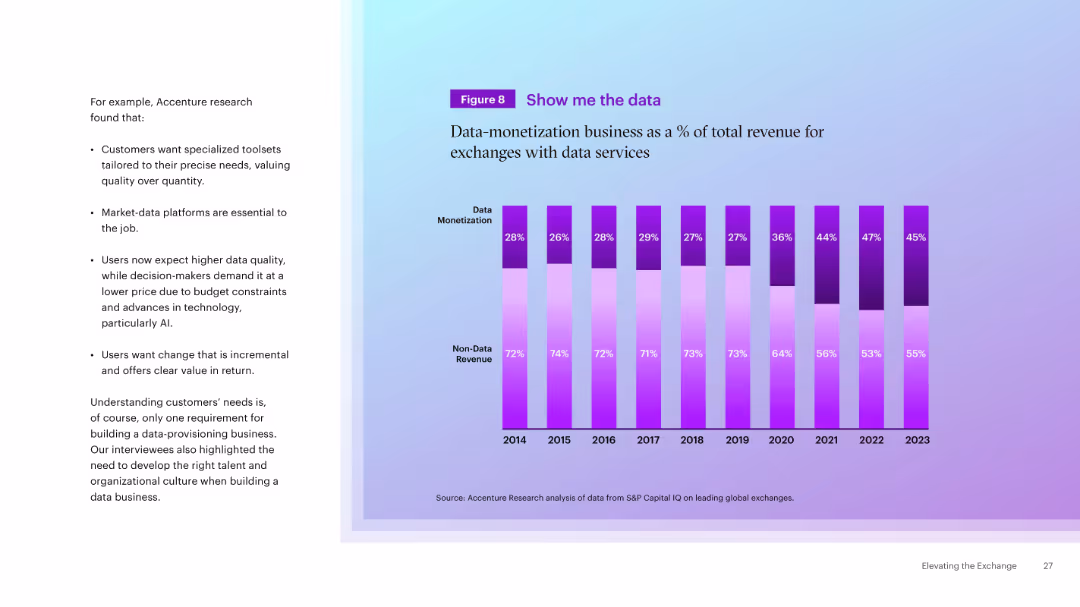
Stacked bar chart showing rising data monetization revenue as % of total for exchanges with data services (2014–2023). Left-aligned supporting bullets.
Product and Service Analysis
Technology & Software
The slide illustrates the growing importance of data monetization in exchanges’ business models. It notes the increasing value users place on high-quality, tailored market data platforms, driving demand and revenue from these services.
Data Monetization, Exchange, Revenue Share, Platforms, Market Data, Services, Growth, Trends
false
Product and Service Analysis
Technology & Software
Mixed Chart
Accenture
Add to my slides
Remove from favorites
Uses purple tones with pie charts detailing statistics about organizational control over worker data and the importance of leveraging this data for mutual benefits.
Organizational Structure and Change
Professional Services
Discusses the shift from traditional data ownership models to shared or worker-owned models, highlighting its importance to organizational success.
data ownership, worker data, mutual benefits, organizational success, data leverage, trust
false
Organizational Structure and Change
Professional Services
Multiple Chart
Deloitte
Add to my slides
Remove from favorites
Contains a split-view layout showcasing data intake sources and the outcomes from using a cloud-based data platform, with icons and charts.
Technology and Digital Transformation
Financial Services
Details the use and impact of JPMorgan’s cloud-based data platform in optimizing business operations and enhancing decision-making processes through data analytics and management.
Data Platform, Cloud-Based, Business Optimization, Data Analytics, Decision Making
false
Technology and Digital Transformation
Financial Services
Mixed Chart
JP Morgan
Add to my slides
Remove from favorites
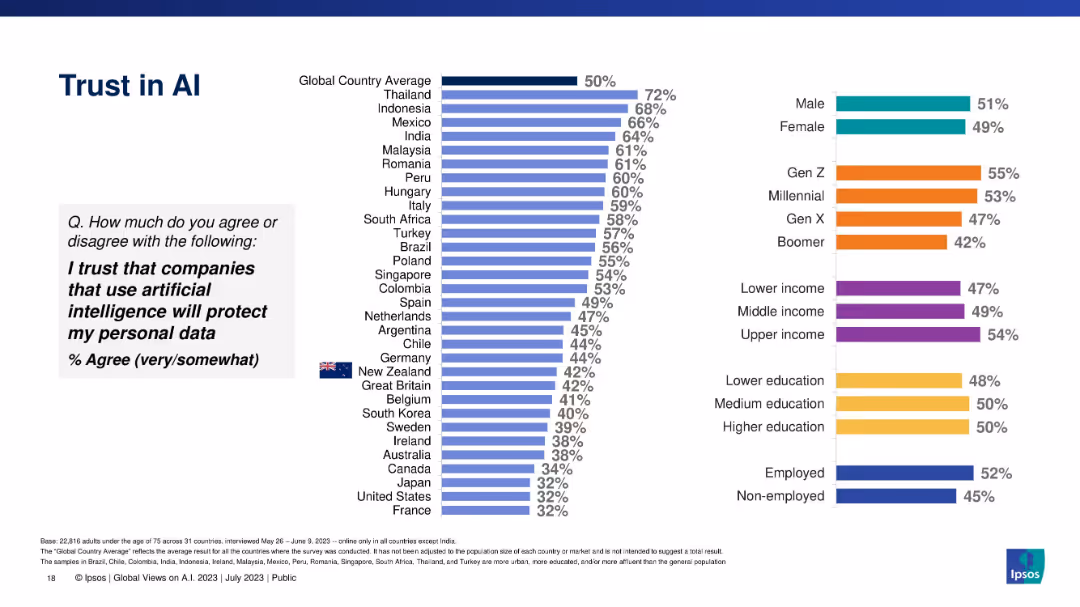
Vertical bars representing belief that AI-using companies will protect personal data, by country/demographic.
Risk Assessment and Management
Artificial Intelligence
Highlights global trust levels in data protection by AI-using companies, comparing demographic and national responses. Overall global trust is at 50%, with wide variation.
data privacy, AI, consumer trust, cybersecurity, global sentiment, Ipsos
false
Risk Assessment and Management
Artificial Intelligence
Multiple Chart
IPSOS
Add to my slides
Remove from favorites
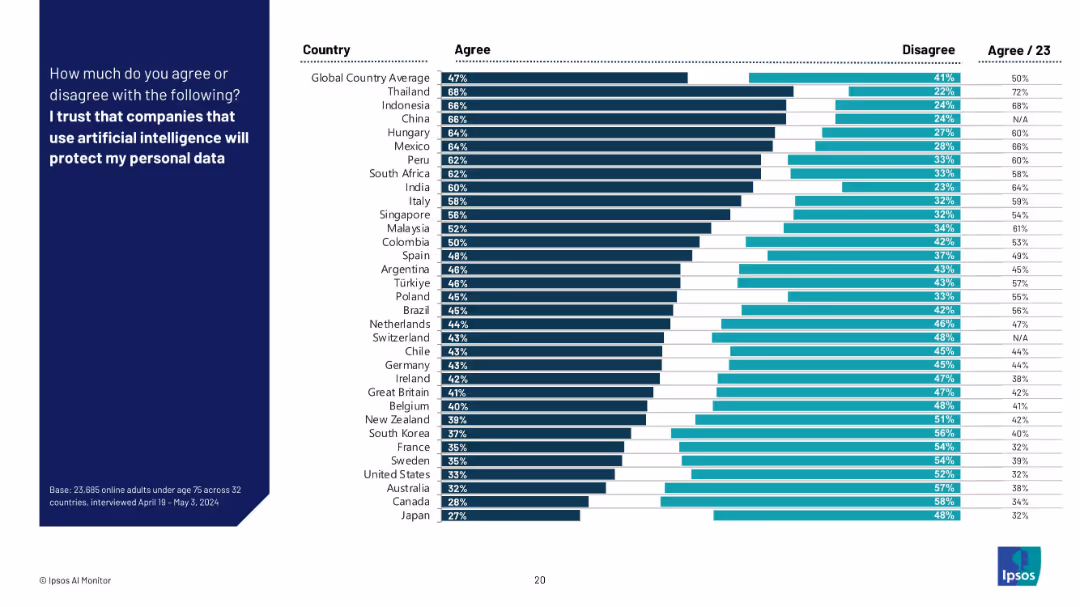
Horizontal bar chart ranked by agreement across countries; includes agree/disagree bars with global comparison.
Risk Assessment and Management
Artificial Intelligence
This chart evaluates consumer trust in companies using AI with respect to protecting personal data. It highlights differences in trust levels between nations, shedding light on privacy concerns and public confidence in data governance.
data privacy, AI trust, consumer sentiment, cybersecurity, Ipsos, global comparison, corporate ethics, AI security
false
Risk Assessment and Management
Artificial Intelligence
Mixed Chart
IPSOS
Add to my slides
Remove from favorites
A set of bar charts displaying percentage agreement with various data privacy statements in 2021, comparing Britain, the US, and Brazil.
Market Analysis and Trends
Technology & Software
The slide highlights key reactions to data privacy concerns, showing levels of anxiety and apathy among people in different countries.
Data Privacy, Anxiety, Apathy, Reactions, Countries
false
Market Analysis and Trends
Technology & Software
Mixed Chart
IPSOS
Add to my slides
Remove from favorites
This slide presents a bar chart with global and regional data on whether CEOs believe governments are effectively balancing data privacy with competitiveness.
Regulatory and Compliance
Technology & Software
The slide shows a majority belief that data privacy regulations should balance competitiveness and consumer trust, with varying opinions by region.
Data privacy, competitiveness, government collaboration, regulations, CEO beliefs
false
Regulatory and Compliance
Technology & Software
Multiple Chart
PwC/Strategy&
Add to my slides
Remove from favorites
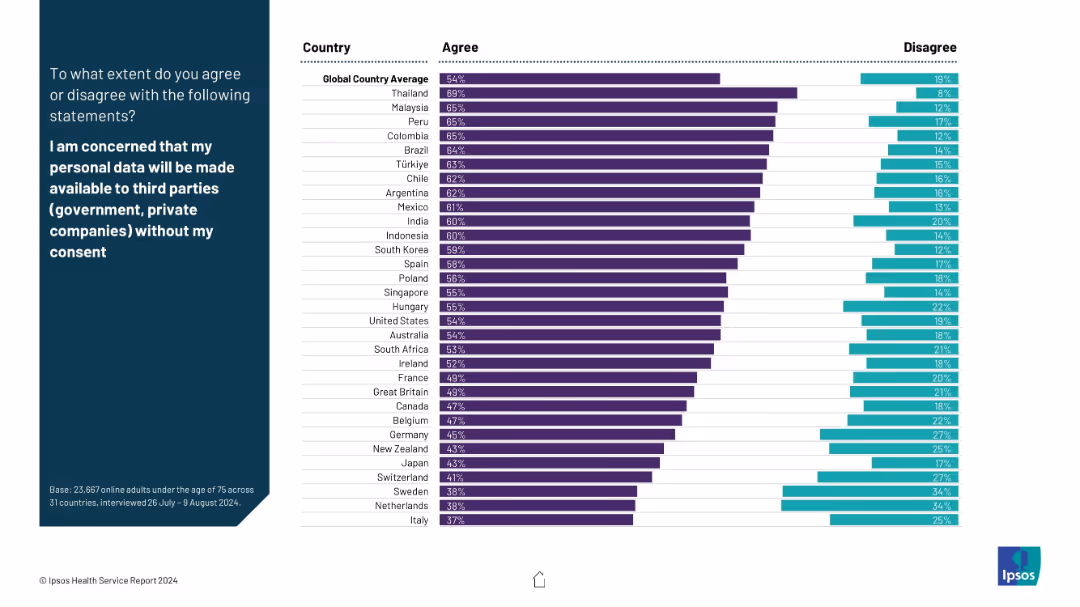
Horizontal bar chart split by agree/disagree percentages by country, with a prompt in the left section.
Regulatory and Compliance
Healthcare & Pharmaceuticals
The slide presents levels of concern about unauthorized data sharing in healthcare. Thailand and Malaysia show highest concern. Agreement and disagreement are color-coded for easy comparison.
data privacy, healthcare data, patient concern, regulation, confidentiality, public opinion, global survey
false
Regulatory and Compliance
Healthcare & Pharmaceuticals
Mixed Chart
IPSOS
Add to my slides
Remove from favorites
The slide features three vertical column charts comparing survey responses from 2013 and 2022 in India, Sweden, and the US.
Market Analysis and Trends
Technology & Software
The slide analyzes changes in public opinion on data privacy concerns and online privacy attitudes across different countries.
Data privacy, online privacy, public opinion, survey, trends
false
Market Analysis and Trends
Technology & Software
Multiple Chart
IPSOS
Add to my slides
Remove from favorites
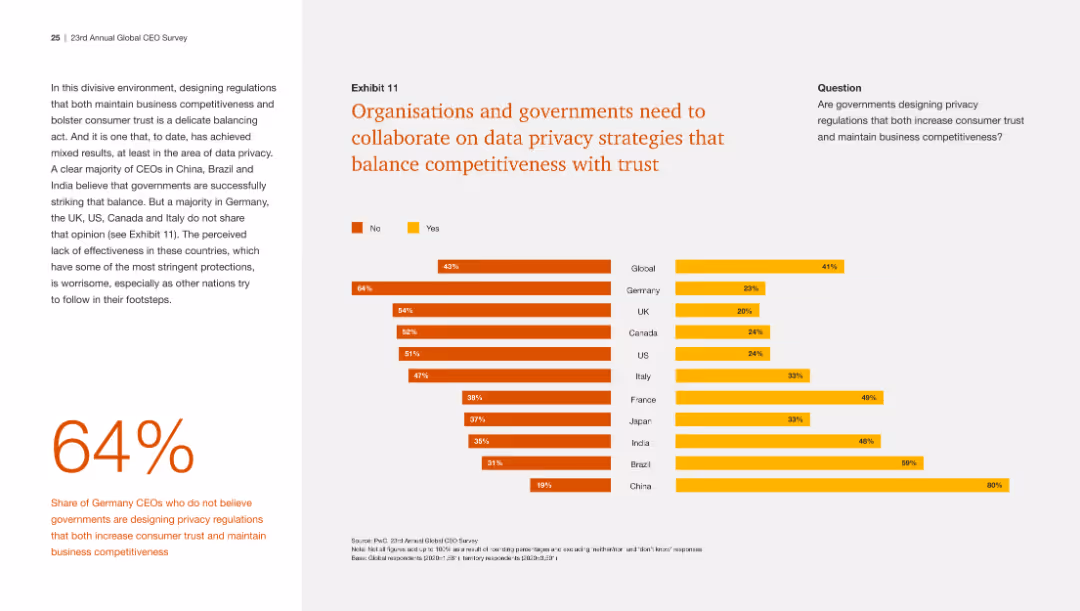
The slide presents a bar chart with horizontal bars in orange, indicating percentages for different regions answering a question on data privacy. There's a large '64%' graphic and an explanatory text block on the left.
Market Analysis and Trends
Financial Services
The slide depicts global perspectives on whether governments are effectively designing data privacy regulations that balance trust and business competitiveness, with a focus on several countries.
Data Privacy, Regulations, CEOs, Trust, Competitiveness, Global, Government
false
Market Analysis and Trends
Financial Services
Multiple Chart
PwC/Strategy&
Add to my slides
Remove from favorites
Graphs and bulleted lists detailing the impact of privacy concerns on consumer behavior and the shift toward first-party data strategies, with a global comparison of data privacy concerns.
Technology and Digital Transformation
Retail & E-commerce
Discusses the implications of privacy concerns and the phaseout of third-party cookies on data capture strategies and digital marketing practices.
Data Privacy, Third-party Cookies, Consumer Behavior, First-party Data, Privacy Regulations, Marketing Strategy, Global Trends, Ad Blockers, Data Strategy, Digital Trust
false
Technology and Digital Transformation
Retail & E-commerce
Header Horizontal
BCG
Add to my slides
Remove from favorites
Features bar charts comparing the use of first, second, and third-party data over time with projections for the future. The layout is clear with each data type color-coded and easy to distinguish. Insightful commentary on the side provides a deeper understanding of the data privacy trends and their implications for marketing strategy.
Customer and Market Segmentation
Professional Services
Focused on the shift in data sourcing strategies, this slide is crucial for understanding the evolving landscape of data privacy and its impact on marketing. It offers insights into how companies are adapting to increased restrictions on third-party data, making it suitable for discussions on data management strategies and compliance with privacy regulations.
data privacy, third-party data, first-party data, marketing strategies, compliance
false
Customer and Market Segmentation
Professional Services
Mixed Chart
Deloitte
Add to my slides
Remove from favorites
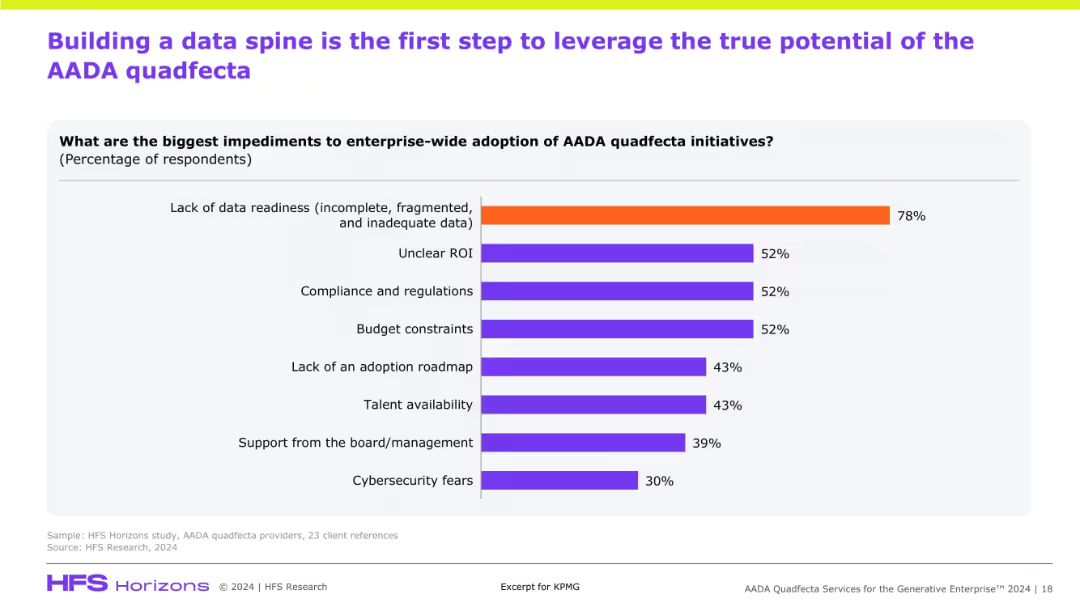
Horizontal bar chart listing key barriers to AADA adoption. Dominated by data readiness and ROI concerns. Purple-orange theme.
Risk Assessment and Management
Artificial Intelligence
This slide identifies the biggest challenges in adopting AADA enterprise-wide. Lack of data readiness is the top concern, followed by ROI uncertainty, regulation, and budget issues—highlighting foundational gaps to be addressed.
data readiness, barriers, adoption, AADA, ROI, regulation, budget, risks, enterprise strategy
false
Risk Assessment and Management
Artificial Intelligence
Single Chart
KPMG
Add to my slides
Remove from favorites
Slide presents a dark theme with a graph and an information box. A bold bar graph depicts survey results with percentages in contrasting colors, accompanied by a summarizing statement. It has a clear visual hierarchy with the graph as the focal point and an inset box for additional data.
Regulatory and Compliance
Retail & E-commerce
This slide contains a bar graph summarizing survey responses regarding organizational approaches to selling customer data. It is pertinent for presentations analyzing consumer data protection practices and corporate ethics in data management, particularly under regulatory and compliance contexts.
Data Sale, Customer Permission, Survey, Corporate Ethics, Data Protection, Privacy, Regulation, Compliance
false
Regulatory and Compliance
Retail & E-commerce
Single Chart
Kearney
Add to my slides
Remove from favorites
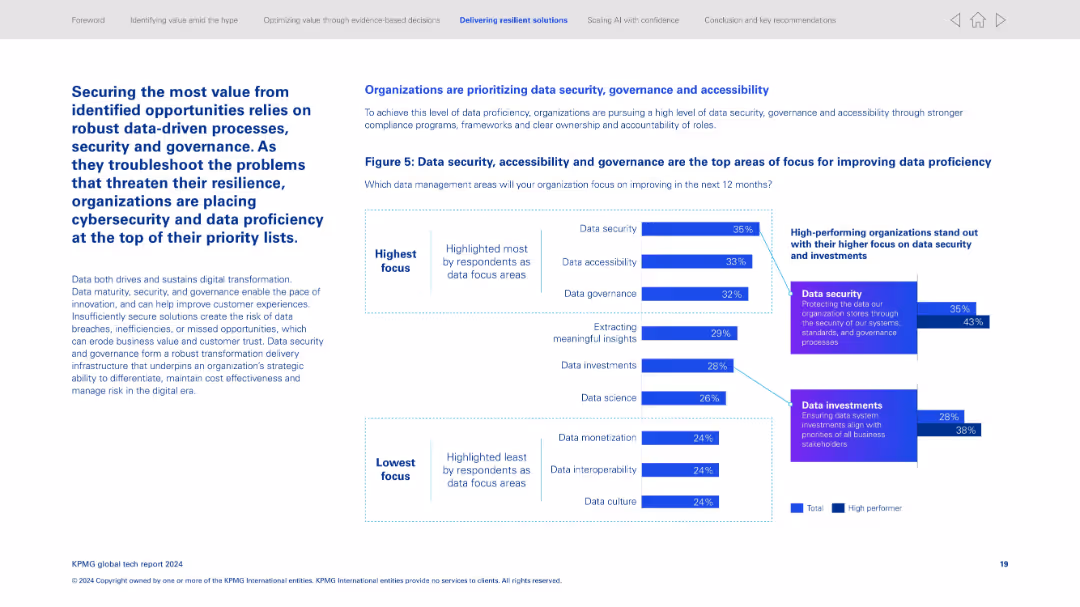
Left-aligned text with bold headline; right section features a bar chart comparing data management priorities; highlights high performer differences.
Risk Assessment and Management
Technology & Software
Organizations focus most on data security (35%), followed by accessibility and governance. The graph contrasts general and high performer priorities. High-performing firms show stronger emphasis on securing data and aligning investments with strategic goals.
Data security, governance, accessibility, risk management, digital transformation, high performance, cybersecurity, investment alignment
false
Risk Assessment and Management
Technology & Software
Multiple Chart
KPMG
Add to my slides
Remove from favorites
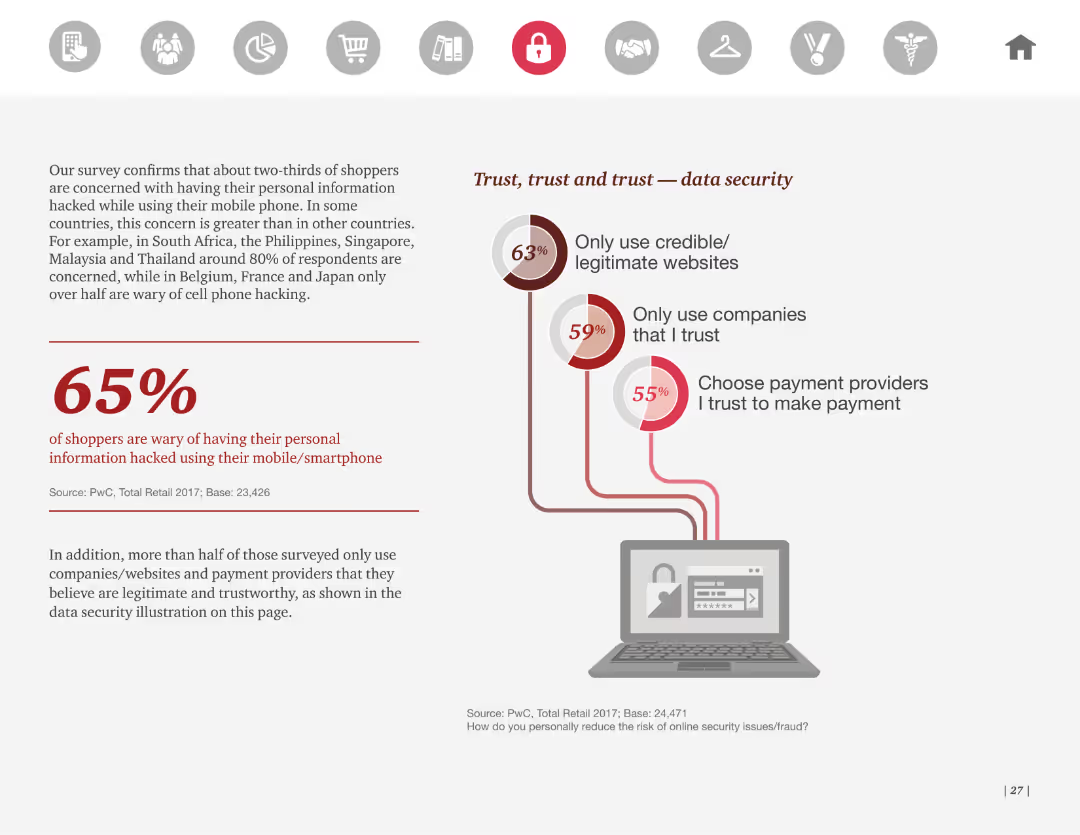
This slide features a pie chart and a large percentage figure prominently displayed. The layout is clean with a focus on statistics regarding shoppers' concerns about data security on mobile devices. It uses minimal text with a clear and concise design.
Risk Assessment and Management
Retail & E-commerce
The slide presents survey results highlighting that 65% of shoppers are wary of having their personal information hacked using their mobile phones. It emphasizes the importance of credible websites, trusted companies, and secure payment providers.
Data security, mobile, hacking, trust, survey
false
Risk Assessment and Management
Retail & E-commerce
Mixed Chart
PwC/Strategy&
Add to my slides
Remove from favorites
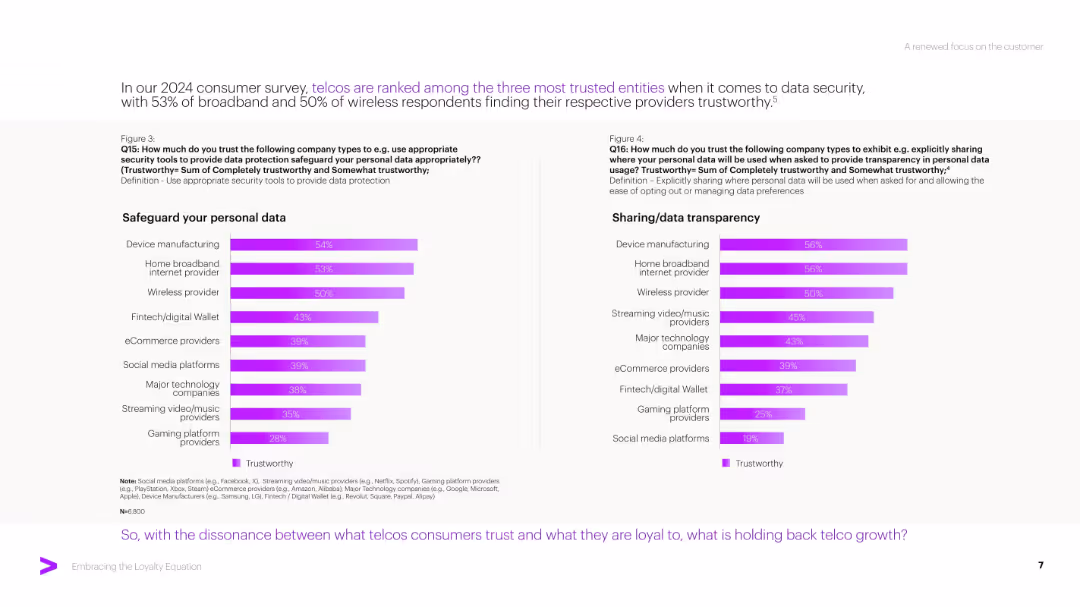
Dual bar charts on left and right comparing trust in various industries for data security and transparency. Survey-based.
Risk Assessment and Management
Telecommunications
The slide presents consumer trust ratings across sectors for safeguarding personal data and transparency. Telecoms rank high, particularly broadband providers, suggesting trust isn’t the core issue behind poor loyalty, opening the door for deeper customer engagement.
Data Security, Transparency, Trust, Telecom, Consumer Survey, Privacy, Broadband, Risk Management
false
Risk Assessment and Management
Telecommunications
Multiple Chart
Accenture
Add to my slides
Remove from favorites
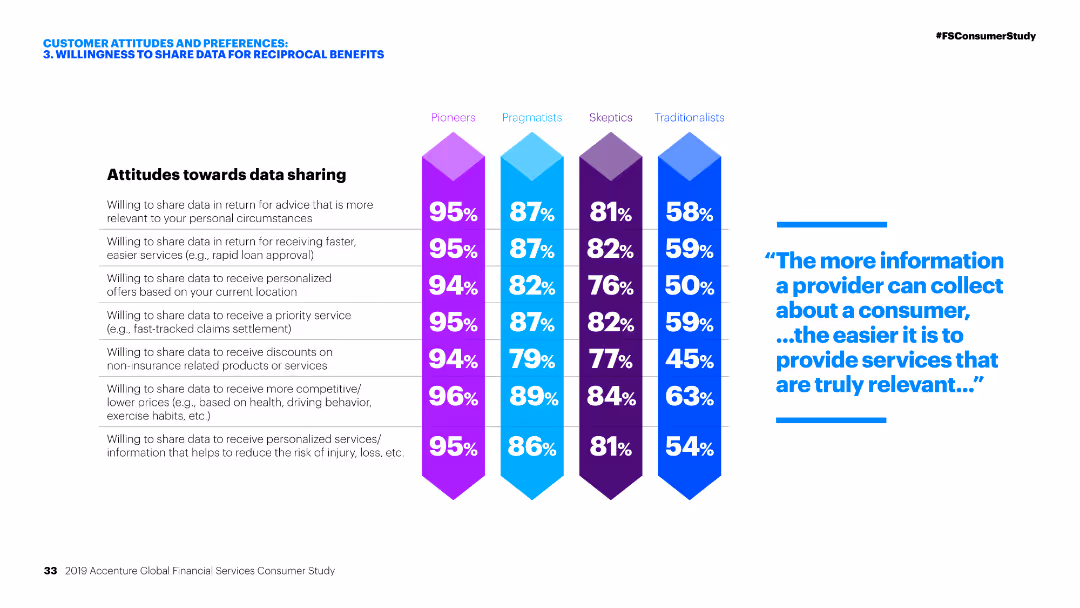
Column chart showing percentages of different customer segments (Pioneers, Pragmatists, Skeptics, Traditionalists) and their willingness to share data for various benefits.
Customer and Market Segmentation
Financial Services
The slide displays customer attitudes towards data sharing, highlighting percentages of willingness among different customer segments for various data sharing incentives.
Data sharing, Customer segments, Financial services, Attitudes, Incentives
false
Customer and Market Segmentation
Financial Services
Table
Accenture
Add to my slides
Remove from favorites
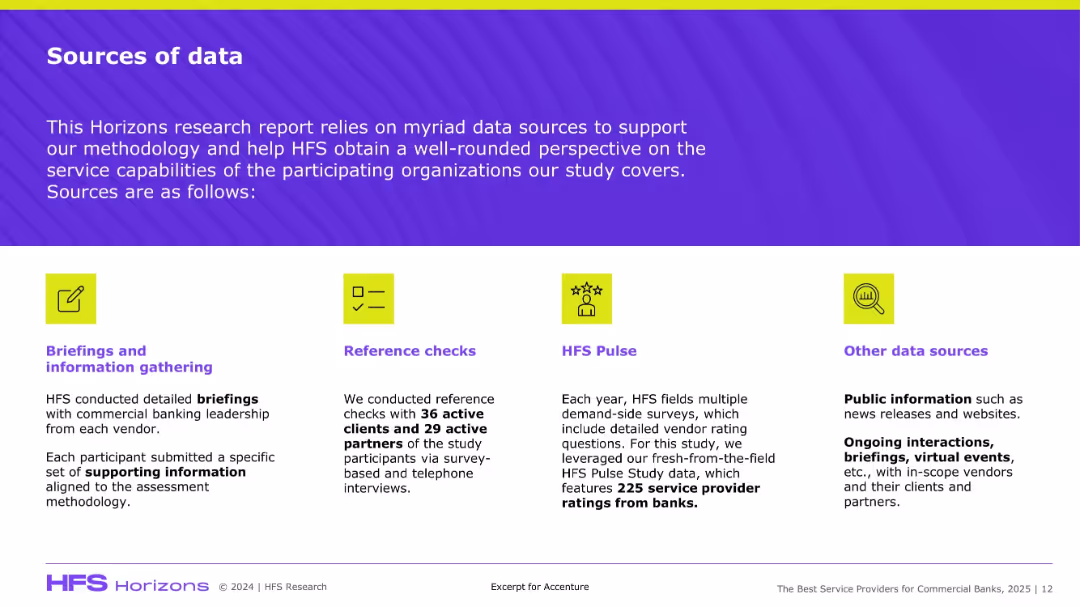
Four-block layout with icons, each detailing a type of data source; uses bright visuals and concise descriptions.
Regulatory and Compliance
Professional Services
This slide explains the methodology for gathering insights in the HFS Horizons study, covering briefings, reference checks, surveys (HFS Pulse), and public data sources to support vendor evaluation.
Data sources, HFS, methodology, research, banks, reference checks, vendor ratings
false
Regulatory and Compliance
Professional Services
Pillar
Accenture
Add to my slides
Remove from favorites
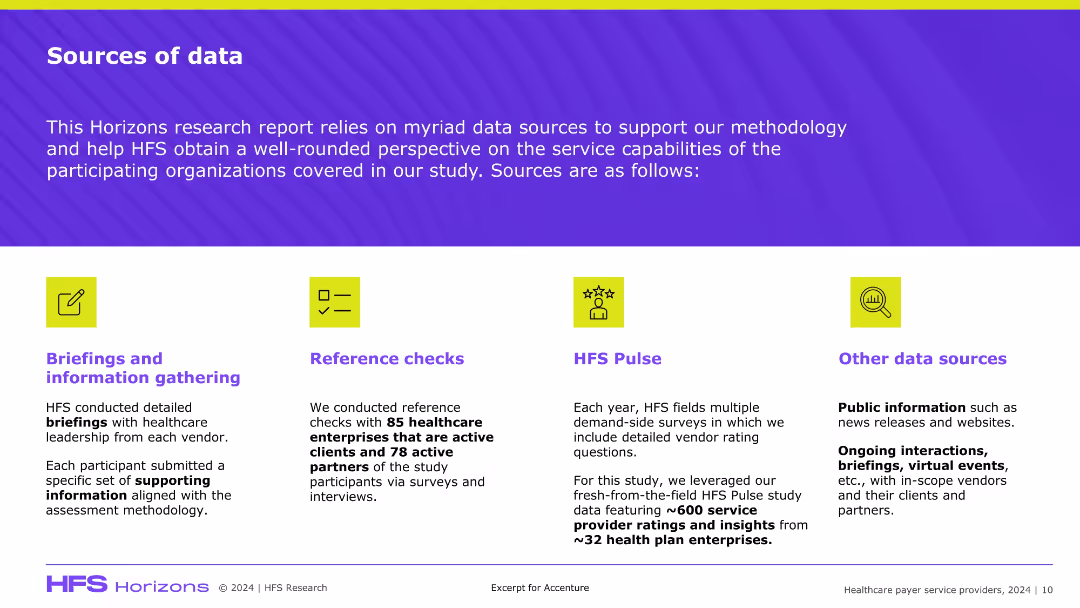
Clean, four-column layout with icons and sections for each data source; bold section headers and supporting text below each icon on a purple-striped background.
Industry Overview
Healthcare & Pharmaceuticals
Summarizes the data sources behind HFS’s healthcare payer service study, including executive briefings, reference checks, HFS Pulse surveys, and public data. Emphasizes the diverse and validated methodology to ensure study reliability.
data sources, HFS Research, healthcare, methodology, surveys
false
Industry Overview
Healthcare & Pharmaceuticals
Pillar
Accenture
Add to my slides
Remove from favorites
The slide uses a simple design with text and icons. It offers recommendations for future data strategies, focusing on knowing consumers, engaging on next-gen platforms, and privacy.
Strategic Planning
Professional Services
This slide provides strategic recommendations for marketers to adopt future-forward data strategies, emphasizing consumer understanding, engagement on modern platforms, and privacy considerations.
data strategies, recommendations, future-forward, consumer engagement, privacy
false
Strategic Planning
Professional Services
Header Vertical
Nielsen
Add to my slides
Remove from favorites
This slide features two tables and a detailed layout displaying various actions taken by companies in response to changes to third-party data. Contains percentage statistics and sector-specific data.
Market Analysis and Trends
Professional Services
Describes actions taken by companies post third-party cookie changes, segmented by economic sector, showcasing the business focus on enhanced data strategies.
data strategy, third-party data, innovation, marketing, customer engagement
false
Market Analysis and Trends
Professional Services
Table
Deloitte
Add to my slides
Remove from favorites
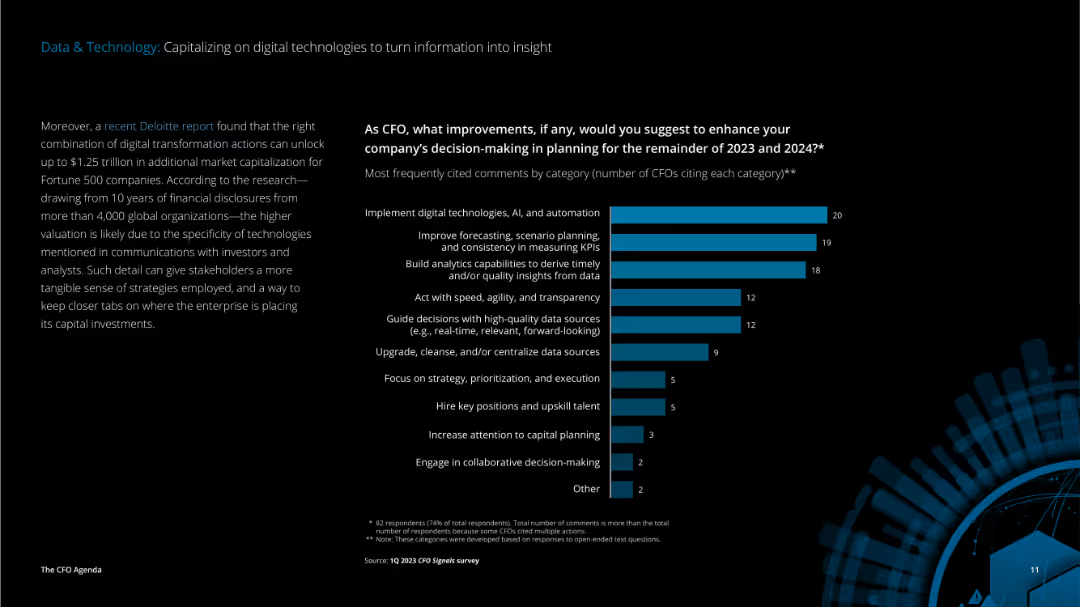
The slide features detailed text on the left discussing digital transformation benefits and a vertical column chart on the right showing suggested improvements for decision-making.
Technology and Digital Transformation
Technology & Software
The slide highlights the benefits of digital transformation and suggests improvements for enhancing decision-making through the implementation of digital technologies, AI, and automation, focusing on planning and strategy.
data, technology, digital transformation, AI, automation, decision-making, planning, strategy, CFO, improvements
false
Technology and Digital Transformation
Technology & Software
Mixed Chart
Deloitte
Add to my slides
Remove from favorites
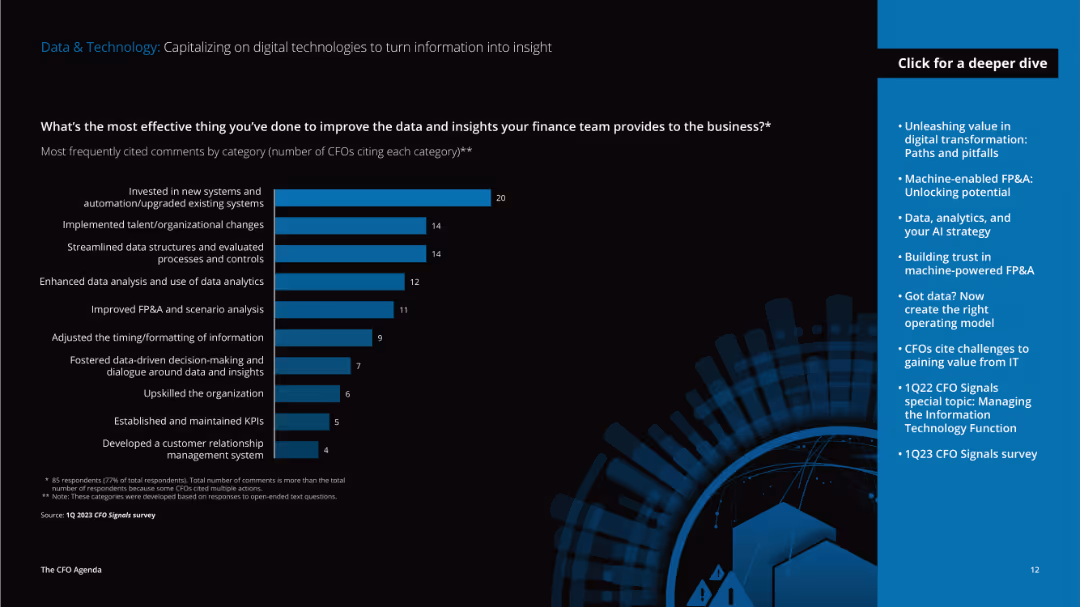
This slide has detailed text on the left discussing data improvement strategies and a vertical column chart on the right showing effective actions taken by CFOs to enhance data insights.
Technology and Digital Transformation
Technology & Software
The slide discusses effective strategies CFOs have implemented to improve data and insights, such as investing in new systems, implementing organizational changes, and enhancing data analysis capabilities.
data, technology, improvement, systems, organizational changes, data analysis, insights, CFO, strategies, implementation
false
Technology and Digital Transformation
Technology & Software
Mixed Chart
Deloitte
Add to my slides
Remove from favorites
The slide displays two sets of column charts. The left chart shows survey responses with the United States bar highlighted in yellow. The right chart includes labels for each bar.
Technology and Digital Transformation
Professional Services
This slide explains Tufte's principles of data-to-ink ratio, emphasizing the importance of clear data presentation by showing survey responses from different countries.
data-to-ink ratio, Tufte, survey responses, column charts, labeling
false
Technology and Digital Transformation
Professional Services
Multiple Chart
EY
Add to my slides
Remove from favorites
The layout includes values, icons, and a data flow diagram. The design is clean, with blue color accents and data-related imagery.
Technology and Digital Transformation
Technology & Software
Details how the breadth and scale of the firm's data are being transformed into value-added products for clients through various tools and services.
Data transformation, payment accounts, merchant acquiring, digital identity, data governance, biometrics, customer insights, identity verification
false
Technology and Digital Transformation
Technology & Software
Header Horizontal
JP Morgan
Add to my slides
Remove from favorites
Pie charts and statistic blocks highlighting customer data interaction and trust issues.
Strategic Planning
Professional Services
Discusses how strategic data use can improve customer relations and retention, focusing on trust and personalization in business approaches.
data use, customer trust, strategic plan
false
Strategic Planning
Professional Services
Multiple Chart
BCG
Add to my slides
Remove from favorites
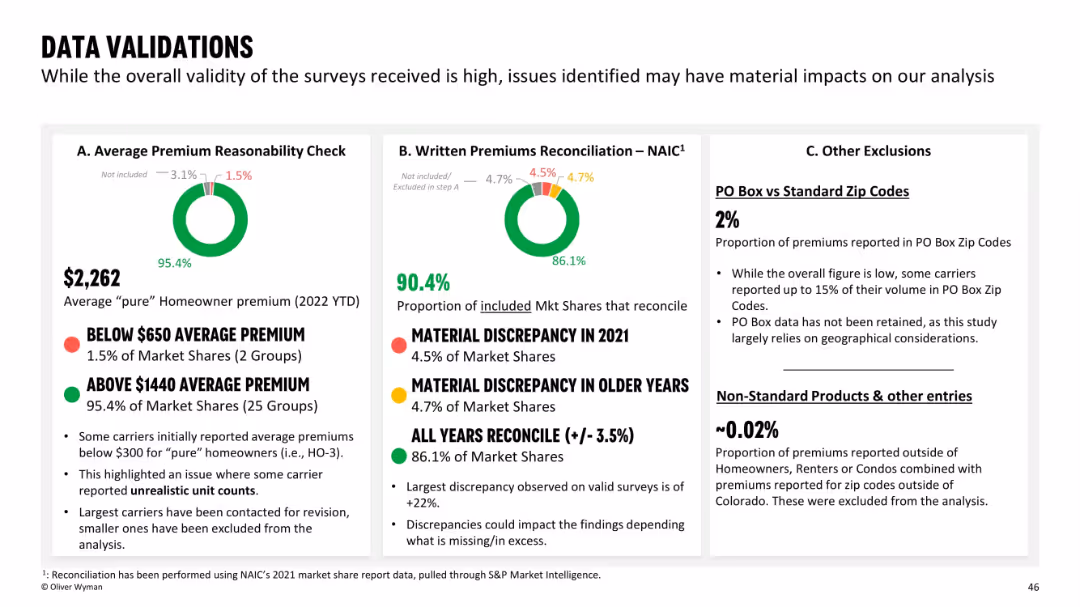
Slide is divided into three labeled sections (A–C) with circular data visuals, percentage figures, and explanations. Clear separation of content with red/green/yellow traffic light indicators.
Regulatory and Compliance
Financial Services
This slide assesses the validity of insurance data used in the analysis, focusing on average premium reasonableness, written premium reconciliation, and exclusions like PO boxes. The slide highlights a few discrepancies but confirms high overall validity of data collected from insurers. Key issues like outliers and unrealistic unit counts are addressed.
data validation, premiums, reconciliation, insurance, survey quality, PO box, exclusions, market share
false
Regulatory and Compliance
Financial Services
Multiple Chart
Oliver Wyman
Add to my slides
Remove from favorites
Data visualization slide with charts and a photo, presenting statistics related to the report's findings on women's well-being.
Technology and Digital Transformation
Professional Services
Provides a visual representation of data regarding improvements and continuing challenges in women's well-being at work, emphasizing both progress and areas needing attention.
Data, Women, Well-Being, Progress, Challenges
false
Technology and Digital Transformation
Professional Services
Agenda
Deloitte
Add to my slides
Remove from favorites
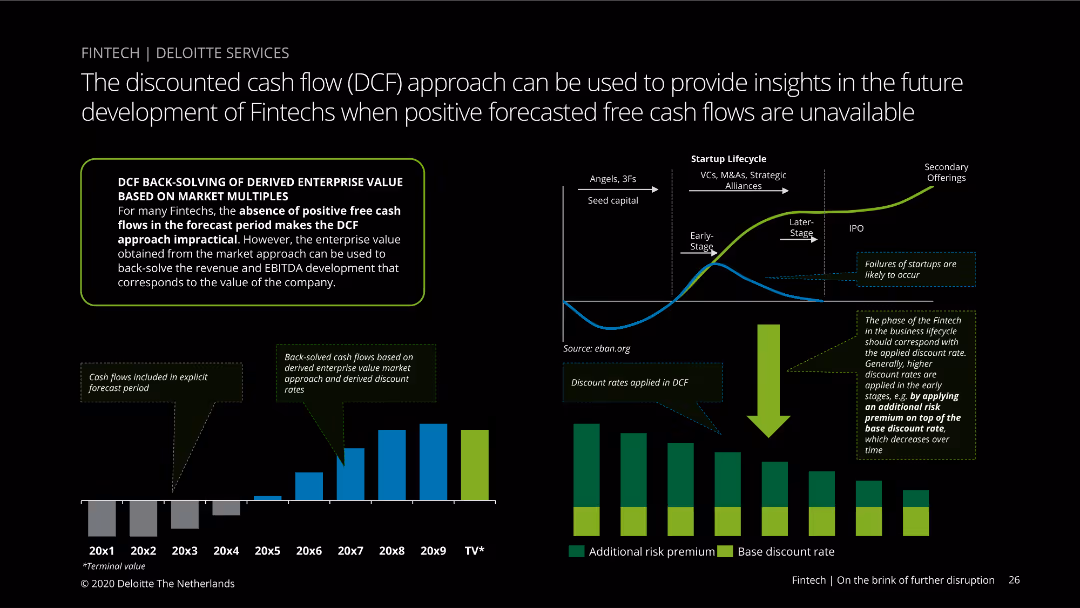
The slide contains a column chart and a line graph illustrating the DCF approach for fintechs, along with a lifecycle diagram of startups. The visual elements are dense and detailed, aimed at technical audiences. Complexity is advanced.
Financial Performance
Financial Services
Discusses the DCF approach to valuing fintechs in the absence of positive cash flows. The slide includes charts and diagrams to explain how enterprise value is derived using market multiples and discount rates. Useful for financial analysis.
DCF, valuation, fintech, enterprise value, cash flow, discount rates
false
Financial Performance
Financial Services
Multiple Chart
Deloitte
Add to my slides
Remove from favorites
Column charts show the proportion of clients serviced with multiple non-lending products, emphasizing strategic client relationship management.
Risk Assessment and Management
Financial Services
Focuses on how leveraging Debt Capital Market (DCM) capabilities can enhance returns through better client product integration and risk management.
DCM, client management, returns, products, risk management
false
Risk Assessment and Management
Financial Services
Mixed Chart
Barclays
Add to my slides
Remove from favorites
Column chart similar to the previous but specific to the DC Metro area, showing population counts and growth rates across different age segments, highlighted in green shades for clarity.
Market Analysis and Trends
Transportation & Logistics
Focuses on demographic shifts within the DC Metro area, particularly the growth of older populations mixed with a stable youth segment. Useful for local government and service planning.
DC Metro, demographics, aging, population growth, local planning
false
Market Analysis and Trends
Transportation & Logistics
Single Chart
BCG
Add to my slides
Remove from favorites
The slide contains a column chart comparing the length of technology use (2 years or less vs. 3+ years) for different technologies including DCRs, identity solutions, CMPs, etc.
Technology and Digital Transformation
Technology & Software
This slide shows the acceleration of DCR adoption in the past two years compared to other technologies, highlighting the increase in usage over a shorter period.
DCR adoption, technology, acceleration, privacy
false
Technology and Digital Transformation
Technology & Software
Mixed Chart
IPSOS
Add to my slides
Remove from favorites
Column chart on the right showing DCR challenges in percentages, with two quotes on the left from a VP, Publisher, and Product Lead, Brand.
Risk Assessment and Management
Professional Services
Highlights various challenges faced by DCR users such as leveraging results, data interoperability, and internal resource challenges, displayed in a column chart.
DCR challenges, leveraging results, data interoperability, internal resources, privacy
false
Risk Assessment and Management
Professional Services
Mixed Chart
IPSOS
Add to my slides
Remove from favorites
The slide features a column chart displaying the 2022 DCR spend categories, ranging from <$200K to $750K+, with a quote discussing the high licensing costs and barriers to entry.
Technology and Digital Transformation
Technology & Software
The slide discusses the high costs associated with adopting data clean rooms (DCRs), highlighting the financial barriers for smaller companies and the significant investments required.
DCR costs, barrier to entry, financial, privacy
false
Technology and Digital Transformation
Technology & Software
Mixed Chart
IPSOS
Add to my slides
Remove from favorites
The slide presents a column chart comparing average 2022 costs by technology, including CDPs, identity solutions, DMPs, CMPs, and DCRs, with costs ranging from $376K to $437K.
Technology and Digital Transformation
Technology & Software
The slide outlines the compounded costs of using data clean rooms (DCRs) alongside other privacy-preserving technologies, showing the potential for annual costs to exceed $2 million.
DCR costs, privacy technologies, annual costs, financial
false
Technology and Digital Transformation
Technology & Software
Mixed Chart
IPSOS
Add to my slides
Remove from favorites
The slide presents a column chart showing the number of employees involved in using/building DCRs, with categories ranging from none to 11+ employees, along with a quote from a C-suite executive.
Technology and Digital Transformation
Technology & Software
The slide emphasizes the need for significant human talent to manage and operate data clean rooms (DCRs), highlighting the various roles and expertise required for effective implementation.
DCR investment, human talent, privacy, data engineers
false
Technology and Digital Transformation
Technology & Software
Mixed Chart
IPSOS
Add to my slides
Remove from favorites
The slide presents a column chart showing DCR use by company type (total, agencies, brands, publishers). Each bar is divided into segments indicating usage status.
Technology and Digital Transformation
Technology & Software
The slide illustrates the adoption of data clean rooms (DCRs) among different types of companies, showing the percentage currently using, considering, or not considering DCRs.
DCRs, data clean rooms, adoption, companies, privacy
false
Technology and Digital Transformation
Technology & Software
Single Chart
IPSOS
Add to my slides
Remove from favorites
The slide presents a bar chart listing key criteria for selecting third-party DCRs, such as confidentiality, privacy by design, availability of enrichment partners, etc.
Technology and Digital Transformation
Technology & Software
The slide identifies the primary reasons why users select data clean rooms (DCRs), focusing on privacy protection, data control, and interoperability as critical factors.
DCR selection, privacy, data control, interoperability
false
Technology and Digital Transformation
Technology & Software
Mixed Chart
IPSOS
Add to my slides
Remove from favorites
The slide includes a bar chart showing various use cases for DCRs like data anonymization, privacy compliance, data cleaning, and transformation, with percentages for each.
Technology and Digital Transformation
Technology & Software
The slide explains the main use cases for data clean rooms (DCRs) among current users, emphasizing their role in addressing privacy concerns and audience activation.
DCR use cases, privacy, data anonymization, compliance
false
Technology and Digital Transformation
Technology & Software
Single Chart
IPSOS
Add to my slides
Remove from favorites
The slide features a bar chart highlighting the underutilization of advanced measurement use cases like attribution, ROI/ROAS, media mix modeling, and predictive analysis among DCR users.
Technology and Digital Transformation
Technology & Software
The slide points out that a significant portion of DCR users are not leveraging advanced measurement capabilities, presenting it as a missed opportunity for greater utilization.
DCR users, advanced measurement, attribution, privacy
false
Technology and Digital Transformation
Technology & Software
Mixed Chart
IPSOS
Add to my slides
Remove from favorites
Moderate complexity featuring a column chart detailing deal value in US dollars over time, segmented by unicorn and other investments, accompanied by a text block explaining the chart.
Market Analysis and Trends
Financial Services
Analyzes the growth of deal activity within a region, with specific emphasis on the tech investment landscape and the trend of unicorn and non-unicorn investments.
Deal activity, investment, unicorn, tech landscape
false
Market Analysis and Trends
Financial Services
Mixed Chart
Bain
Add to my slides
Remove from favorites
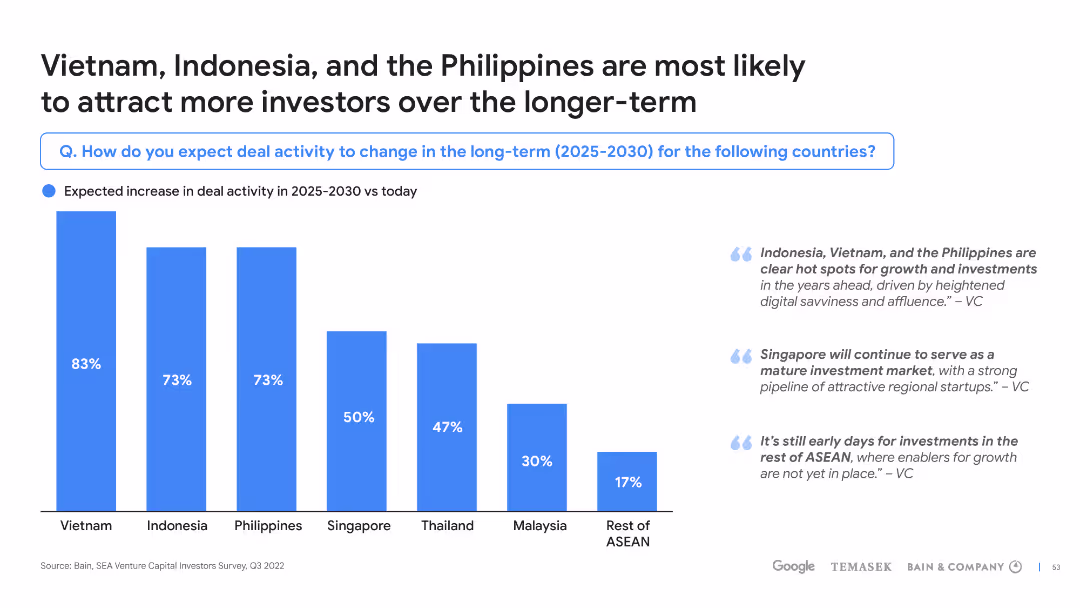
Column chart with future projections and quotes from VCs, along with a title and explanatory text on the side.
Investment Analysis
Financial Services
Predicts an increase in deal activity in Vietnam, Indonesia, and the Philippines by 2025-2030, citing VC insights on market growth.
deal activity, long-term investment, Vietnam, Indonesia, Philippines, growth, VC insights, 2025-2030
false
Investment Analysis
Financial Services
Mixed Chart
Bain
Add to my slides
Remove from favorites
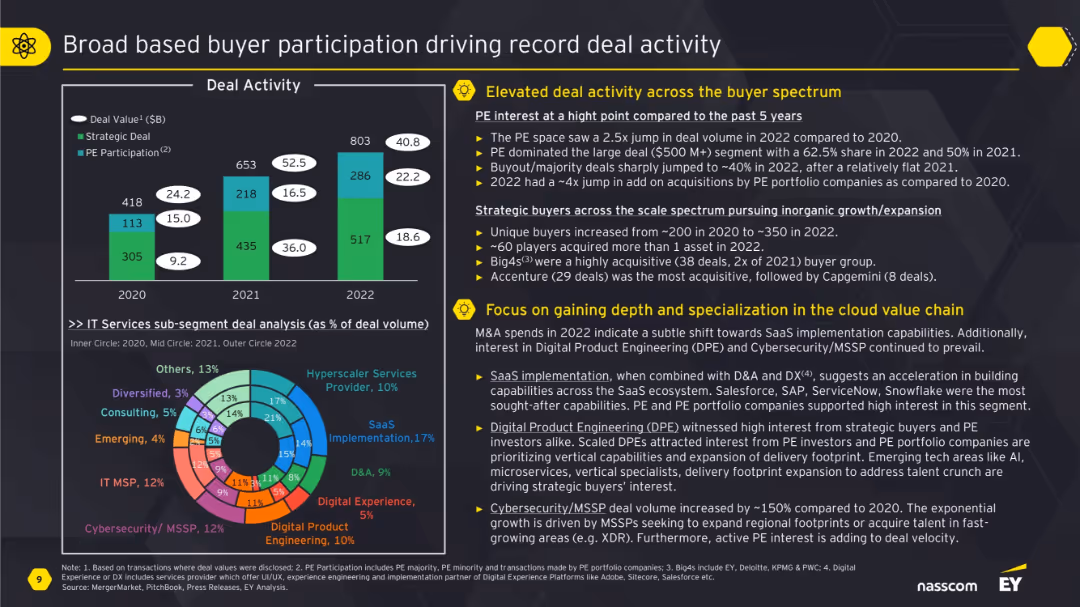
Includes a bar graph, circular sub-segment chart, and bullet-point commentary. Emphasizes data and themes with yellow callout icons on a dark grey background.
Mergers and Acquisitions
Technology & Software
This slide analyzes deal activity by buyer type, showing strong growth in both strategic and private equity investment across IT services. It highlights increased interest in SaaS, digital product engineering, and cybersecurity. The pie chart reveals sub-segment shares within IT services, while bullet points emphasize rising buyer diversity and specialization in cloud-related domains.
deal activity, private equity, SaaS, cloud, cybersecurity, M&A, buyers
false
Mergers and Acquisitions
Technology & Software
Multiple Chart
EY
Add to my slides
Remove from favorites
A straightforward presentation of column charts depicting deal count and private funding value over several years. Each chart uses a different shade of blue to distinguish between years, with dotted lines indicating changes in the deal value. The layout is clear, with titles and figures that are easily readable.
Market Analysis and Trends
Financial Services
The slide provides an overview of deal activity and its growth rate, juxtaposed with a reduction in deal value, potentially for analysis in investment strategy meetings or financial market overviews. It serves as a basis for discussion on investor behavior and market confidence.
deal activity, private funding, growth rate, market analysis, investment strategy, financial trends
false
Market Analysis and Trends
Financial Services
Single Chart
Bain
Add to my slides
Remove from favorites
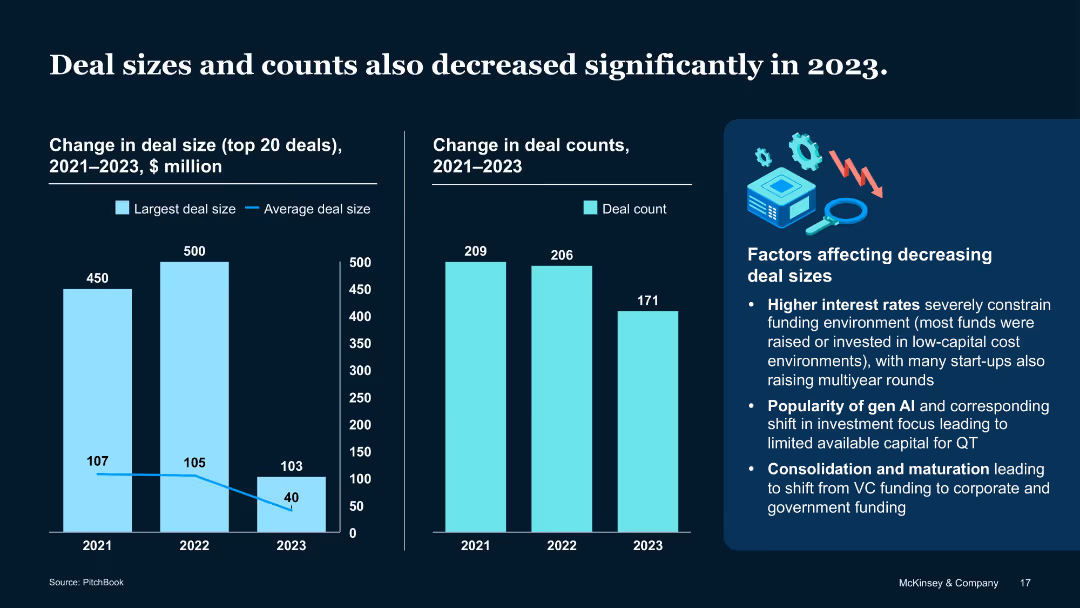
Dual column charts and text box on influencing factors
Performance Metrics and KPIs
Artificial Intelligence
Examines shrinking average deal size ($40M in 2023) and falling deal count (171). Cites high interest rates, AI investment popularity, and funding consolidation as major drivers.
Deal count, VC environment, QT investment, capital size, 2023 trends
false
Performance Metrics and KPIs
Artificial Intelligence
Multiple Chart
McKinsey
Add to my slides
Remove from favorites
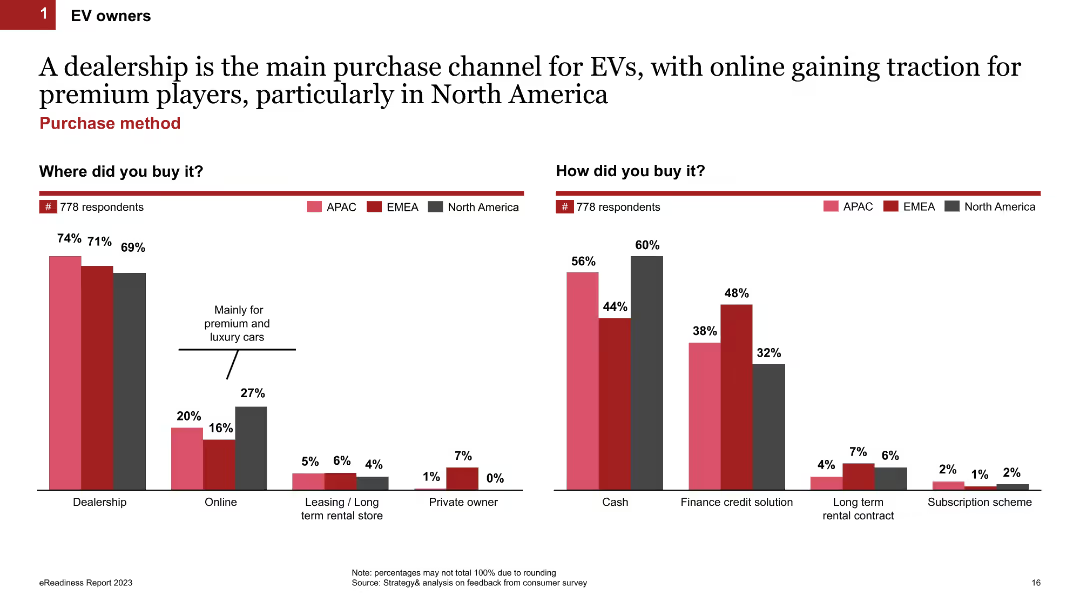
Two column charts showing the preferred purchase channels (dealership, online, leasing, etc.) and payment methods (cash, finance, subscription) for EV buyers.
Market Analysis and Trends
Transportation & Logistics
Analyzes the primary channels and methods used by EV owners to purchase their vehicles, with dealerships being the predominant choice.
dealership, purchase channels, payment methods, EV buyers, survey
false
Market Analysis and Trends
Transportation & Logistics
Multiple Chart
PwC/Strategy&
Add to my slides
Remove from favorites
This slide features a large number 1, a bar graph with yearly deal flow data, two column charts comparing deals by country and funding by sector, and bullet points with key insights.
Market Analysis and Trends
Technology & Software
The slide presents the growth in deal flow, emphasizing its concentration in Singapore (SG) and Indonesia (ID). It details the number of deals and funding allocation by sector, with the majority going to eCommerce and logistics, illustrating market dynamics and investment focus in these regions from 2010 to 2015.
deal flow, concentration, Singapore, Indonesia, startups, investment, eCommerce, logistics
false
Market Analysis and Trends
Technology & Software
Multiple Chart
Bain
Add to my slides
Remove from favorites
The slide contains a table and text analyzing the decline in deal numbers across technology subsectors, emphasizing macroeconomic forces as the driving factor.
Investment Analysis
Technology & Software
Offering a detailed view of the venture investing market in technology, this slide highlights the widespread decline in deal numbers since 2015 across a majority of subsectors. It explores the alignment of subsector trends with the broader market forces and the implications of these patterns for understanding market dynamics and investor behavior.
deal numbers, subsectors, macro forces, technology investing, market trends
false
Investment Analysis
Technology & Software
Table
Oliver Wyman
Add to my slides
Remove from favorites
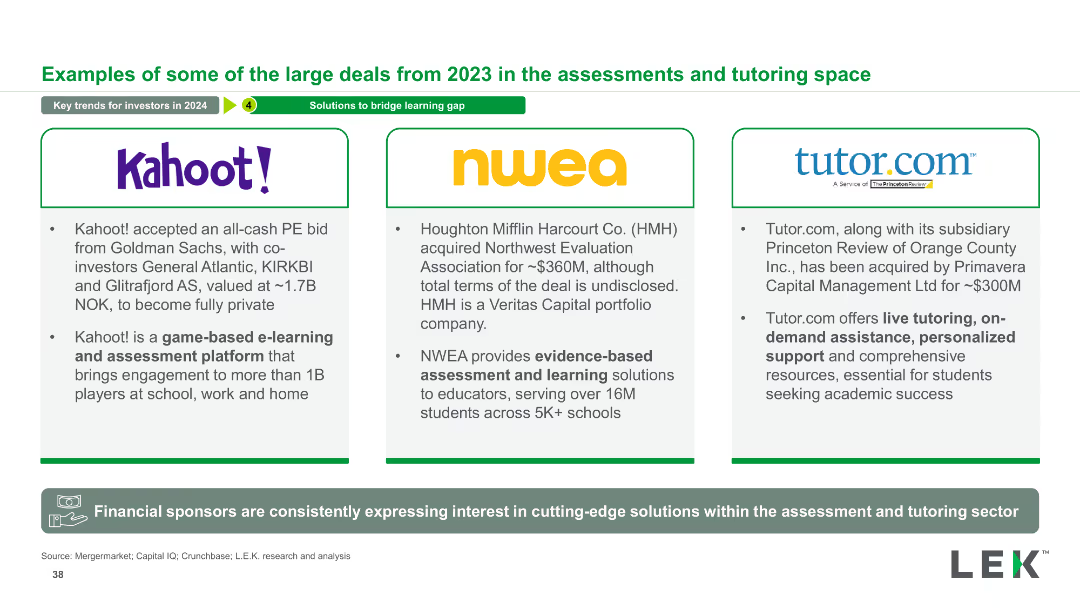
The slide features three sections, each highlighting a major deal in the assessments and tutoring space, with details about the companies involved and the nature of the deals.
Mergers and Acquisitions
Education & Training
This slide presents examples of significant deals in the assessments and tutoring sector, showcasing investments and acquisitions in this market.
Deals, Assessments, Tutoring, Mergers, Acquisitions, Investments, Education, Companies, Market, Sector
false
Mergers and Acquisitions
Education & Training
Pillar
LEK
Add to my slides
Remove from favorites
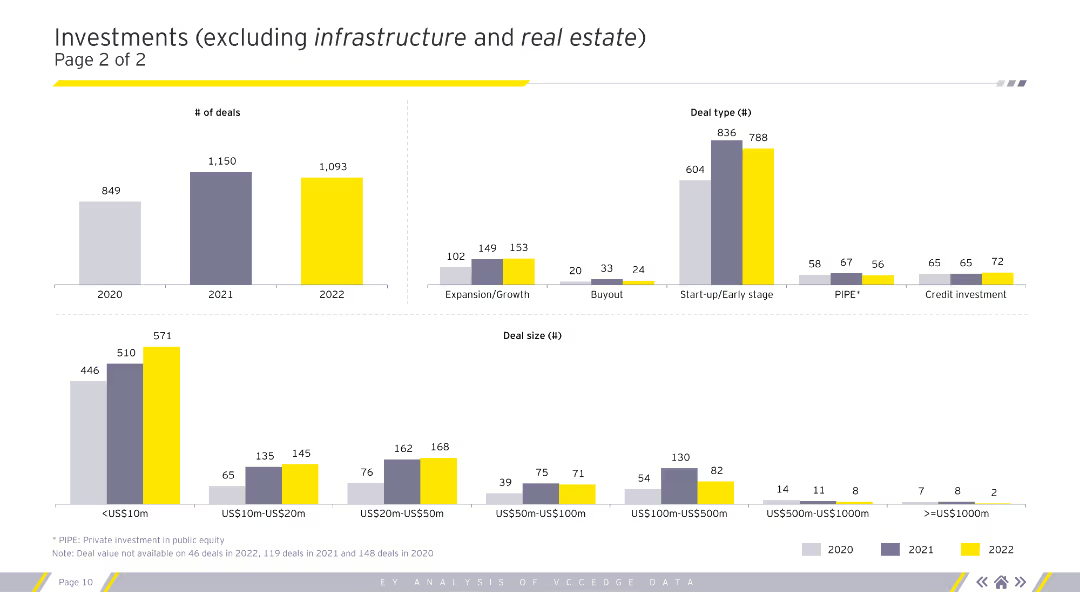
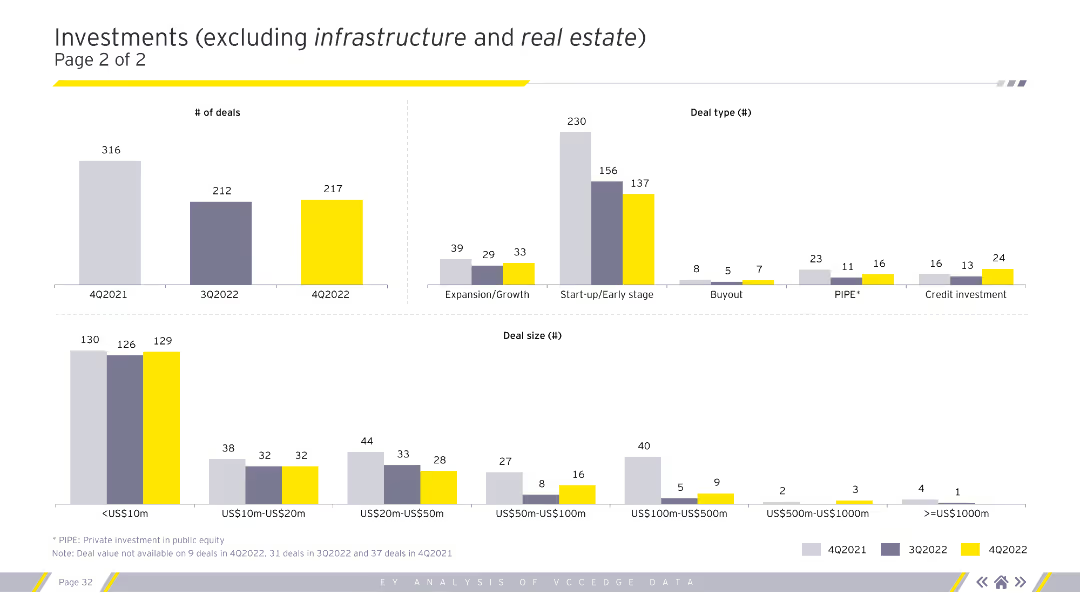
Column charts showing the number of deals, deal types, and deal sizes in various segments excluding infrastructure and real estate for 2020-2022.
Market Analysis and Trends
Financial Services
Continued analysis of investment types, sizes, and segments, excluding infrastructure and real estate.
deals, deal types, deal sizes, trends, analysis
false
Market Analysis and Trends
Financial Services
Multiple Chart
EY
Add to my slides
Remove from favorites
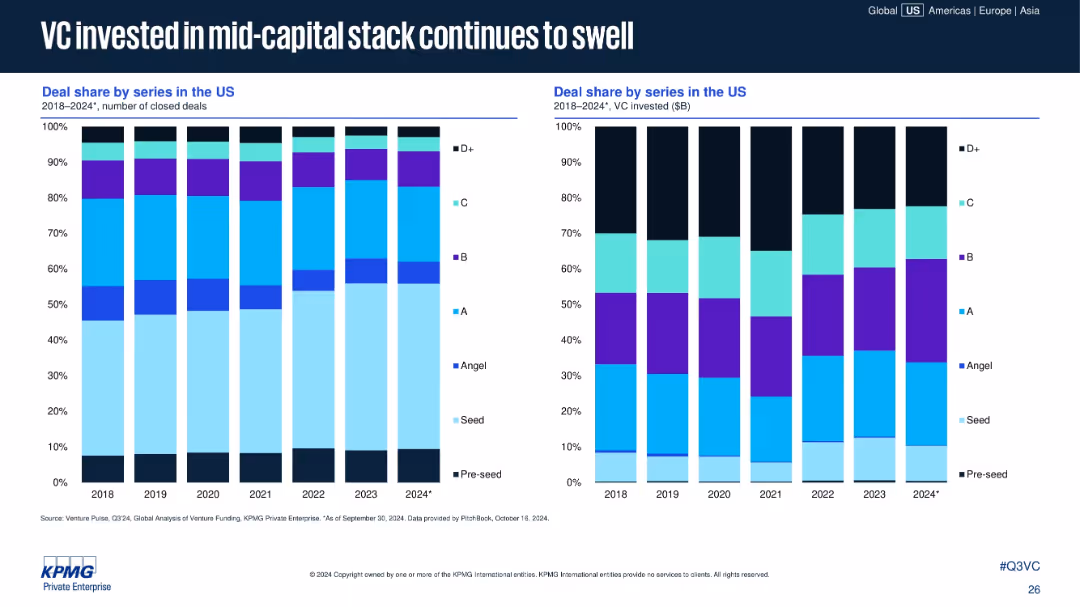
Two stacked bar charts: left shows number of deals by series; right shows VC invested ($B). Color-coded by funding stage.
Strategic Planning
Financial Services
The slide shows a shift in VC deal distribution, with Series B and C stages seeing increased deal share and capital investment. Early-stage deals are declining in share, highlighting a shift toward mid-capital stack funding.
deal share, Series B, Series C, VC investment, funding stage, mid-cap stack, capital allocation, startup funding
false
Strategic Planning
Financial Services
Multiple Chart
KPMG
Add to my slides
Remove from favorites
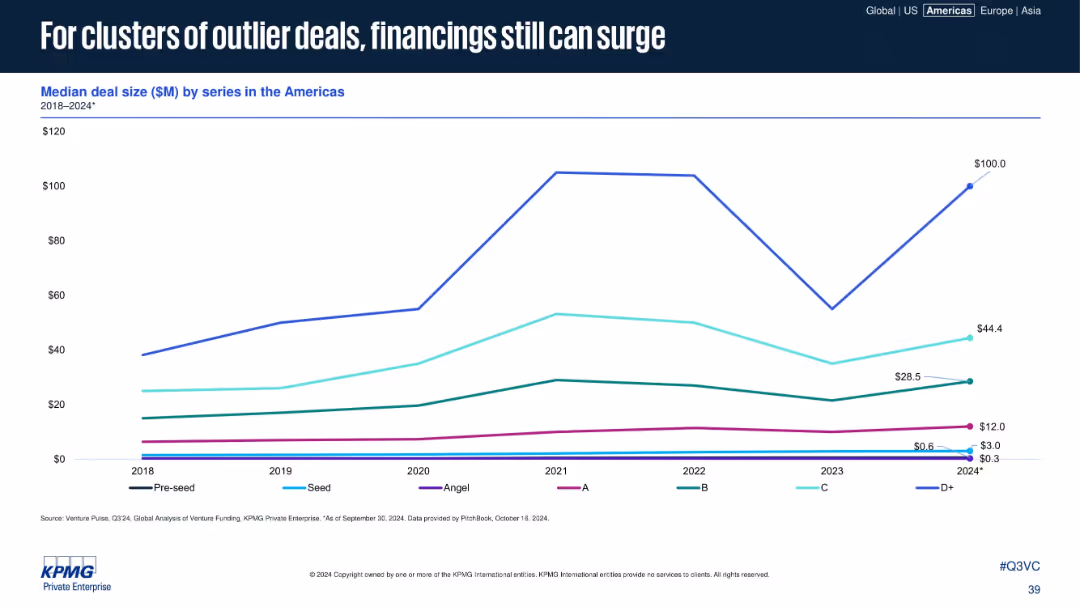
Line graph showing median deal size by series, with sharp peaks in D+ rounds.
Market Analysis and Trends
Financial Services
This visualization of deal size by funding series highlights volatility, particularly for late-stage (D+) deals. While early stages remain flat, occasional spikes in later rounds suggest that large outlier financings continue to influence the market.
deal size, D+ rounds, outliers, VC series, funding trends, volatility, late stage, median size, Americas
false
Market Analysis and Trends
Financial Services
Single Chart
KPMG
Add to my slides
Remove from favorites
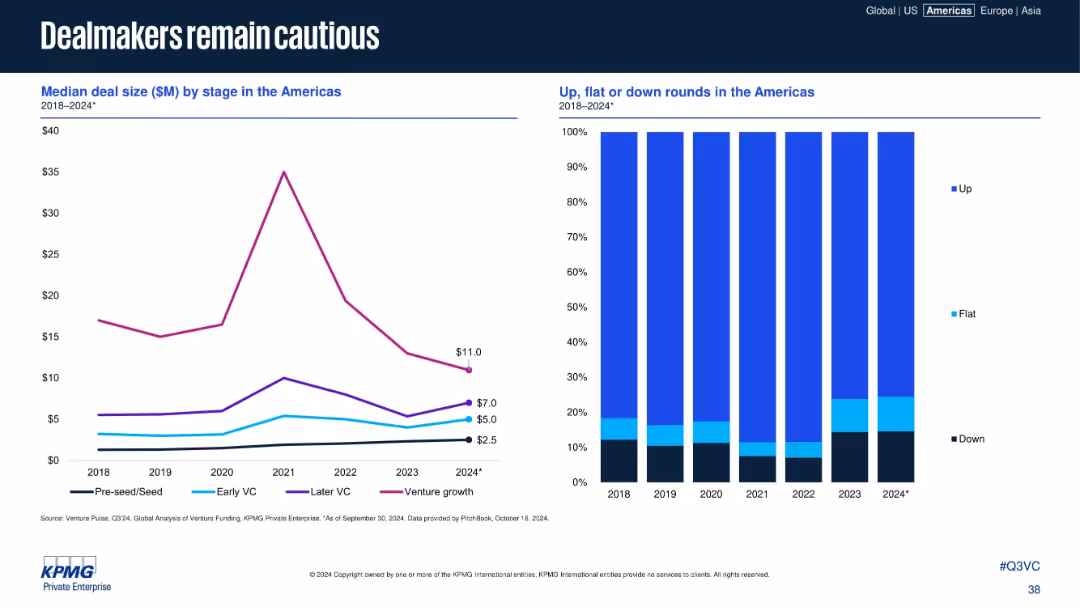
Dual-panel chart; left shows median deal size by stage; right shows deal outcome distribution (up/down).
Risk Assessment and Management
Financial Services
The slide shows a decline in median deal sizes across VC stages in the Americas from 2018–2024, with a concurrent increase in flat and down rounds. This reflects ongoing investor caution and reduced valuations amid persistent macroeconomic uncertainty.
deal size, VC stages, risk, down rounds, investor sentiment, flat rounds, caution, Americas, funding trends
false
Risk Assessment and Management
Financial Services
Multiple Chart
KPMG
Add to my slides
Remove from favorites
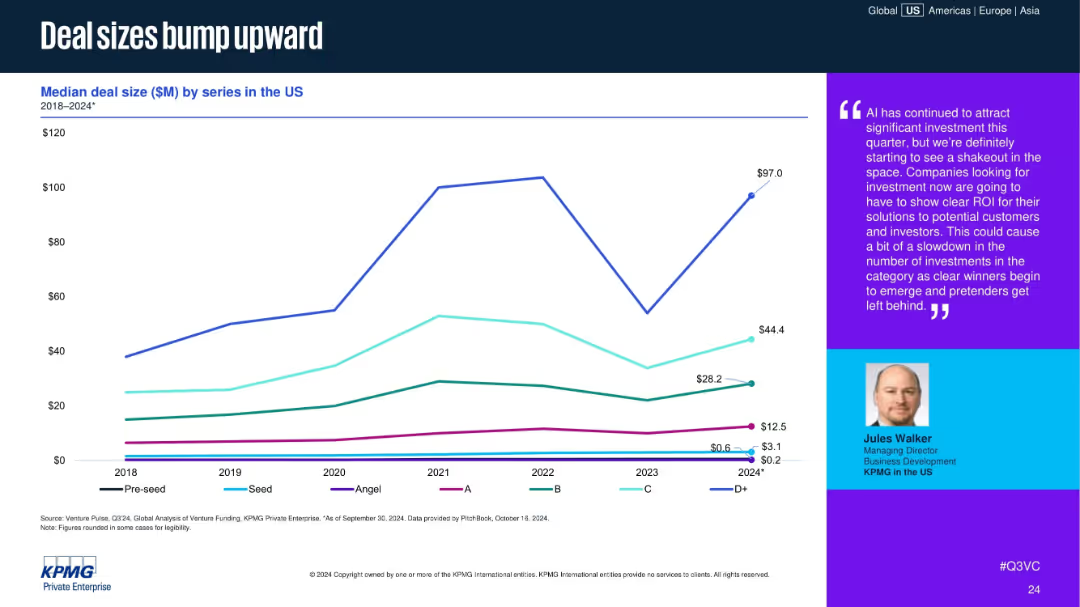
Line graph on the left displays median deal size by series; a purple text box on the right contains commentary and an executive photo.
Market Analysis and Trends
Financial Services
Median deal sizes by series (Pre-seed to D+) in the U.S. have mostly risen in 2024 after a dip in 2023. Commentary emphasizes AI's role in attracting investments but also notes market consolidation and the need for ROI clarity.
deal size, venture capital, AI investment, funding series, US VC, startup ROI, 2024 trends, investor behavior
false
Market Analysis and Trends
Financial Services
Mixed Chart
KPMG
Add to my slides
Remove from favorites
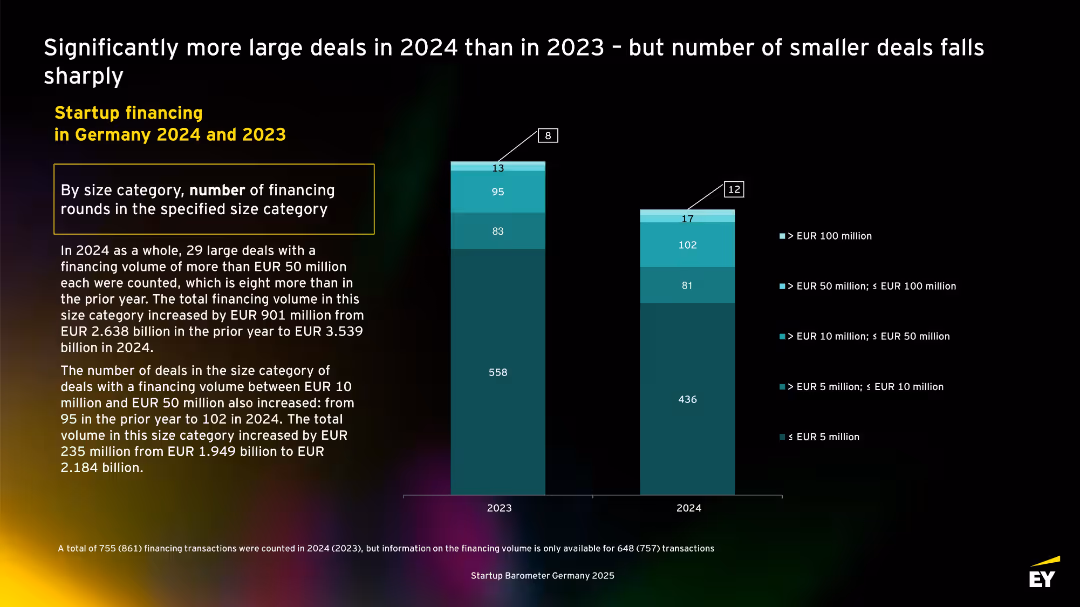
Stacked vertical bar chart showing deal count by funding size categories for 2023 vs. 2024. Labels indicate volume distribution. Accompanied by detailed paragraph analysis.
Financial Performance
Technology & Software
Shows distribution of financing rounds by deal size. Large deals (€50M+) increased in 2024, while smaller deal counts declined. The overall volume of large deals rose significantly, with €901M more raised in the >€50M category compared to 2023.
deal size, volume, large deals, funding rounds, 2024, venture capital, Germany, startup financing
false
Financial Performance
Technology & Software
Mixed Chart
EY
Add to my slides
Remove from favorites
The slide presents bar graphs with deal values and numbers, using shades of blue for differentiation and clarity in data presentation.
Investment Analysis
Financial Services
The slide compares the deal values and number of deals in Thailand, suggesting a trend towards another record year in 2021.
Deals, Thailand, 2021, Record, Values, Investments, Analysis, Financial
false
Investment Analysis
Financial Services
Single Chart
Bain
Add to my slides
Remove from favorites
Bar graphs display the deal value over years, with a focus on 2021. Simple color coding, well-spaced elements, and clear labelling.
Investment Analysis
Financial Services
Displays Singapore's deal values from 2017 to 2021 with a focus on H1 of each year, predicting a year comparable to 2018 in terms of activity.
Deals, Value, Singapore, 2018, 2021, Investments, Trends, Forecast, Financial
false
Investment Analysis
Financial Services
Single Chart
Bain
Add to my slides
Remove from favorites
The slide includes column charts depicting the number of deals, deal types, and deal sizes for different quarters. Different colors represent distinct quarters, enhancing comparative analysis.
Market Analysis and Trends
Financial Services
This slide continues the analysis of investments excluding infrastructure and real estate, emphasizing the number of deals and their distribution across deal types and sizes.
Deal types, number of deals, deal sizes, investments
false
Market Analysis and Trends
Financial Services
Multiple Chart
EY
Add to my slides
Remove from favorites
The layout of this slide is clear, featuring column charts to represent deal values across several years. The design employs shades of blue with clean text to convey the data, ensuring readability and focus.
Investment Analysis
Financial Services
The slide illustrates increasing deal values in the digital financial services and e-commerce sectors, providing a perspective on investment trends. It's a useful tool for identifying where investors are directing their funds and for assessing the vibrancy of the private funding landscape in these sectors.
deal value, DFS, e-commerce, investment trends, Series-C investments
false
Investment Analysis
Financial Services
Single Chart
Bain
Add to my slides
Remove from favorites
A simple design with a blue-toned bar chart depicting deal values over recent years. Annotations provide additional context to the data shown.
Investment Analysis
Financial Services
Presents data on the deal values in the Philippines, with a specific focus on the significant increase in H1 2021, offering insights into the investment climate.
Deal value, Investment climate, Yearly comparison, Market insight
false
Investment Analysis
Financial Services
Single Chart
Bain
Add to my slides
Remove from favorites
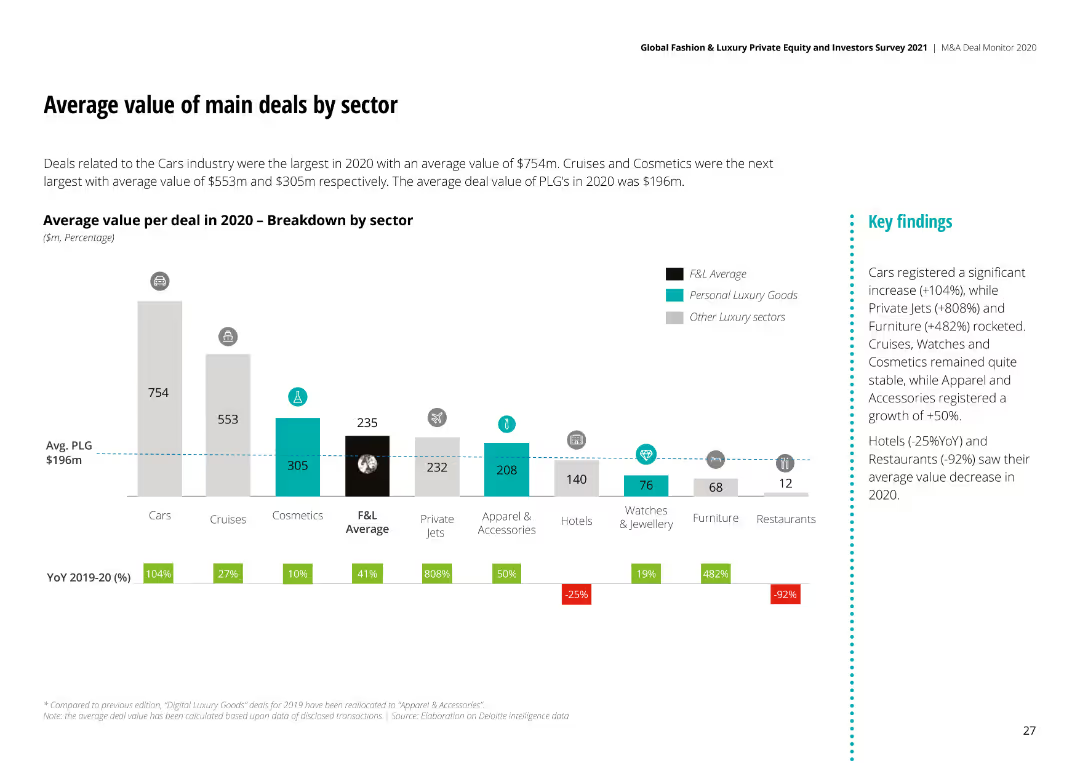
The slide features a bar chart with the average value per deal in 2020 for different sectors, including Cars, Cruises, and Cosmetics.
Market Analysis and Trends
Consumer Goods
It presents the average deal values across various sectors, noting significant increases and decreases in value.
Deal Value, Sector, 2020, Cars, Cruises, Cosmetics
false
Market Analysis and Trends
Consumer Goods
Mixed Chart
Deloitte
Add to my slides
Remove from favorites
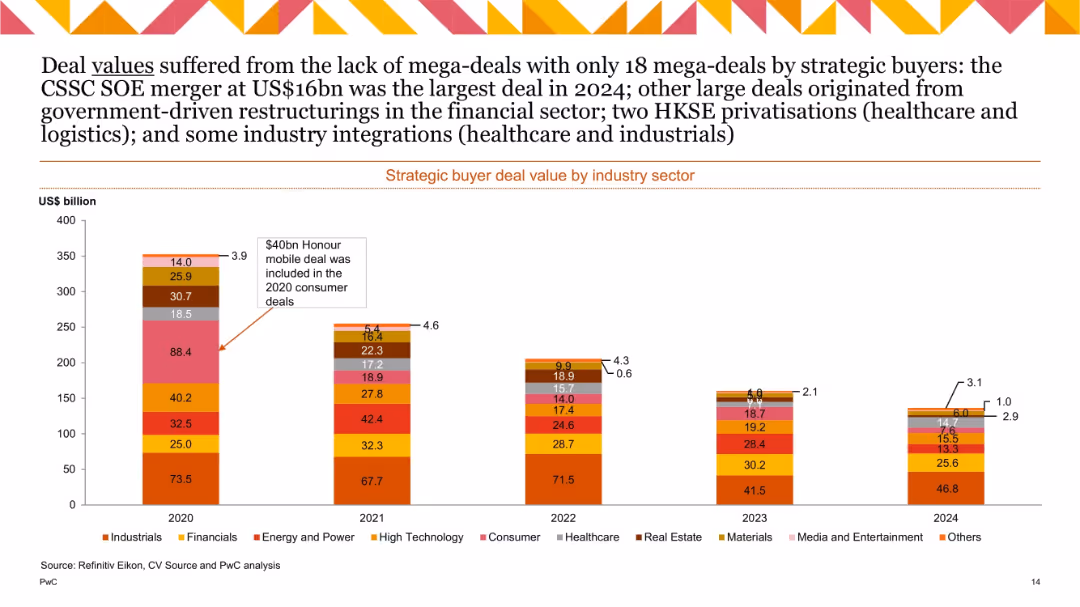
Stacked vertical bars representing deal values in US$ billion by sector from 2020–2024; fewer high-value deals in recent years; emphasis on top deals.
Investment Analysis
Financial Services
Illustrates M&A deal value per industry. The absence of mega-deals brought total values down in 2024. The largest was a $16bn CSSC SOE merger. Notable restructuring seen in financials, and key privatizations occurred in healthcare/logistics.
deal value, sectors, mega-deals, SOEs, privatizations, 2024
false
Investment Analysis
Financial Services
Single Chart
PwC/Strategy&
Add to my slides
Remove from favorites
A multi-stacked column chart displays deal values across sectors from 2017 to H1 2021. It’s a complex visual with varied colors for each sector, requiring more focus to interpret the layered information.
Market Analysis and Trends
Financial Services
Provides a detailed breakdown of deal values within sectors such as e-commerce, transport & food, and digital financial services over multiple years, pinpointing the sustained focus and prominence of e-commerce and financial services deals.
Deal Values, Sectors, E-commerce, Financial Services
false
Market Analysis and Trends
Financial Services
Single Chart
Bain
Add to my slides
Remove from favorites
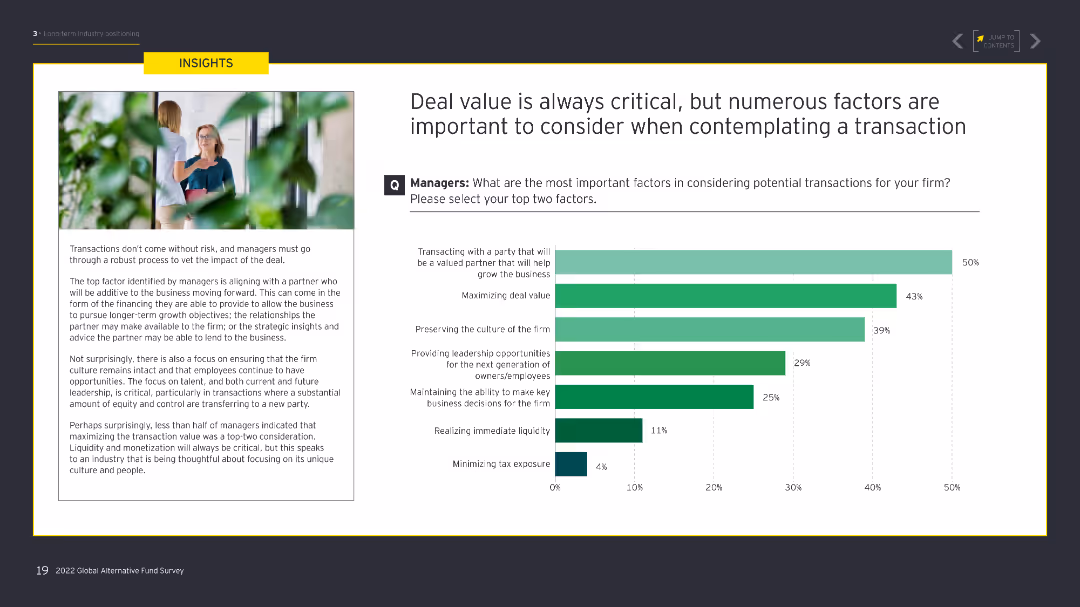
The slide contains a text box on the left about transaction factors, with a column chart on the right illustrating the most important factors for managers when considering potential transactions.
Mergers and Acquisitions
Financial Services
This slide examines the key factors managers consider when evaluating potential transactions, emphasizing the importance of deal value and other critical elements.
deal value, transactions, managers, factors, evaluation
false
Mergers and Acquisitions
Financial Services
Mixed Chart
EY
Add to my slides
Remove from favorites
Bar and line graph hybrid illustrating the number of deals and deal value from 2017 to H1 2021. The design includes different shades of blue for distinction, with a clear indication of the upward trend and investment sources noted below.
Investment Analysis
Financial Services
Showcasing the explosive growth in deal value in Vietnam for 2021, the slide credits foreign and domestic investment, alongside government incentives, as key drivers for this increase.
Deal Value, Vietnam, Investment, Foreign, Domestic, Government, Incentives, Growth
false
Investment Analysis
Financial Services
Single Chart
Bain
Add to my slides
Remove from favorites
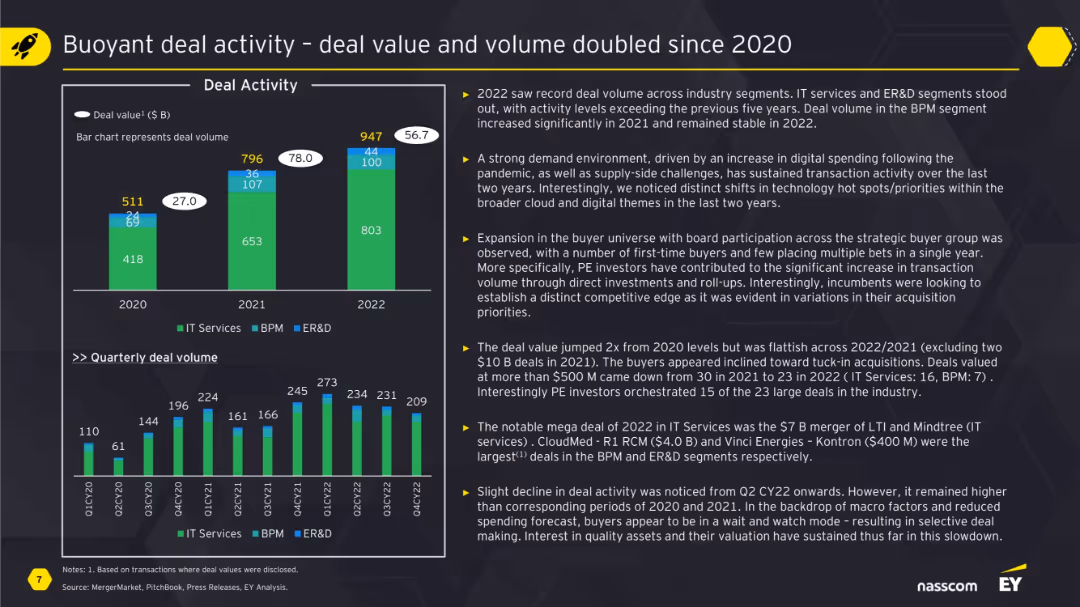
Left-aligned bar and line graphs with numerical labels; right-aligned bullet point insights in yellow on a black background.
Mergers and Acquisitions
Technology & Software
The slide presents data showing a significant increase in deal volume and value in IT Services, BPM, and ER&D sectors since 2020. It attributes this to increased digital demand and a strong investment environment. The bullet points provide insights into notable transactions, trends among private equity investors, and macroeconomic observations across multiple segments.
deal volume, M&A, IT services, BPM, ER&D, private equity, transactions
false
Mergers and Acquisitions
Technology & Software
Multiple Chart
EY
Add to my slides
Remove from favorites
Structured with bullet points, the slide presents debated topics regarding the implementation of connectivity.
Market Analysis and Trends
Telecommunications
The slide prompts discussions on the current debates surrounding advanced connectivity technologies.
Debate, Connectivity, 5G, LEO, LPWA, Technology Implementation
false
Market Analysis and Trends
Telecommunications
Header Vertical
McKinsey
Add to my slides
Remove from favorites
Bullet points addressing key debates about immersive tech, with a background graphic symbolizing connectivity.
Strategic Planning
Technology & Software
Discusses key debate points surrounding immersive reality in the workplace, including scalability, integration with enterprise architecture, and virtual crimes.
Debates, immersive reality, workplace, scalability, integration, virtual crimes
false
Strategic Planning
Technology & Software
Header Vertical
McKinsey
Add to my slides
Remove from favorites
Featuring a digital avatar, the slide presents a question-answer format with a focus on debate topics. The dark background emphasizes the text and the avatar, guiding the viewer's attention directly to the content. The layout facilitates an easy-to-follow structure, highlighting key discussion points.
Strategic Planning
Technology & Software
Aimed at sparking conversation, this slide presents debate questions surrounding the adoption and implications of next-generation software development. It encourages critical thinking about the cultural, legal, and operational challenges of integrating these new technologies in various settings.
Debate, Software Development, Automation, Intellectual Property, Culture, Responsibility
false
Strategic Planning
Technology & Software
Text Only
McKinsey
Add to my slides
Remove from favorites
The slide includes pie charts and textual highlights, showing the composition of the debt portfolio and the proportions of secured vs. unsecured loans.
Investment Analysis
Financial Services
Analyzes the debt balance sheet for asset management, focusing on the diversification of debt investments by type and geography. It is helpful for investment strategy discussions and risk assessments related to debt portfolios.
Debt Balance Sheet, Asset Management, Loan Types, Secured Debt, Unsecured Debt, TMT, Healthcare, Financials, Real Estate, Geographical Distribution
false
Investment Analysis
Financial Services
Multiple Chart
Goldman Sachs
Add to my slides
Remove from favorites
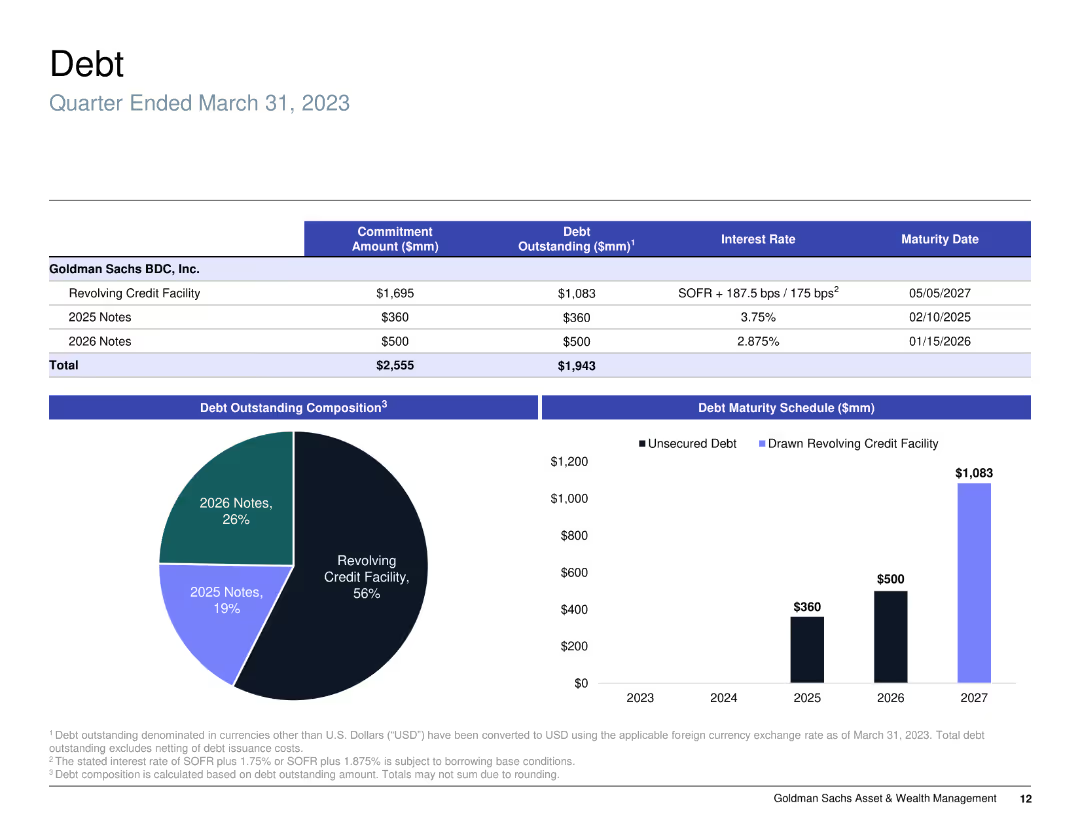
Pie chart and bar chart showing debt composition and debt maturity schedule, including interest rates and amounts.
Risk Assessment and Management
Financial Services
Reviews the debt composition and maturity schedule of Goldman Sachs BDC, Inc., highlighting the types of debt and maturity timelines.
debt, composition, maturity, interest rates
false
Risk Assessment and Management
Financial Services
Multiple Chart
Goldman Sachs
Add to my slides
Remove from favorites
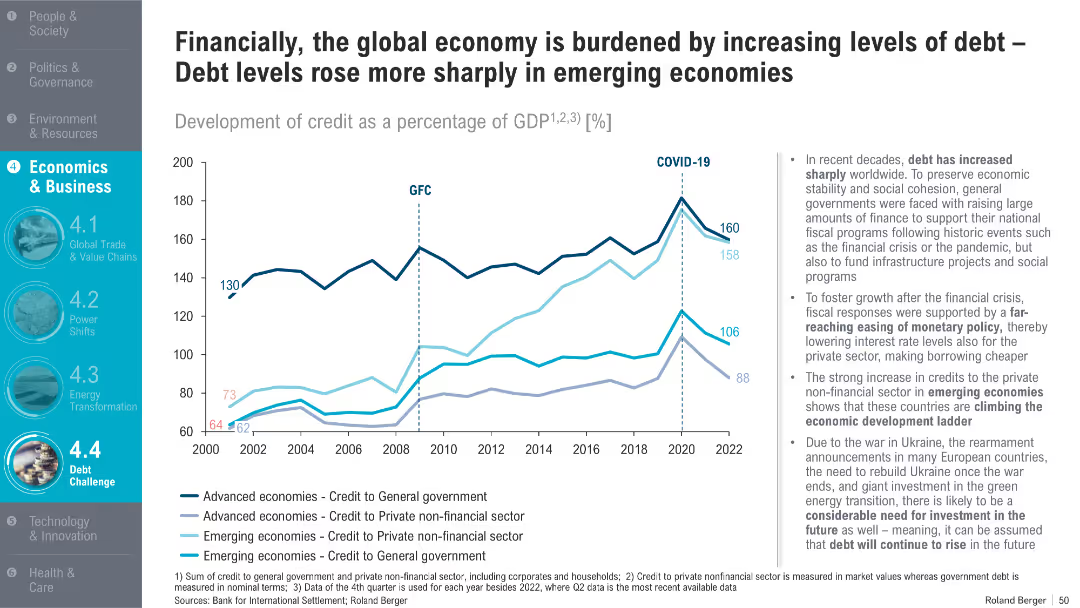
Line chart tracking credit to governments and private sectors as % of GDP from 2000–2022; GFC and COVID-19 marked; right panel includes context and insights
Financial Performance
Financial Services
The chart illustrates the rapid rise of debt, especially in emerging economies post-GFC and COVID-19. It discusses the effects of monetary easing, infrastructure needs, and war-related expenditures, highlighting future financial vulnerabilities.
debt, credit, GDP, emerging markets, COVID-19, financial crisis, fiscal response, infrastructure, monetary policy
false
Financial Performance
Financial Services
Mixed Chart
Roland Berger
Add to my slides
Remove from favorites
Slide includes multiple column charts showing trends in net debt to EBITDA and fixed charge coverage ratios over several quarters. Colors differentiate consolidated from net recourse debt.
Financial Performance
Financial Services
Analyzes credit metrics, focusing on net debt to EBITDA ratios and fixed charge coverage to assess financial health and risk in financial services. Shows trends and financial strategies over time.
debt, financial health, EBITDA, risk assessment, credit metrics, financial services
false
Financial Performance
Financial Services
Multiple Chart
Barclays
Add to my slides
Remove from favorites
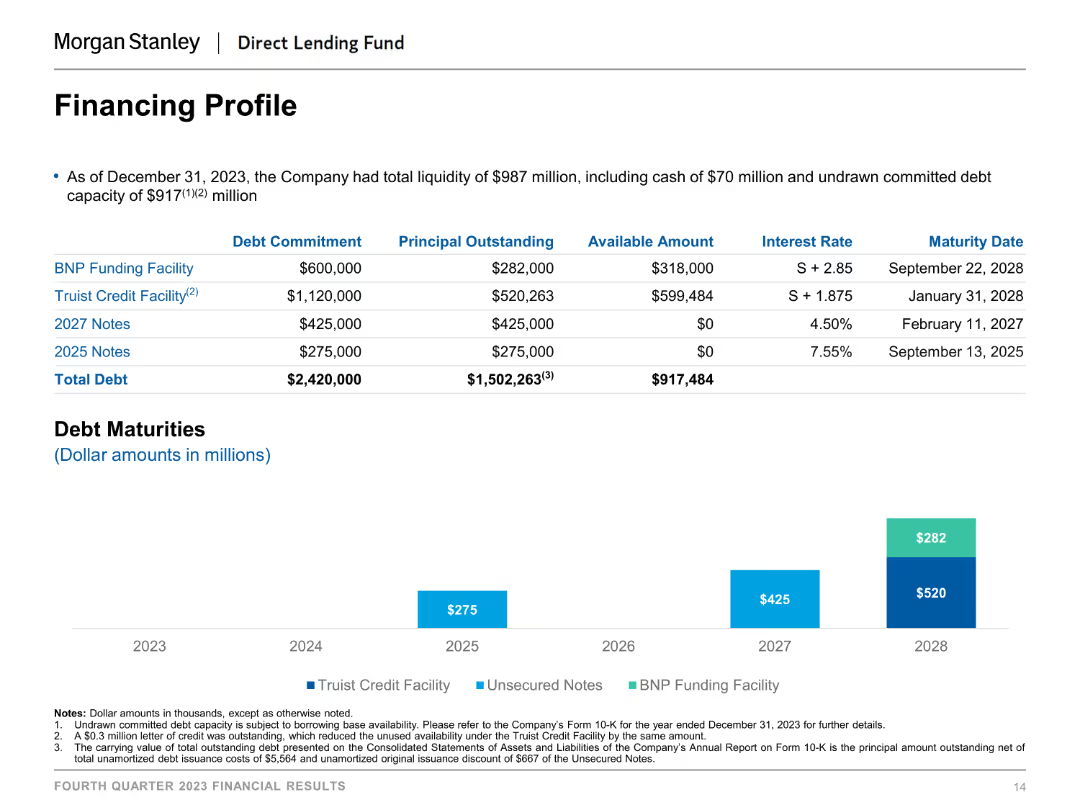
A table detailing debt commitments, principal outstanding, available amounts, interest rates, and maturity dates.
Financial Performance
Financial Services
This slide provides an overview of the company’s financing profile as of December 31, 2023, showing various funding facilities, notes, and debt maturities.
Debt, Financing, Interest Rates, Maturity Dates, Liquidity
false
Financial Performance
Financial Services
Mixed Chart
Morgan Stanley
Add to my slides
Remove from favorites
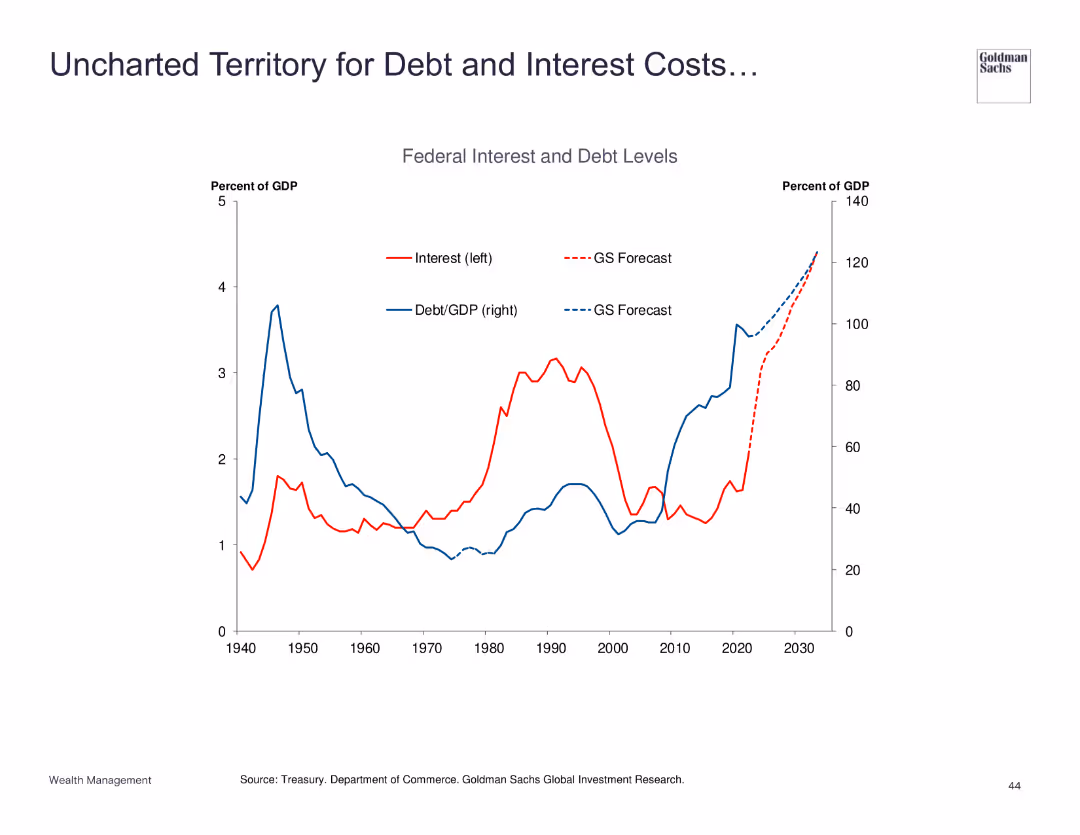
Line chart showing federal interest and debt levels as a percentage of GDP.
Risk Assessment and Management
Financial Services
Examines the rising federal interest and debt levels, forecasting significant future costs and implications for economic policy.
debt, interest, GDP, forecast, risk
false
Risk Assessment and Management
Financial Services
Single Chart
Goldman Sachs
Add to my slides
Remove from favorites
The slide shows a column chart with different colors representing various types of financial instruments and their maturities spread over the coming years. A legend on the right details the amounts and maturity years. The Michelin logo is at the bottom left.
Financial Performance
Financial Services
Displaying a company's debt profile, this slide helps in assessing financial health and planning for debt management. It visually represents the maturity of different debt instruments over time, which is essential for investors, stakeholders, and financial managers within the financial services industry.
debt maturities, financial planning, bar chart
false
Financial Performance
Financial Services
Single Chart
Morgan Stanley
Add to my slides
Remove from favorites
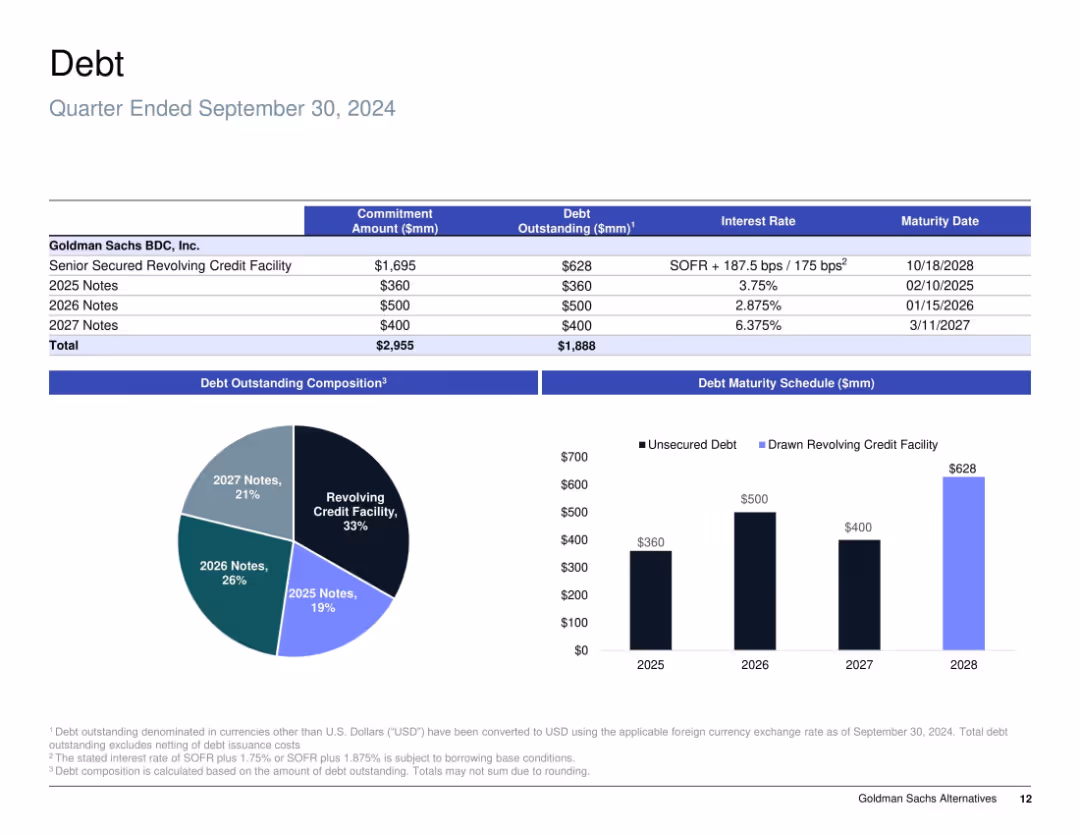
Combination of a data table, bar chart, and pie chart; blue-themed, clean, and data-dense.
Corporate Finance and Valuation
Financial Services
This slide details Goldman Sachs BDC’s debt structure as of Q3 2024, including the composition, maturity schedule, and interest rates. It shows the distribution of outstanding debt across revolving credit facilities and unsecured notes, and visualizes how much matures each year through 2028.
debt, maturity, credit facility, notes, interest rate, unsecured, revolving, corporate finance
false
Corporate Finance and Valuation
Financial Services
Multiple Chart
Goldman Sachs
Add to my slides
Remove from favorites
Includes a stacked column chart showing debt maturity by year and a small pie chart detailing credit ratings. Design elements highlight key statistics like '€600mln ESG linked Term Loan' and credit rating changes over time from three agencies.
Financial Performance
Financial Services
The slide emphasizes a balanced debt maturity structure and favorable credit ratings, presenting both historical and current data. This information is critical for investors assessing the company's financial health and risk profile.
debt maturity, credit rating, ESG, financial health
false
Financial Performance
Financial Services
Mixed Chart
Goldman Sachs
Add to my slides
Remove from favorites
Combination of two column charts detailing upcoming debt maturities and available liquidity.
Financial Performance
Transportation & Logistics
Provides a financial outlook by showcasing Aircastle's debt maturity schedule and liquidity status.
debt, maturity, financial outlook, liquidity, unsecured, bonds
false
Financial Performance
Transportation & Logistics
Multiple Chart
Deutsche Bank
Add to my slides
Remove from favorites
Bar chart illustrating the split of gross debt by maturity year from 2023 to 2028, with significant amounts maturing in 2022 and 2025, represented in millions of euros.
Financial Performance
Financial Services
This slide presents a breakdown of the company's debt maturity schedule, indicating the years when significant debt repayments are due, aiding in financial planning and risk assessment.
debt maturity, financial planning, repayment schedule, euros, financial analysis
false
Financial Performance
Financial Services
Single Chart
IPSOS
Add to my slides
Remove from favorites
Slide displays a flowchart with icons representing different companies and processes in debt negotiation. Blue, red, and green arrows indicate different paths and transactions. Uses a clean, structured layout with distinct sections.
Market Analysis and Trends
Financial Services
Explains the operational flow of the Limpa Nome marketplace, detailing each step in the debt negotiation process for Brazilian users. It also shows how revenue is shared and payments are processed.
Debt negotiation, Brazil, flowchart
false
Market Analysis and Trends
Financial Services
Linear Flow
Barclays
Add to my slides
Remove from favorites
Slide features column charts and statistical data on partnership growth, deal numbers, and discount rates within the debt collection market.
Risk Assessment and Management
Financial Services
Highlights the success of the "Limpa Nome" marketplace in Brazil, showcasing its effectiveness in debt negotiation and financial recovery for consumers.
debt negotiation, financial recovery, Brazil, marketplace, Limpa Nome
false
Risk Assessment and Management
Financial Services
Multiple Chart
Barclays
Add to my slides
Remove from favorites
This slide shows two column charts comparing gross debt from 2016 to 2021 and the cost of funding over the same period, annotated with percentage changes, and includes bullet-pointed text.
Financial Performance
Financial Services
The slide presents a comparison of Leonardo's debt reduction and funding cost from 2016 to 2021, highlighting financial improvements and targets for the coming years.
debt reduction, cost of funding, financial improvement, interest rates, investment, deleveraging
false
Financial Performance
Financial Services
Multiple Chart
Goldman Sachs
Add to my slides
Remove from favorites
Contains a column chart of debt figures over time, another column chart of breakeven costs, with a line showing a reduction in breakeven rates due to strategic actions.
Financial Performance
Transportation & Logistics
Focuses on financial health by showing a reduction in debt and operational costs, positioning the company favorably within its industry.
debt reduction, financial health, breakeven rates, operational costs, industry comparison
false
Financial Performance
Transportation & Logistics
Multiple Chart
Deutsche Bank
Add to my slides
Remove from favorites
Two primary visual elements are present. The left section shows a blue column chart detailing 'NET INTEREST-BEARING DEBT' in euros over five quarters, with a noticeable downward trend. The right section shows a grey-scale column chart of the 'MATURITY STRUCTURE OF INTEREST-BEARING DEBT' for the upcoming years, demonstrating an extended maturity profile. The upper right corner provides a real-life connection with an image of two people in a hallway, symbolizing the corporate world.
Financial Performance
Financial Services
Outlines the significant year-over-year reduction in net interest-bearing debt and the extension of its maturity profile, critical for financial planning and investment discussions.
debt reduction, financial planning, interest-bearing debt, maturity structure, y-o-y comparison, financial management, investment strategy
false
Financial Performance
Financial Services
Multiple Chart
Goldman Sachs
Add to my slides
Remove from favorites
A line graph depicting the trend in debt leverage over several fiscal quarters with targets set for future ratios.
Financial Performance
Financial Services
Describes the company's efforts in reducing debt to maintain a healthy leverage ratio, aiming for investment-grade status.
debt reduction, leverage ratio, financial health, investment grade, line graph
false
Financial Performance
Financial Services
Single Chart
Barclays
Add to my slides
Remove from favorites
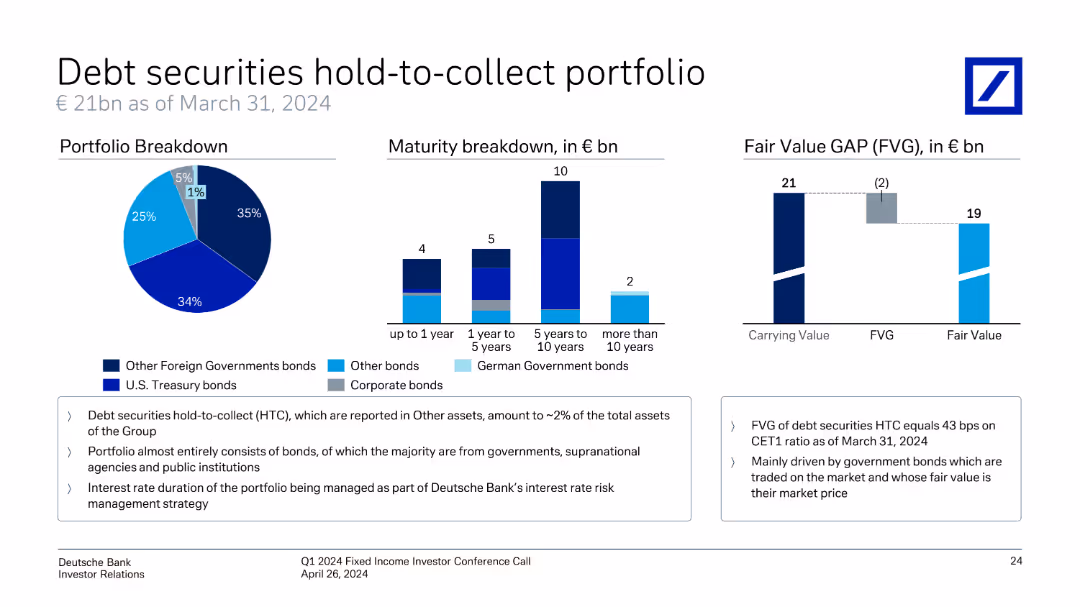
Pie chart and column charts present. Light and dark blue shades used to denote different bond types and maturities. High data density.
Financial Performance
Financial Services
Discusses the composition and maturity of the hold-to-collect debt portfolio, focusing on risk and asset management.
Debt securities, portfolio, maturities, fair value, risk management, bonds, financial assets
false
Financial Performance
Financial Services
Multiple Chart
Deutsche Bank
Add to my slides
Remove from favorites
Pie chart for portfolio breakdown, bar chart for maturity breakdown, and another bar chart for fair value GAP.
Investment Analysis
Financial Services
Describes the composition and maturity of the debt securities portfolio, highlighting fair value and carrying value differences.
debt securities, portfolio, maturity, fair value, holding, investment, bonds
false
Investment Analysis
Financial Services
Multiple Chart
Deutsche Bank
Add to my slides
Remove from favorites
Slide has a pie chart detailing portfolio composition and column charts showing maturity breakdown and fair value gap.
Risk Assessment and Management
Financial Services
Discusses the composition and maturity of debt securities in a Hold-to-Collect portfolio, with emphasis on risk management through asset distribution and maturity stages.
debt securities, portfolio, maturity, risk management, fair value, bonds, asset distribution
false
Risk Assessment and Management
Financial Services
Multiple Chart
Deutsche Bank
Add to my slides
Remove from favorites
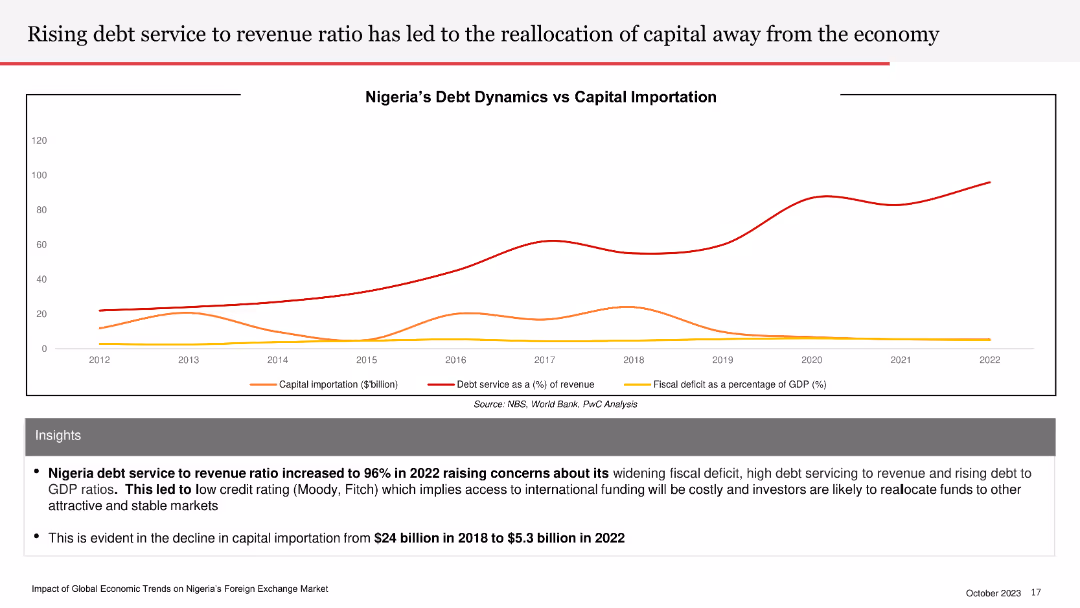
The slide features a line chart showing Nigeria’s debt dynamics versus capital importation over time, with separate lines for each metric.
Risk Assessment and Management
Financial Services
The slide highlights the rising debt service to revenue ratio in Nigeria and its impact on capital importation and economic stability.
debt service, revenue ratio, capital importation, Nigeria, economic impact
false
Risk Assessment and Management
Financial Services
Mixed Chart
PwC/Strategy&
Add to my slides
Remove from favorites
The slide features a stacked bar chart and a line chart showing debt dynamics over the years. It is visually complex, designed to convey detailed financial data clearly.
Financial Performance
Government & Public Sector
The slide analyzes debt stock trends from 2015 to 2023, highlighting the increase in domestic and external debt, and providing insights into fiscal deficit and debt servicing ratios.
Debt, Stock, Analysis, Trends, Fiscal
false
Financial Performance
Government & Public Sector
Mixed Chart
PwC/Strategy&
Add to my slides
Remove from favorites
The slide includes two pie charts showing the distribution of interest-bearing debt and interest rate distribution, accompanied by labels and percentages.
Financial Performance
Financial Services
It conveys the debt composition and interest rates as of a specific date, for financial analysis or investor relations.
Debt Structure, Interest Rates, Financial Analysis, Distribution, Pie Charts, Bonds, Loans
false
Financial Performance
Financial Services
Multiple Chart
Goldman Sachs
Add to my slides
Remove from favorites
Two-column layout with bar and line charts depicting US federal budget deficits/surpluses and interest payments on government debt from 2000-2023.
Strategic Planning
Government & Public Sector
Discusses the rising debt sustainability concerns and their implications on private investment and future economic growth.
debt sustainability, federal budget, interest payments, private investment, fiscal space
false
Strategic Planning
Government & Public Sector
Multiple Chart
EY
Add to my slides
Remove from favorites
This slide includes a column chart depicting debt underwriting net revenues over time, with specific figures for selected years. Beneath, a league table ranking is provided for different types of debt.
Financial Performance
Financial Services
The slide highlights the growth in debt underwriting net revenues, demonstrating the company's successful execution of strategic focus and improved competitive position. League table rankings in various debt categories are shown to depict market standing.
Debt, Underwriting, Growth, Revenue, Competitive, Rankings, Strategy
false
Financial Performance
Financial Services
Single Chart
Goldman Sachs
Add to my slides
Remove from favorites
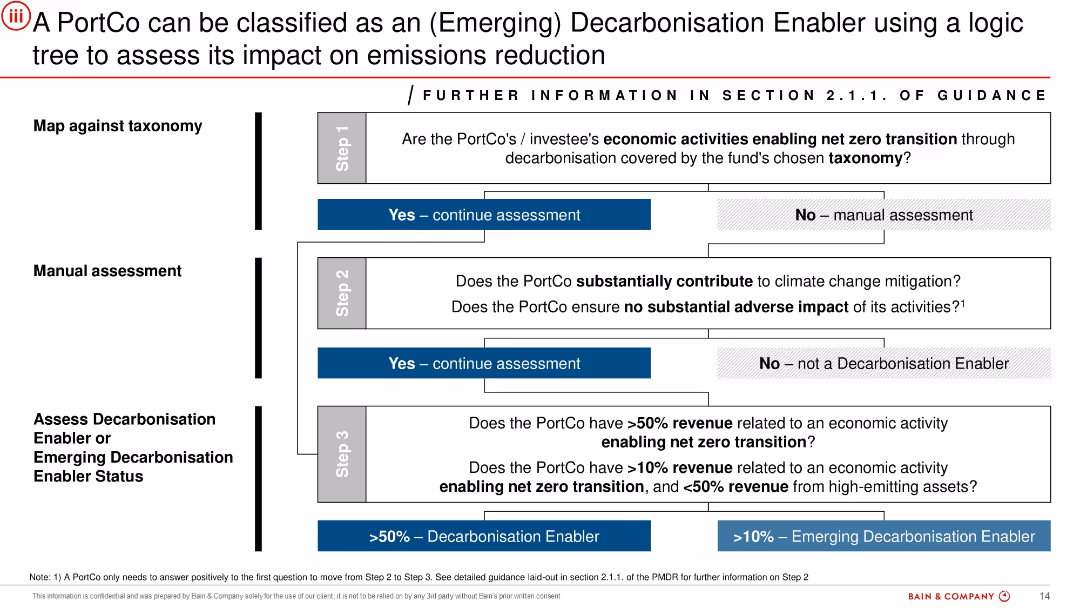
Vertical logic tree layout in grayscale and blue, progressing through 3 assessment steps. Boxes contain decision questions and flow to "Yes"/"No" outcomes. Blue highlights indicate enabling status.
Customer and Market Segmentation
Financial Services
Provides a decision framework to classify PortCos as Decarbonisation Enablers based on taxonomy alignment, climate contribution, and revenue thresholds. This structured logic is used to guide investment decisions or categorize assets according to their role in supporting the net-zero transition.
decarbonisation enabler, emissions, climate, taxonomy, classification, PortCo, investment criteria
false
Customer and Market Segmentation
Financial Services
Uncategorized
Bain
Add to my slides
Remove from favorites
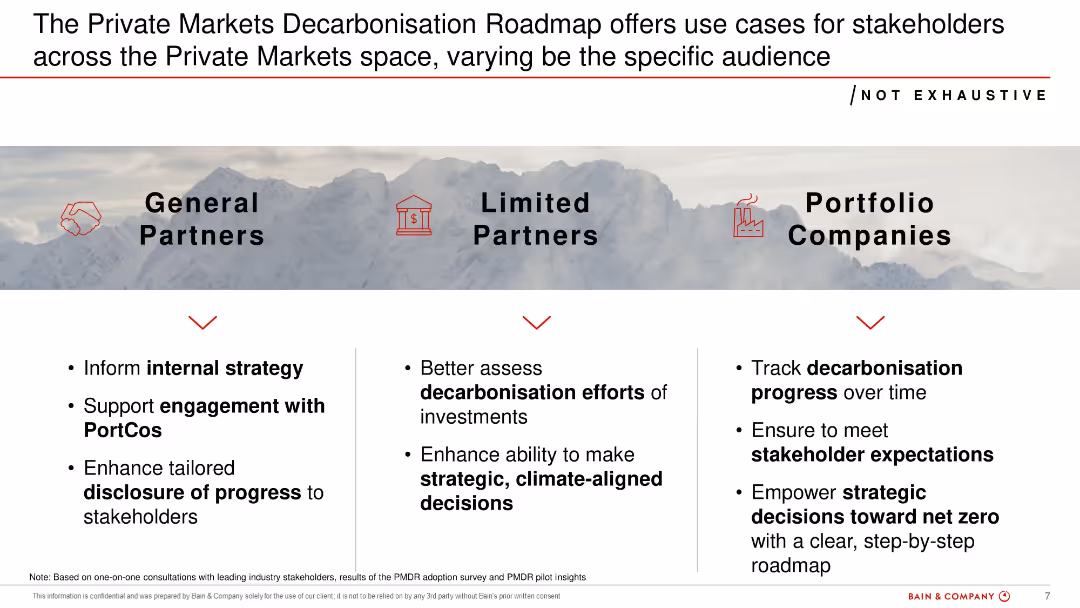
Three-column layout showing stakeholder-specific use cases for general partners, limited partners, and portfolio companies. Minimalistic icons and a mountain backdrop.
Strategic Planning
Financial Services
Explains how different stakeholders (GPs, LPs, PortCos) can use the PMDR to support climate-aligned strategy and expectations. Focuses on strategic value and communication benefits across internal and external stakeholders.
decarbonisation, GPs, LPs, PortCos, strategy, stakeholder, roadmap
false
Strategic Planning
Financial Services
Pillar
Bain
Add to my slides
Remove from favorites
Previous
Next
You don't have any favorites yet.
Please wait loading your favorites slides...
Create a FREE account to continue browsing
Receive Instant Access to 1,000+ slides from companies like McKinsey, Google, and Goldman Sachs
First Name
Last Name
Email
Password
I agree to all
Terms & Privacy Policy
Thank you! Your submission has been received!
Oops! Something went wrong while submitting the form.
Have an account?
Sign in
Upgrade to PRO to Save slides
Advanced Search and Filters
Access to 15,000+ slides
Access to Category Pages
Save/Bookmark Slides
PowerPoint Template Library
Pick a Plan
MONTHLY
$12/month
Billed every month, Cancel anytime.
YEARLY
$9/year
Billed $108 annually, Cancel anytime.
Checkout for $12/month
Checkout for $108/yr
Secured by Stripe | AES-256 bit encryption