My Account
My Slides
Search by Category
Companies
Slide Type
Use Case
Industry
Pricing
Templates
View All Templates
Download Template Slides
✦ AI
AI Prompt Library
AI Search
Feedback
Login
Logout
Get Started
Browse all Slides
Browse all Slides
Create a FREE Account
Instant access to 1,000+ real slides from top companies like McKinsey, BCG, Goldman Sachs, Google and many more!
First Name
Last Name
Email
Password
I agree to all
Terms & Privacy Policy
Thank you! Your submission has been received!
Oops! Something went wrong while submitting the form.
Have an account?
Sign in
Saved Slides
Total No. of slides saved
0
↻ Refresh
✖ Clear all
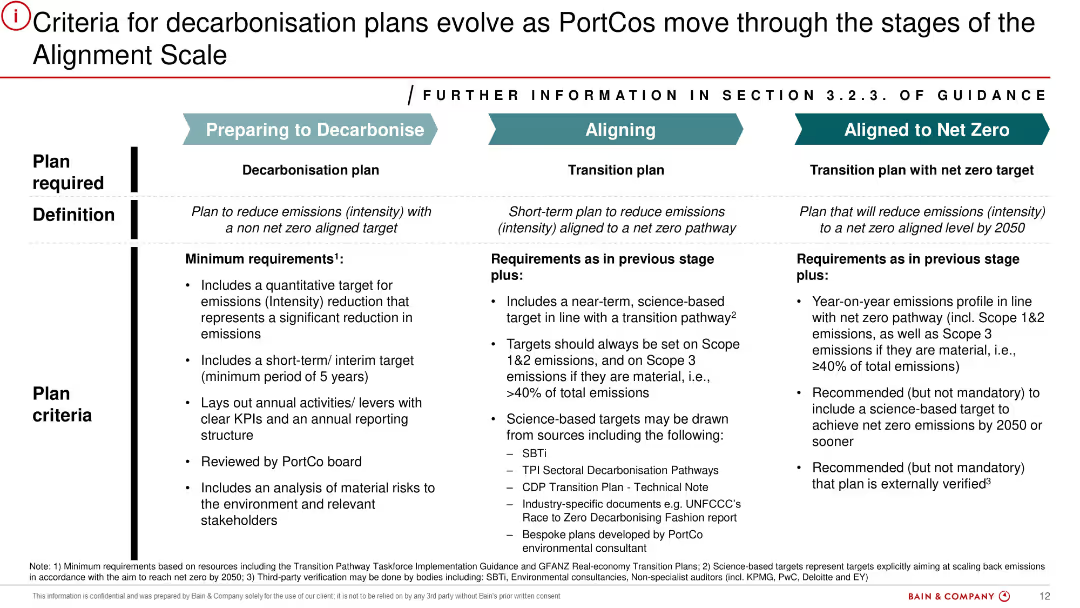
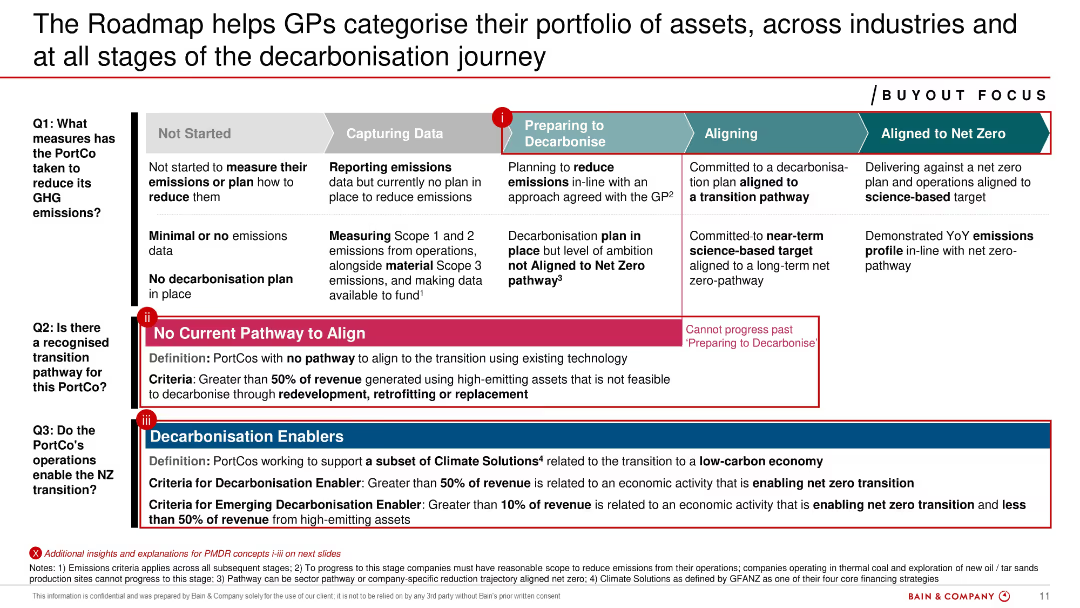
Three-column structured slide with vertical dividers and horizontal row labels. Each column corresponds to a decarbonisation stage: Preparing to Decarbonise, Aligning, Aligned to Net Zero. Includes detailed bullets under “Definition” and “Plan Criteria”. Color-coded headers for clarity.
Strategic Planning
Financial Services
Outlines progressive criteria for PortCos (portfolio companies) to qualify for decarbonisation plan classifications. It defines each stage and sets minimum requirements like emissions targets, science-based alignment, and board review. The goal is to help firms advance towards net-zero emissions through structured guidance.
decarbonisation, net zero, emissions, PortCo, strategic planning, KPI, transition, sustainability, compliance, board review
false
Strategic Planning
Financial Services
Table
Bain
Add to my slides
Remove from favorites
Detailed process flow diagram with multi-stage progression bar and three guiding questions. Extensive use of text and color-coded segments for stages.
Organizational Structure and Change
Financial Services
Categorizes PortCos across five decarbonization stages and addresses readiness, pathways, and enablers. Helps GPs assess portfolio alignment with net-zero goals using qualitative criteria and investment readiness.
decarbonisation stages, PortCos, roadmap, net zero, alignment, GP tools
false
Organizational Structure and Change
Financial Services
Linear Flow
Bain
Add to my slides
Remove from favorites
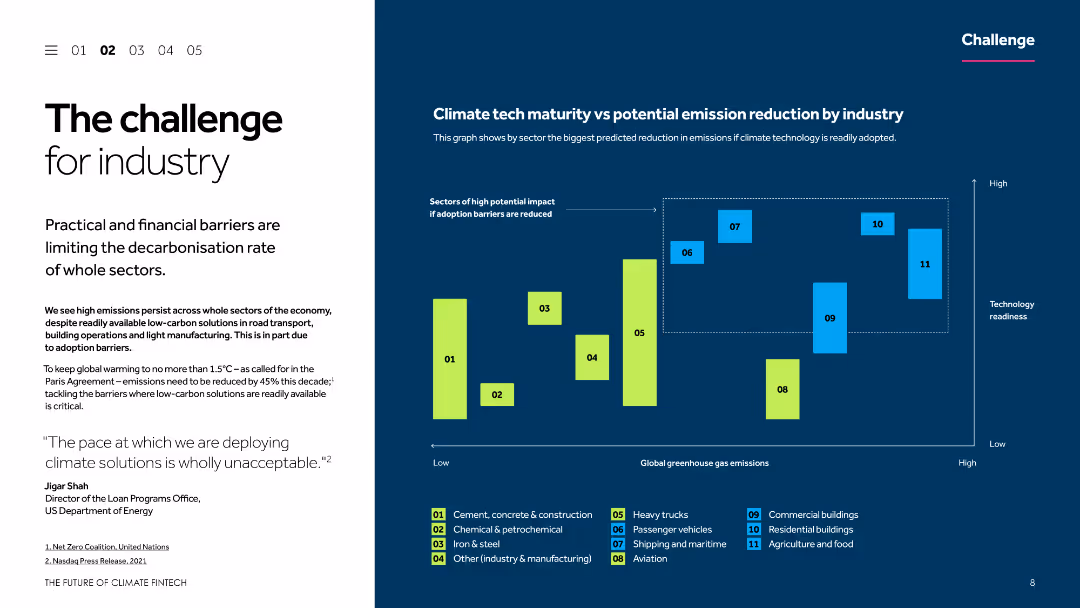
This slide uses a two-column layout with a text section on the left and a column chart on the right. The text describes the challenges faced by industries in decarbonization, while the chart illustrates the potential emission reduction by industry and technology readiness.
Risk Assessment and Management
Environmental Services & Sustainability
The slide discusses the practical and financial barriers limiting the decarbonization rate of various sectors. It includes a comparison of climate tech maturity versus potential emission reduction across different industries, emphasizing the need for overcoming adoption barriers.
Decarbonization, climate tech, emission reduction, industry challenges, technology readiness
false
Risk Assessment and Management
Environmental Services & Sustainability
Mixed Chart
Barclays
Add to my slides
Remove from favorites
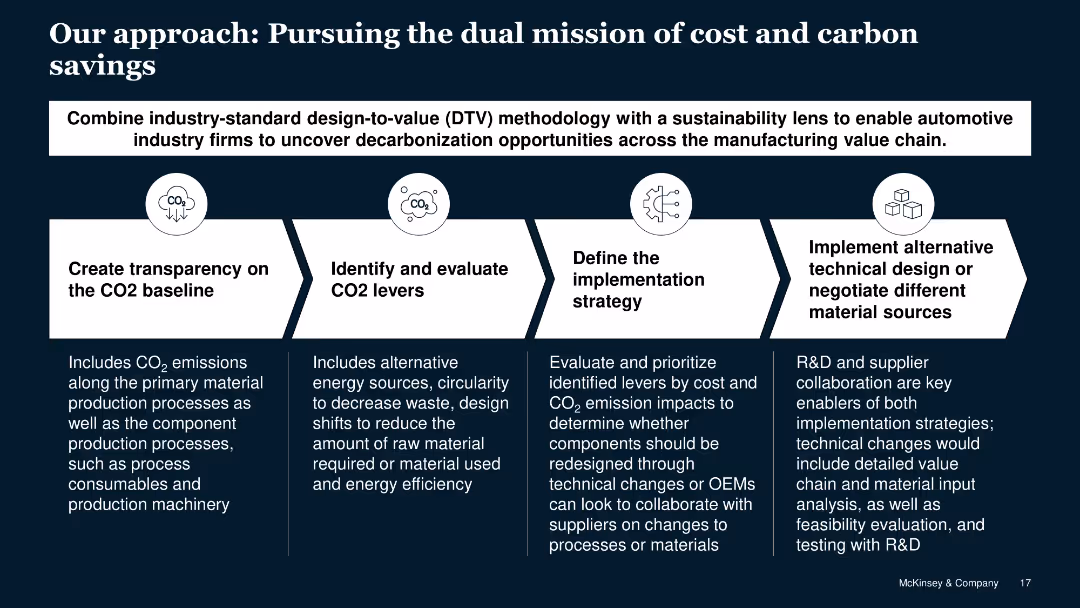
The slide has a dark blue background with white text and icons. It includes four sections with titles and descriptions, each illustrated with a simple icon representing CO2-related actions.
Strategic Planning
Industrial & Manufacturing
The slide outlines a four-step approach to decarbonization for automotive manufacturing. It emphasizes transparency, evaluating levers, implementation strategy, and alternative designs.
decarbonization, CO2, automotive, strategy, evaluation, implementation, transparency, design, manufacturing, cost savings
false
Strategic Planning
Industrial & Manufacturing
Linear Flow
McKinsey
Add to my slides
Remove from favorites
Multi-topic slide with numbered headings, bullet points, and colored key for different consumption aspects.
Strategic Planning
Environmental Services & Sustainability
Discusses various points of debate regarding the future of sustainable consumption, focusing on policy and consumer behavior.
Decarbonization, Consumer Behavior, Sustainable Agriculture, Circular Economy, Carbon Removal
false
Strategic Planning
Environmental Services & Sustainability
Header Vertical
McKinsey
Add to my slides
Remove from favorites
Includes a column chart displaying carbon abatement potential against abatement cost for different sectors. Descriptive text explains the significance of each data point.
Market Analysis and Trends
Environmental Services & Sustainability
Analyzes the abatement potential and cost-effectiveness of various decarbonization levers across sectors in Southeast Asia, emphasizing the high payback potential of proven technologies and the need for their broader implementation to meet carbon reduction goals.
decarbonization, cost-effectiveness, SEA, carbon reduction
false
Market Analysis and Trends
Environmental Services & Sustainability
Mixed Chart
Bain
Add to my slides
Remove from favorites
The slide includes a horizontal bar chart illustrating the impact of adopting various decarbonization levers on operational emissions changes, categorized by lever type.
Strategic Planning
Environmental Services & Sustainability
It analyzes how companies adopting multiple decarbonization levers show better emission reduction outcomes, highlighting the importance of comprehensive strategies.
Decarbonization, Emissions, Levers, Companies, Strategy
false
Strategic Planning
Environmental Services & Sustainability
Mixed Chart
Accenture
Add to my slides
Remove from favorites
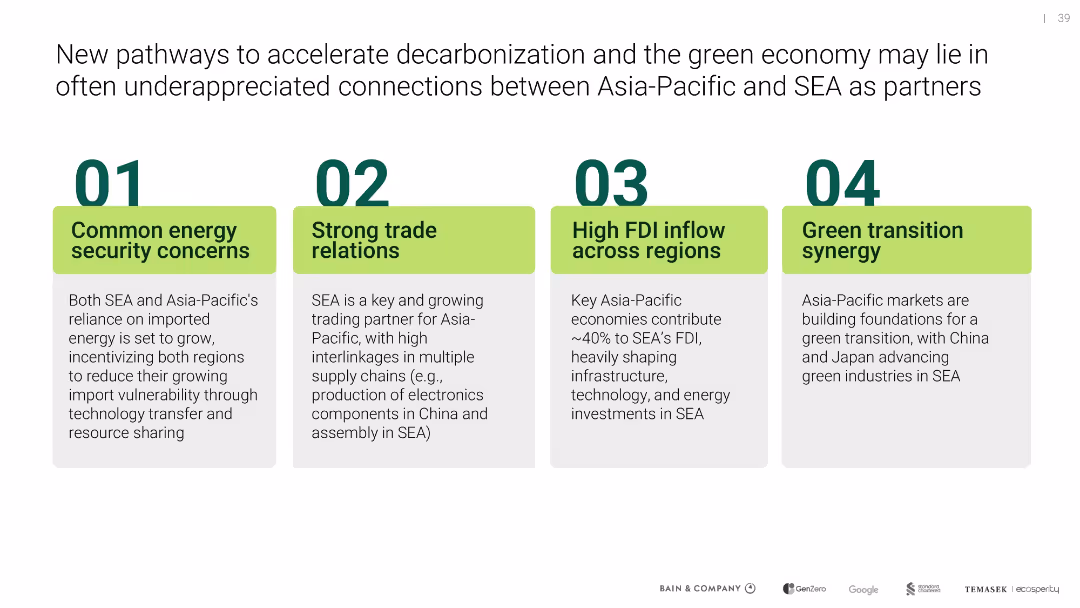
Four-column layout with green-highlighted section headers, icons, and explanatory text in blocks
Strategic Planning
Environmental Services & Sustainability
The slide outlines four underappreciated synergies between Asia-Pacific and Southeast Asia that can accelerate decarbonization, including energy security, trade relations, FDI inflow, and green transition alignment.
decarbonization, energy security, FDI, trade, green transition, SEA, APAC
false
Strategic Planning
Environmental Services & Sustainability
Uncategorized
Bain
Add to my slides
Remove from favorites
Tabular matrix chart with ideas, sectors, and screening criteria (abatement, feasibility, interest); clean, grid-based layout.
Strategic Planning
Environmental Services & Sustainability
Evaluates various decarbonization ideas based on abatement impact, technical feasibility, and commercial interest. Highlights improved farming, nature offsets, green fuel, and efficient transport as top short-listed ideas.
decarbonization, farming, feasibility, green fuel, nature-based, investment, SEA, emissions
false
Strategic Planning
Environmental Services & Sustainability
Single Chart
Bain
Add to my slides
Remove from favorites
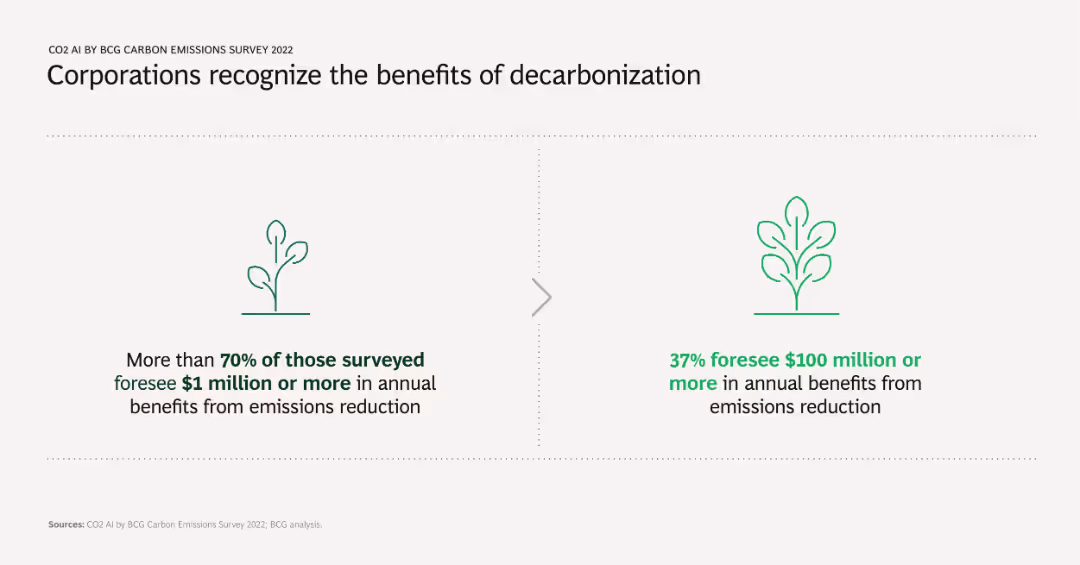
Two comparative infographic elements showing survey results: one indicating the percentage of companies seeing $1 million+ in annual benefits, and the other showing those seeing $100 million+ in benefits from emission reductions.
Strategic Planning
Environmental Services & Sustainability
Highlights the financial benefits corporations expect from decarbonization efforts, showcasing significant monetary advantages at different scales. Supports the argument for strategic investment in emission reduction initiatives.
decarbonization, financial benefits, emission reduction, survey, strategic planning
false
Strategic Planning
Environmental Services & Sustainability
Boxed
BCG
Add to my slides
Remove from favorites
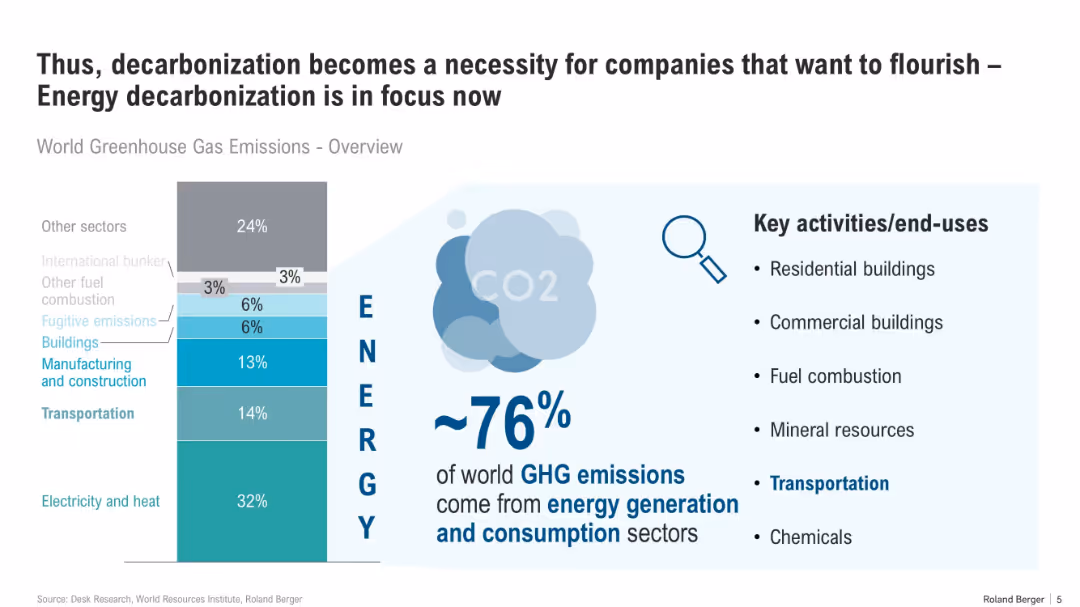
Vertical bar chart centered, split into sectors by emission contribution, with supporting bullet points and infographic elements on the right.
Technology and Digital Transformation
Energy & Utilities
The slide emphasizes that ~76% of global GHG emissions originate from energy generation and use. It highlights key energy-consuming sectors and stresses the need for corporate decarbonization to meet sustainability goals.
decarbonization, GHG emissions, energy, buildings, transportation, commercial, CO2, consumption, sector overview
false
Technology and Digital Transformation
Energy & Utilities
Mixed Chart
Roland Berger
Add to my slides
Remove from favorites
This Diagram Slide showcases 'Watèa by Michelin' with diagrams and icons, highlighting the transition to electric light commercial vehicles (LCVs). It presents the stakes of this transition, fleet pain points, and Michelin's value proposition. The use of diagrams, pictograms, and a central circular graphic visually conveys the information effectively, with clear labels and a coherent color scheme.
Technology and Digital Transformation
Transportation & Logistics
This slide introduces 'Watèa by Michelin', a solution for decarbonizing urban LCV fleets, addressing the transition to EVs, operational challenges, and financing issues. It emphasizes Michelin’s comprehensive approach, leveraging group assets and partnerships, including a collaboration with Credit Agricole for vehicle financing, to offer a sustainable and operationally efficient fleet management service.
decarbonization, LCV, electric vehicles, urban, fleet management, sustainability, partnership, financing, Michelin
false
Technology and Digital Transformation
Transportation & Logistics
Framework
Morgan Stanley
Add to my slides
Remove from favorites
Multi-bar comparison across five inhibitors (returns, regulation, demand, finance, buy-in); includes contextual commentary
Risk Assessment and Management
Environmental Services & Sustainability
This slide identifies the major barriers to decarbonization faced by Middle East and GCC businesses, notably low returns and regulatory complexity. It suggests the need for policy alignment and financing strategies.
Decarbonization, Regulatory Barriers, Investment Returns, Climate Risk, Sustainability Challenges
false
Risk Assessment and Management
Environmental Services & Sustainability
Mixed Chart
PwC/Strategy&
Add to my slides
Remove from favorites
Features a combination of bar graphs and textual analysis, using color coding to differentiate data points across multiple sectors.
Strategic Planning
Environmental Services & Sustainability
Reviews strategic decarbonization levers across Southeast Asia, highlighting key sectors and the potential for carbon abatement.
decarbonization, SEA, carbon abatement, strategy, sectors
false
Strategic Planning
Environmental Services & Sustainability
Mixed Chart
Bain
Add to my slides
Remove from favorites
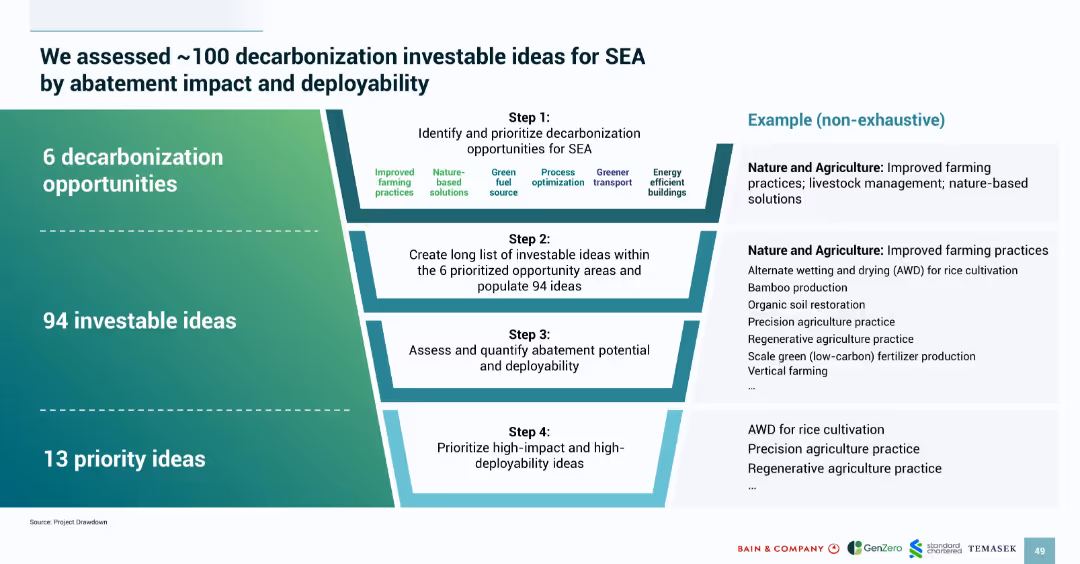
Funnel-style infographic breaking down process into four steps; left side lists opportunity areas; right includes examples under “Nature and Agriculture.”
Strategic Planning
Environmental Services & Sustainability
This slide illustrates the methodology used to filter ~100 decarbonization ideas across six opportunity areas to 13 priority concepts. The process involves identifying areas, populating ideas, quantifying impact, and final prioritization. Sample initiatives under agriculture include vertical farming, bamboo production, and regenerative practices.
decarbonization, SEA strategy, investment pipeline, farming practices, nature-based solutions, opportunity assessment, idea funnel
false
Strategic Planning
Environmental Services & Sustainability
Vertical Flow
Bain
Add to my slides
Remove from favorites
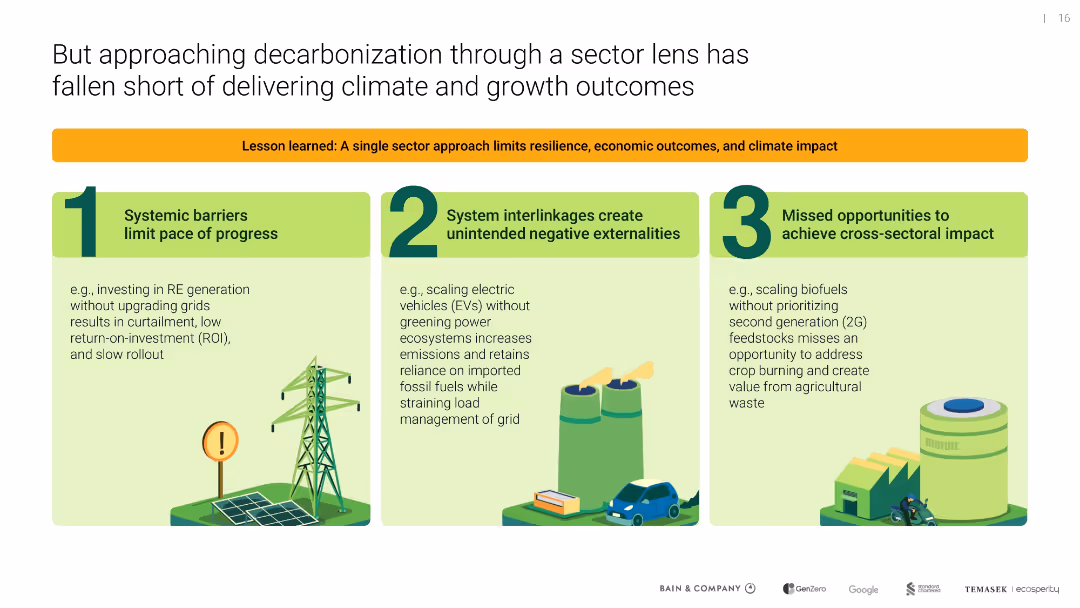
Three-column layout using numbered blocks and icons; color-coded sections show pitfalls of sector-based strategies
Risk Assessment and Management
Environmental Services & Sustainability
Explains limitations of a single-sector approach to decarbonization, such as system inefficiencies, negative externalities, and missed opportunities for cross-sectoral synergies.
decarbonization, sector approach, system barriers, inefficiencies, externalities
false
Risk Assessment and Management
Environmental Services & Sustainability
Table
Bain
Add to my slides
Remove from favorites
Consists of a series of green bars assessing different solutions' abatement potential, technology readiness, and other factors across various sectors like transport and energy, all aligned in a clear, organized manner.
Market Analysis and Trends
Environmental Services & Sustainability
Highlights available, ready-to-deploy decarbonization solutions in different sectors, emphasizing their readiness and potential impact on reducing carbon emissions. Focuses on supply chain optimization in transport and cooling efficiency in the built environment as examples.
decarbonization, solutions, sector-specific, carbon emissions
false
Market Analysis and Trends
Environmental Services & Sustainability
Header Horizontal
Bain
Add to my slides
Remove from favorites
Presents a detailed abatement cost curve for a steel plant, categorizing various decarbonization technologies and their potential impacts.
Operational Efficiency
Industrial & Manufacturing
Focuses on decarbonization strategies for the steel industry, highlighting cost-effective measures and technology shifts. Useful for operational planning and cost management.
decarbonization, steel industry, cost management, operational efficiency, technology, sustainability
false
Operational Efficiency
Industrial & Manufacturing
Mixed Chart
BCG
Add to my slides
Remove from favorites
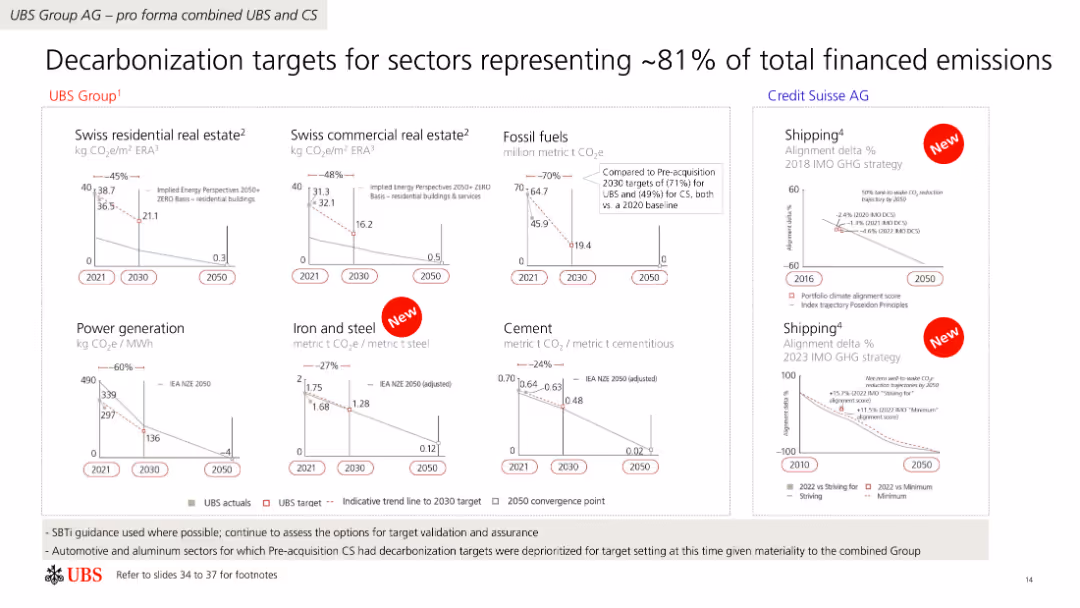
The slide includes multiple line charts comparing decarbonization targets across different sectors such as real estate, fossil fuels, and power generation.
Risk Assessment and Management
Financial Services
This slide outlines UBS Group AG's decarbonization targets for various sectors, representing a significant portion of total financed emissions, with specific reduction goals.
Decarbonization, targets, sectors, emissions, UBS
false
Risk Assessment and Management
Financial Services
Multiple Chart
UBS
Add to my slides
Remove from favorites
Slide compares decarbonization technologies across three readiness levels: proven, market ready, and emerging, with clear categorization.
Technology and Digital Transformation
Environmental Services & Sustainability
Discusses various technologies for decarbonization and their stages of readiness for investment in Southeast Asia.
decarbonization, technology readiness, investment, SEA
false
Technology and Digital Transformation
Environmental Services & Sustainability
Header Horizontal
Bain
Add to my slides
Remove from favorites
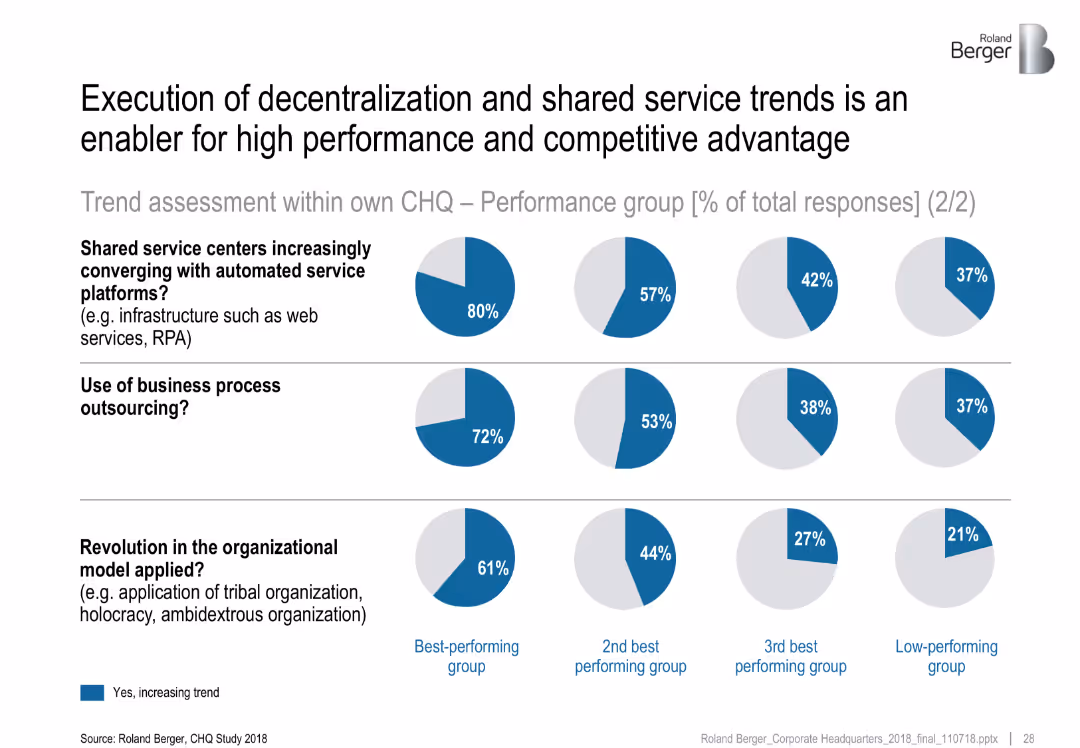
Continuation of prior slide format with three rows comparing trend adoption across performance groups. Blue pie charts indicate perceived increases.
Strategic Planning
Professional Services
This slide reinforces the link between strategic CHQ trends and high performance. It shows that top-performing companies are significantly more likely to adopt automated service platforms, business process outsourcing, and innovative organizational models.
decentralization, competitive advantage, RPA, CHQ, shared services, organizational change
false
Strategic Planning
Professional Services
Multiple Chart
Roland Berger
Add to my slides
Remove from favorites
The layout is similar to slides 113 and 114, featuring black and white design with green highlights. It includes two sections with bullet points, each led by an icon, discussing innovations and risks in financial services related to Web3.
Operational Efficiency
Financial Services
Describes how Web3 could bring about cost efficiencies and a shift in investment trends within financial services, and outlines the associated risks, particularly concerning regulatory uncertainties and consumer protections.
Decentralization, Financial Services, Smart Contracts, Risks
false
Operational Efficiency
Financial Services
Boxed
McKinsey
Add to my slides
Remove from favorites
Column charts illustrating degrees of decentralization in organizations and adherence to third-party standards, accompanied by a point of view from Deloitte.
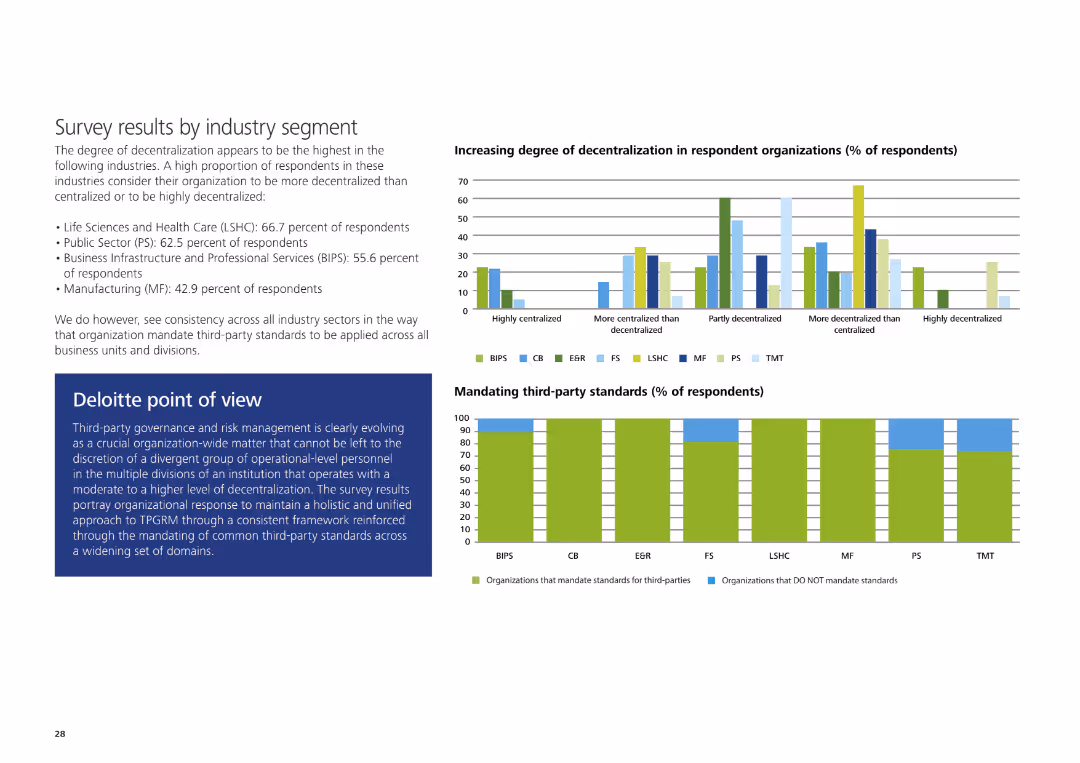
Market Analysis and Trends
Financial Services
Presents survey results on decentralization and the mandating of third-party standards across industry segments, including Deloitte's perspective.
decentralization, industry segment, third-party, standards, column chart
false
Market Analysis and Trends
Financial Services
Multiple Chart
Deloitte
Add to my slides
Remove from favorites
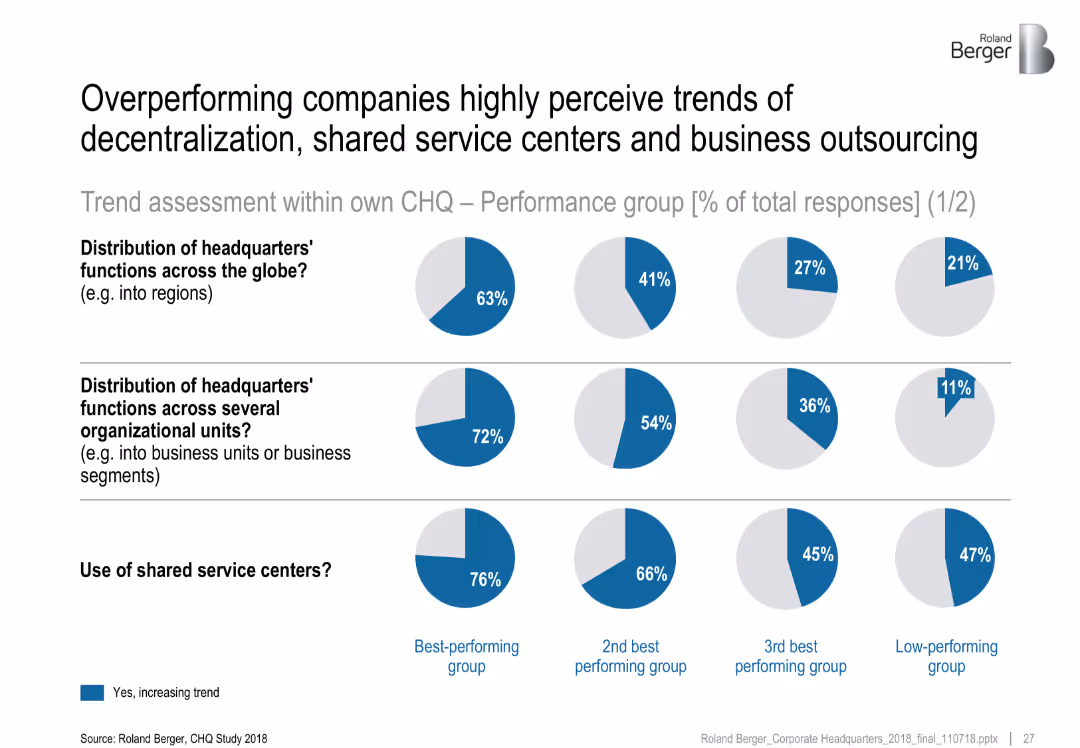
Comparative pie charts segmented by performance groups. Each row examines a different CHQ trend.
Performance Metrics and KPIs
Professional Services
The slide highlights how top-performing companies are more likely to report increasing trends in decentralization and use of shared service centers. It compares best and low-performing groups' perceptions across three key dimensions of headquarters functions.
decentralization, shared services, CHQ, business outsourcing, organizational units, performance comparison
false
Performance Metrics and KPIs
Professional Services
Multiple Chart
Roland Berger
Add to my slides
Remove from favorites
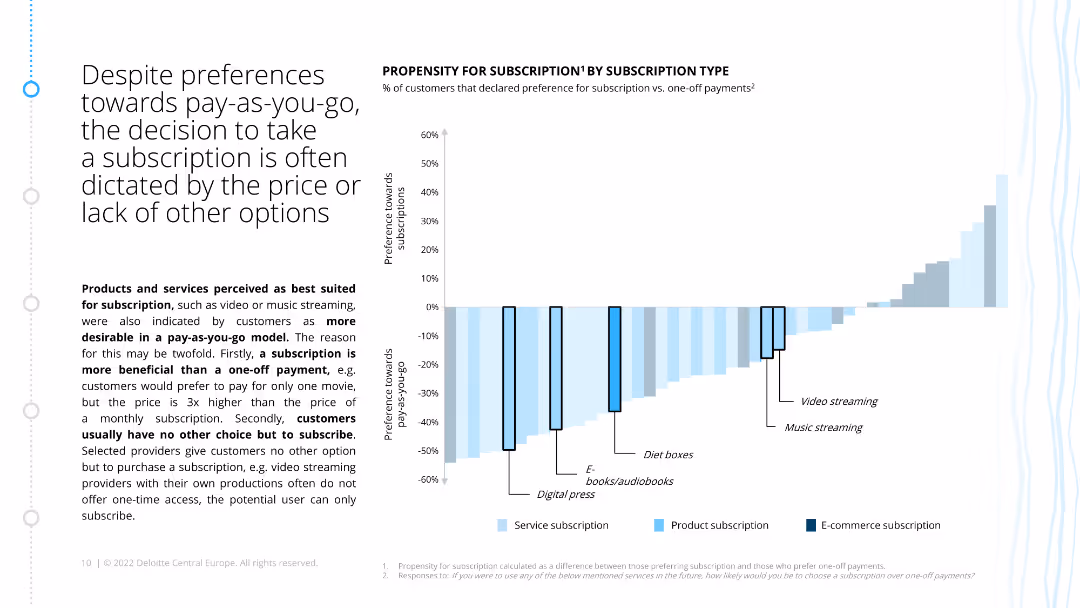
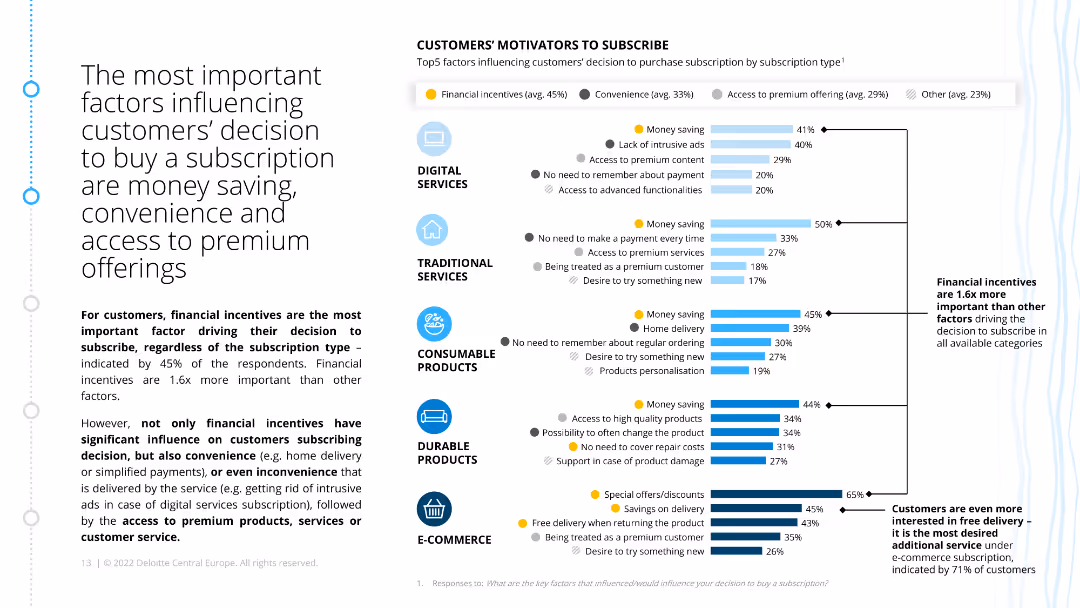
The slide includes a bar chart showing the factors influencing customers' decisions to subscribe, categorized by different subscription types such as digital services, consumable products, and e-commerce.
Customer and Market Segmentation
Consumer Goods
The slide identifies key factors that drive customers to subscribe, including financial incentives, convenience, and access to premium offerings, with varying importance across subscription types.
decision factors, subscription, financial incentives, convenience, premium offerings
false
Customer and Market Segmentation
Consumer Goods
Mixed Chart
Deloitte
Add to my slides
Remove from favorites
The slide includes a bar chart showing the factors influencing customers' decisions to subscribe, categorized by different subscription types such as digital services, consumable products, and e-commerce.
Customer and Market Segmentation
Consumer Goods
The slide identifies key factors that drive customers to subscribe, including financial incentives, convenience, and access to premium offerings, with varying importance across subscription types.
decision factors, subscription, financial incentives, convenience, premium offerings
false
Customer and Market Segmentation
Consumer Goods
Multiple Chart
Deloitte
Add to my slides
Remove from favorites
The slide includes a circular diagram showing Ipsos' competitors by sectors and specialties.
Strategic Planning
Professional Services
The slide emphasizes Ipsos' unified and modular offerings for decision makers across various sectors.
decision makers, competitors, sectors, specialties, Ipsos, modular offerings
false
Strategic Planning
Professional Services
Diagram
IPSOS
Add to my slides
Remove from favorites
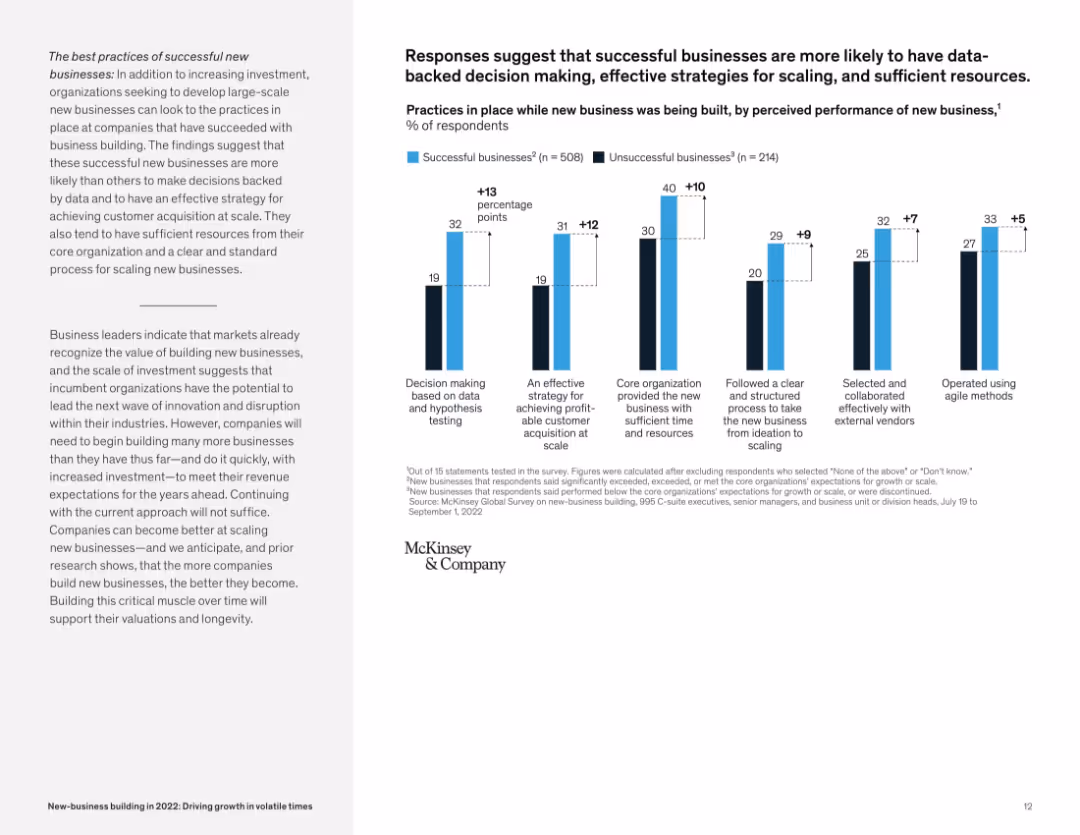
Bar graph with six categories comparing successful and unsuccessful businesses on practices used.
Operational Efficiency
Professional Services
The slide highlights six business practices—such as data-backed decision making and scaling processes—more common in successful new businesses. A bar graph shows percentage gaps between successful and unsuccessful businesses.
decision-making, scaling, agile, vendors, data, new business, McKinsey, success practices
false
Operational Efficiency
Professional Services
Mixed Chart
McKinsey
Add to my slides
Remove from favorites
This slide presents a list of steps for increasing organizational speed with corresponding descriptive icons, suggesting methods for operational improvements.
Organizational Structure and Change
Professional Services
Offers a blueprint for accelerating decision-making and operational speed within organizations, focusing on structural and strategic adjustments.
decision-making, speed, operational efficiency, strategy, organizational
false
Organizational Structure and Change
Professional Services
Table
McKinsey
Add to my slides
Remove from favorites
The slide presents a comparison between Germany and Global data in pie and column charts. It includes two pie charts showing the percentage of people's personal views on leadership permission, and three column charts comparing decision-making processes and data-driven insights usage in organizations.
Strategic Planning
Professional Services
The slide highlights differences in decision-making strategies and reliance on data-driven insights between German and Global executives, focusing on leadership permissions, decision-making processes, and data usage in strategic contexts.
Decision-making, Strategy, Data, Germany, Global, Leadership, Insights, Comparison
false
Strategic Planning
Professional Services
Multiple Chart
Deloitte
Add to my slides
Remove from favorites
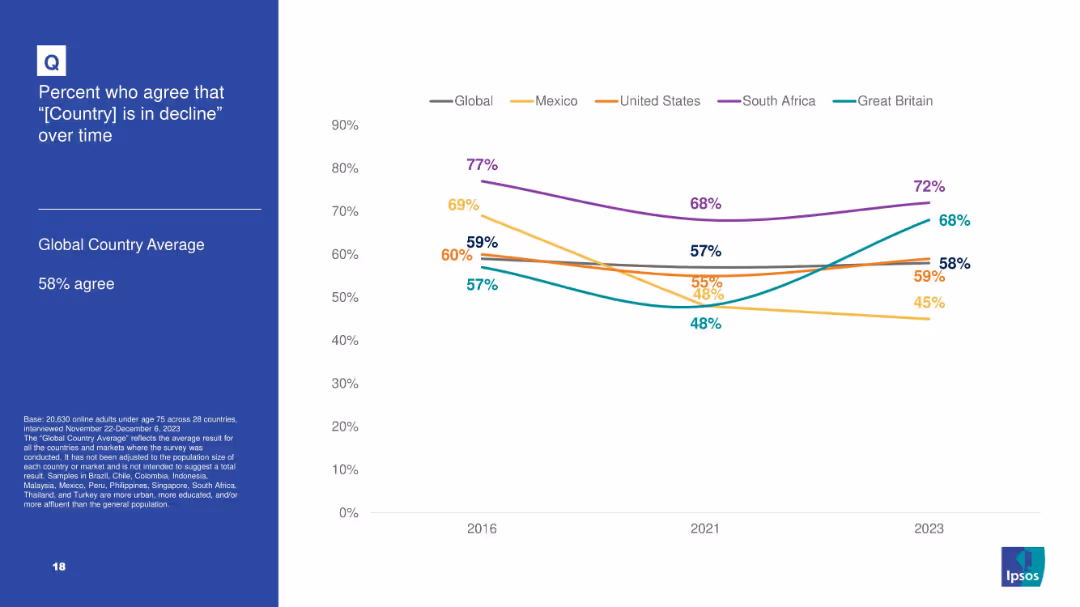
Line graph with country-specific trends from 2016–2023 showing agreement that “[Country] is in decline”; left panel with text and methodology.
Market Analysis and Trends
Government & Public Sector
Tracks beliefs about national decline over time; South Africa and Great Britain show recent increases, while Mexico and APAC show declines.
decline, national sentiment, trends, Ipsos, global comparison, longitudinal
false
Market Analysis and Trends
Government & Public Sector
Mixed Chart
IPSOS
Add to my slides
Remove from favorites
Split layout with a bold title on the left and horizontal bar chart on the right. Clean and minimal.
Market Analysis and Trends
Government & Public Sector
The slide presents survey data from 28 countries regarding agreement with the statement that their country is in decline. It shows that 58% of respondents on average agree. South Africa, Netherlands, and Sweden have the highest agreement.
decline, perception, global sentiment, Ipsos, survey, bar chart, trends, agreement levels
false
Market Analysis and Trends
Government & Public Sector
Mixed Chart
IPSOS
Add to my slides
Remove from favorites
Horizontal bar chart ranking 31 countries by agreement with the statement “is in decline”; includes “agree,” “neither,” and “disagree” percentages, with 2023 vs. past year comparisons shown on the right.
Market Analysis and Trends
Government & Public Sector
This slide presents global sentiment data regarding whether citizens believe their country is in decline. France, Türkiye, and Japan top the list in agreement. Trends over time are shown, including a 30pp increase in Japan since 2016.
decline, perception, sentiment, international, Ipsos, agreement rates, country comparison, political attitudes, trend data
false
Market Analysis and Trends
Government & Public Sector
Mixed Chart
IPSOS
Add to my slides
Remove from favorites
This slide includes a simple office backdrop with a bar chart detailing the proactive measures taken by risk teams. It compares data from 2023 and 2021, showing a general decrease in activities such as "Utilized new technology" and "Expanded the range of risks." Percentages are listed next to each category to show the level of engagement in various risk-related activities.
Risk Assessment and Management
Technology & Software
The slide presents comparative data from 2021 and 2023 showing a decline in proactive risk management behaviors. It includes specific activities like technology adoption and risk range expansion, which have seen decreased focus. This visualization helps in identifying areas where risk management may need to bolster its efforts to maintain or enhance the effectiveness and responsiveness of the organization's risk strategy.
decline, proactive, risk management, 2023, 2021, column chart, activities, technology, engagement
false
Risk Assessment and Management
Technology & Software
Mixed Chart
Accenture
Add to my slides
Remove from favorites
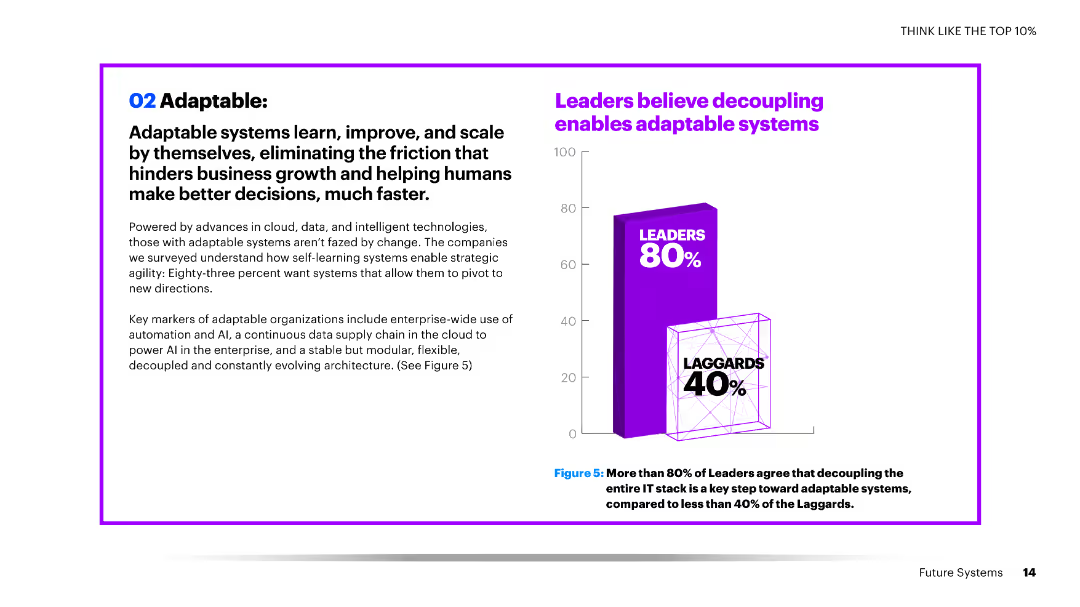
A slide with a large column chart showing the percentage of leaders and laggards who believe in the importance of decoupling IT systems for adaptability.
Technology and Digital Transformation
Technology & Software
The slide emphasizes the belief among leaders that decoupling IT systems is crucial for creating adaptable systems, which is less recognized among laggards, highlighting a key difference in strategic approaches.
decoupling, adaptable systems, leaders, laggards, IT systems, belief, importance, adaptability, strategy, approaches
false
Technology and Digital Transformation
Technology & Software
Mixed Chart
Accenture
Add to my slides
Remove from favorites
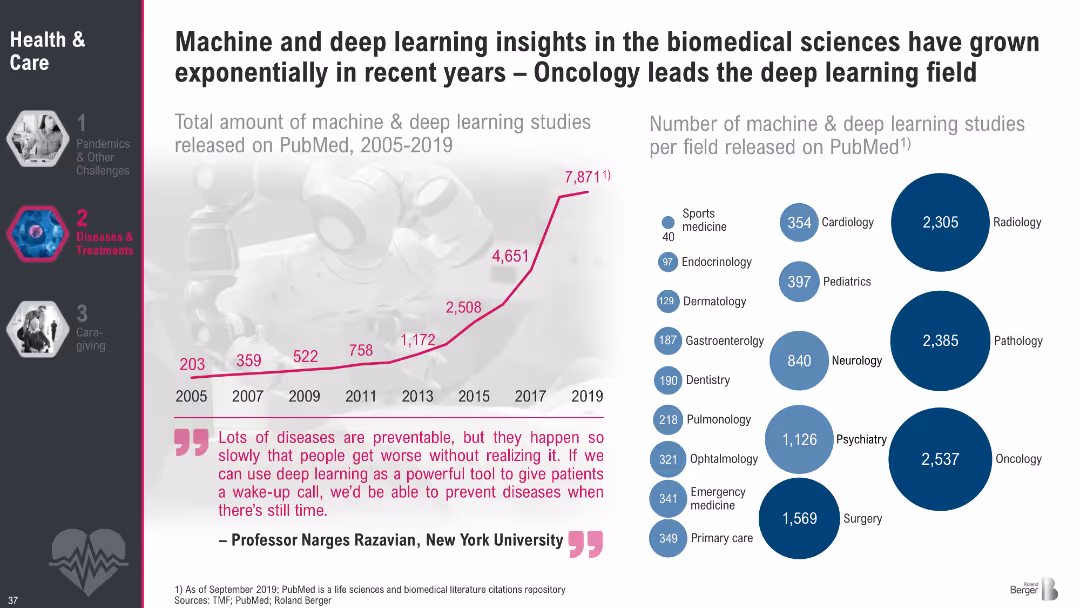
Left side shows a rising line graph of deep learning studies on PubMed (2005–2019); right side has a bubble chart of studies per medical field. Includes a prominent quote at the bottom.
Market Analysis and Trends
Artificial Intelligence
This slide demonstrates the exponential increase in machine and deep learning applications in biomedical research, particularly in oncology. It visualizes growth trends and fields most impacted, underscoring the transformative potential of AI in healthcare diagnostics and treatment.
deep learning, biomedical AI, oncology, PubMed, medical research, AI applications, machine learning, healthcare innovation
false
Market Analysis and Trends
Artificial Intelligence
Multiple Chart
Roland Berger
Add to my slides
Remove from favorites
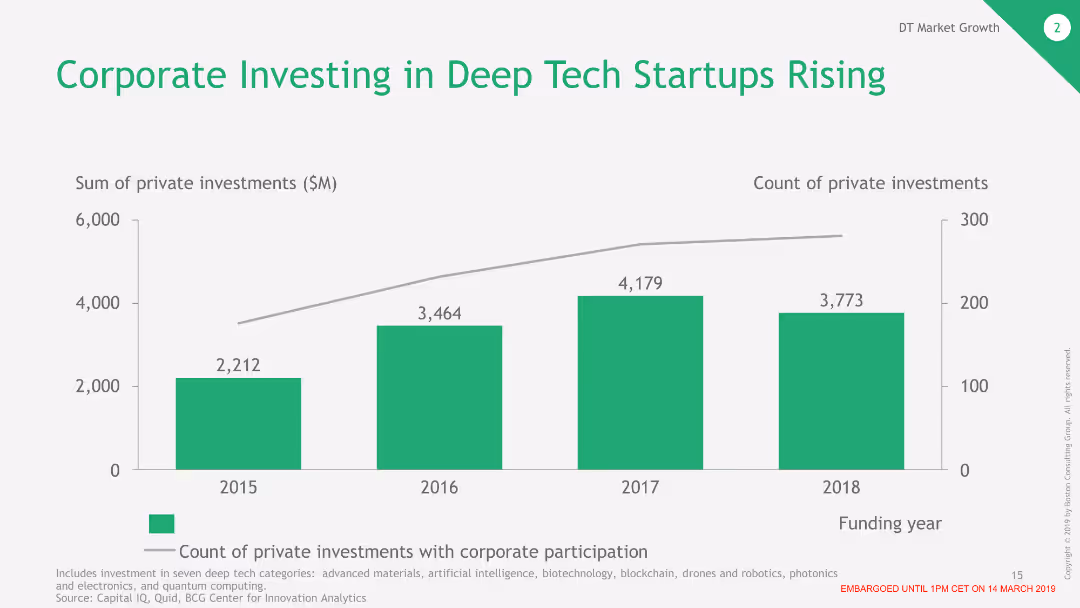
The slide features a column chart illustrating the rise in corporate investments in deep tech startups from 2015 to 2018. The columns represent the sum of private investments with corporate participation, shown in millions of dollars.
Investment Analysis
Financial Services
This slide provides data on the increasing trend of corporate investments in deep tech startups over the years. It shows the growing financial involvement of corporations in the deep tech sector and the rising number of investments.
Deep Tech, Corporate Investment, Startups, Financial Growth, Private Investment Trends
false
Investment Analysis
Financial Services
Single Chart
BCG
Add to my slides
Remove from favorites
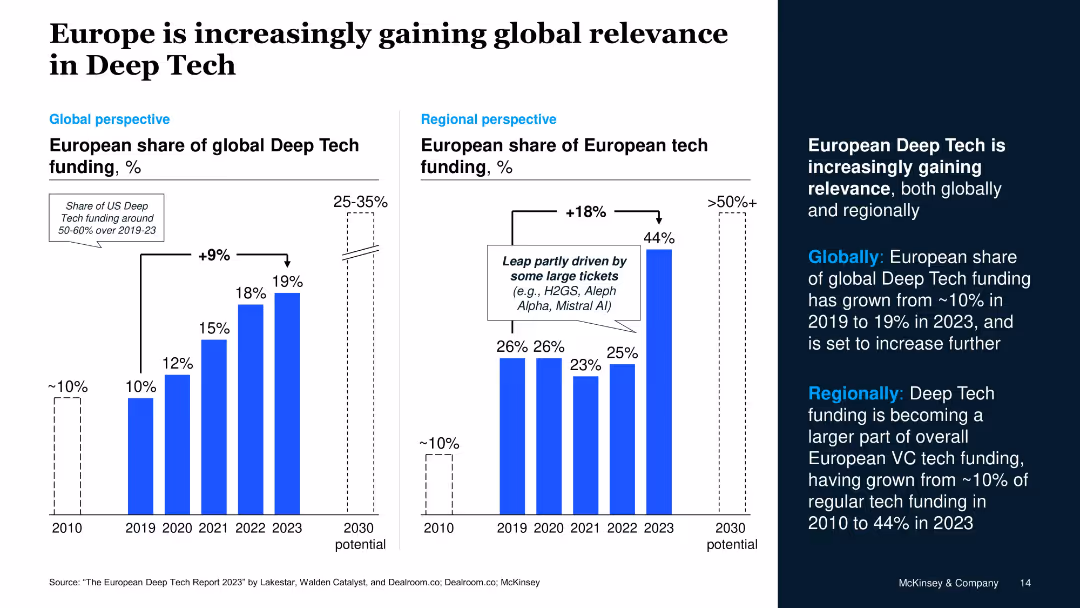
Two bar graphs comparing funding shares globally and regionally, with growth projections to 2030
Strategic Planning
Technology & Software
The slide shows Europe's growing global and regional relevance in Deep Tech. European global Deep Tech funding share rose from 10% in 2019 to 19% in 2023, and its share of European tech funding reached 44%, with projections exceeding 50%.
Deep Tech, Europe, global relevance, VC funding, market growth, projections
false
Strategic Planning
Technology & Software
Multiple Chart
McKinsey
Add to my slides
Remove from favorites
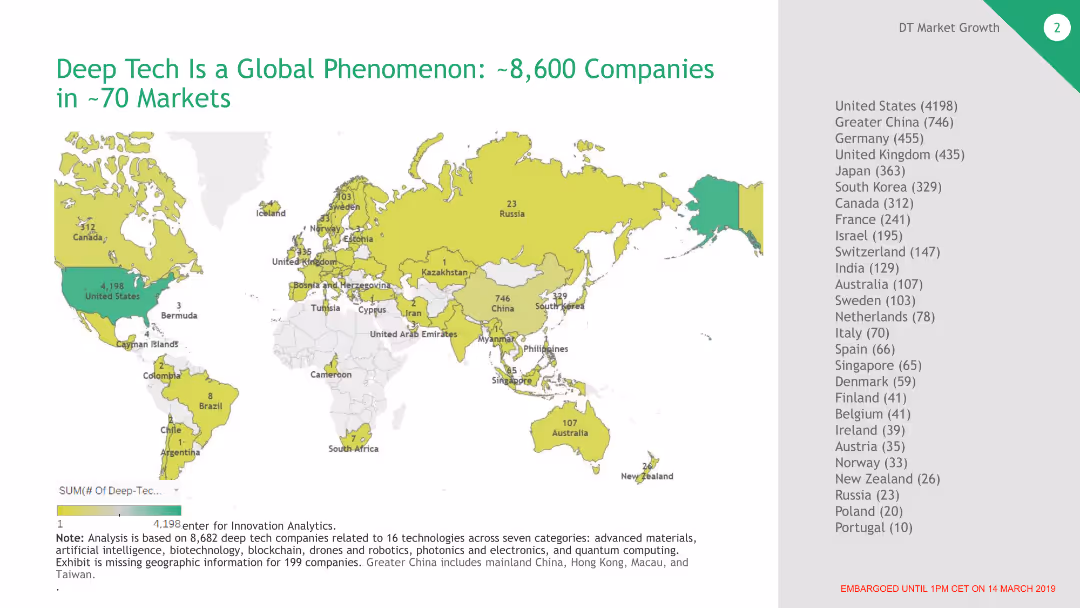
The slide contains a world map highlighting countries with deep tech companies. The map is color-coded to indicate the number of companies in each region, with a legend and a list of countries and their respective company counts on the right.
Industry Overview
Technology & Software
This slide demonstrates the global distribution of deep tech companies, showing that there are around 8,600 companies spread across 70 markets. It emphasizes the widespread adoption and development of deep tech worldwide.
Deep Tech, Global, Companies, Markets, Distribution, Map, Industry
false
Industry Overview
Technology & Software
Graphic
BCG
Add to my slides
Remove from favorites
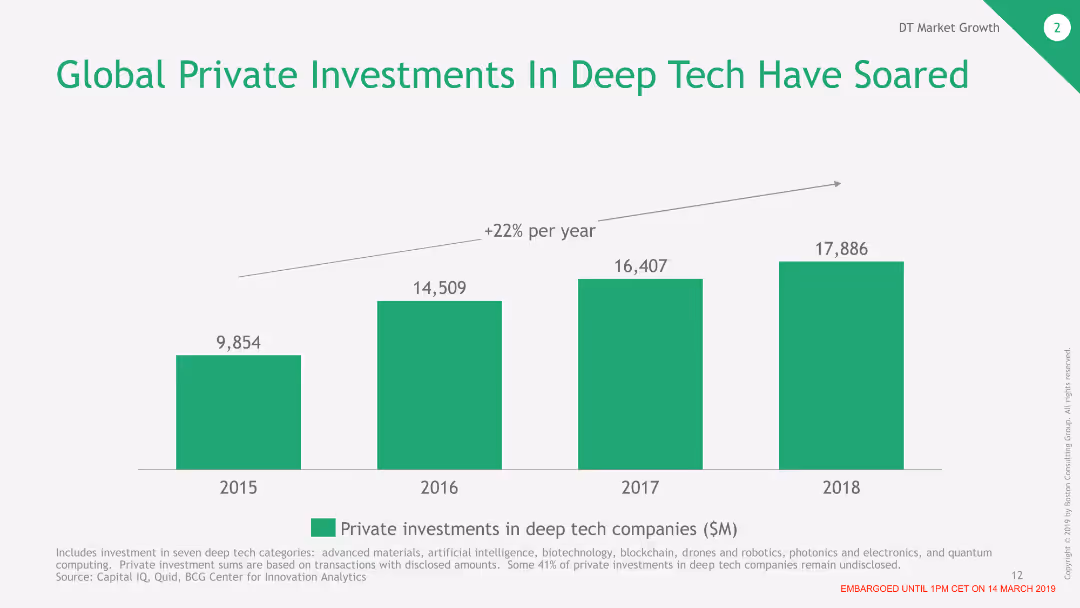
The slide features a column chart showing the increase in global private investments in deep tech from 2015 to 2018. The columns are color-coded and display the investment amounts in millions of dollars for each year.
Market Analysis and Trends
Financial Services
This slide presents data on the rising global private investments in deep tech companies over four years. It highlights a significant increase, indicating growing interest and confidence in deep tech sectors.
Deep Tech, Investment, Global, Private Investments, Growth, Financial Trends
false
Market Analysis and Trends
Financial Services
Single Chart
BCG
Add to my slides
Remove from favorites
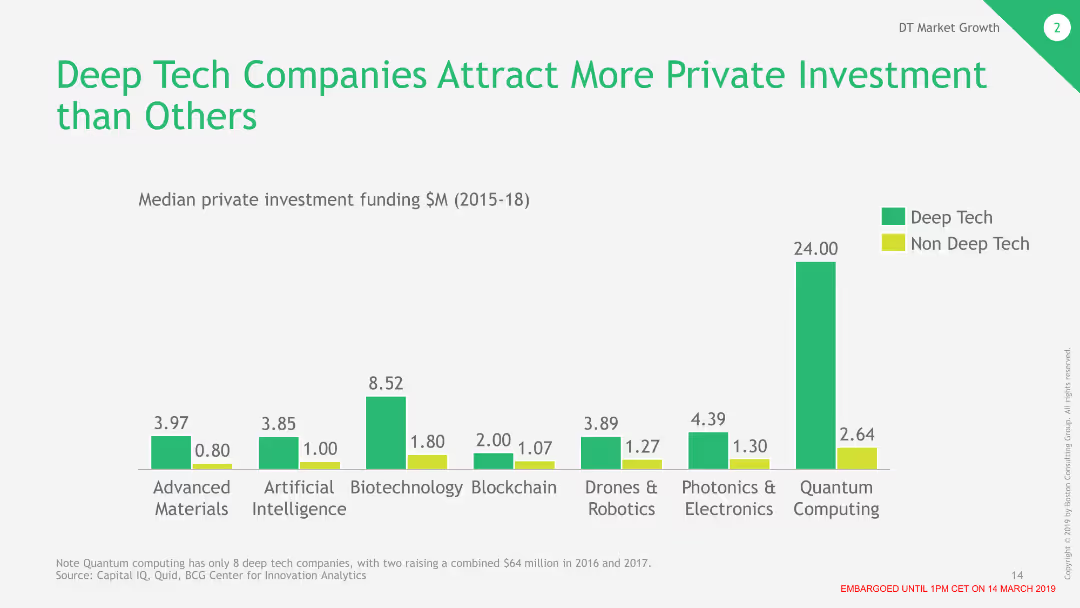
The slide shows a column chart comparing median private investment funding between deep tech companies and non-deep tech companies from 2015 to 2018. Deep tech categories are listed with higher median investments shown in green columns.
Investment Analysis
Financial Services
This slide highlights that deep tech companies attract significantly more private investment compared to non-deep tech companies. It provides a comparative analysis of investment amounts across various tech categories.
Deep Tech, Investment, Private Funding, Comparison, Financial Analysis, Median Funding
false
Investment Analysis
Financial Services
Single Chart
BCG
Add to my slides
Remove from favorites
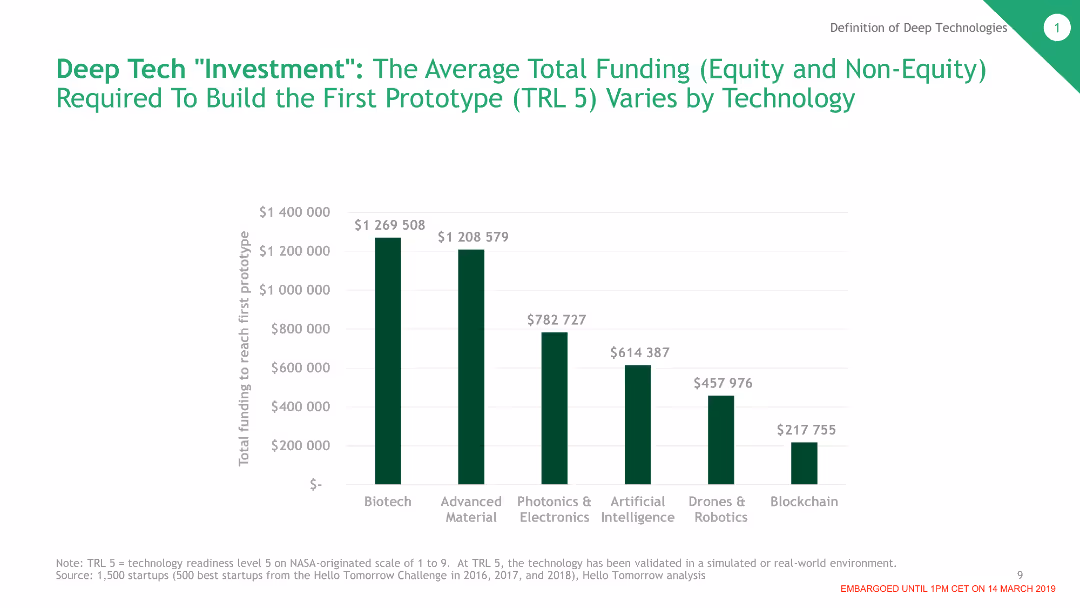
The slide includes a column chart displaying the average total funding required to build the first prototype for various deep tech categories. Each category's funding level is represented by different heights of columns.
Investment Analysis
Financial Services
This slide shows the Average Total Funding (Equity and Non-Equity) Required To Build the First Prototype (TRL 5) Varies by Technology
Deep Tech, Investment, Prototype, Funding, Biotech, AI, Robotics, Blockchain
false
Investment Analysis
Financial Services
Single Chart
BCG
Add to my slides
Remove from favorites
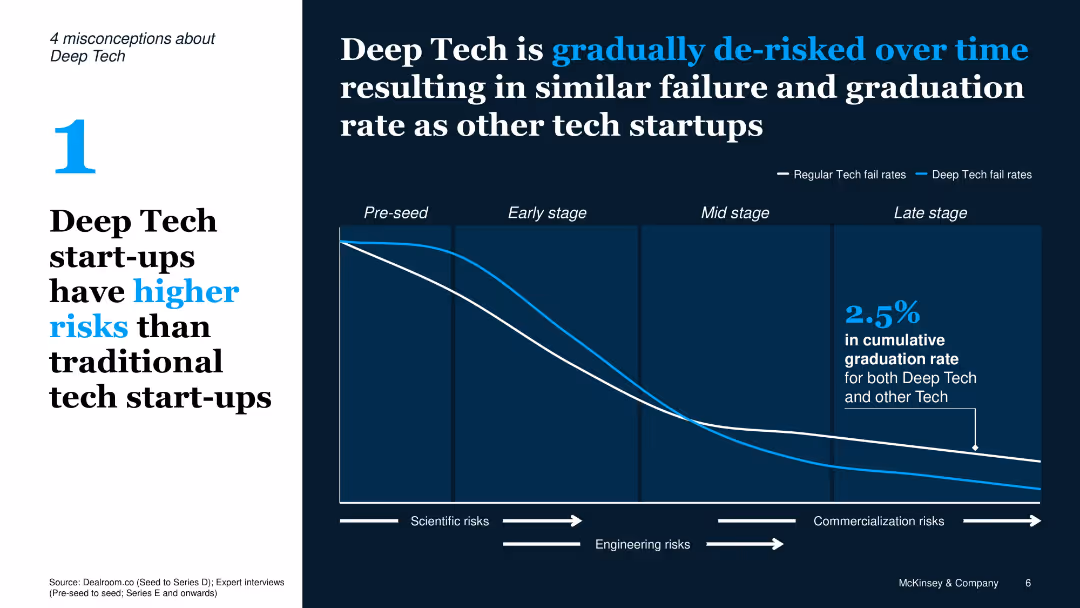
Split layout with misconception text on left and chart on right; line graph comparing fail rates of Deep Tech vs traditional tech over lifecycle stages
Risk Assessment and Management
Artificial Intelligence
Refutes the notion that Deep Tech has higher failure rates by showing it becomes de-risked over time; line graph compares failure rates of tech startups through different stages.
Deep Tech, risks, failure rate, tech lifecycle, de-risked, chart, misconception
false
Risk Assessment and Management
Artificial Intelligence
Single Chart
McKinsey
Add to my slides
Remove from favorites
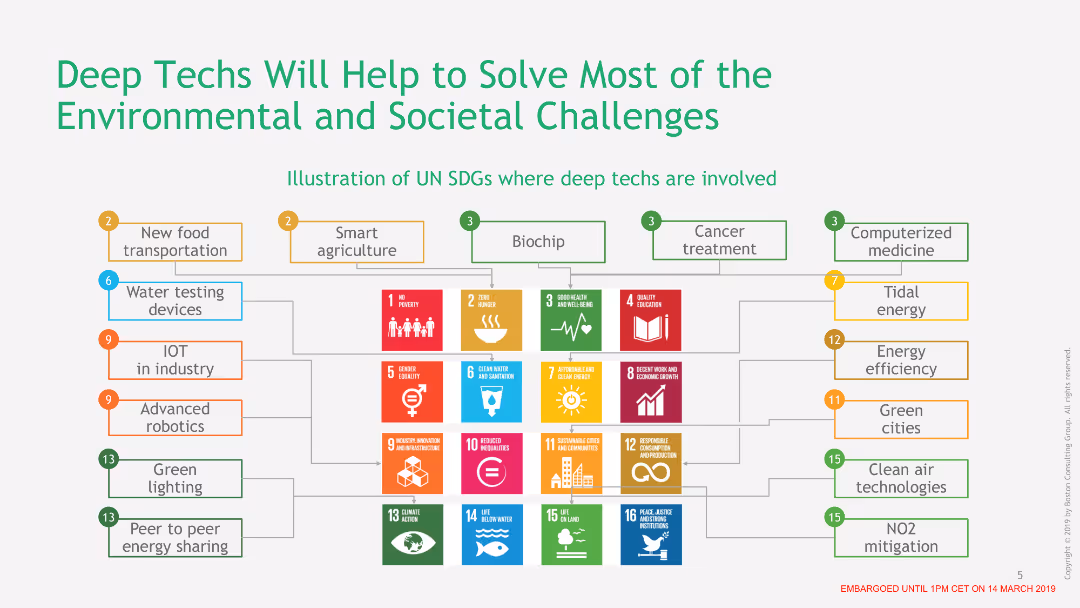
The slide shows a diagram illustrating the UN Sustainable Development Goals (SDGs) where deep technologies are involved. Various icons and arrows connect different tech solutions to specific SDGs.
Technology and Digital Transformation
Technology & Software
This slide explains how deep technologies like smart agriculture, biochips, and advanced robotics can help achieve various UN SDGs. It demonstrates the potential impact of these technologies on environmental and societal challenges.
Deep Tech, SDGs, Environmental, Societal, Technology, Impact
false
Technology and Digital Transformation
Technology & Software
Diagram
BCG
Add to my slides
Remove from favorites
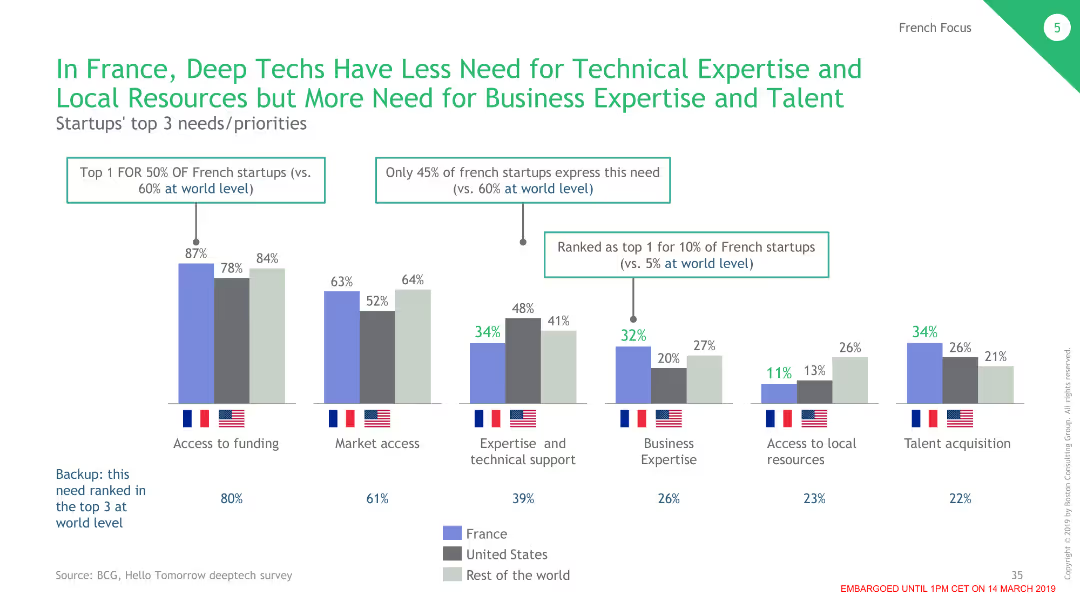
This slide includes multiple column charts comparing the needs and priorities of deep tech startups in France, the USA, and the RoW.
Operational Efficiency
Professional Services
Examines the varied needs and priorities of deep tech startups in different regions, emphasizing business expertise and local resources.
deep tech, startups, needs, priorities, France
false
Operational Efficiency
Professional Services
Single Chart
BCG
Add to my slides
Remove from favorites
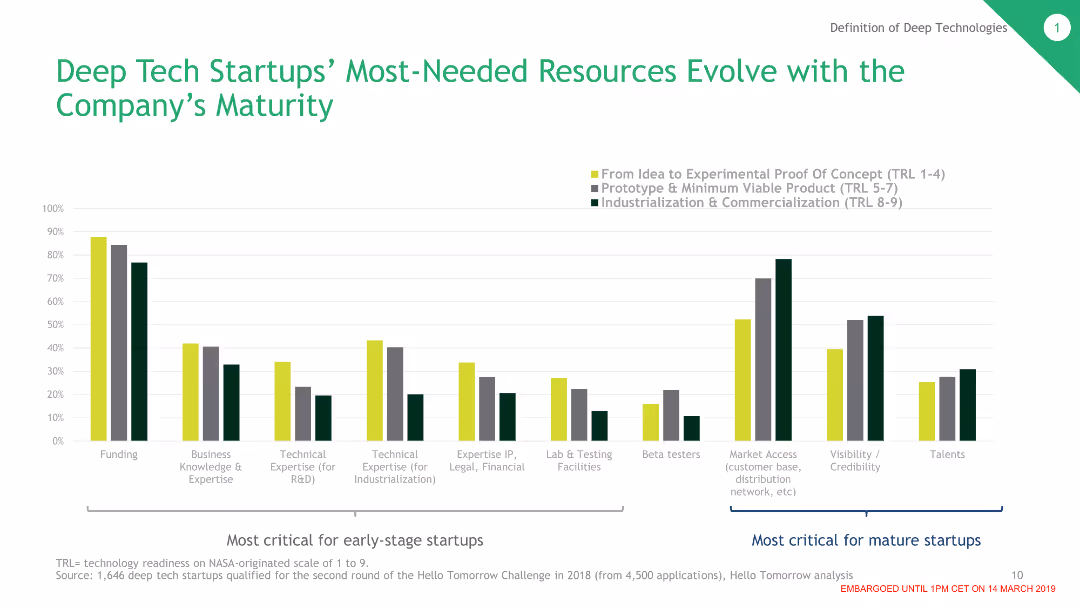
The slide shows a column chart indicating the most-needed resources for deep tech startups at different stages of maturity. Categories are color-coded and the chart shows varying needs from idea to experimental proof to commercialization.
Market Analysis and Trends
Technology & Software
This slide outlines the evolving resource needs for deep tech startups as they mature. It breaks down critical resources required at different stages, from initial idea and experimental proof to prototype and commercialization.
Deep Tech, Startups, Resources, Maturity, Funding, Expertise, Commercialization
false
Market Analysis and Trends
Technology & Software
Single Chart
BCG
Add to my slides
Remove from favorites
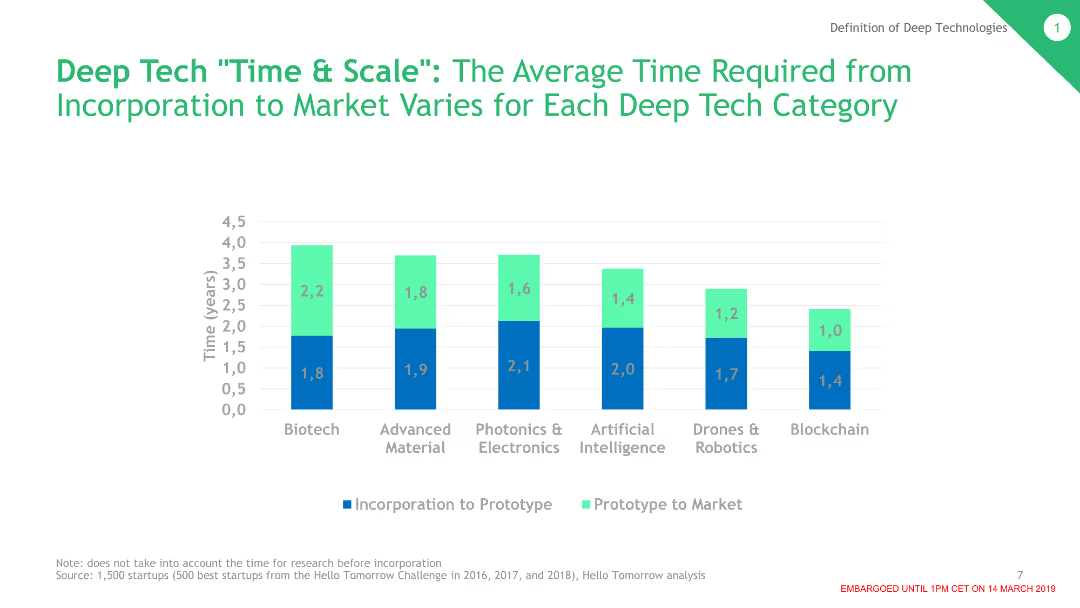
The slide contains a column chart showing the average time required from incorporation to market for various deep tech categories. Each category is represented with different colored columns indicating the stages from incorporation to prototype to market.
Technology and Digital Transformation
Technology & Software
This slide presents data on the time needed for different deep tech categories to go from incorporation to market. Categories include Biotech, Advanced Material, Photonics & Electronics, AI, Drones & Robotics, and Blockchain.
Deep Tech, Time to Market, Biotech, AI, Robotics, Blockchain
false
Technology and Digital Transformation
Technology & Software
Single Chart
BCG
Add to my slides
Remove from favorites
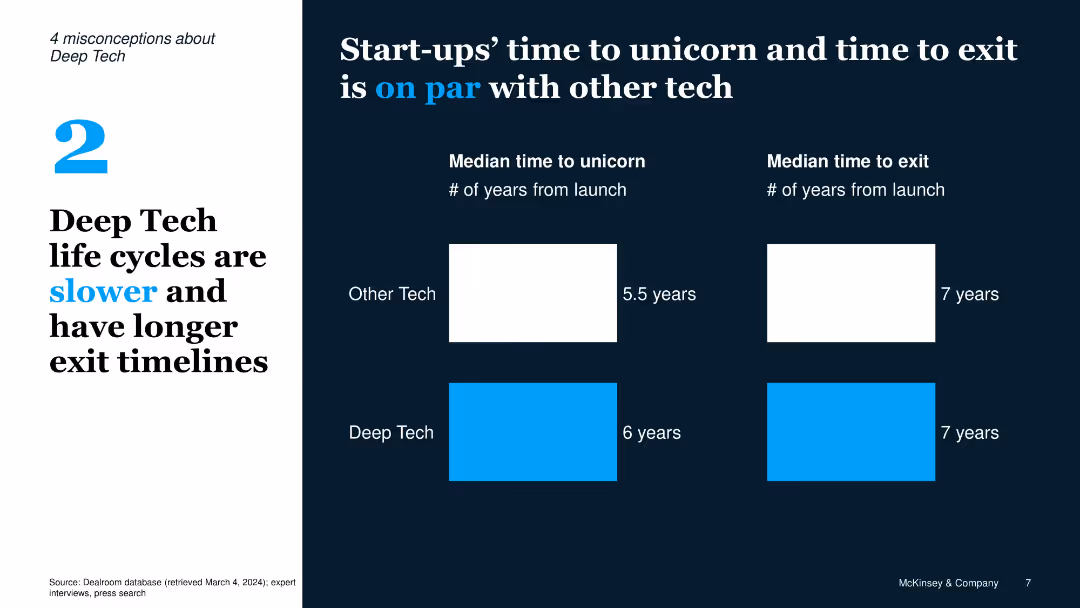
Two-column layout with text on left and infographic-style comparison on right; uses bars to compare median time to unicorn and exit
Strategic Planning
Artificial Intelligence
Dispels the myth that Deep Tech startups have longer life cycles; data shows time to unicorn and exit are nearly equal compared to traditional tech startups.
Deep Tech, unicorn, exit, timeline, comparison, misconception, lifecycle, startups
false
Strategic Planning
Artificial Intelligence
Single Chart
McKinsey
Add to my slides
Remove from favorites
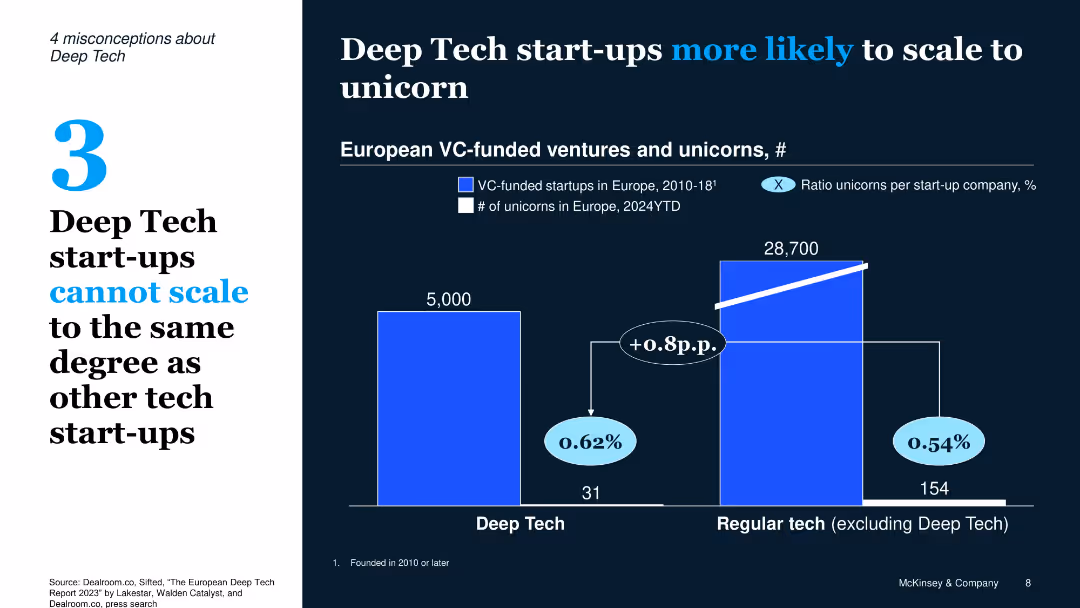
Dual-panel bar chart with bold contrast layout, white-on-dark theme, left-side callout with misconception number
Market Analysis and Trends
Technology & Software
The slide debunks the myth that Deep Tech start-ups can't scale, showing they have a slightly higher chance (0.62%) of becoming unicorns compared to regular tech (0.54%) based on VC-funded ventures and unicorn counts in Europe.
Deep Tech, unicorn, scalability, VC funding, Europe, start-ups, market analysis
false
Market Analysis and Trends
Technology & Software
Single Chart
McKinsey
Add to my slides
Remove from favorites
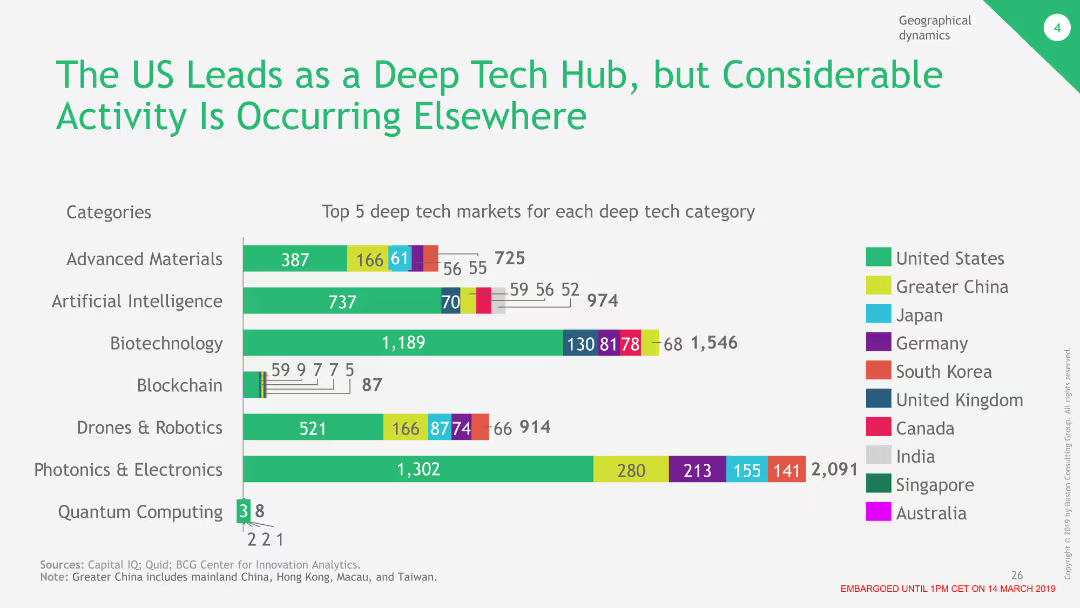
The slide contains a column chart showing the top 5 deep tech markets for various categories like advanced materials, AI, and biotechnology, with different colors representing different regions.
Market Analysis and Trends
Technology & Software
This slide compares the activity levels in deep tech across different countries, showing that while the US leads in several categories, other regions are also significant players in the market.
Deep Tech, US, Market, Comparison, Regions
false
Market Analysis and Trends
Technology & Software
Single Chart
BCG
Add to my slides
Remove from favorites
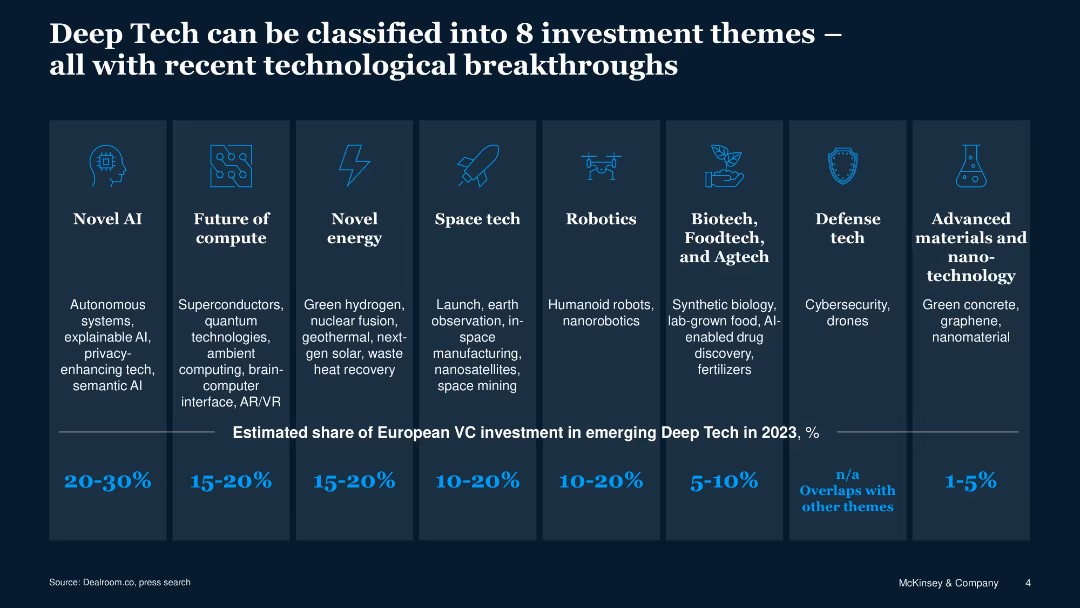
Grid layout with 8 vertical panels, each describing a different Deep Tech category; includes icons and text per panel
Product and Service Analysis
Artificial Intelligence
Categorizes Deep Tech into 8 investment themes such as Novel AI, Future of Compute, Robotics, and Space Tech, and shows their share in European VC investment in 2023.
Deep Tech, VC, themes, investment, AI, robotics, space, compute, biotech
false
Product and Service Analysis
Artificial Intelligence
Pillar
McKinsey
Add to my slides
Remove from favorites
Line charts showing "Global Default Rates and Distress Ratios" with separate lines for "Default Rate," "HY Distress Ratio," and "Loan Distress Ratio" over time from 1998-2023.
Risk Assessment and Management
Financial Services
This slide indicates rising default rates even as signs of financial distress are declining, useful for risk management and credit analysis.
default rates, distress ratios, financial risk
false
Risk Assessment and Management
Financial Services
Single Chart
Morgan Stanley
Add to my slides
Remove from favorites
It has a mix of column charts, a line chart, and text sections. The color red is used to accentuate key figures and headers. Charts are labeled for clarity.
Market Analysis and Trends
Industrial & Manufacturing
Displays the growing revenues and profitability in the Defence Electronics & Security sector, with historical data from 2018 to 2021 and future outlooks based on orders and EBITA.
defence, electronics, security, orders, revenues, EBITA, profitability improvement, financial outlook
false
Market Analysis and Trends
Industrial & Manufacturing
Multiple Chart
Goldman Sachs
Add to my slides
Remove from favorites
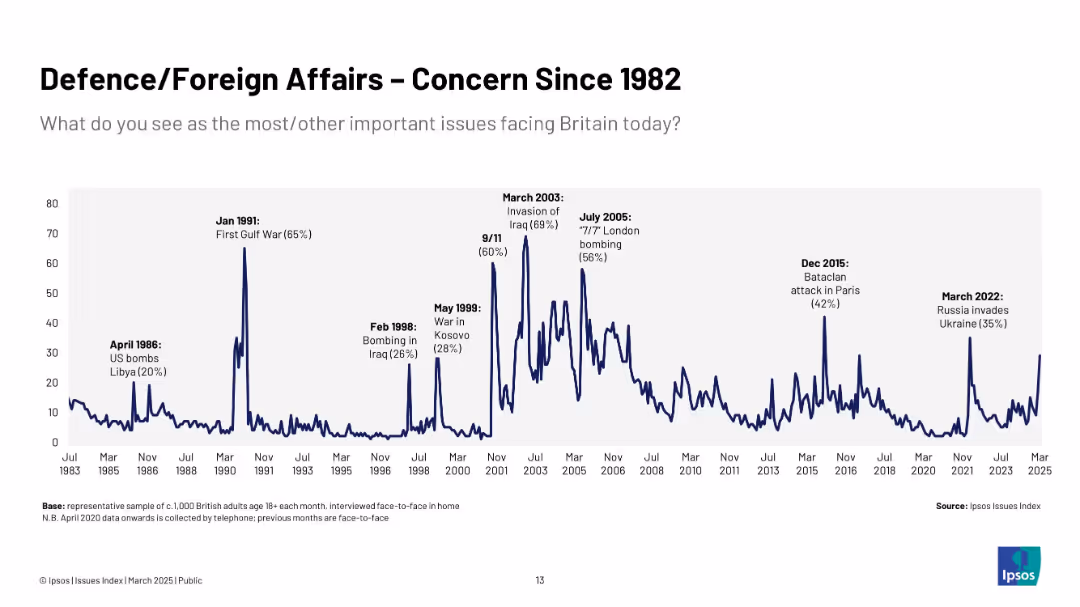
Line graph with peak annotations; horizontal time axis (1983–2025) and vertical percentage scale (0–80).
Market Analysis and Trends
Government & Public Sector
This slide tracks British public concern over defence and foreign affairs since 1982, showing spikes during major global conflicts and terrorist attacks such as the Gulf War, 9/11, and Russia’s invasion of Ukraine.
defence, foreign policy, public concern, war, terrorism, UK, Ipsos, international affairs, historical trend, geopolitical impact
false
Market Analysis and Trends
Government & Public Sector
Single Chart
IPSOS
Add to my slides
Remove from favorites
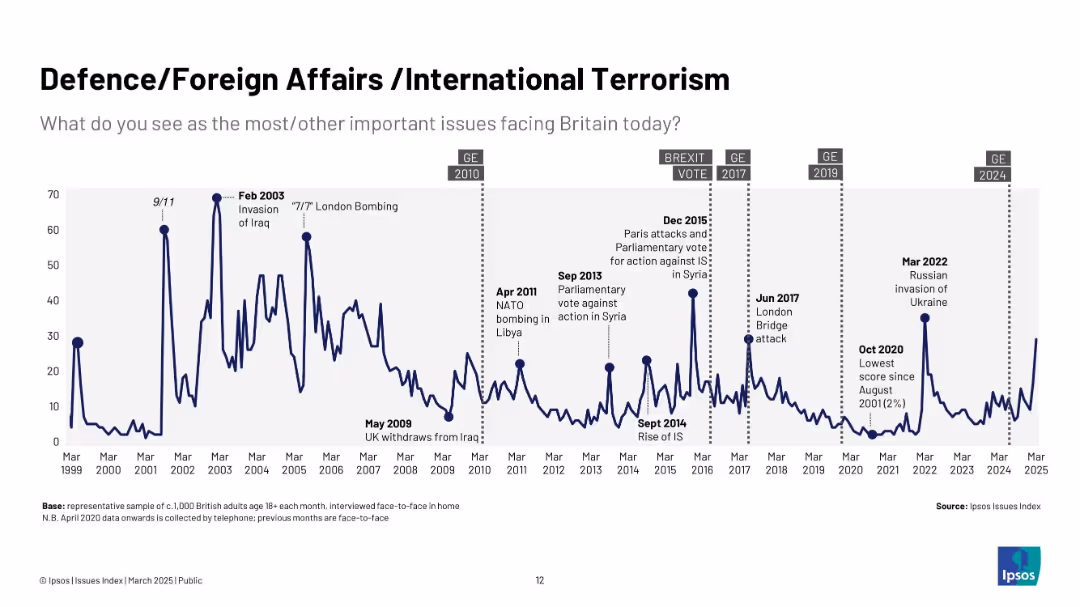
Navy blue line chart (1999–2025) with event markers for terrorism, wars, and global crises (e.g., Ukraine invasion); fluctuating concern levels.
Market Analysis and Trends
Government & Public Sector
Examines public concern over foreign threats and defence. Peaks align with global crises such as wars, terrorist attacks, and geopolitical instability, with notable fluctuations in urgency over the years.
defence, terrorism, foreign affairs, Ipsos, Ukraine, Iraq, Syria, war, UK
false
Market Analysis and Trends
Government & Public Sector
Single Chart
IPSOS
Add to my slides
Remove from favorites
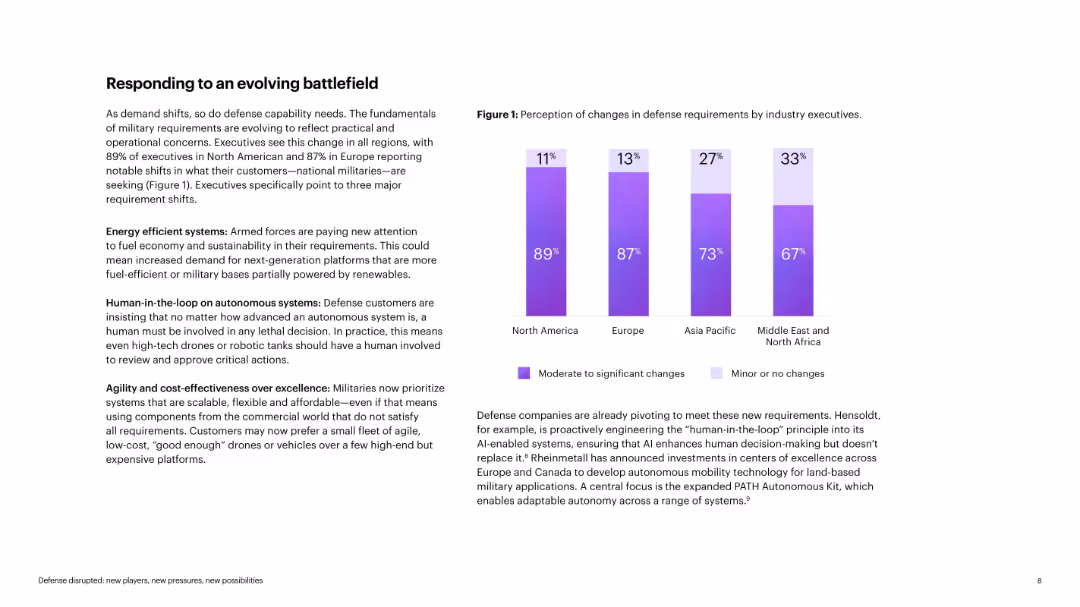
Text-heavy slide with purple bar chart showing perception of defense shifts by region
Technology and Digital Transformation
Industrial & Manufacturing
The slide analyzes evolving global military needs: energy efficiency, autonomy with human oversight, and cost-effective systems. A bar chart shows regional consensus on the degree of change. Insights focus on how defense companies are adapting products and technology to meet emerging customer expectations.
defense, battlefield, innovation, autonomy, military, sustainability, procurement, strategy
false
Technology and Digital Transformation
Industrial & Manufacturing
Mixed Chart
Accenture
Add to my slides
Remove from favorites
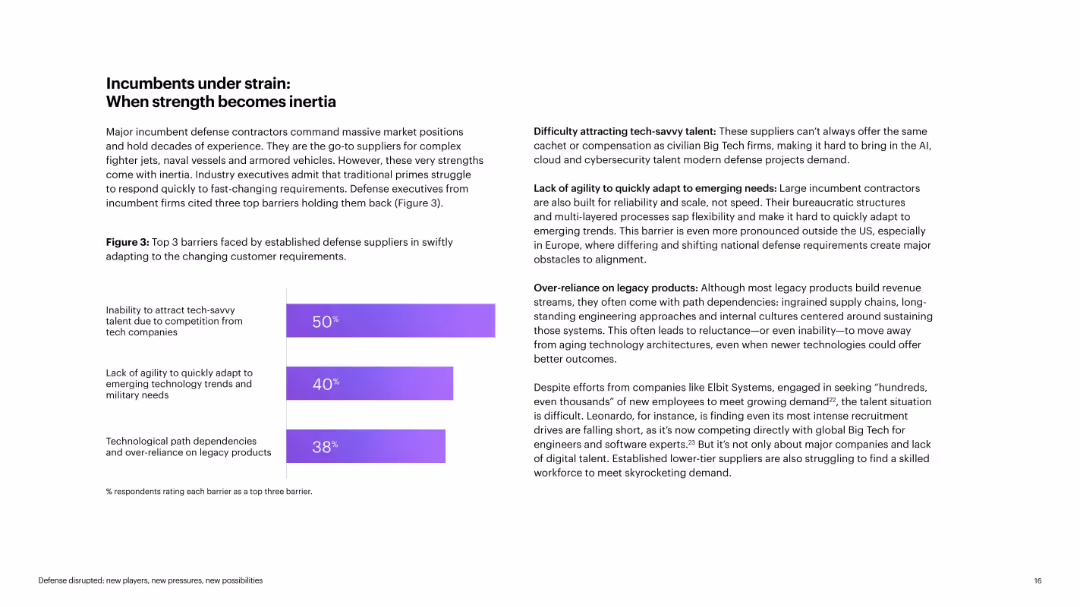
Two-column layout with left side featuring a horizontal bar chart and summary; right side includes detailed text with bold subheadings. Clean design with purple-accented chart.
Strategic Planning
Government & Public Sector
Highlights the inertia in incumbent defense suppliers, naming top barriers: inability to attract tech talent, lack of agility, and over-reliance on legacy tech. It emphasizes how these hinder rapid response to evolving military needs.
defense, incumbents, tech talent, agility, legacy systems, barriers
false
Strategic Planning
Government & Public Sector
Mixed Chart
Accenture
Add to my slides
Remove from favorites
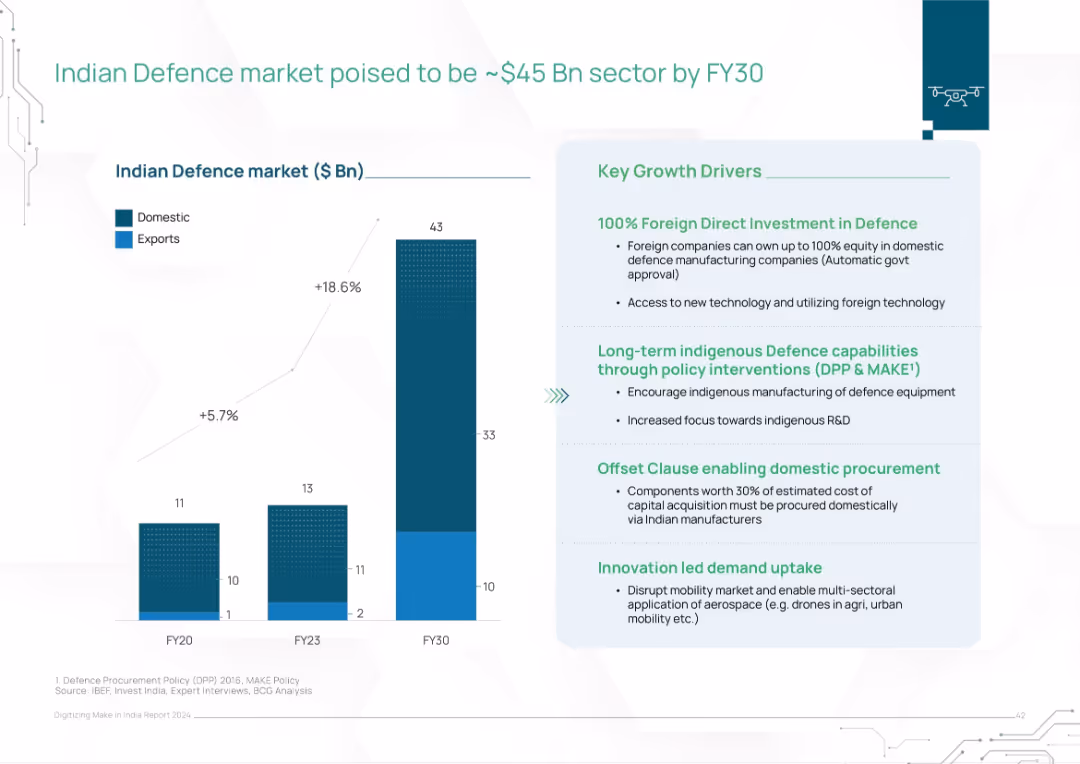
Vertical bar graph of domestic vs. export defense market; key drivers listed in a right-hand box
Investment Analysis
Government & Public Sector
The slide forecasts India’s defense market to grow to $45B by FY30, driven by FDI, indigenous manufacturing policies (DPP & MAKE), and innovation demand. A bar chart shows domestic and export splits over time, with strong CAGR. Offset policies and local R&D promotion are emphasized.
defense market, India, FDI, exports, MAKE policy, offset clause, R&D, FY30, military, manufacturing
false
Investment Analysis
Government & Public Sector
Mixed Chart
BCG
Add to my slides
Remove from favorites
The slide compares two aspects: market trends and defense budgets across different regions, using a map and red text boxes. A red outline frames the slide's main message.
Market Analysis and Trends
Industrial & Manufacturing
Analyzes defense market trends and budget growth to identify commercial opportunities. It provides a global outlook on market potential and the company’s position in it. This slide is likely used in market analysis and strategic planning sessions.
Defense Market, Trends, Commercial Opportunities, Budget Growth, Strategic Planning
false
Market Analysis and Trends
Industrial & Manufacturing
Boxed
Goldman Sachs
Add to my slides
Remove from favorites
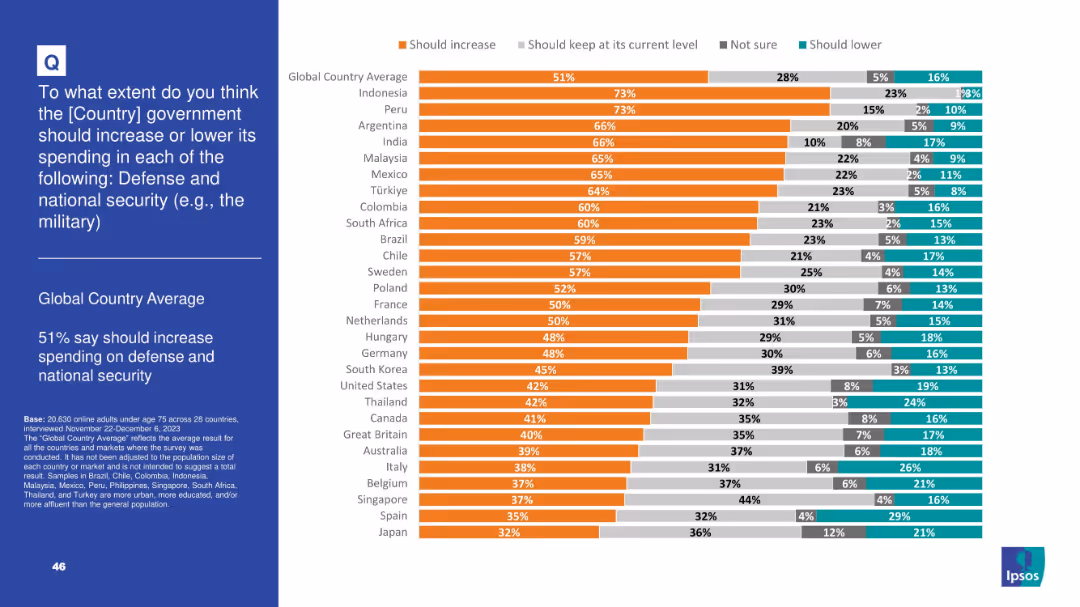
Orange-dominant bar chart showing country-level agreement on boosting defense spending; includes categories: increase, same, unsure, decrease
Strategic Planning
Government & Public Sector
A smaller majority (51%) globally favor increased defense and national security spending. Countries like Indonesia and Peru show highest support, while Japan and Spain express the lowest. Indicates regional variations in perceived threat levels.
defense, military, national security, public opinion, government budget, threat perception, Ipsos, geopolitics, spending
false
Strategic Planning
Government & Public Sector
Mixed Chart
IPSOS
Add to my slides
Remove from favorites
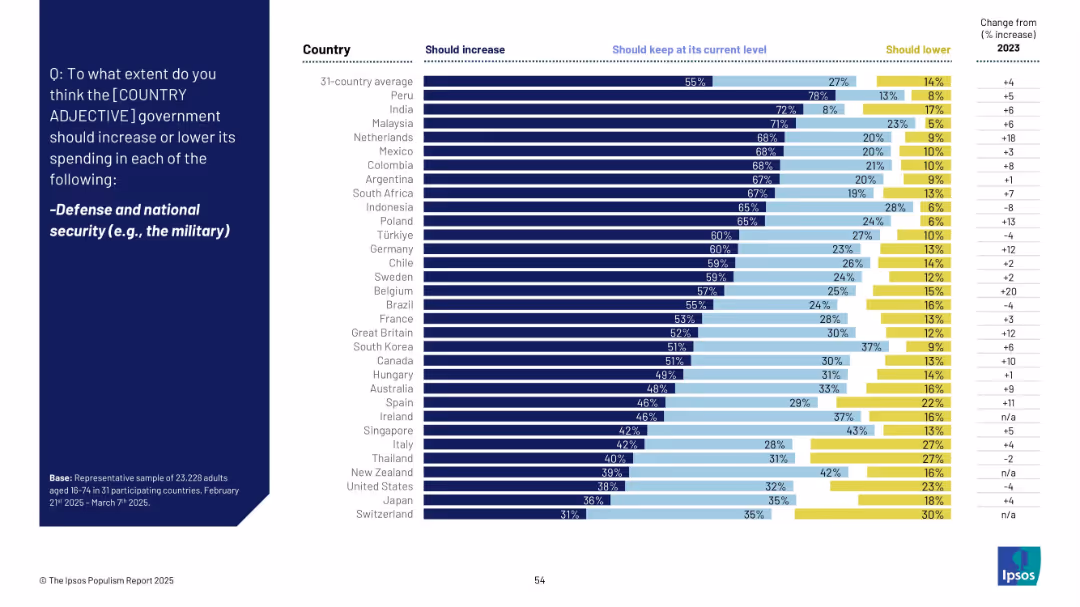
Horizontal bar chart with support levels for increasing, maintaining, or lowering defense budgets, and change from 2023.
Strategic Planning
Government & Public Sector
Public opinion is mixed on increasing military and defense spending. While the global average sits at 55%, some countries like Peru and India show strong support, while others like Switzerland and Japan lean toward maintaining or reducing budgets.
defense, national security, military, government budget, public opinion, Ipsos, strategy, bar chart
false
Strategic Planning
Government & Public Sector
Mixed Chart
IPSOS
Add to my slides
Remove from favorites
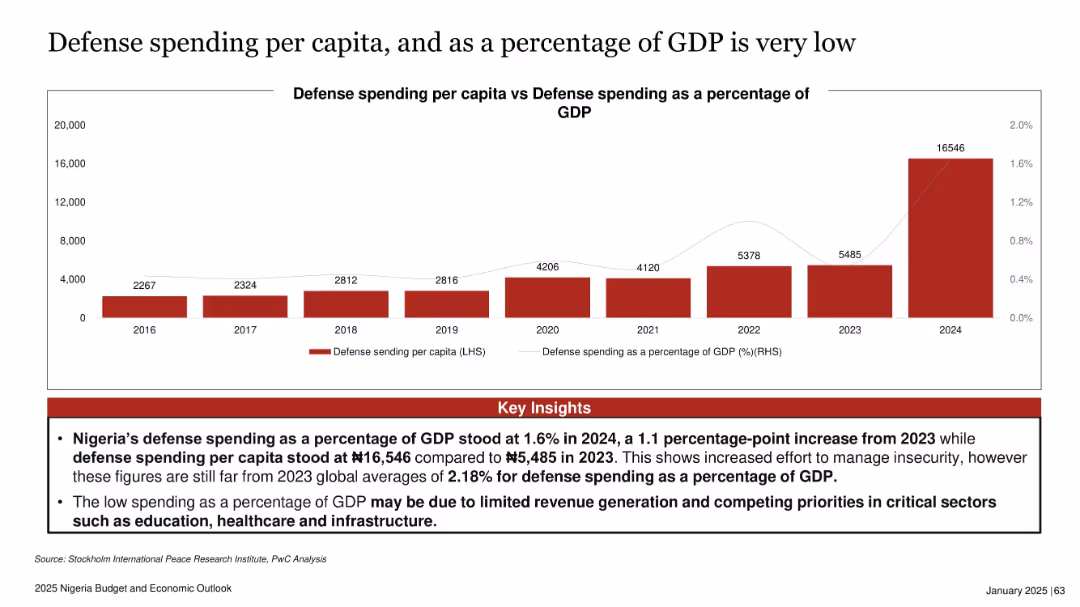
Dual-axis bar and line chart with red bars for per capita spending and a thin grey line for % of GDP
Financial Performance
Government & Public Sector
This slide compares Nigeria’s defense spending per capita with its GDP percentage from 2016 to 2024. While there’s a sharp increase in per capita spending in 2024, it still remains below global averages. Insights explain that low spending relative to GDP is due to revenue challenges and competing sectoral priorities like education and infrastructure.
defense, Nigeria, GDP, budget, security, spending, inflation, infrastructure, public finance
false
Financial Performance
Government & Public Sector
Mixed Chart
PwC/Strategy&
Add to my slides
Remove from favorites
Features several column charts illustrating the percentage of deficient ratings in talent management by line of business. The charts are color-coded by business line, with detailed legends and labels to clarify the data.
Human Resources and Talent Management
Financial Services
This slide provides insights into areas where talent management is lacking within various lines of underwriting business, such as recruitment and training. Useful for targeted improvement initiatives in HR practices within the financial sector.
deficient, talent management, underwriting, HR, recruitment, training, financial services
false
Human Resources and Talent Management
Financial Services
Mixed Chart
Accenture
Add to my slides
Remove from favorites
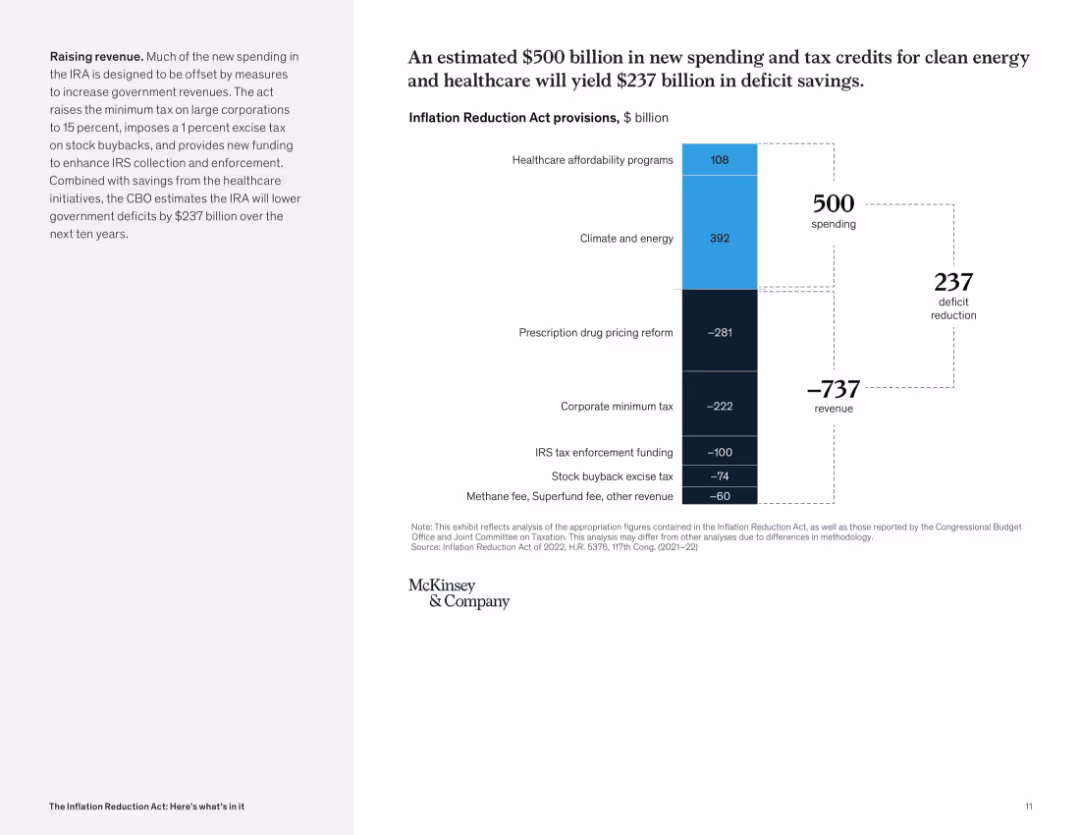
Waterfall chart comparing spending and revenue measures; large contrast between top and bottom segments; left panel describes fiscal goals.
Financial Performance
Government & Public Sector
The slide illustrates how the IRA balances $500B in new spending with $737B in revenue measures, resulting in a projected $237B deficit reduction. Key policies include tax reforms and enhanced IRS enforcement.
deficit reduction, tax revenue, healthcare, clean energy, spending, government finance
false
Financial Performance
Government & Public Sector
Mixed Chart
McKinsey
Add to my slides
Remove from favorites
The slide features a donut chart displaying the percentage of people who have seen DeFi advertisements from crypto trading platforms. It includes a breakdown of responses on the left. The layout is moderate in complexity.
Technology and Digital Transformation
Financial Services
This slide shows the percentage of people who recall seeing advertisements from crypto trading platforms about DeFi, with a significant portion not remembering any such ads. It aims to gauge the reach of these advertisements.
DeFi, crypto, advertising, platforms, recall
false
Technology and Digital Transformation
Financial Services
Mixed Chart
IPSOS
Add to my slides
Remove from favorites
The slide features a column chart on the right displaying the percentage of people using DeFi applications for various purposes. It is accompanied by a list of activities on the left. The layout is moderately complex.
Technology and Digital Transformation
Financial Services
This slide outlines the use of DeFi applications among crypto asset holders, with earning yields and minting NFTs being popular activities. It provides insights into DeFi usage trends.
DeFi, crypto, applications, activities, trends
false
Technology and Digital Transformation
Financial Services
Mixed Chart
IPSOS
Add to my slides
Remove from favorites
The slide features a column chart showing various DeFi uses for crypto assets in 2022 and 2023, with percentage breakdowns for activities like yield earning.
Market Analysis and Trends
Financial Services
It explores how crypto owners engage in DeFi activities, such as yield earning and trading on decentralized exchanges, with comparative data from 2022 to 2023.
DeFi, crypto assets, 2023, 2022, yield earning, decentralized exchanges, trading, activities
false
Market Analysis and Trends
Financial Services
Mixed Chart
IPSOS
Add to my slides
Remove from favorites
This slide showcases a column chart comparing awareness of DeFi marketing from crypto trading platforms between 2022 and 2023, with percentages of responses.
Market Analysis and Trends
Financial Services
It presents data on the awareness of DeFi marketing, showing a drop in people recalling such ads, and highlighting differences across age and gender demographics.
DeFi, crypto trading platforms, marketing, 2023, 2022, awareness, demographics, ads
false
Market Analysis and Trends
Financial Services
Mixed Chart
IPSOS
Add to my slides
Remove from favorites
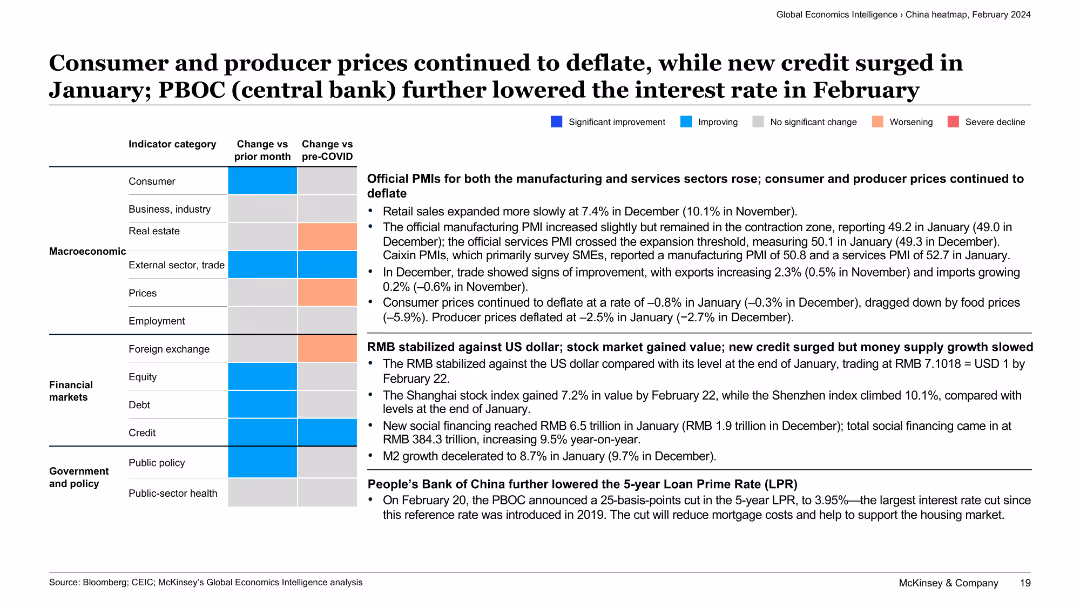
The slide presents a categorized summary of various economic indicators with text descriptions. Color-coded boxes indicate the direction and extent of changes for each category.
Market Analysis and Trends
Financial Services
This slide discusses the continued deflation of consumer and producer prices, the stabilization of RMB against the US dollar, and the People’s Bank of China’s interest rate cut, providing a comprehensive view of economic trends in China.
deflation, consumer prices, producer prices, RMB stabilization, interest rate cut
false
Market Analysis and Trends
Financial Services
Table
McKinsey
Add to my slides
Remove from favorites
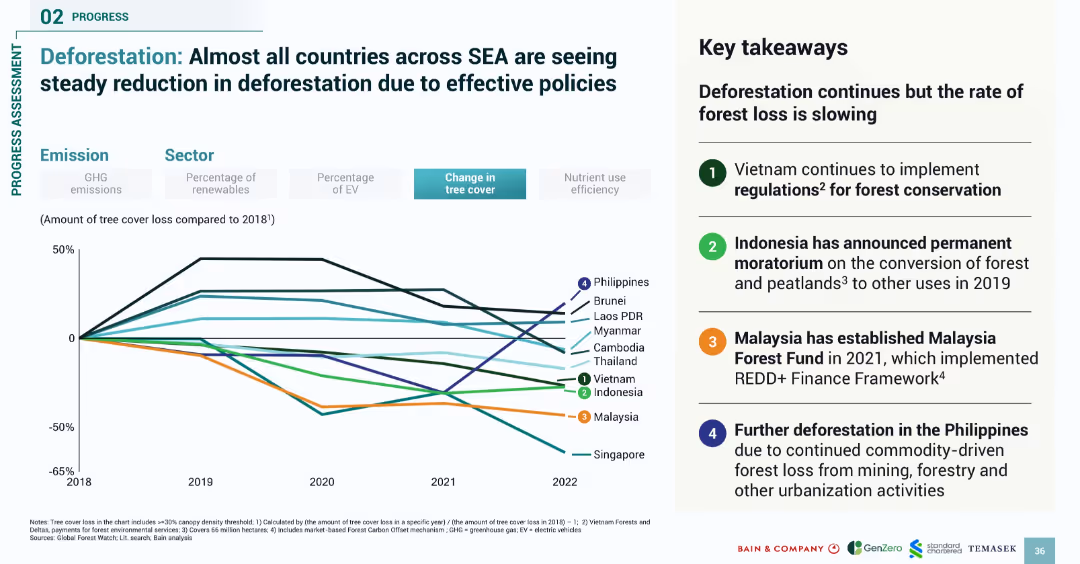
Line graph tracking tree cover loss (2018–2022) across countries; takeaways on the right
Risk Assessment and Management
Environmental Services & Sustainability
Tracks deforestation trends in Southeast Asia, showing a general reduction in tree cover loss due to improved regulations and conservation policies. Indonesia, Vietnam, and Malaysia show strong declines, while the Philippines experiences continued forest loss from industrial activity.
deforestation, SEA, forest conservation, tree cover, policy impact, environmental risk
false
Risk Assessment and Management
Environmental Services & Sustainability
Mixed Chart
Bain
Add to my slides
Remove from favorites
This slide visually maps out how employee needs evolve over time, with specific focus on various career stages. It uses a timeline format, complemented by icons representing different workforce segments. The layout includes side texts and a central illustrative panel that details the changing priorities and expectations of employees at each career phase.
Human Resources and Talent Management
Professional Services
Highlights the importance of recognizing the dynamic and diverse needs of employees throughout their careers, suggesting tailored approaches to DEI that address these varying requirements. It encourages companies to adopt flexible and inclusive strategies that acknowledge the unique challenges and aspirations of different employee groups.
DEI, career development, employee needs, workforce diversity, talent management, inclusive strategies
false
Human Resources and Talent Management
Professional Services
Linear Flow
BCG
Add to my slides
Remove from favorites
Features an individual making adjustments to machinery, symbolizing proactive engagement. Includes statistics about public DEI commitments and funding.
Regulatory and Compliance
Professional Services
Highlights recent trends in DEI commitments among multinational companies and the importance of integrating DEI into business practices.
DEI, commitments, funding, multinational companies, business practices, equity
false
Regulatory and Compliance
Professional Services
Multiple Chart
Deloitte
Add to my slides
Remove from favorites
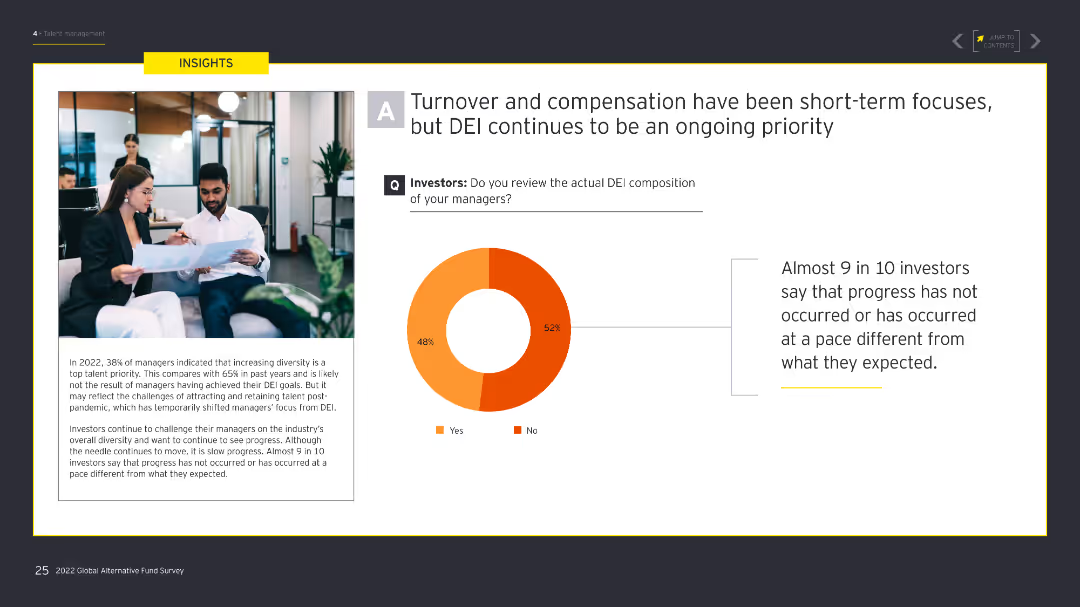
The slide includes a donut chart showing investors' review of DEI composition among managers. On the left, there is an image of two professionals reviewing documents. The donut chart uses orange and red shades to indicate responses.
Human Resources and Talent Management
Financial Services
The slide emphasizes that while turnover and compensation have been short-term focuses, DEI remains a critical ongoing priority for investors, with many reviewing DEI composition to assess managers' effectiveness.
DEI, compensation, turnover, investor review, talent management
false
Human Resources and Talent Management
Financial Services
Mixed Chart
EY
Add to my slides
Remove from favorites
The slide is divided into three main sections: Diversity, Equity, Inclusion, each represented with icons and color blocks. It includes bar charts and statistical data points highlighting various aspects of DEI implementation challenges and status across companies. The layout is structured with a mix of graphics and text to provide a clear visualization of the data.
Organizational Structure and Change
Professional Services
This slide presents the current state of DEI programs, illustrating their growth but also the narrow focus so far. It discusses the challenges in leadership representation, fairness in corporate practices, and inclusive cultures within organizations. The statistics aim to shed light on the effectiveness and reach of these programs within the corporate environment.
DEI, corporate strategy, leadership, inclusion, equity, diversity, statistical analysis, business strategy
false
Organizational Structure and Change
Professional Services
Pillar
BCG
Add to my slides
Remove from favorites
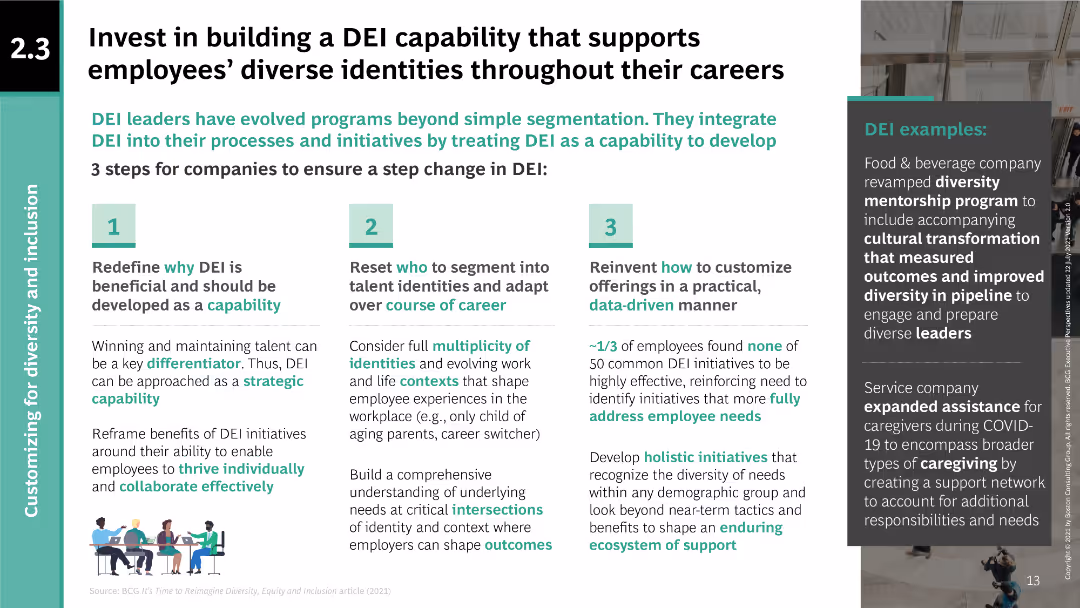
Three-step process diagram for building DEI capability; text explaining steps and examples.
Human Resources and Talent Management
Professional Services
Provides a framework for integrating DEI into company processes, highlighting steps to redefine, reset, and reinvent DEI initiatives to support diverse employee identities.
DEI, diversity, equity, inclusion, employee support, capability building, company processes, strategic initiatives, diversity mentorship
false
Human Resources and Talent Management
Professional Services
Linear Flow
BCG
Add to my slides
Remove from favorites
Describes DEI initiatives, including tying executive compensation to DEI goals and fostering an inclusive culture.
Strategic Planning
Professional Services
Highlights DEI as a key element of the firm's growth plans and client mission needs.
DEI, diversity, equity, inclusion, leadership, innovation
false
Strategic Planning
Professional Services
Text Only
Booz Allen Hamilton
Add to my slides
Remove from favorites
This slide contains statistical data, a pie chart, and icons to highlight the expectations of employees and job seekers regarding DEI in workplaces. It utilizes a clean layout with sections clearly differentiated by background colors and significant textual annotations.
Human Resources and Talent Management
Professional Services
Focuses on the rising expectations employees have from companies regarding DEI, reflecting varying perspectives across demographics. It underscores the belief that current DEI efforts are insufficient despite numerous initiatives, with a significant portion of employees feeling undervalued or marginalized.
DEI, employee expectations, workplace diversity, job seekers, corporate responsibility, talent management
false
Human Resources and Talent Management
Professional Services
Multiple Chart
BCG
Add to my slides
Remove from favorites
The slide features a column chart showing the percentage of organizations that have changed their DEI hiring goals since 2021. The design is moderately dense with text and visuals.
Human Resources and Talent Management
Professional Services
Analyzes changes in DEI hiring goals among organizations since 2021.
DEI, hiring goals, changes, 2021, organizations
false
Human Resources and Talent Management
Professional Services
Mixed Chart
Accenture
Add to my slides
Remove from favorites
The slide contains a column chart showing the percentage of organizations with formal DEI hiring goals. The layout is moderately dense with text and visual elements.
Human Resources and Talent Management
Professional Services
Discusses the prevalence of formal DEI hiring goals within organizations and their public announcements.
DEI, hiring goals, formal goals, public announcements, organizations
false
Human Resources and Talent Management
Professional Services
Mixed Chart
Accenture
Add to my slides
Remove from favorites
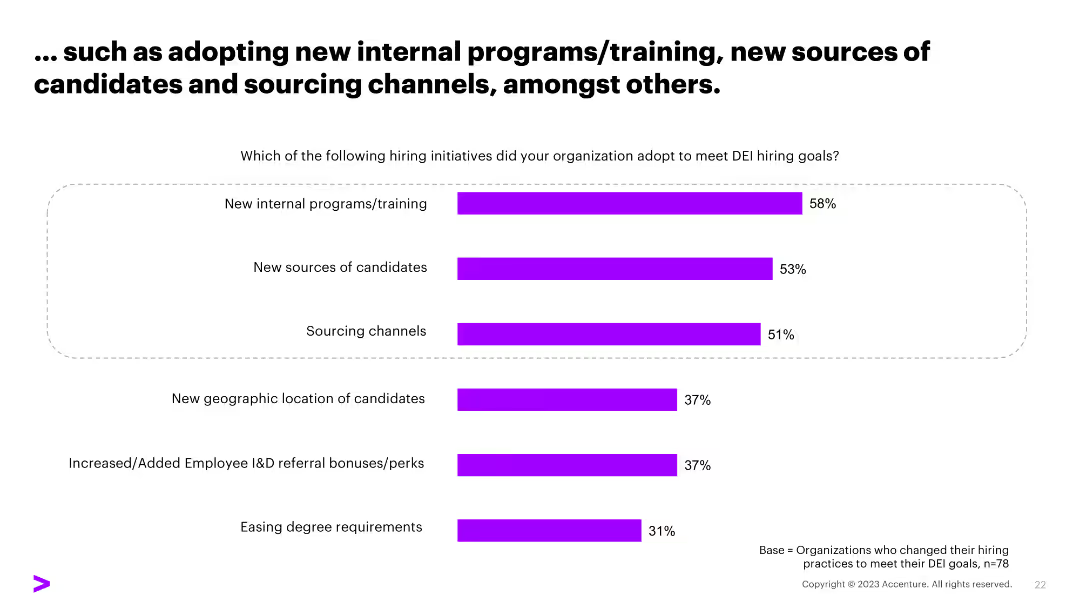
A column chart showing various hiring initiatives like new internal programs/training, new sources of candidates, and sourcing channels, with percentage values.
Human Resources and Talent Management
Professional Services
The slide lists various initiatives organizations adopted to meet DEI hiring goals, highlighting the most common methods and their adoption rates.
DEI, hiring initiatives, training programs, candidates, sourcing channels
false
Human Resources and Talent Management
Professional Services
Single Chart
Accenture
Add to my slides
Remove from favorites
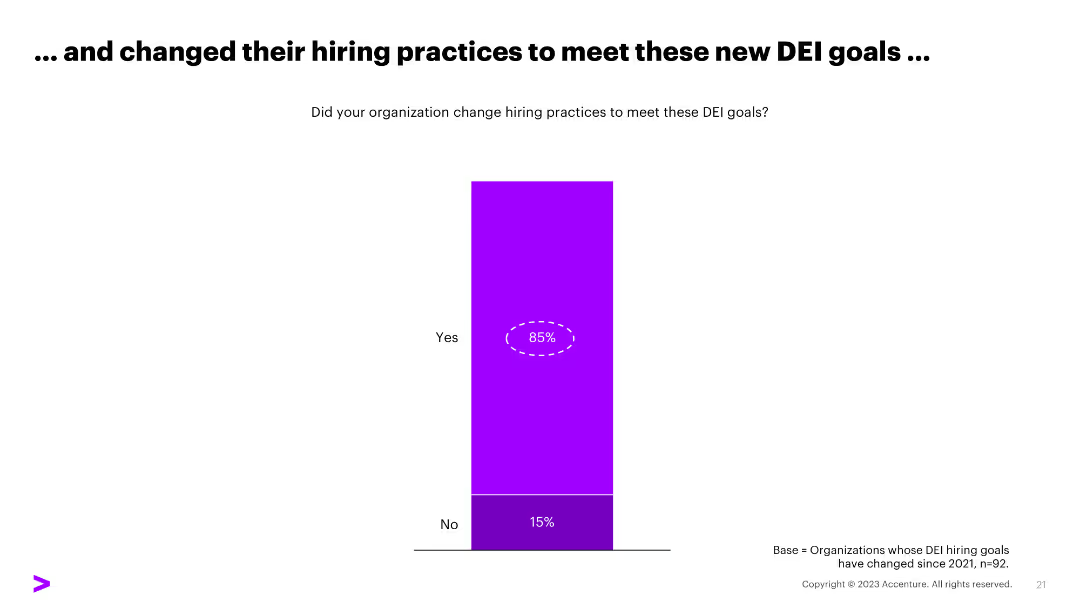
A column chart displaying the results of a survey where 85% of organizations changed their hiring practices to meet DEI goals, with "Yes" and "No" responses.
Human Resources and Talent Management
Professional Services
The slide shows a survey result indicating that 85% of organizations changed their hiring practices to meet DEI goals, useful for HR strategy discussions.
DEI, hiring practices, survey, HR strategy, organizations
false
Human Resources and Talent Management
Professional Services
Single Chart
Accenture
Add to my slides
Remove from favorites
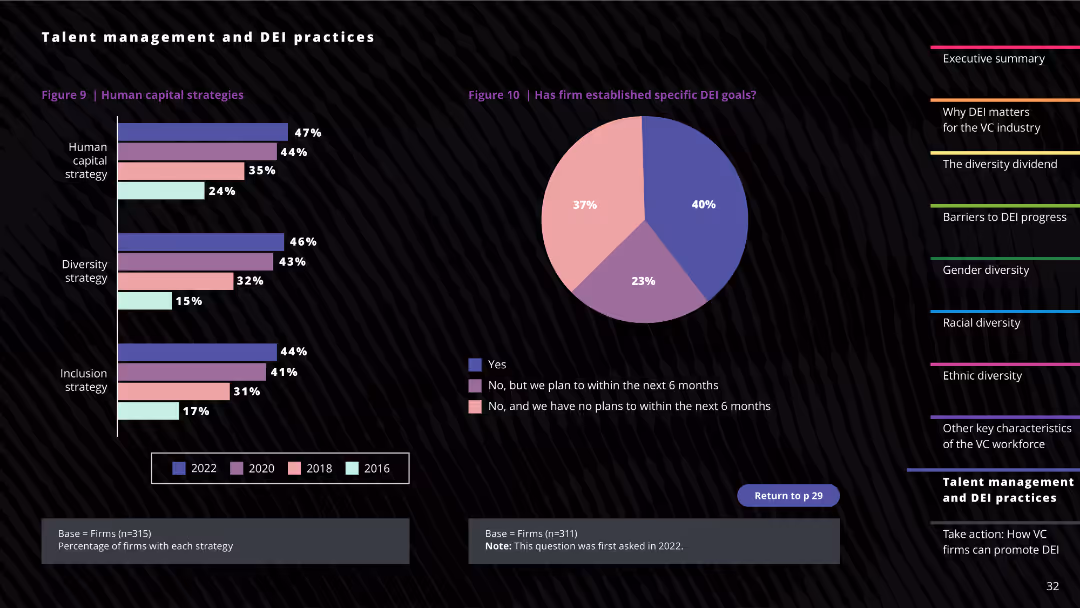
The slide features a horizontal bar chart and a pie chart. The bar chart displays data from 2016 to 2022 on human capital, diversity, and inclusion strategies. The pie chart shows the firm's DEI goals.
Human Resources and Talent Management
Professional Services
The slide compares trends in human capital, diversity, and inclusion strategies over several years, highlighting changes in DEI goals among firms.
DEI, human capital, diversity strategy, inclusion strategy, DEI goals
false
Human Resources and Talent Management
Professional Services
Multiple Chart
Deloitte
Add to my slides
Remove from favorites
Text, percentage circles, and a table showing employee and employer views on DEI actions and their most important actions to improve diversity, equity, and inclusion.
Human Resources and Talent Management
Professional Services
This slide addresses how hybrid work and addressing rewards can enhance diversity, equity, and inclusion (DEI) efforts, detailing survey results on actions to improve DEI from both employee and employer perspectives.
DEI, hybrid work, employee views, employer views, diversity, equity, inclusion
false
Human Resources and Talent Management
Professional Services
Multiple Chart
EY
Add to my slides
Remove from favorites
The slide contains two column charts showing the impact of DEI policies on investment decisions and perceived progress in DEI. An image on the left depicts a group of professionals outdoors. The charts use shades of orange and red.
Human Resources and Talent Management
Financial Services
The slide discusses the significant impact of DEI policies on investors' decisions to invest or remain invested, highlighting the need for tangible progress in DEI across alternative managers.
DEI, investment decisions, progress, talent management, policies
false
Human Resources and Talent Management
Financial Services
Multiple Chart
EY
Add to my slides
Remove from favorites
The slide is structured into three main sections with a focus on innovative solutions for addressing employee needs. It features flat design icons and graphics depicting various workplace scenarios, complemented by succinct bullet points. The design utilizes a green and blue color scheme that is both eye-catching and easy to follow, facilitating a clear understanding of the strategies discussed.
Human Resources and Talent Management
Professional Services
This slide details approaches to developing nuanced, holistic solutions for employee
DEI, market expansion, business strategy, inclusive practices, new opportunities, competitive advantage
false
Human Resources and Talent Management
Professional Services
Pillar
BCG
Add to my slides
Remove from favorites
This slide is segmented into several parts, each depicting a different strategy for integrating DEI into business models to tap into new market opportunities. It features a mix of diagrams, icons, and bullet lists to present actionable insights in an organized and visually engaging manner. The color coding and layout facilitate easy navigation through the slide's content.
Strategic Planning
Professional Services
Outlines strategies for businesses to use DEI as a lever for accessing new market segments and enhancing overall business performance. It stresses the importance of inclusive practices in expanding customer bases and improving supply chain relationships, ultimately leading to greater market competitiveness and innovation in products and services.
DEI, market expansion, business strategy, inclusive practices, new opportunities, competitive advantage
false
Strategic Planning
Professional Services
Pillar
BCG
Add to my slides
Remove from favorites
Contains column charts detailing the adoption of diversity and inclusion practices by high-growth companies.
Strategic Planning
Professional Services
Evaluates the prevalence of DEI objectives in high-growth brands and their impact on corporate and social strategies.
DEI, marketing, high-growth, brands, diversity, inclusion, corporate strategy
false
Strategic Planning
Professional Services
Mixed Chart
Deloitte
Add to my slides
Remove from favorites
Slide presents multiple column charts with numerical ratings.
Market Analysis and Trends
Professional Services
Evaluates the impact of DE&I marketing investments across various business outcomes like employee retention and customer acquisition, with insights provided.
DE&I, Marketing, Investments, Employee Retention, Customer Acquisition, Bar Charts, Business Outcomes, Insights
false
Market Analysis and Trends
Professional Services
Mixed Chart
Deloitte
Add to my slides
Remove from favorites
Bar charts displaying the increase in marketing spending on Diversity, Equity, and Inclusion (DE&I) across different company sizes and sectors, with annotations for top and bottom industry sectors.
Customer and Market Segmentation
Professional Services
Analyzes the spending trends on diversity, equity, and inclusion within marketing departments, highlighting increased investment particularly in larger companies and certain sectors. Offers a breakdown by company size and sector.
DE&I, Marketing, Spending Increase, Column Chart, Company Size, Industry Sectors, Investment Trends
false
Customer and Market Segmentation
Professional Services
Multiple Chart
Deloitte
Add to my slides
Remove from favorites
The slide features multiple bar charts and a bar chart, detailing changes in DE&I spending by company size, sales, and economic sectors. Colors are red and grey.
Market Analysis and Trends
Professional Services
Details DE&I spending trends across various company sizes and sectors, highlighting significant increases in B2C sectors and larger firms.
DE&I, marketing, trends, B2C, spending, company size, retail, communications, real estate, economic sector
false
Market Analysis and Trends
Professional Services
Multiple Chart
Deloitte
Add to my slides
Remove from favorites
The slide features multiple column charts comparing formal and informal DEI programs from 2016 to 2022. Categories include hiring, recruitment, mentorship, leadership development, promotion, and retention.
Human Resources and Talent Management
Professional Services
The slide provides data on the adoption rates of various DEI programs, both formal and informal, across several years.
DEI programs, hiring, recruitment, mentorship, leadership development, promotion, retention
false
Human Resources and Talent Management
Professional Services
Multiple Chart
Deloitte
Add to my slides
Remove from favorites
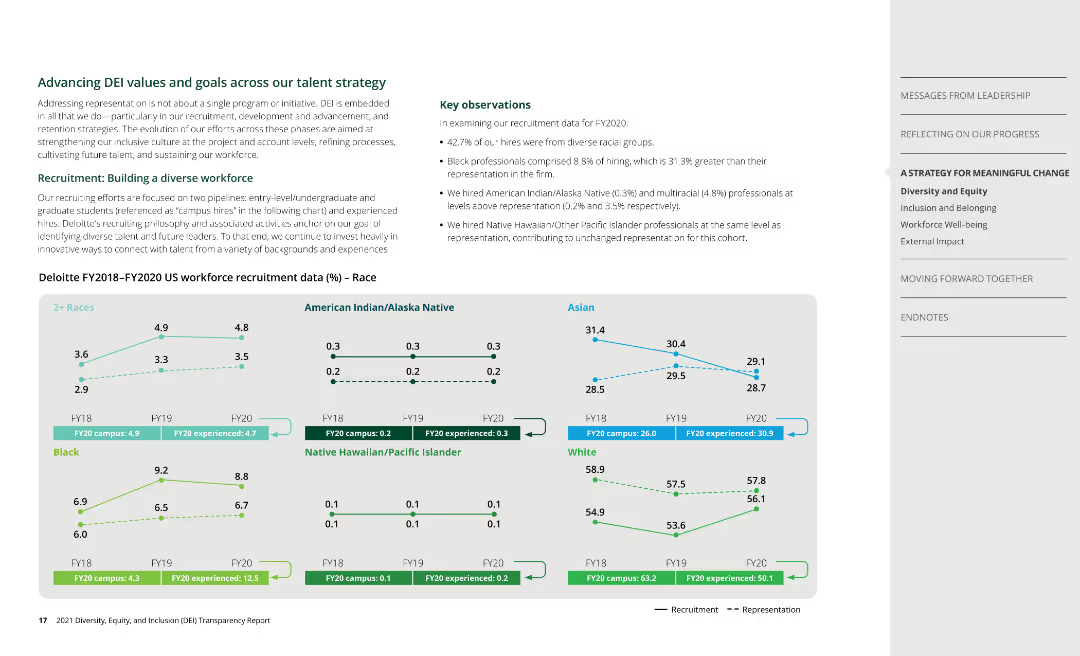
Line charts show recruitment data by race from FY2018 to FY2020 for different racial groups, with additional observations.
Human Resources and Talent Management
Professional Services
Discusses DEI efforts in recruitment, presenting data on hiring trends and goals to increase workforce diversity.
DEI, recruitment, race, diversity, Deloitte
false
Human Resources and Talent Management
Professional Services
Multiple Chart
Deloitte
Add to my slides
Remove from favorites
Utilizes a dual-part layout contrasting traditional and modern approaches to DEI, with colorful icons and text blocks facilitating an easy comparison. Visual elements are organized to guide the viewer through a narrative flow from historical views to current business-focused strategies, highlighted by changes in background color and bold headings.
Strategic Planning
Professional Services
Discusses the evolution of DEI from a purely ethical consideration to a critical element in business strategy. It illustrates how businesses can leverage DEI for broader societal impact and internal benefits, linking ethical practices with strategic business outcomes.
DEI, strategic advantage, business ethics, corporate strategy, organizational change, talent management
false
Strategic Planning
Professional Services
Header Horizontal
BCG
Add to my slides
Remove from favorites
This slide offers a visual breakdown of four strategic approaches to enhancing DEI within organizations, represented through vibrant icons and a quadrant layout. Each section is clearly defined with headings and concise bullet points, paired with relevant imagery that complements the textual content.
Organizational Structure and Change
Professional Services
Encourages a shift in how DEI is perceived within business strategies, urging companies to integrate it as a fundamental aspect of business planning and innovation. It emphasizes the importance of viewing DEI through a broader lens, not just as a moral obligation but as a strategic advantage that can drive substantial organizational and societal benefits.
DEI strategy, business innovation, organizational change, sustainable advantage, leadership commitment
false
Organizational Structure and Change
Professional Services
Header Vertical
BCG
Add to my slides
Remove from favorites
The slide features a central diagram surrounded by text, breaking down the strategic priorities and core agendas of Barclays' DEI strategy.
Strategic Planning
Financial Services
Outlines the key components and strategic priorities of Barclays' DEI strategy, emphasizing inclusivity and accountability in the workplace.
DEI, strategy, inclusivity, accountability, workforce, leadership, data transparency, culture
false
Strategic Planning
Financial Services
Diagram
Barclays
Add to my slides
Remove from favorites
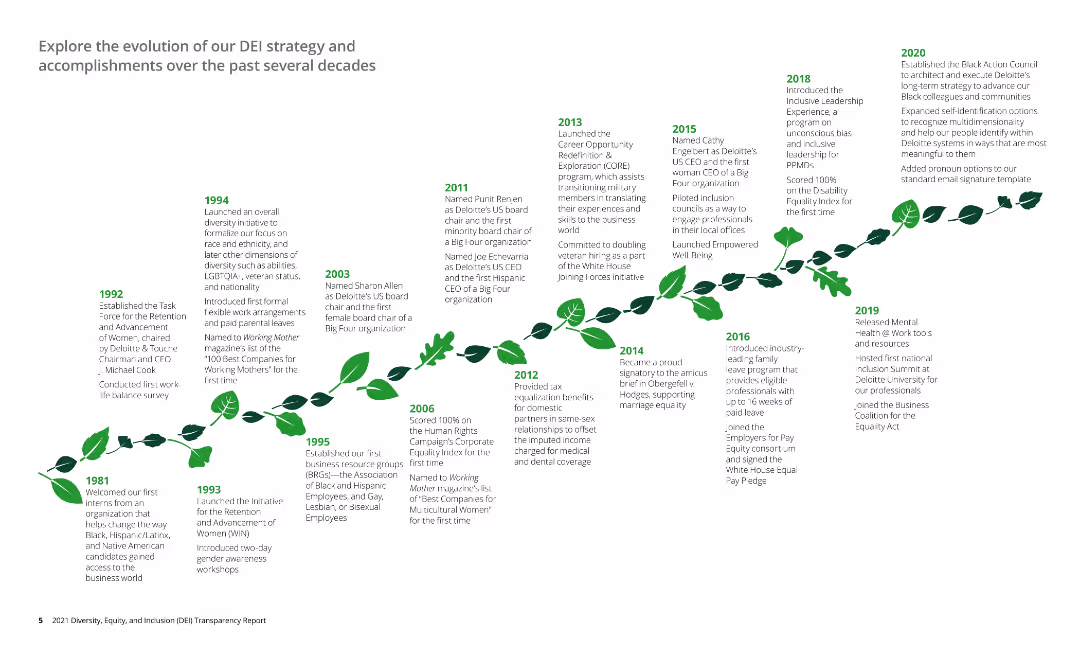
The slide features a timeline detailing the evolution of a company's DEI strategy from 1981 to 2020, with key milestones and achievements noted. The timeline is visually represented as a growing plant, symbolizing development and progress.
Organizational Structure and Change
Professional Services
The slide provides a historical overview of the company's Diversity, Equity, and Inclusion (DEI) strategy, highlighting significant milestones, initiatives, and accomplishments over several decades, from 1981 to 2020.
DEI strategy, timeline, milestones, diversity, inclusion
false
Organizational Structure and Change
Professional Services
Linear Flow
Deloitte
Add to my slides
Remove from favorites
Six pie charts overlaid on a stylized background representing the Nordics, discussing readiness in various organizational aspects.
Strategic Planning
Professional Services
Highlights regional statistics on readiness for embedding DEI and sustainability in business practices.
DEI, sustainability, readiness, pie chart, Nordics
false
Strategic Planning
Professional Services
Multiple Chart
Deloitte
Add to my slides
Remove from favorites
The slide features a column chart and multiple data points showing reduction in Securitized Products assets and Non-Core Unit exposure. Bullets summarize key reductions achieved.
Risk Assessment and Management
Financial Services
Highlights significant reduction in securitized products and non-core unit assets, achieving two-thirds of the target. Shows financial and operational impact.
deleveraging, de-risking, securitized products, non-core unit, financial performance
false
Risk Assessment and Management
Financial Services
Multiple Chart
Credit Suisse
Add to my slides
Remove from favorites
Column chart compares capital markets issuance and redemption volumes from 2021 to 2023. Bullets provide key messages on funding strategy.
Financial Performance
Financial Services
Discusses strategic transformation to reduce funding needs through balance sheet reduction and capital market activities, with significant reductions in issuance.
deleveraging, funding needs, capital markets, financial strategy, issuance volumes
false
Financial Performance
Financial Services
Multiple Chart
Credit Suisse
Add to my slides
Remove from favorites
Line charts showing US new delinquent loan balances and total household debt as a percentage of disposable income from 2003 Q1 to 2023 Q4.
Risk Assessment and Management
Financial Services
Discusses rising delinquencies on consumer loans and household debt trends, suggesting pockets of strain in the consumer sector.
delinquencies, consumer loans, household debt, disposable income, financial strain, line chart, US economy, credit, debt trends
false
Risk Assessment and Management
Financial Services
Multiple Chart
EY
Add to my slides
Remove from favorites
Previous
Next
You don't have any favorites yet.
Please wait loading your favorites slides...
Create a FREE account to continue browsing
Receive Instant Access to 1,000+ slides from companies like McKinsey, Google, and Goldman Sachs
First Name
Last Name
Email
Password
I agree to all
Terms & Privacy Policy
Thank you! Your submission has been received!
Oops! Something went wrong while submitting the form.
Have an account?
Sign in
Upgrade to PRO to Save slides
Advanced Search and Filters
Access to 15,000+ slides
Access to Category Pages
Save/Bookmark Slides
PowerPoint Template Library
Pick a Plan
MONTHLY
$12/month
Billed every month, Cancel anytime.
YEARLY
$9/year
Billed $108 annually, Cancel anytime.
Checkout for $12/month
Checkout for $108/yr
Secured by Stripe | AES-256 bit encryption


![[Backup] Investable Ideas Assessment: Decarbonization opportunities prioritized based on assessment of attractiveness, technical feasibility, and commercial interest to date](https://cdn.prod.website-files.com/654e70fb59937215cac87b19/6899953e275395ca2ed1cc51_vZaDA2xgScL3S_uzIEobYgqSfN-ETPMrXtk5qsFc3lE.avif)

![Q. To what extent, if at all, are the following factors inhibiting your company’s ability to decarbonise its business model? [NET: To a large extent & to a very large extent]](https://cdn.prod.website-files.com/654e70fb59937215cac87b19/689995e10727c755a849efc5_o1RhJtnqkTC-hu0CXC7T7uW162mbSiNYk370rFrRrQ8.avif)


![[Country] is in decline](https://cdn.prod.website-files.com/654e70fb59937215cac87b19/6899be16bc303b7d94f093c4_aSlDMp7DiesmM5X1LFrR8qg8u34olUGIe7UPR-zBXXI.avif)
![Q: How much do you agree or disagree with the following statements about [COUNTRY] today? - is in decline](https://cdn.prod.website-files.com/654e70fb59937215cac87b19/6899babce84fc87b0bfe2df1_5GELYVO8s2xvSBv7XV2b-_Gp7tO4vhuYMP2Sfkpid-w.avif)