My Account
My Slides
Search by Category
Companies
Slide Type
Use Case
Industry
Pricing
Templates
View All Templates
Download Template Slides
✦ AI
AI Prompt Library
AI Search
Feedback
Login
Logout
Get Started
Browse all Slides
Browse all Slides
Create a FREE Account
Instant access to 1,000+ real slides from top companies like McKinsey, BCG, Goldman Sachs, Google and many more!
First Name
Last Name
Email
Password
I agree to all
Terms & Privacy Policy
Thank you! Your submission has been received!
Oops! Something went wrong while submitting the form.
Have an account?
Sign in
Saved Slides
Total No. of slides saved
0
↻ Refresh
✖ Clear all
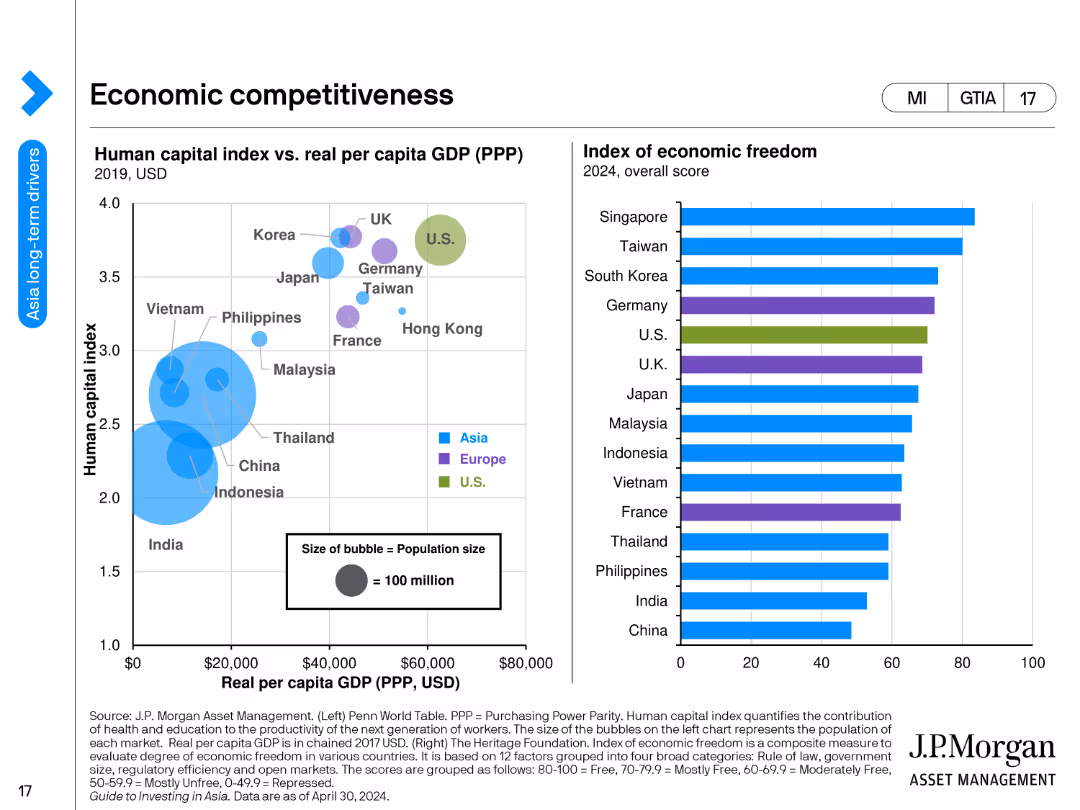
A bubble chart showing the human capital index vs. real GDP per capita and a bar chart showing the index of economic freedom by country.
Market Analysis and Trends
Financial Services
The slide compares countries' economic competitiveness through human capital indices and real GDP per capita, and presents an index of economic freedom scores for 2024.
economic competitiveness, human capital, GDP per capita, economic freedom, countries, financial analysis, indices, economic trends, development, financial insights
false
Market Analysis and Trends
Financial Services
Multiple Chart
JP Morgan
Add to my slides
Remove from favorites
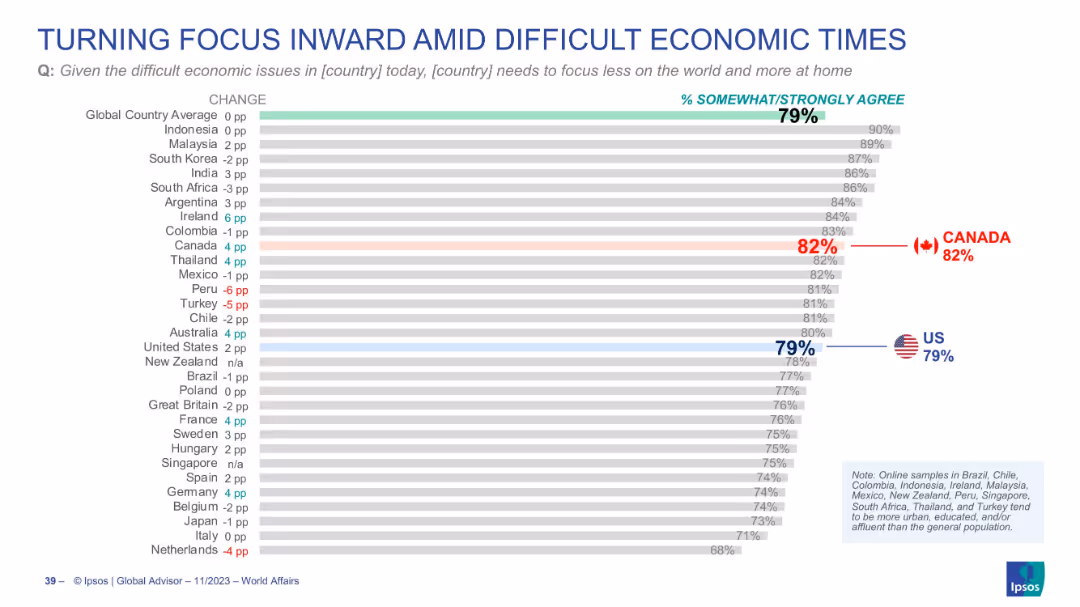
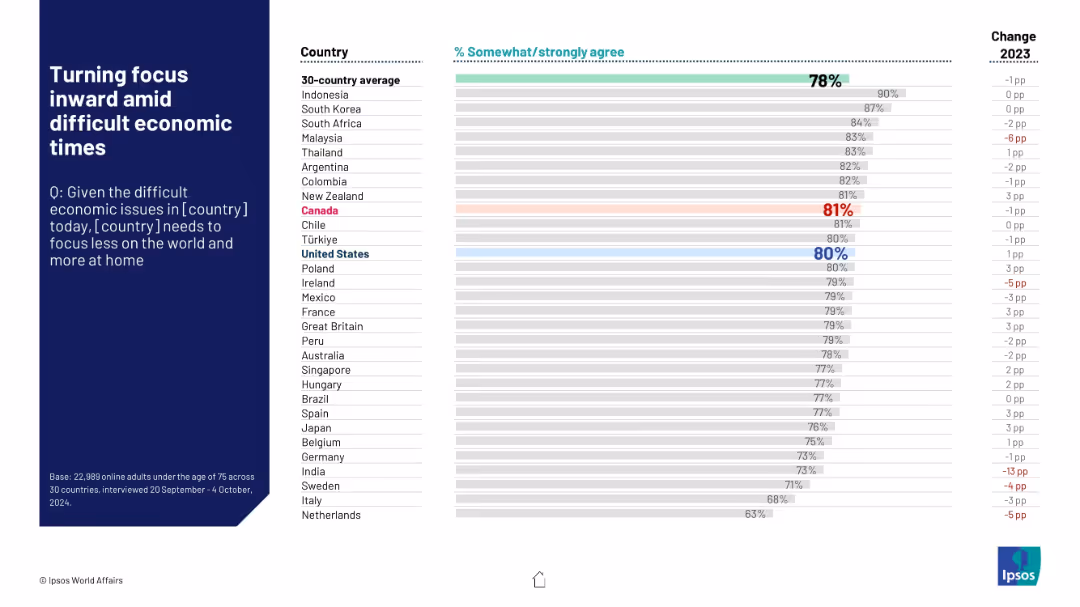
Bar chart visualizing % agreement across countries, with Canada and U.S. emphasized
Market Analysis and Trends
Government & Public Sector
Depicts public sentiment around shifting national focus inward due to economic issues. High agreement in Canada (82%) and U.S. (79%), suggesting a trend toward domestic prioritization.
economic concerns, nationalism, inward focus, public opinion, Canada, US, policy sentiment
false
Market Analysis and Trends
Government & Public Sector
Single Chart
IPSOS
Add to my slides
Remove from favorites
Line chart and national flags illustrating respondents' perceptions of economic conditions in SEA.
Market Analysis and Trends
Financial Services
The slide shows a trend in economic perceptions among SEA respondents, with a comparison of views from different countries.
economic conditions, SEA, perceptions, line chart, survey
false
Market Analysis and Trends
Financial Services
Mixed Chart
IPSOS
Add to my slides
Remove from favorites
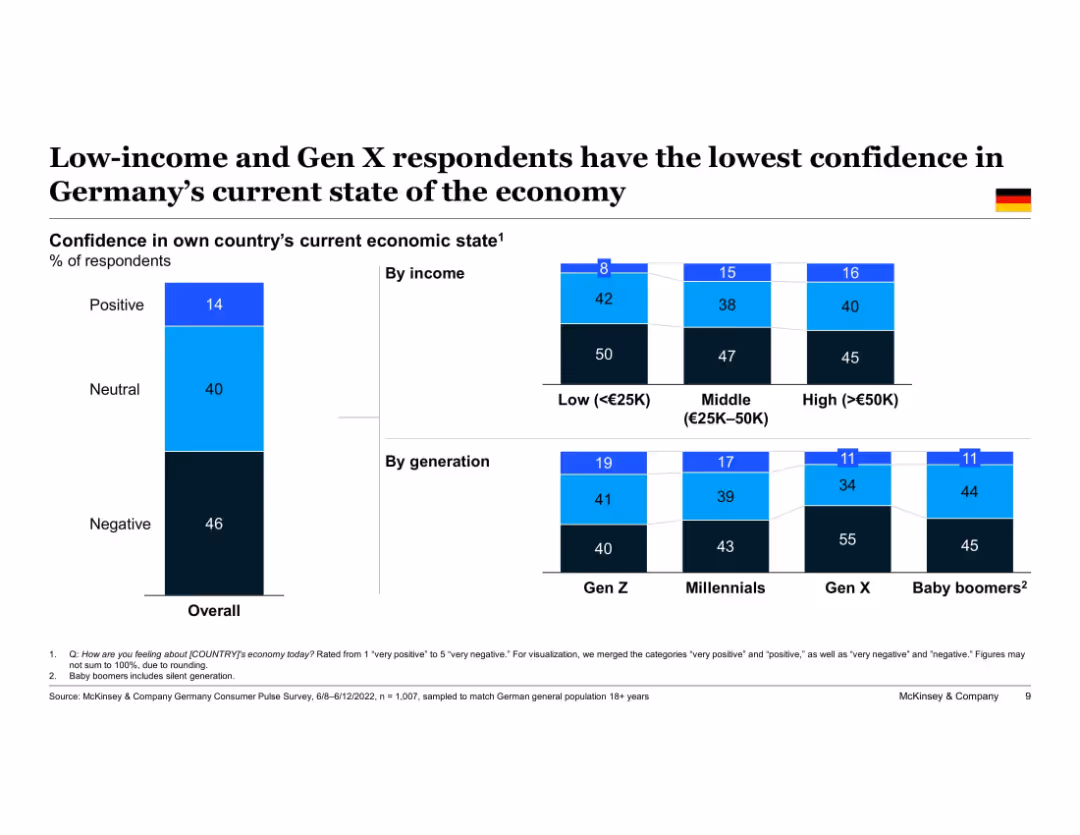
Split vertical bar charts showing confidence by income and generation. Simple color scheme and German flag indicator.
Customer and Market Segmentation
Consumer Goods
This slide shows that German consumers from lower income brackets and Gen X have the least confidence in the economy. Data emphasizes varying levels of positivity and negativity by demographic.
economic confidence, income disparity, generational differences, Germany, consumer outlook, survey data
false
Customer and Market Segmentation
Consumer Goods
Single Chart
McKinsey
Add to my slides
Remove from favorites
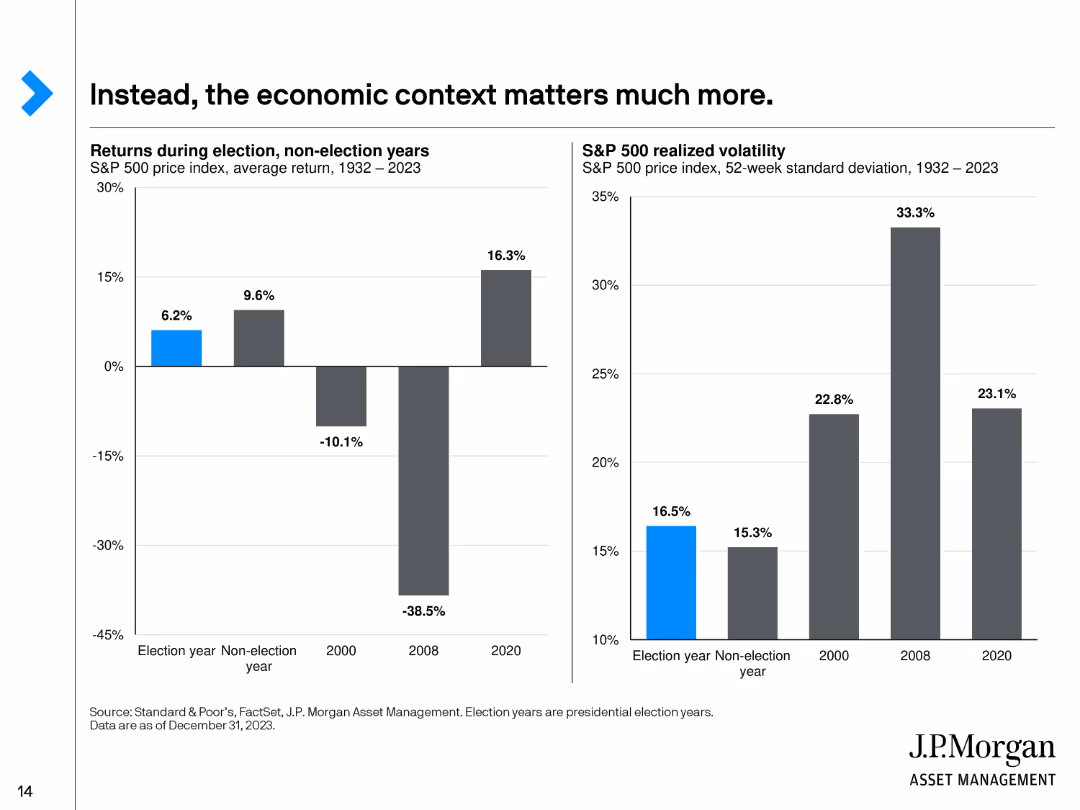
The slide displays two column charts: one showing returns during election and non-election years, and another showing S&P 500 realized volatility from 1932 to 2023.
Market Analysis and Trends
Financial Services
This slide highlights how economic context, rather than political events, significantly impacts market performance. It compares election year returns with non-election years and examines market volatility.
Economic Context, Election Years, Market Performance, Volatility, Analysis
false
Market Analysis and Trends
Financial Services
Multiple Chart
JP Morgan
Add to my slides
Remove from favorites
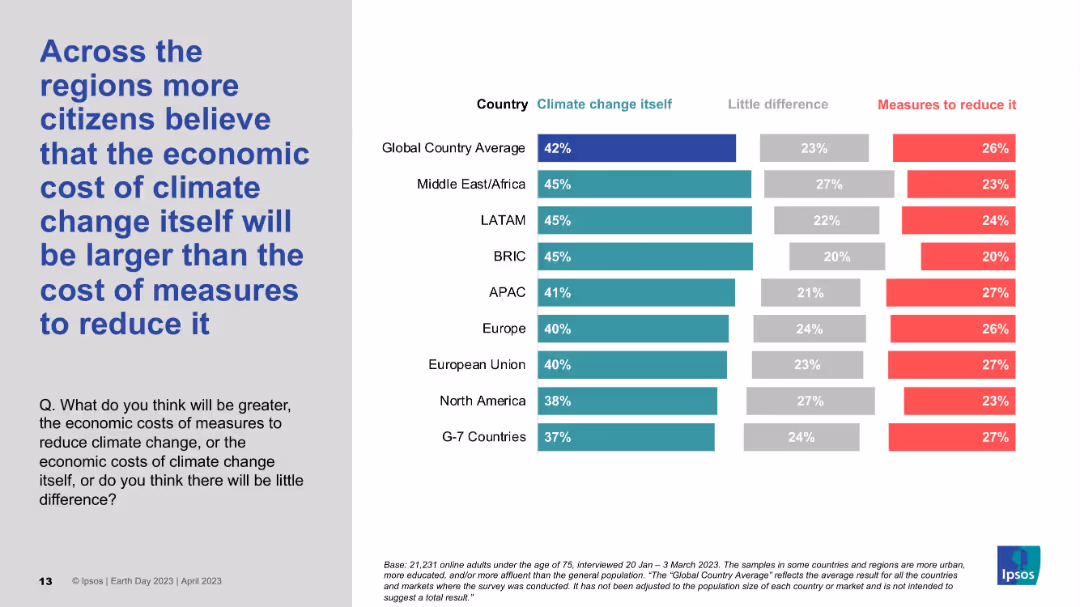
Regional-level horizontal bar chart with three categories: climate change, little difference, and reduction cost; grey and blue.
Market Analysis and Trends
Environmental Services & Sustainability
The slide analyzes regional sentiment on whether the economic impact of climate change is greater than the cost of addressing it. In all major regions except Japan, more respondents see climate change itself as costlier. Global average aligns with this perception at 42%.
Economic cost, Climate change, Regional comparison, Public perception, Ipsos
false
Market Analysis and Trends
Environmental Services & Sustainability
Mixed Chart
IPSOS
Add to my slides
Remove from favorites
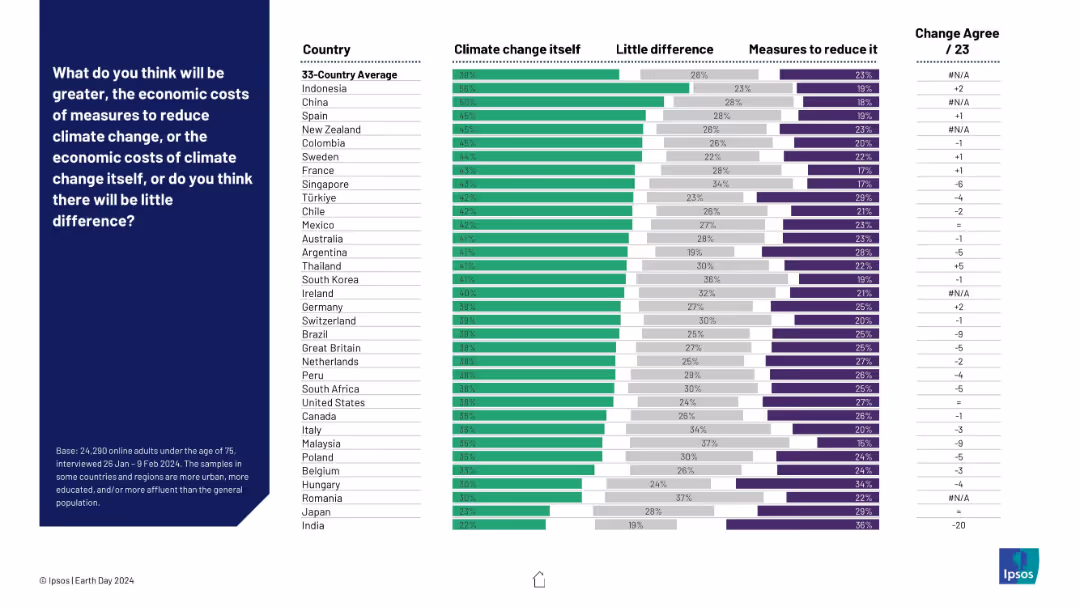
Horizontal stacked bar chart comparing beliefs on whether climate change itself or the measures to reduce it will cost more. Countries listed on the left with agreement levels for each opinion.
Strategic Planning
Environmental Services & Sustainability
The slide presents perceptions across various countries regarding whether the economic cost of addressing climate change outweighs the cost of climate change itself. Most respondents believe climate change is the more costly threat, though views vary by country.
economic costs, climate change, mitigation measures, global perception, Ipsos, cost analysis, country comparison, sustainability policy
false
Strategic Planning
Environmental Services & Sustainability
Mixed Chart
IPSOS
Add to my slides
Remove from favorites
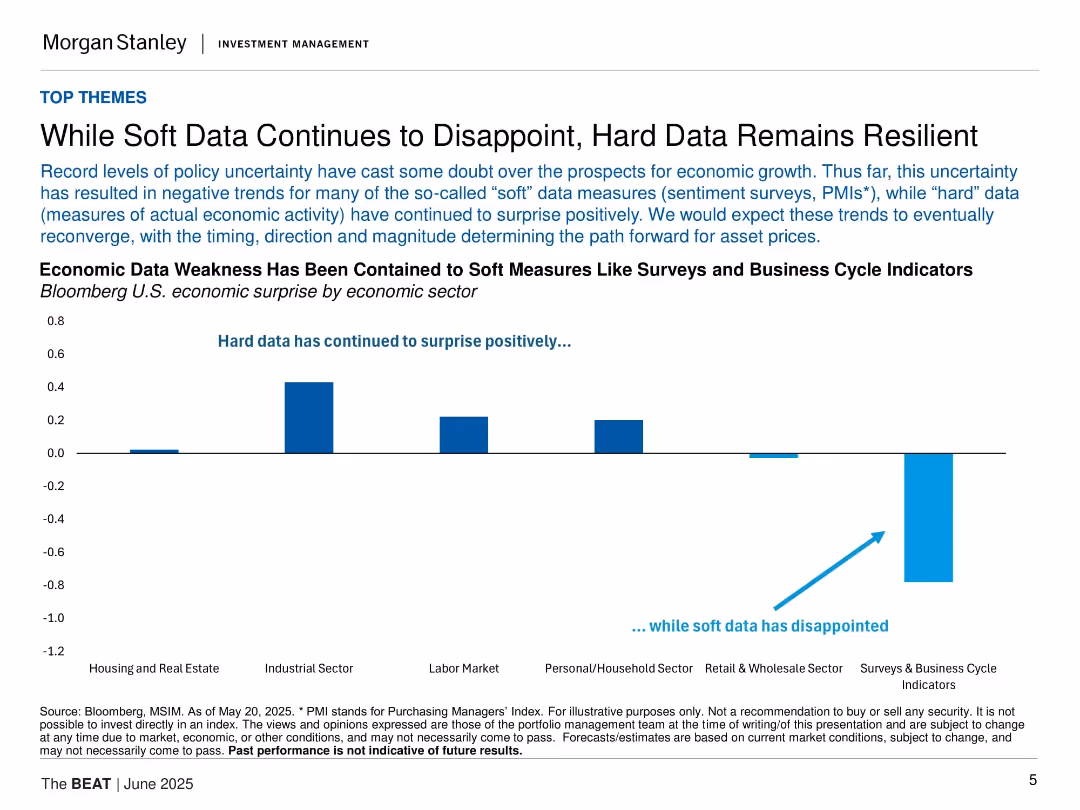
Horizontal bar chart comparing economic surprises by sector; emphasizes divergence between soft and hard data; minimalistic layout with blue tone annotations.
Market Analysis and Trends
Financial Services
Highlights how hard economic data (e.g., industrial sector, labor market) continues to outperform expectations, while soft data (surveys, PMIs) lags. This divergence affects asset price forecasting and overall market sentiment, emphasizing uncertainty in economic signals.
economic data, hard vs soft, surprises, market sentiment, uncertainty
false
Market Analysis and Trends
Financial Services
Single Chart
Morgan Stanley
Add to my slides
Remove from favorites
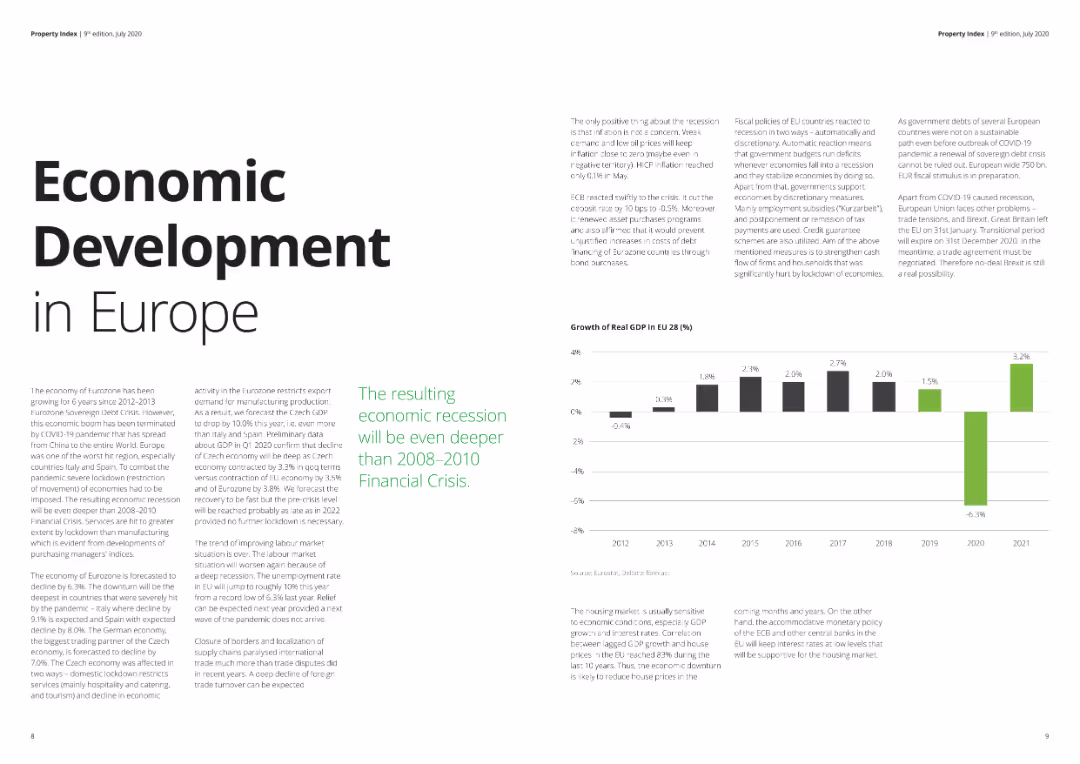
The slide features text detailing economic conditions in Europe, supported by a column chart showing GDP growth rates from 2012 to 2021. The layout is clean with ample white space, suitable for general audiences. Visual complexity is basic.
Market Analysis and Trends
Real Estate & Construction
Provides an overview of economic development in Europe, discussing the impact of the COVID-19 pandemic on GDP growth and the expected economic recession. Useful for understanding broader economic trends and their implications on various sectors.
Economic development, Europe, GDP, recession, COVID-19
false
Market Analysis and Trends
Real Estate & Construction
Mixed Chart
Deloitte
Add to my slides
Remove from favorites
Multiple column charts showing economic expectations per industry, including automotive, aerospace & defense, industrial products, chemicals/pharma, consumer goods, and financial services.
Market Analysis and Trends
Financial Services
The slide provides a detailed view of economic expectations across various industries, with a focus on the high percentage of leaders in the automotive sector anticipating an economic downturn in 2019. It contrasts these expectations with those from other industries, offering a comprehensive overview of sector-specific economic outlooks.
Economic Downturn, Industry Expectations, 2019
false
Market Analysis and Trends
Financial Services
Multiple Chart
Roland Berger
Add to my slides
Remove from favorites
High contrast text overlay on a dynamic office imagery background with accent highlights.
Market Analysis and Trends
Technology & Software
This slide, styled as a summary of key points, addresses misconceptions about the impact of economic downturns on real estate decisions, emphasizing complexity and evolving employer-employee dynamics. It's applicable in discussions about market analysis, real estate trends, and strategic planning within the real estate and technology sectors.
Economic Downturn, Real Estate, Market Analysis, Employer-Employee Dynamics, Trends, Strategic Planning, Misconceptions, Complexity
false
Market Analysis and Trends
Technology & Software
Agenda
EY
Add to my slides
Remove from favorites
Features a mix of column and square table with four sections showing the performance of companies during economic downturns. The visual arrangement is neat, using contrasting colors to differentiate between winners and losers, enhancing readability and focus.
Financial Performance
Financial Services
Analyzes company performance during economic downturns, classifying companies as winners or losers based on growth and profit margins. It highlights significant performance gaps, aiming to provide insights into effective financial management and strategic planning during challenging times.
economic downturns, company performance, growth, profit margins, financial strategy
false
Financial Performance
Financial Services
Multiple Chart
Deloitte
Add to my slides
Remove from favorites
Column chart comparing economic expectations of study respondents for 2018 and 2019, with categories for upturn, boom, downturn, and recession.
Market Analysis and Trends
Financial Services
The slide analyzes the shifting economic expectations of participants in the 10th Operations Efficiency Radar, comparing sentiments from 2018 and 2019. It highlights the growing anticipation of an economic downturn among respondents, reflecting changes in business confidence and economic outlook.
Economic Expectations, Operations Efficiency, Downturn
false
Market Analysis and Trends
Financial Services
Mixed Chart
Roland Berger
Add to my slides
Remove from favorites
Horizontal bar chart with country comparisons on agreement that focus should shift inward during tough economic times. Canada and US highlighted, left-side panel restates question.
Market Analysis and Trends
Government & Public Sector
Surveys global sentiment about whether nations should reduce international focus and prioritize domestic issues due to economic conditions. Majority agree across countries, with Canada at 81% and US at 80%.
economic focus, domestic priorities, international policy, global comparison, Canada, Ipsos survey
false
Market Analysis and Trends
Government & Public Sector
Mixed Chart
IPSOS
Add to my slides
Remove from favorites
A column chart showing year-over-year percentage change in real GDP from 2022 to 2025F for various developed countries including the US, Canada, UK, Euro area, Germany, France, Italy, Spain, Japan, and Australia. Colors represent different years.
Market Analysis and Trends
Financial Services
This slide forecasts modest to moderate economic activity in developed markets for 2024, highlighting cost fatigue and labor market resilience.
economic forecast, developed markets, GDP, 2024, labor market resilience, cost fatigue
false
Market Analysis and Trends
Financial Services
Single Chart
EY
Add to my slides
Remove from favorites
Displays line graphs comparing real GDP growth forecasts from multiple sources for the Philippines, projecting economic recovery trends.
Market Analysis and Trends
Financial Services
Evaluates future economic trends in the Philippines based on forecasts from various institutions, detailing expected GDP growth rates.
economic forecasts, Philippines, GDP growth, recovery trends, line graphs, future trends, financial forecasting
false
Market Analysis and Trends
Financial Services
Mixed Chart
Deloitte
Add to my slides
Remove from favorites
Features a comparative design with a pie chart and textual analysis side-by-side, effectively using space to discuss key global economic concerns.
Market Analysis and Trends
Financial Services
Compares business leader insights on global uncertainties and their expected impact on company performance.
economic, global shocks, uncertainty, risks
false
Market Analysis and Trends
Financial Services
Mixed Chart
BCG
Add to my slides
Remove from favorites
Line charts display economic and trade growth from 1980 to projections in 2026, differentiated by global growth and ASEAN countries' growth. The color scheme includes red and white with dashed and solid lines, accompanied by a descriptive legend at the bottom.
Market Analysis and Trends
Financial Services
Discussing global economic trends with a focus on recovery phases and expectations for the ASEAN region. This analysis is vital for stakeholders in financial services to assess potential impacts on international trade and economic policies.
economic growth, ASEAN, trade growth, financial analysis, projections
false
Market Analysis and Trends
Financial Services
Single Chart
Deloitte
Add to my slides
Remove from favorites
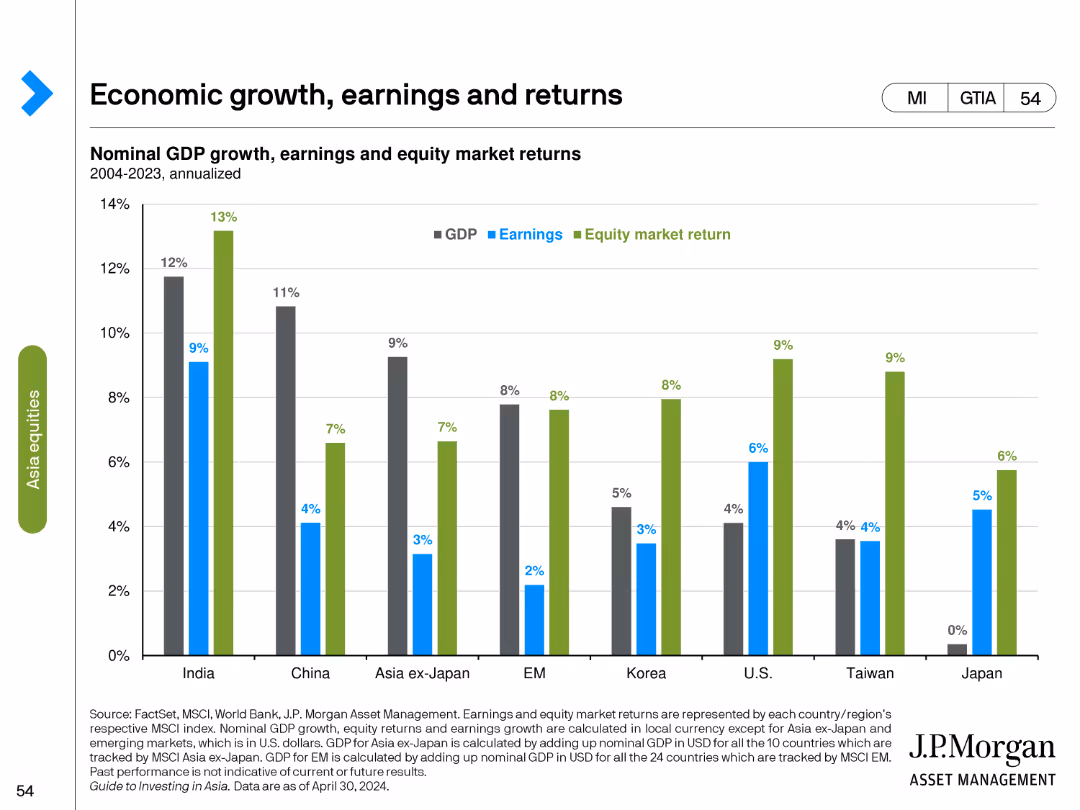
Column chart comparing nominal GDP growth, earnings growth, and equity market returns for various regions from 2004 to 2023, shown in annualized percentages.
Financial Performance
Financial Services
Reviews economic growth, earnings, and equity market returns across different regions over a 19-year period, highlighting key growth metrics and performance.
economic growth, earnings, returns, GDP, column chart, financial performance, regional analysis, historical data
false
Financial Performance
Financial Services
Single Chart
JP Morgan
Add to my slides
Remove from favorites
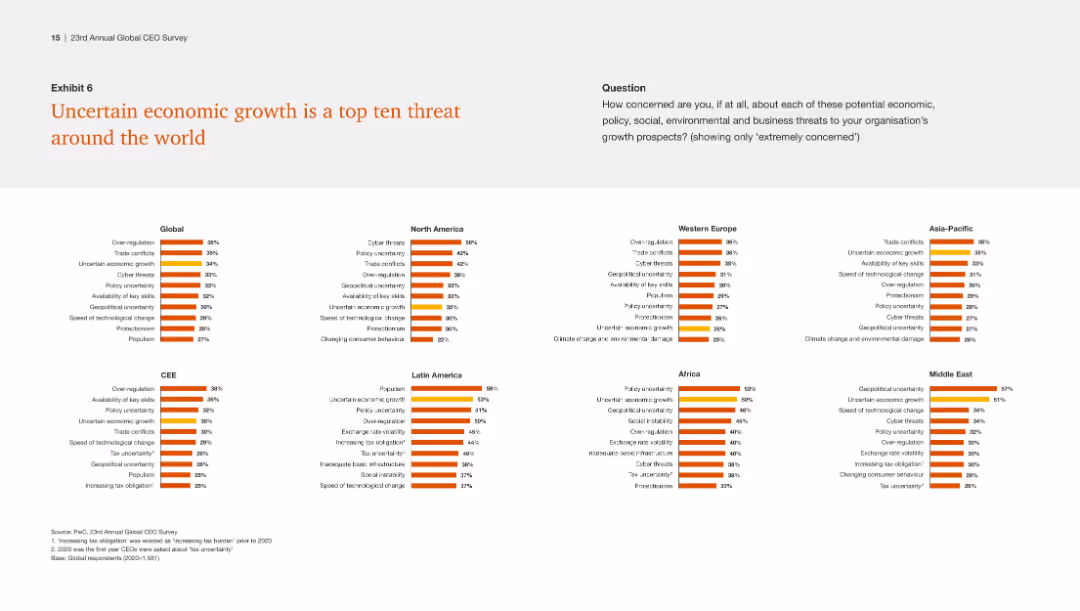
The slide includes multiple small column charts showing the top threats by region, emphasizing uncertain economic growth as a consistent top threat globally.
Risk Assessment and Management
Financial Services
This slide identifies uncertain economic growth as a prevalent threat across various regions, highlighting the need for global strategies to mitigate this risk.
Economic growth, global threats, regional analysis, uncertainty, strategy
false
Risk Assessment and Management
Financial Services
Multiple Chart
PwC/Strategy&
Add to my slides
Remove from favorites
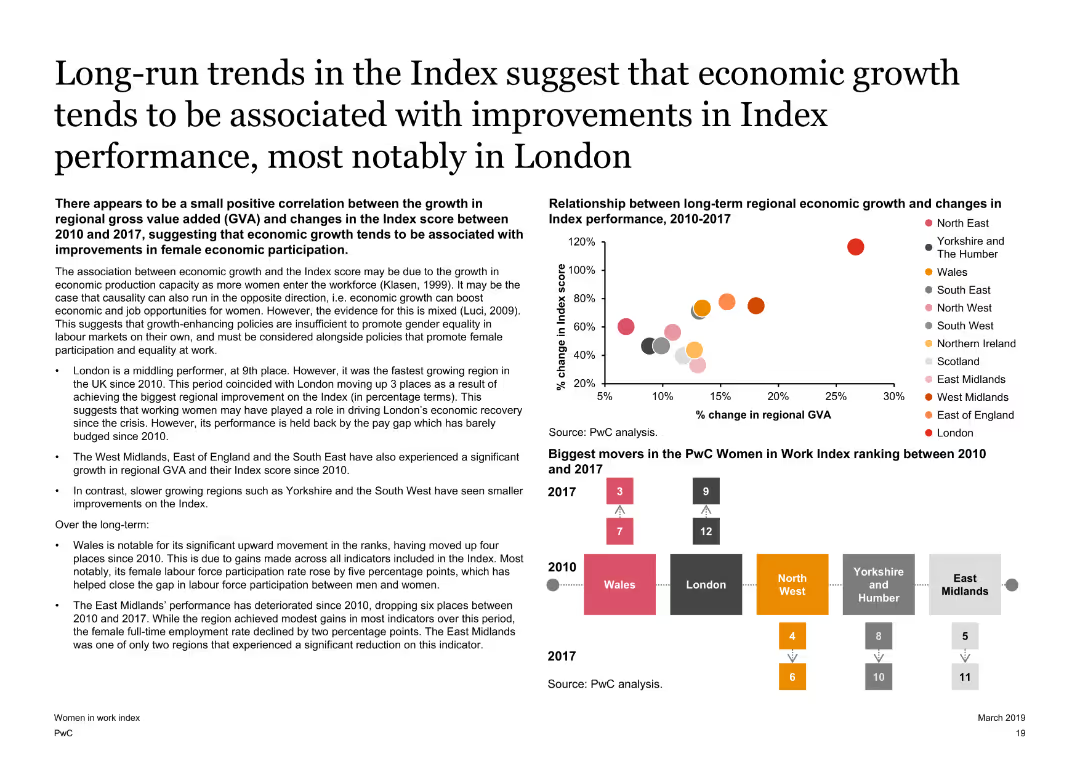
Includes text on the left and a scatter plot on the right, showing the relationship between regional economic growth and changes in the Index score from 2010 to 2017. The slide is moderately dense with data points and analysis.
Market Analysis and Trends
Government & Public Sector
Discusses long-term trends in the Women in Work Index, linking economic growth with improvements in Index performance, particularly noting significant movements in regions like Wales and London between 2010 and 2017.
economic growth, Index performance, regional analysis, Wales, London
false
Market Analysis and Trends
Government & Public Sector
Mixed Chart
PwC/Strategy&
Add to my slides
Remove from favorites
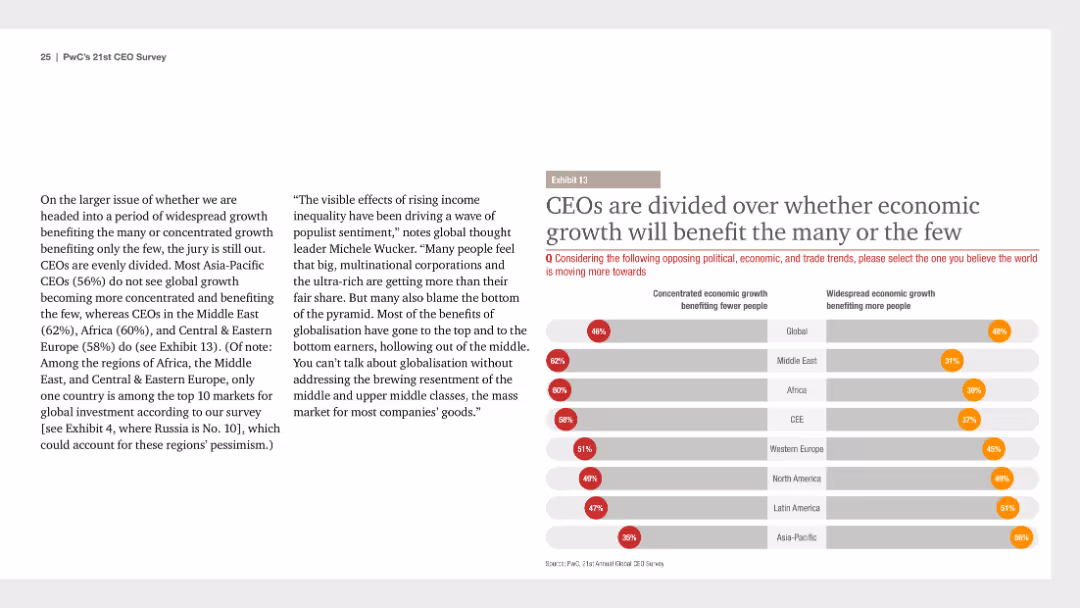
A column chart showing regional opinions on whether economic growth will benefit the many or the few. Accompanying text discusses CEO perspectives on global growth and economic inequality.
Risk Assessment and Management
Financial Services
The slide presents divided opinions among CEOs about whether economic growth will benefit many people or a few, highlighting regional differences and economic inequality concerns.
economic, growth, inequality, CEOs, regional
false
Risk Assessment and Management
Financial Services
Multiple Chart
PwC/Strategy&
Add to my slides
Remove from favorites
This slide features a title, headers, and a mix of textual information and colored indicators representing different statuses (significant improvement, improving, no significant change, worsening, severe decline). The main body of the slide is a bulleted list with detailed economic information. The text is black on a white background, with highlights in blue, red, and gray.
Market Analysis and Trends
Financial Services
The slide presents detailed information on the latest economic growth projections for 2023 and 2024, along with inflation rates and Federal Reserve's monetary policies. It's likely utilized for financial market analysis or in an economic briefing to indicate trends and guide monetary decisions.
economic growth, inflation, interest rates, Federal Reserve, energy prices
false
Market Analysis and Trends
Financial Services
Header Vertical
McKinsey
Add to my slides
Remove from favorites
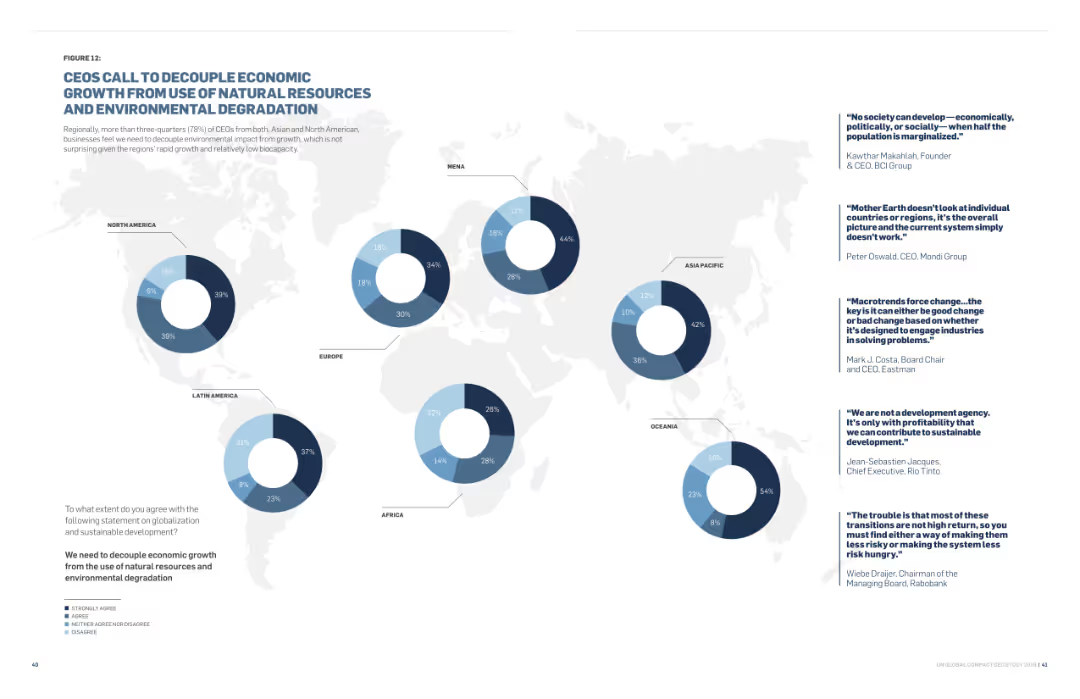
The slide features text and a world map with pie charts showing regional survey data. Quotes from various CEOs are also included.
Regulatory and Compliance
Environmental Services & Sustainability
This slide discusses CEOs' calls to decouple economic growth from environmental degradation, highlighting regional perspectives and CEO quotes on sustainability.
Economic Growth, Natural Resources, Environmental Degradation, Regional Data, Sustainability, CEOs
false
Regulatory and Compliance
Environmental Services & Sustainability
Multiple Chart
Accenture
Add to my slides
Remove from favorites
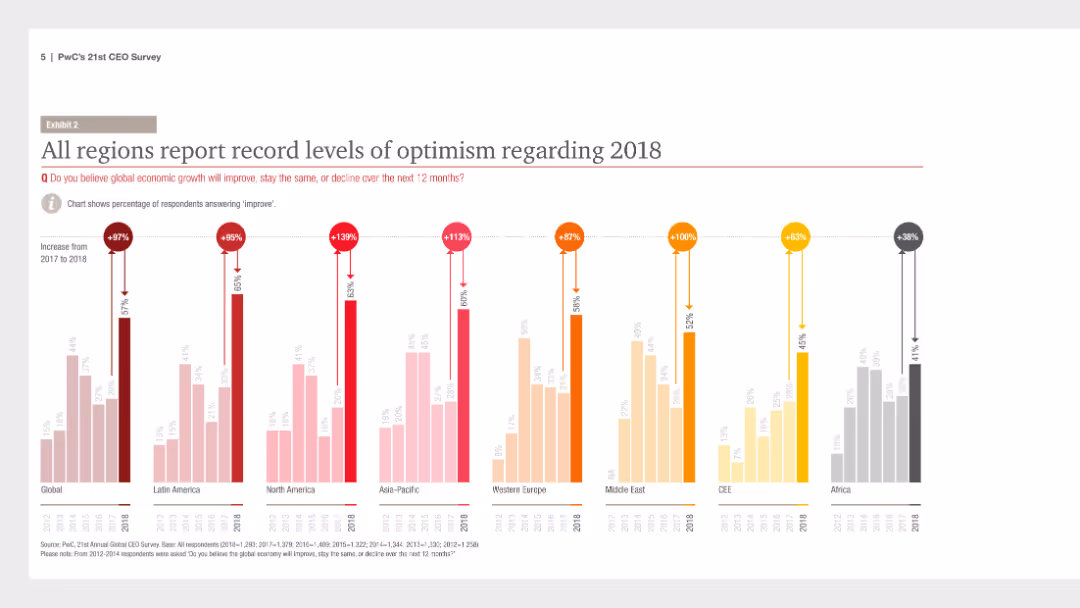
The slide features a column chart showing the percentage increase in economic growth optimism from 2017 to 2018 across various regions, with columns in different colors representing different regions.
Market Analysis and Trends
Financial Services
The slide presents data on economic growth optimism in various global regions, showing significant increases in optimism from 2017 to 2018. Used for analyzing regional economic trends.
economic growth, optimism, regional analysis, 2018, financial survey, PwC, CEO Survey, percentage increase, global regions, column chart
false
Market Analysis and Trends
Financial Services
Multiple Chart
PwC/Strategy&
Add to my slides
Remove from favorites
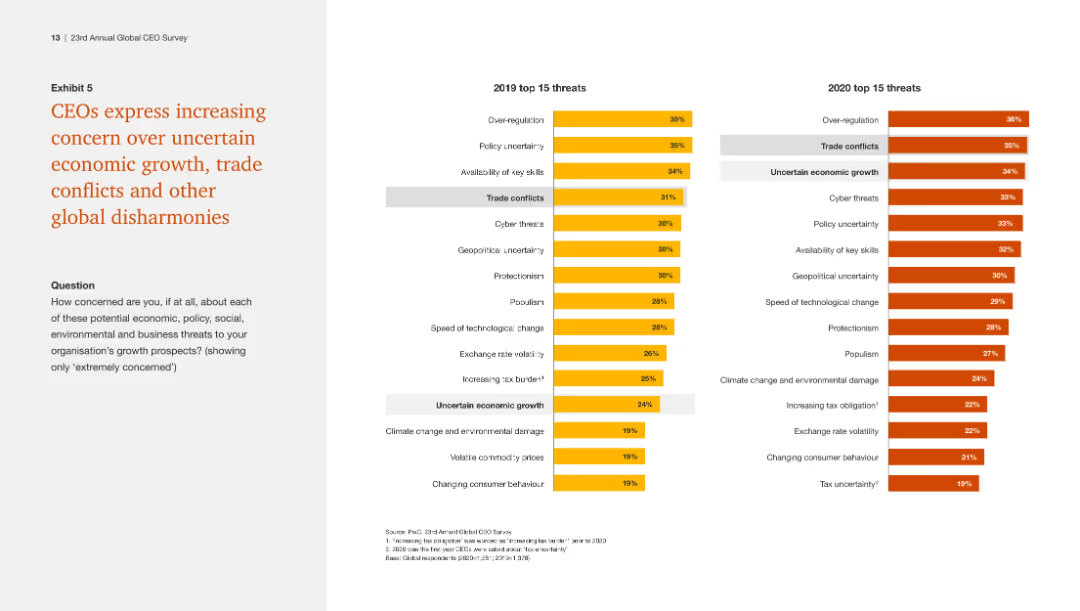
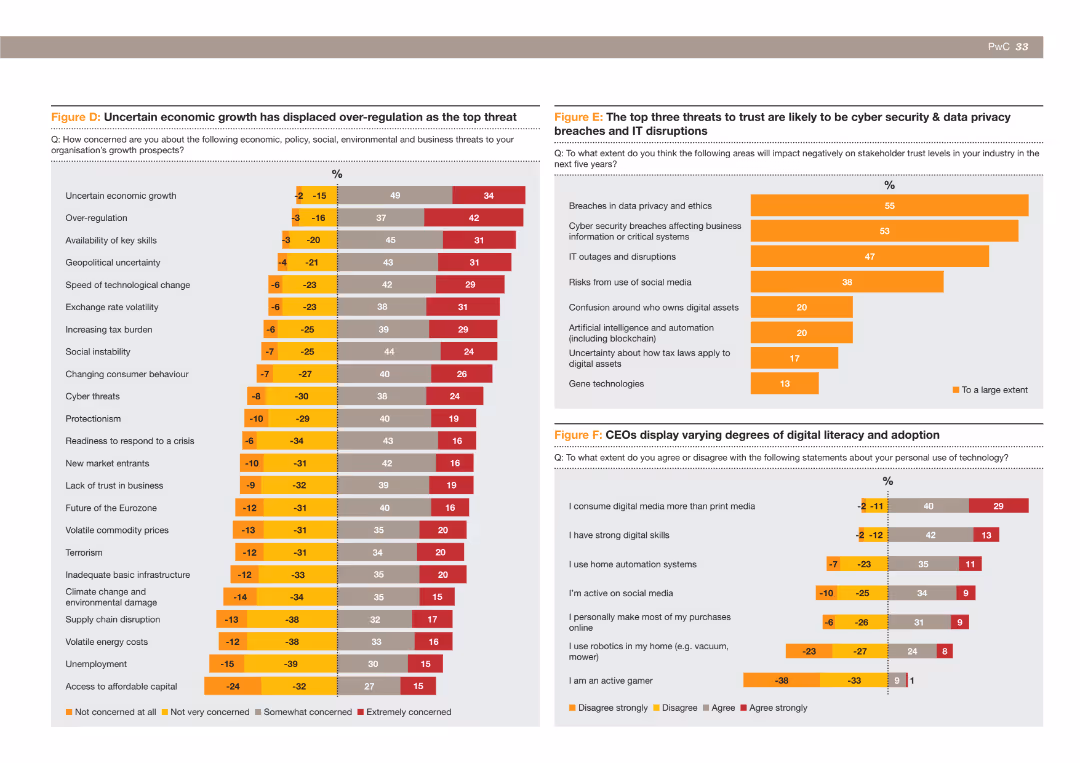
The slide includes a bar chart illustrating the top threats to organizational growth prospects, with uncertain economic growth now seen as a bigger threat than over-regulation.
Risk Assessment and Management
Financial Services
This slide shows the changing perceptions of CEOs regarding the top threats to growth, highlighting that uncertain economic growth is now considered a more significant threat than over-regulation and other issues like tax burden and geopolitical uncertainty.
Economic growth, over-regulation, threats, organizational growth, CEOs, financial services
false
Risk Assessment and Management
Financial Services
Multiple Chart
PwC/Strategy&
Add to my slides
Remove from favorites
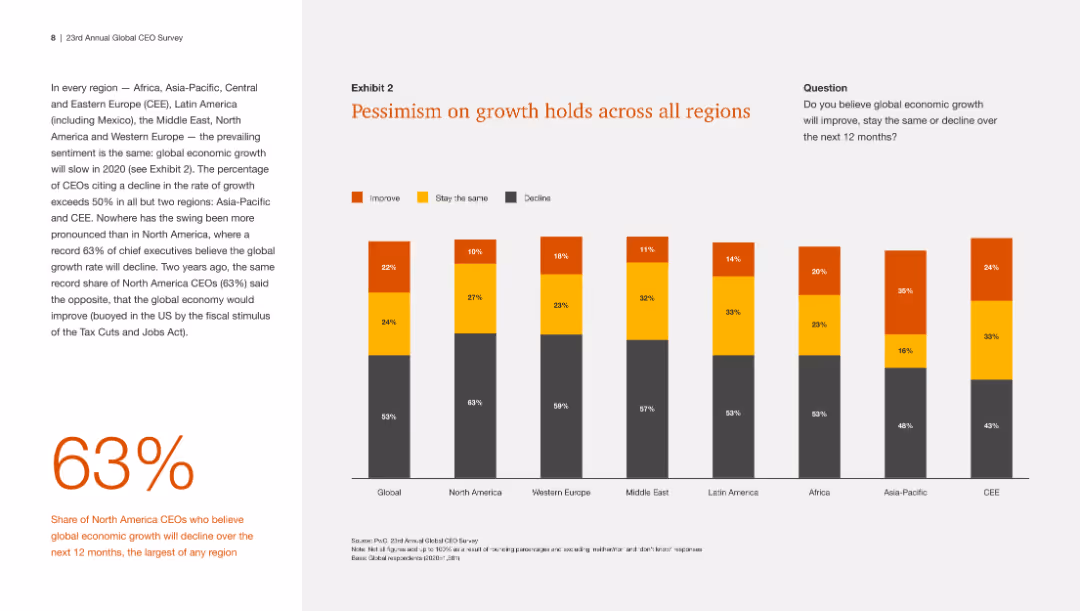
The slide features a column chart showing pessimism about economic growth across different regions, with global percentages of improve, stay the same, and decline highlighted.
Market Analysis and Trends
Financial Services
This slide illustrates the widespread pessimism about economic growth across various regions, with over half of CEOs in most areas expecting a decline.
Economic growth, pessimism, global, regional, outlook
false
Market Analysis and Trends
Financial Services
Mixed Chart
PwC/Strategy&
Add to my slides
Remove from favorites
Features a variety of data visualizations including tables to discuss the drivers of economic growth in the Philippines.
Market Analysis and Trends
Government & Public Sector
Reviews factors driving the Philippine economy, such as consumption, government spending, and the impact of COVID-19 on various sectors.
economic growth, Philippines, COVID-19, government spending, pie charts, column charts, consumption, sectors
false
Market Analysis and Trends
Government & Public Sector
Table
Deloitte
Add to my slides
Remove from favorites
Column chart showing the percentage of time profit margins expanded when S&P 500 sales grew over different periods.
Market Analysis and Trends
Financial Services
Analyzes the correlation between economic growth, profit margin recovery, and high-single-digit earnings growth forecast for the S&P 500 in 2024, based on historical data.
economic growth, profit margins, earnings growth, S&P 500
false
Market Analysis and Trends
Financial Services
Mixed Chart
Goldman Sachs
Add to my slides
Remove from favorites
This slide features multiple bar charts, comparing the prevalence of economic threats across global regions. Each region's chart has a distinct set of data points, with color coding to distinguish between different concerns. The layout is clean, with a clear distinction between charts and descriptive text.
Market Analysis and Trends
Financial Services
This slide presents a visual comparison of various economic threats perceived globally and in specific regions. It can be used to understand regional concerns in economic growth and policy, informing strategic decisions in global business operations.
Economic growth, Risk assessment, Policy uncertainty, Cyber threats, Geopolitical instability, Trade conflicts
false
Market Analysis and Trends
Financial Services
Multiple Chart
PwC/Strategy&
Add to my slides
Remove from favorites
Bar graph displaying Indonesia's economic growth by sector, paired with bullet points highlighting the ICT sector's resilience during COVID-19.
Risk Assessment and Management
Technology & Software
Evaluates the performance of various economic sectors, emphasizing the impact of COVID-19 on the ICT sector which has seen growth.
Economic growth, sectors, COVID-19, ICT, Indonesia, resilience, performance
false
Risk Assessment and Management
Technology & Software
Mixed Chart
Kearney
Add to my slides
Remove from favorites
The slide presents a table with various economic indicators for different countries, including PMI, industrial production, business confidence, and more, with color-coded performance indicators.
Market Analysis and Trends
Financial Services
A comprehensive overview of economic health indicators for multiple countries, highlighting strengths and weaknesses in areas like manufacturing, business confidence, and inflation rates.
Economic health, PMI, business confidence, industrial production, country comparison
false
Market Analysis and Trends
Financial Services
Table
Accenture
Add to my slides
Remove from favorites
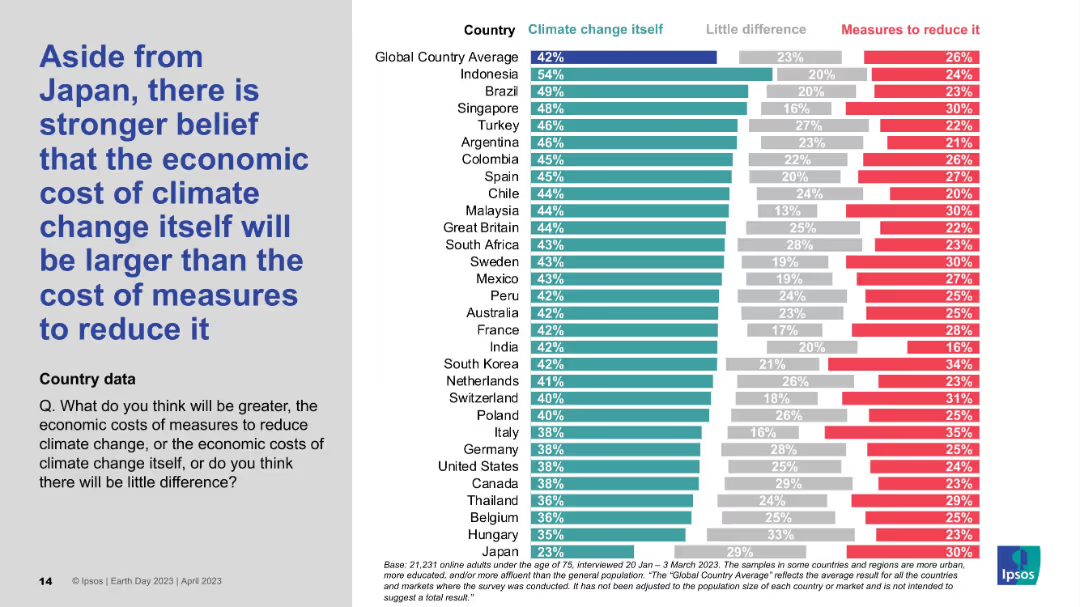
Detailed country-by-country horizontal bar chart; shows comparative belief in economic cost of climate change vs. action.
Market Analysis and Trends
Environmental Services & Sustainability
This chart shows that, aside from Japan, most countries believe the economic cost of inaction on climate change exceeds the cost of mitigation. Indonesia, Brazil, and Singapore lead this sentiment, while Japan stands out for its skepticism.
Economic impact, Climate cost, Mitigation, Global survey, Ipsos data
false
Market Analysis and Trends
Environmental Services & Sustainability
Mixed Chart
IPSOS
Add to my slides
Remove from favorites
Features multiple line charts tracking the Citi Surprise Index over time for global, US, Europe, and China, highlighting significant data points with circles.
Financial Performance
Financial Services
Analyzes the economic performance during the pandemic, noting regions where economic data has "surprised" positively or negatively against expectations.
economic impact, COVID-19, Citi Surprise Index, global, regions
false
Financial Performance
Financial Services
Multiple Chart
BCG
Add to my slides
Remove from favorites
Column chart depicting additional worries beyond health, such as economic impacts, education, and social connections during the pandemic.
Market Analysis and Trends
Healthcare & Pharmaceuticals
Showcases other significant worries during COVID-19, such as economic impact, children's education, and lack of social contact.
economic impact, education, social contact, pandemic, worries
false
Market Analysis and Trends
Healthcare & Pharmaceuticals
Mixed Chart
IPSOS
Add to my slides
Remove from favorites
Tables and color-coded data blocks comparing various metrics.
Financial Performance
Financial Services
Provides a comparative analysis of the global economic impact due to the pandemic, including GDP forecasts, stock market performance, and consumer activity.
economic, impact, GDP, market, pandemic
false
Financial Performance
Financial Services
Mixed Chart
BCG
Add to my slides
Remove from favorites
This slide uses three line charts with shaded areas to compare the projected impacts on real GDP in different regions of New York, including NYC, Greater Metro (excluding NYC), and the rest of NY State. Each region is highlighted in a different color.
Market Analysis and Trends
Financial Services
The slide analyzes the economic impact of the COVID-19 pandemic on different regions of New York, focusing on real GDP declines and recoveries. It highlights specific impacts and recovery timelines up to 2025.
economic impact, GDP, NYC, Greater Metro, NY State, pandemic, forecast, recovery, line chart
false
Market Analysis and Trends
Financial Services
Multiple Chart
BCG
Add to my slides
Remove from favorites
The slide features a bar chart showing the economic impact of each GTA home sale, with various categories such as professional services, renovations, and general household purchases.
Market Analysis and Trends
Real Estate & Construction
This slide concludes with the economic benefits of home sales, highlighting the different areas where each sale contributes financially.
economic impact, home sales, GTA, financial benefits, bar chart, professional services
false
Market Analysis and Trends
Real Estate & Construction
Single Chart
IPSOS
Add to my slides
Remove from favorites
The slide provides a breakdown of NBN Co's economic impact with bullet points and headers that detail methodology, target groups, and key metrics.
Financial Performance
Telecommunications
This slide details the economic modeling conducted by NBN Co to assess its impact on employment, income, and education, supporting previous survey data.
economic impact, NBN Co, employment, education, modeling, survey data
false
Financial Performance
Telecommunications
Header Vertical
Accenture
Add to my slides
Remove from favorites
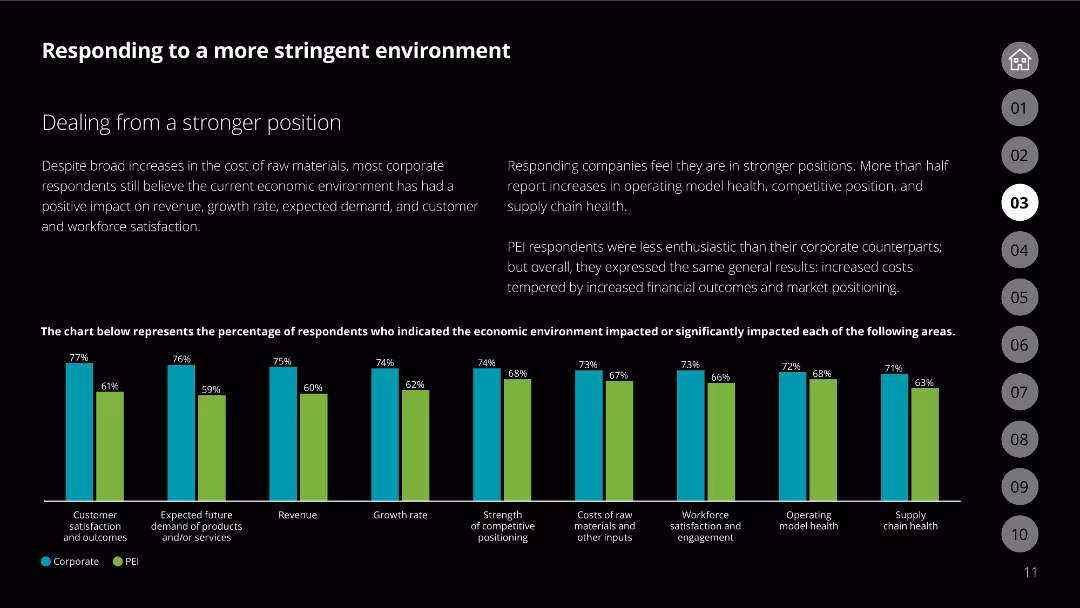
This slide includes a column chart showing how the economic environment impacts different areas for corporations and PEIs.
Operational Efficiency
Financial Services
Discusses how the economic environment has positively impacted various operational metrics for corporations.
economic impact, operational efficiency, PEI, corporations, metrics
false
Operational Efficiency
Financial Services
Mixed Chart
Deloitte
Add to my slides
Remove from favorites
The slide has an impactful visual with a futuristic aircraft image, title text overlay, and a nighttime backdrop.
Market Analysis and Trends
Industrial & Manufacturing
This is the title slide for a report on the Tempest Programme, hinting at the extensive analysis of its economic impact from 2021 to 2050.
economic impact, Tempest Programme, aerospace, defense, forecasting
false
Market Analysis and Trends
Industrial & Manufacturing
Title
PwC/Strategy&
Add to my slides
Remove from favorites
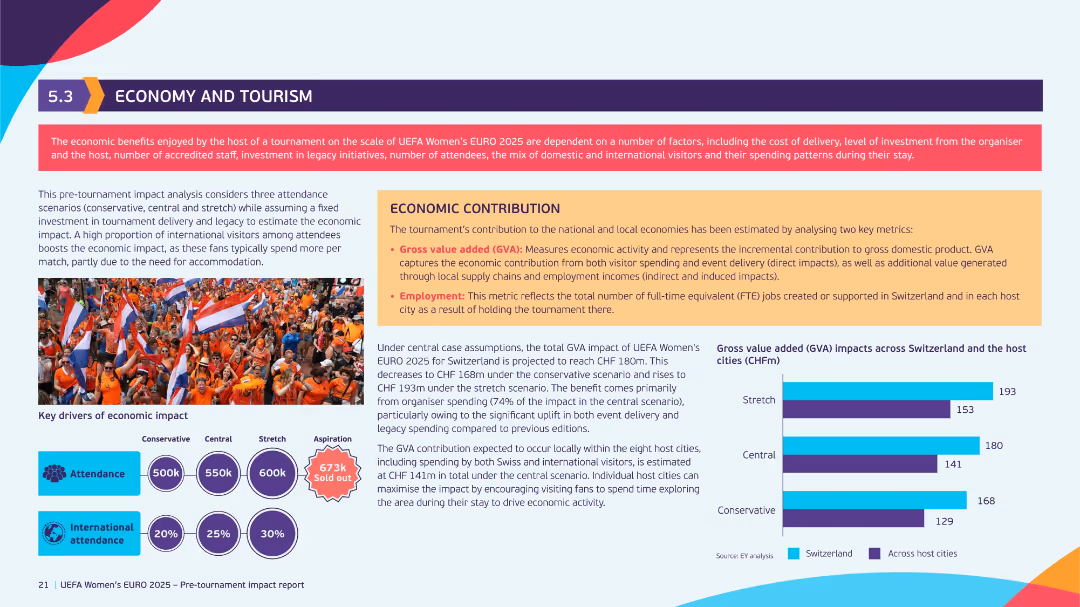
Orange-accented layout with left column on attendance forecasts and right column on economic contribution. Contains bar chart on Gross Value Added (GVA) and colorful infographics.
Investment Analysis
Hospitality & Tourism
This slide assesses the projected economic impact of UEFA Women’s EURO 2025 on Switzerland. It estimates GVA based on three attendance scenarios and outlines benefits including job creation and increased tourist spending. Visuals highlight key economic drivers.
economic impact, tourism, GVA, UEFA, employment, spending patterns, host cities
false
Investment Analysis
Hospitality & Tourism
Mixed Chart
EY
Add to my slides
Remove from favorites
Multiple charts showing various economic indicators, including restructuring cases, profit warnings, volatility, and early warning indicators.
Market Analysis and Trends
Financial Services
The slide presents the initial consequences of a fragile economic environment, using various indicators to highlight trends in restructuring, profit warnings, market volatility, and early warning signals. It emphasizes the impact of these factors on the overall economic outlook and business climate.
Economic Indicators, Fragile Environment, Market Volatility
false
Market Analysis and Trends
Financial Services
Multiple Chart
Roland Berger
Add to my slides
Remove from favorites
Features line graphs and column charts detailing economic indicators, interest rates, and credit cycle concerns.
Risk Assessment and Management
Financial Services
Examines the potential cyclical headwinds faced by the industry and the economic growth forecasts.
Economic indicators, interest rates, credit cycle, economic growth, cyclical headwinds
false
Risk Assessment and Management
Financial Services
Multiple Chart
JP Morgan
Add to my slides
Remove from favorites
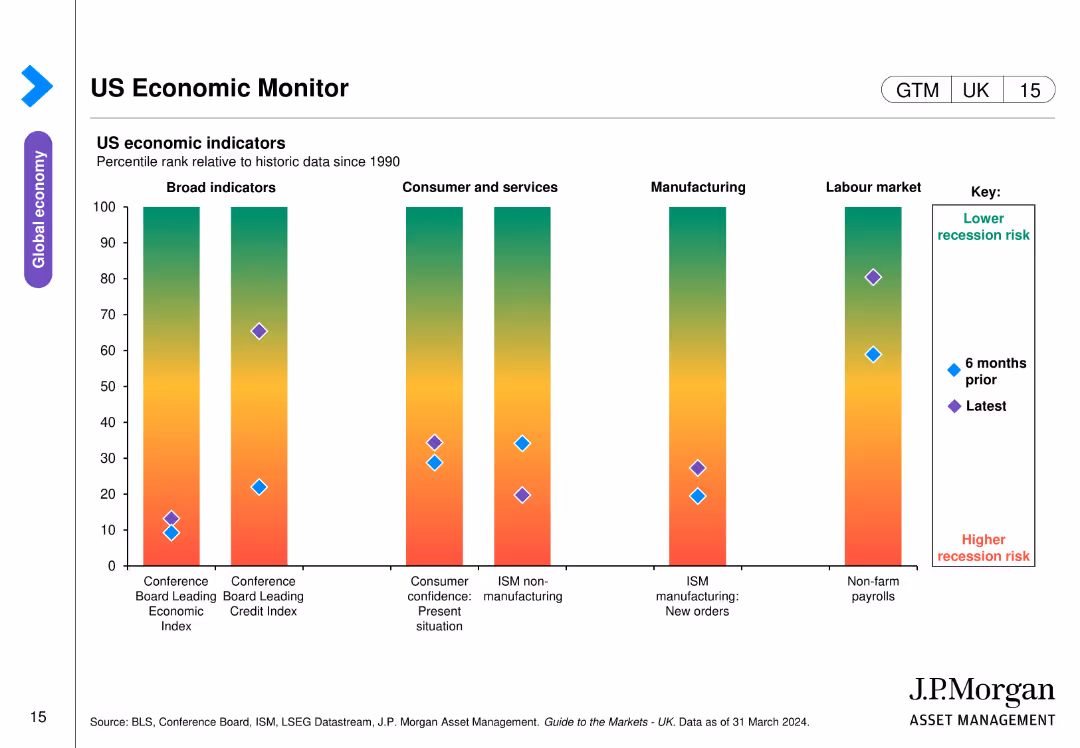
The slide shows a bar chart with percentile ranks of various US economic indicators (Broad indicators, Consumer and services, Manufacturing, Labour market) relative to historic data since 1990, with color-coded risk levels.
Market Analysis and Trends
Financial Services
This slide monitors key US economic indicators, helping assess recession risks and economic health, essential for making informed financial and investment decisions.
Economic indicators, recession risk, US economy, market analysis, risk assessment
false
Market Analysis and Trends
Financial Services
Single Chart
JP Morgan
Add to my slides
Remove from favorites
Combines bar graphs and textual information, with colors indicating the severity of economic impact across different countries and groups.
Regulatory and Compliance
Financial Services
Highlights the disparate economic impacts of the pandemic on various demographics, including women and low-income workers, urging policy action.
economic inequality, pandemic, policy, demographics, impact
false
Regulatory and Compliance
Financial Services
Mixed Chart
BCG
Add to my slides
Remove from favorites
Horizontal bar chart with each country's agreement levels on the statement about economic unfairness. Historical changes are shown on the right.
Market Analysis and Trends
Government & Public Sector
This slide reveals how citizens perceive economic inequality in their countries. Thailand and South Korea show high belief in systemic economic bias. Italy, France, Germany, and Canada have seen significant increases in agreement, correlating with cost-of-living crises.
economic inequality, rigged economy, Ipsos, public perception, systemic bias, international sentiment
false
Market Analysis and Trends
Government & Public Sector
Mixed Chart
IPSOS
Add to my slides
Remove from favorites
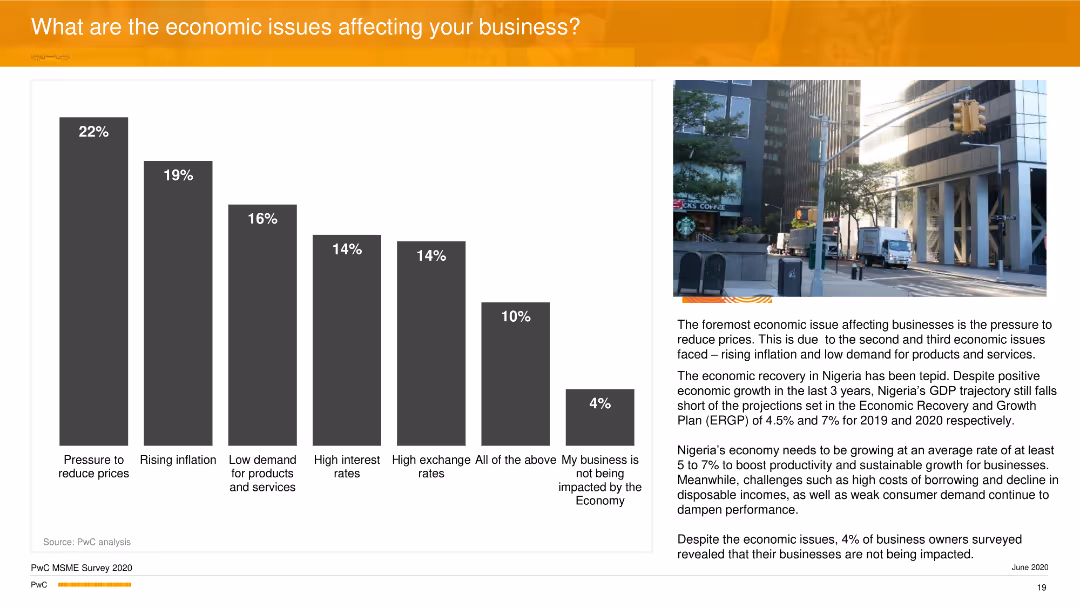
This slide includes a vertical column chart detailing economic issues such as price reduction pressures and inflation. A cityscape image is placed on the right.
Risk Assessment and Management
Financial Services
The slide details economic challenges affecting businesses, with pressure to reduce prices and rising inflation being the most significant. It discusses the overall impact on Nigeria's GDP and business performance.
Economic Issues, Inflation, Business, GDP, PwC
false
Risk Assessment and Management
Financial Services
Mixed Chart
PwC/Strategy&
Add to my slides
Remove from favorites
Diagram with icons representing various economic sectors and interactions. Includes bullet points explaining the model's capabilities and analysis scope.
Strategic Planning
Energy & Utilities
Describes EY's computable general equilibrium model for analyzing economic impacts, detailing its comprehensive regional and sectoral analysis capabilities.
Economic Model, CGE, Industry Impacts, EY, Regional Analysis, Sectoral Analysis, Economic Forecasting
false
Strategic Planning
Energy & Utilities
Diagram
EY
Add to my slides
Remove from favorites
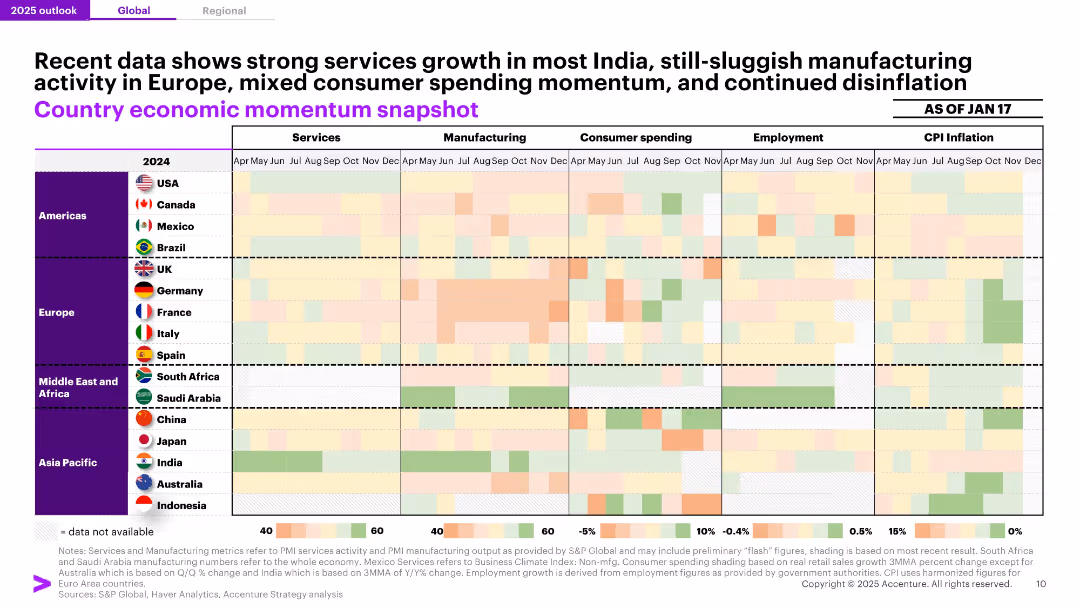
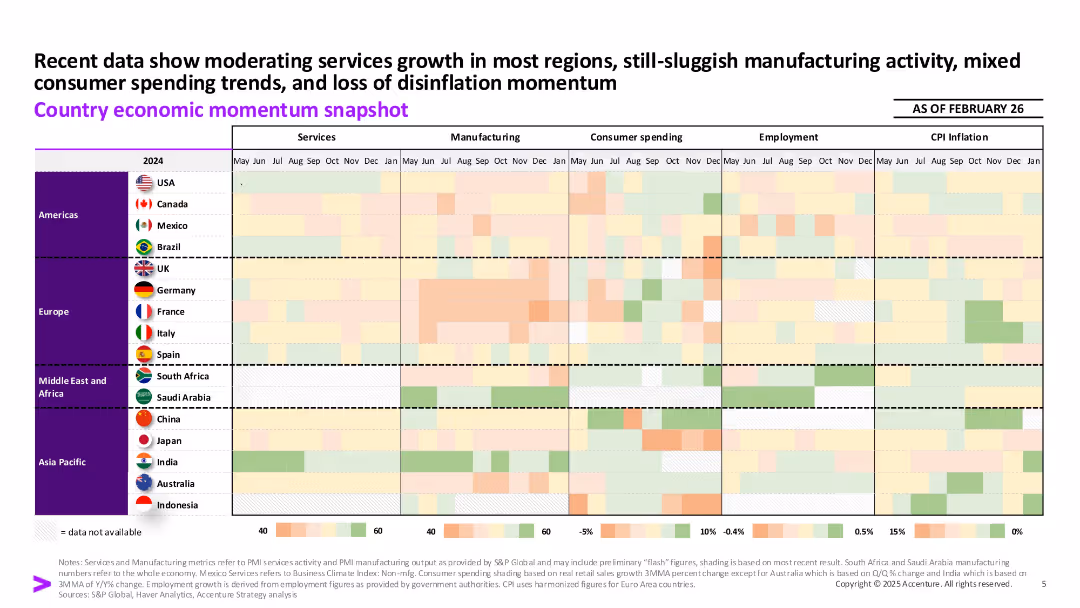
Grid heatmap comparing Services, Manufacturing, Consumer Spending, Employment, and CPI Inflation across countries and months. Color-coded scale visualizes relative activity/momentum.
Market Analysis and Trends
Financial Services
A color-coded economic snapshot across global regions shows stronger services momentum in India and sluggish manufacturing across Europe. The heatmap allows visual comparison of economic indicators like CPI, employment, and consumer spending as of January 2025.
Economic Momentum, Heatmap, India, CPI, Employment, Services, Manufacturing, Consumer Spending, Regional Analysis
false
Market Analysis and Trends
Financial Services
Single Chart
Accenture
Add to my slides
Remove from favorites
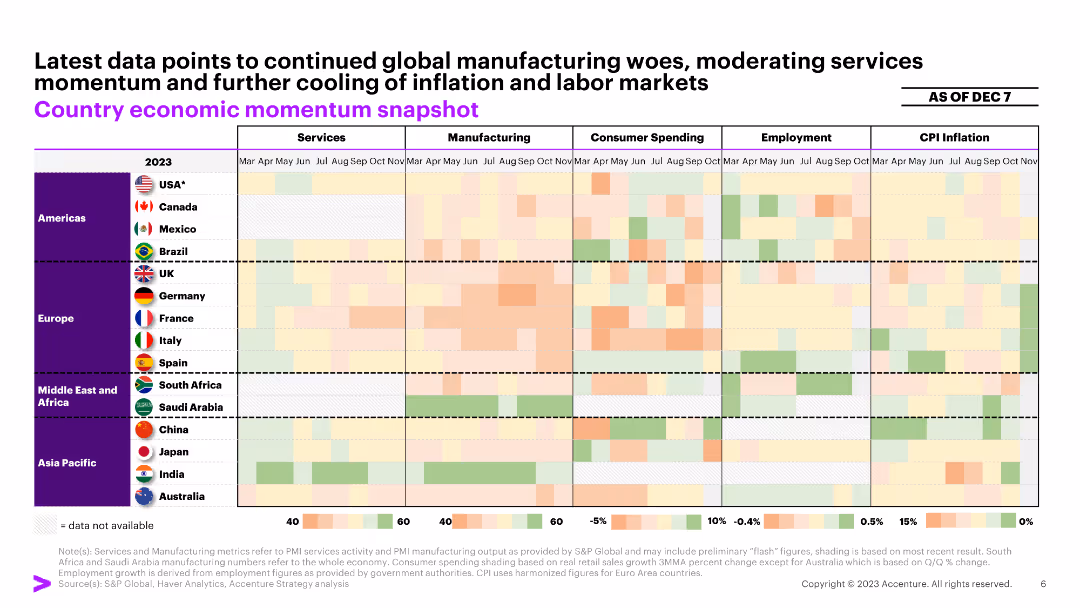
The slide includes a table with color-coded cells representing economic momentum in services, manufacturing, consumer spending, employment, and CPI inflation across various countries.
Market Analysis and Trends
Financial Services
This slide provides a snapshot of economic momentum indicators across different sectors and countries. It helps in assessing economic health and identifying trends.
economic momentum, indicators, financial services, global economy, sector analysis
false
Market Analysis and Trends
Financial Services
Table
Accenture
Add to my slides
Remove from favorites
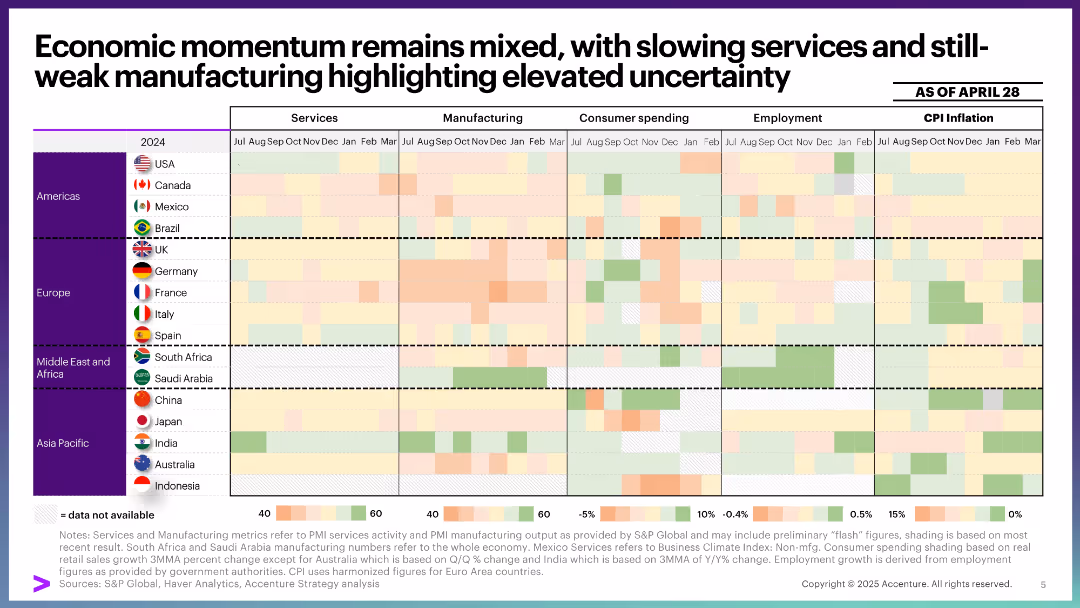
Matrix-style heatmap table with countries as rows and metrics (services, manufacturing, spending, employment, inflation) as columns. Color-coded by performance intensity.
Performance Metrics and KPIs
Professional Services
Shows country-level economic performance across five key metrics through monthly snapshots. Highlights regional differences in economic momentum, with manufacturing notably weak and inflation varied. A tool for cross-comparative economic health evaluation.
economic momentum, services, manufacturing, CPI, employment, spending, heatmap, performance, macroeconomics, global outlook
false
Performance Metrics and KPIs
Professional Services
Single Chart
Accenture
Add to my slides
Remove from favorites
Large heatmap matrix showing global metrics (services, manufacturing, etc.) over time and countries. Structured as a grid with color coding, flags, and category labels.
Market Analysis and Trends
Government & Public Sector
A macroeconomic overview showing global economic activity across sectors like services and inflation, using heatmaps. Tracks country-level momentum and highlights regional performance variations as of February 26.
economic momentum, services, manufacturing, inflation, global trends, snapshot
false
Market Analysis and Trends
Government & Public Sector
Single Chart
Accenture
Add to my slides
Remove from favorites
Includes a line graph and a column chart comparing global trade intensity and trade barriers, alongside detailed textual analysis, on a background of purple and white tones.
Strategic Planning
Energy & Utilities
Analyzes the shift towards economic nationalism and its effects on Australia's energy strategies, discussing global trade trends and barriers in relation to energy independence.
economic nationalism, trade barriers, global trends, energy strategy, Australia, geopolitical analysis
false
Strategic Planning
Energy & Utilities
Multiple Chart
Accenture
Add to my slides
Remove from favorites
The slide presents multiple line charts depicting changes in economic optimism over time. Each line represents a different economic sector, allowing for sector-specific trend analysis. Color coding and clear labeling aid in distinguishing between the data.
Market Analysis and Trends
Professional Services
This slide examines the volatility in economic optimism, particularly in response to inflation and other market forces. It compares current sentiments to historical data, providing insights into how different sectors are adapting to ongoing economic challenges.
Economic Optimism, Inflation, Market Forces, Sector Analysis, Trends
false
Market Analysis and Trends
Professional Services
Mixed Chart
Deloitte
Add to my slides
Remove from favorites
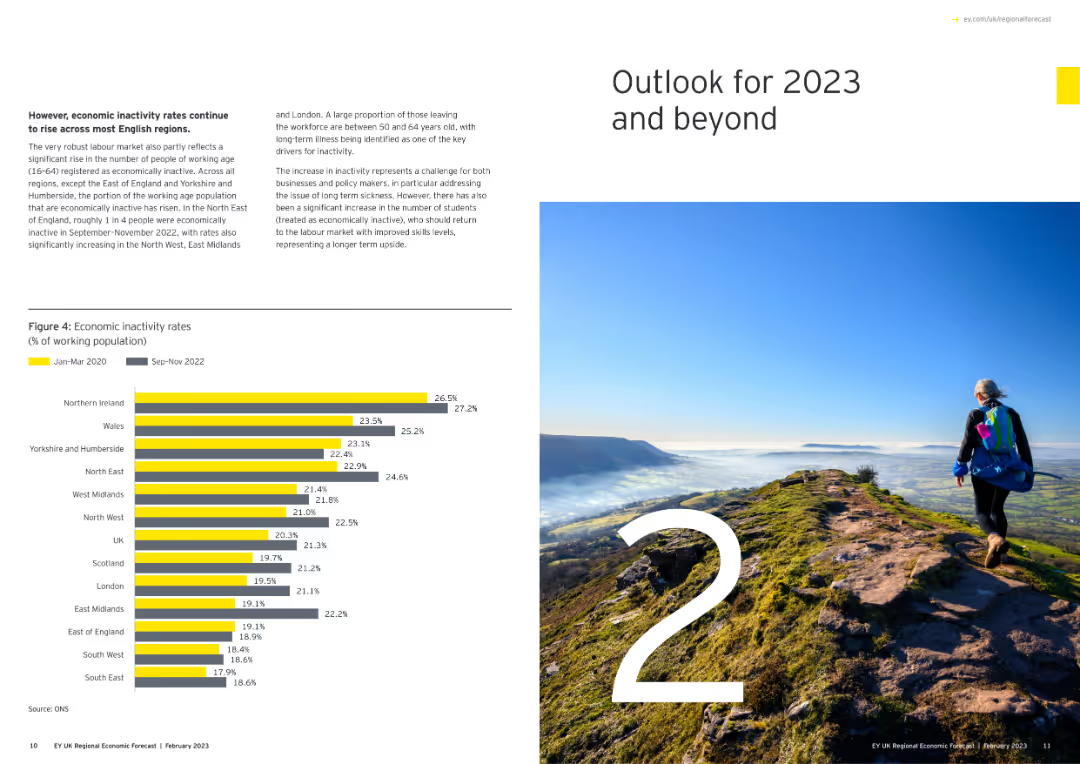
Features a large number "2" with an image of a person hiking on a mountain, and a column chart showing economic inactivity rates.
Strategic Planning
Government & Public Sector
Outlines the economic outlook for 2023 and beyond, focusing on inactivity rates among the working population across various regions.
economic outlook, 2023, inactivity rates, regional, column chart
false
Strategic Planning
Government & Public Sector
Mixed Chart
EY
Add to my slides
Remove from favorites
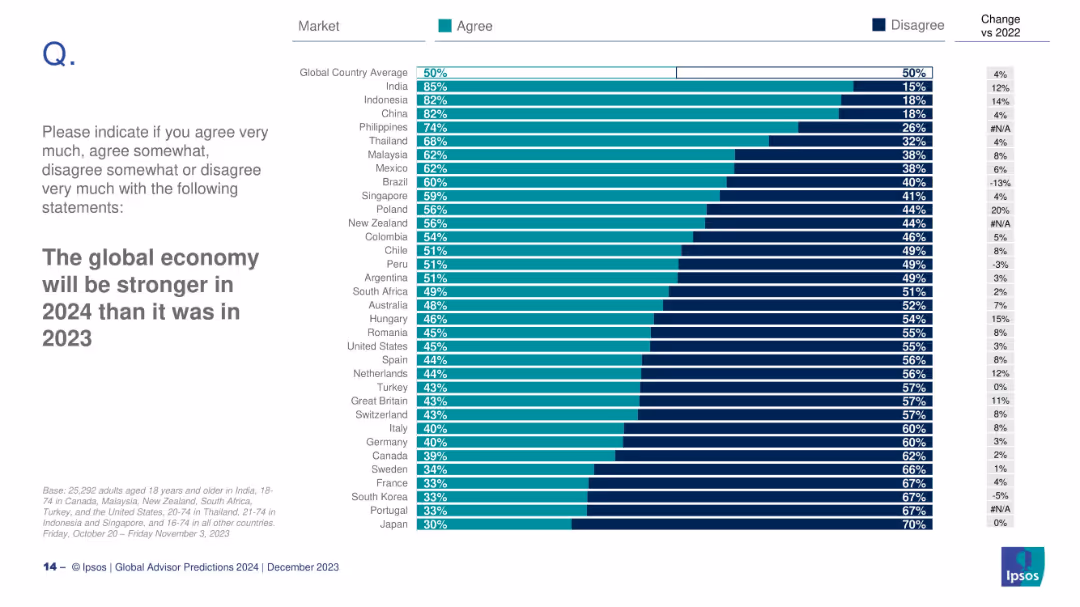
Bar chart by country measuring belief in economic improvement; includes % changes.
Financial Performance
Professional Services
This slide measures belief in a stronger global economy in 2024. India (85%) and Indonesia (82%) are most optimistic; Japan (30%) and Portugal (33%) are least.
economic outlook, 2024, global economy, confidence, Ipsos, predictions
false
Financial Performance
Professional Services
Mixed Chart
IPSOS
Add to my slides
Remove from favorites
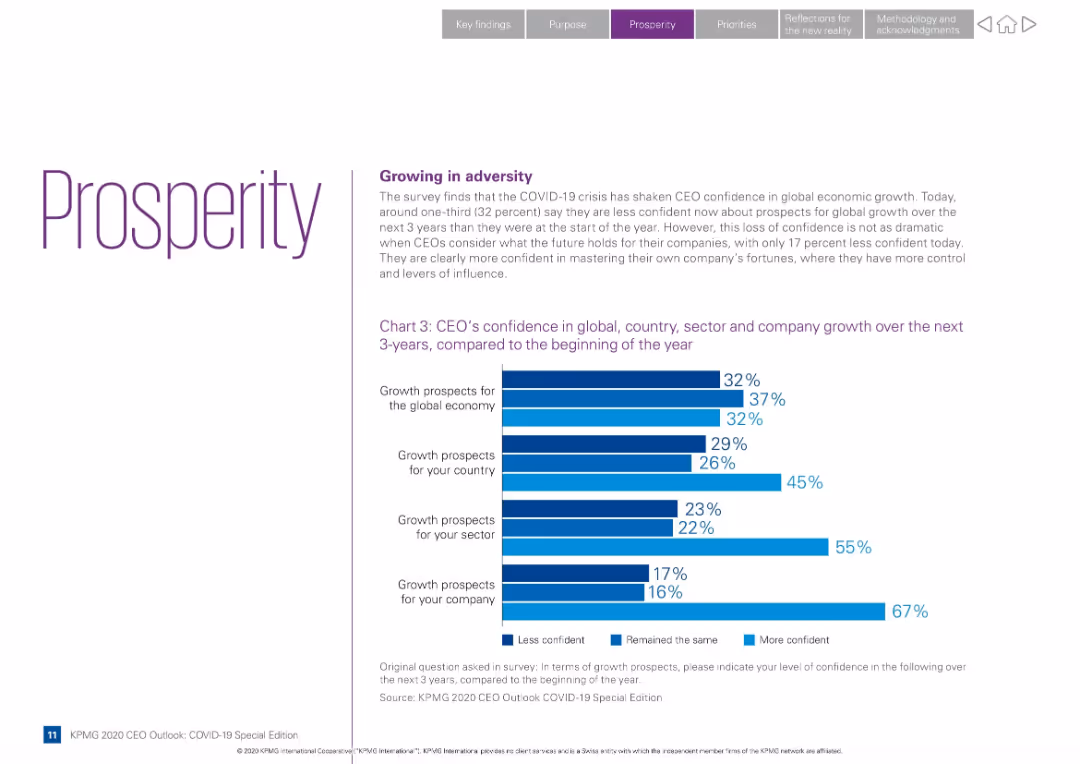
Minimalist design with purple branding; includes a bar chart comparing confidence levels in different growth areas
Strategic Planning
Professional Services
Examines how COVID-19 has affected CEO confidence in economic growth. Bar chart compares current confidence in global, country, sector, and company growth vs. start-of-year expectations.
economic outlook, CEO confidence, COVID-19, global growth, sector confidence, bar chart, future expectations, business prospects
false
Strategic Planning
Professional Services
Mixed Chart
KPMG
Add to my slides
Remove from favorites
Various charts including bar and pie charts depicting firms' confidence levels, challenges, and growth expectations.
Market Analysis and Trends
Financial Services
This slide assesses firms' confidence in the economic outlook for 2023, highlighting major concerns such as supply chain issues, tight margins, and growth prospects.
Economic outlook, firms' confidence, supply chain, margins, growth, challenges, expectations, trends, 2023
false
Market Analysis and Trends
Financial Services
Multiple Chart
EY
Add to my slides
Remove from favorites
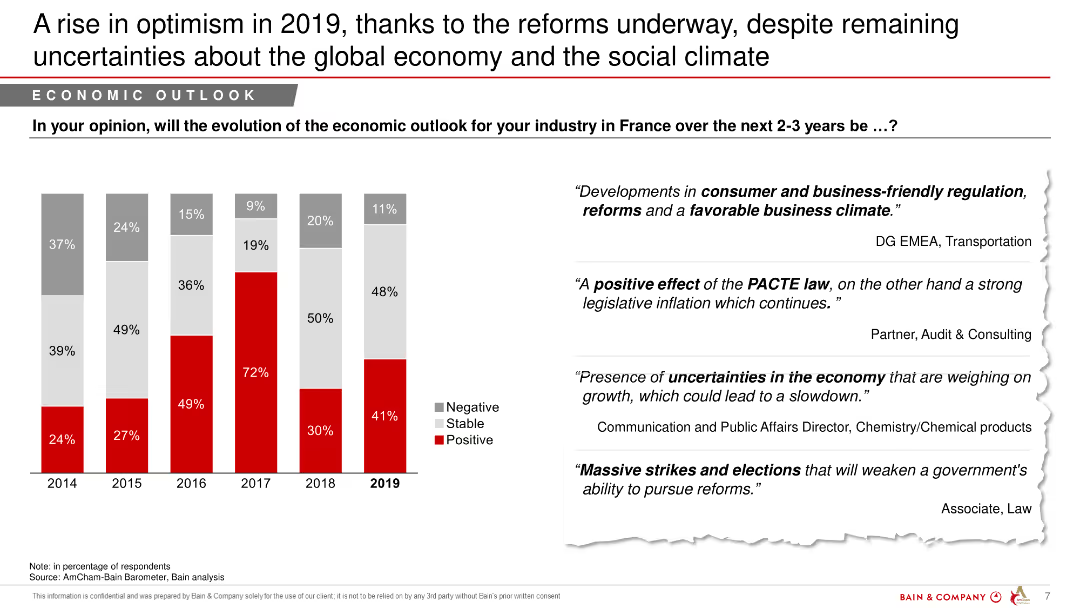
Contains a column chart showing responses from 2013-2018 regarding the economic outlook for industries in France, accompanied by quotes from industry leaders.
Market Analysis and Trends
Professional Services
Analyzes perceptions of economic outlook over time among professionals in France, showing more optimism in recent years despite global uncertainties.
economic outlook, France, industry analysis, business sentiment, global impact
false
Market Analysis and Trends
Professional Services
Mixed Chart
Bain
Add to my slides
Remove from favorites
Features several data visualizations: a dashed line chart forecasting GDP growth up to 2027 comparing predictions from IMF and domestic analysts; a column chart illustrating contributions to annual inflation rates across Europe, UK, US, and Iceland as of April 2022; and a line chart showing central banks' key interest rates and forward rates.
Market Analysis and Trends
Financial Services
Discusses Iceland's economic prospects, expected to surpass pre-COVID levels in 2022, driven by tourism, investment, and consumption. The slide covers future GDP projections, inflation contributors, and central bank interest forecasts, framing the overall economic situation as optimistic despite challenges like rising house prices and inflation.
economic outlook, GDP growth, inflation, interest rates, Iceland
false
Market Analysis and Trends
Financial Services
Multiple Chart
Deutsche Bank
Add to my slides
Remove from favorites
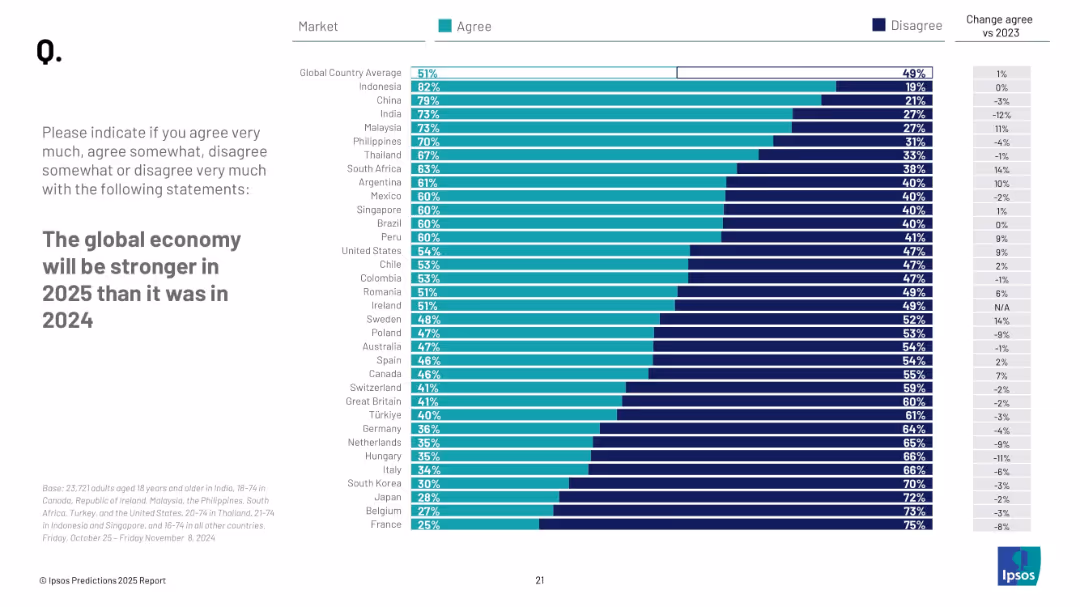
Bar chart with "Agree" and "Disagree" percentages by country; sorted descending by "Agree"; includes a "Change agree vs 2023" column on the right.
Market Analysis and Trends
Financial Services
This slide measures confidence in global economic recovery or strength in 2025, comparing multiple markets. It also shows how sentiment has changed versus the previous year (2023).
economic outlook, global economy, recovery expectations, country comparison, Ipsos, 2025 forecast
false
Market Analysis and Trends
Financial Services
Mixed Chart
IPSOS
Add to my slides
Remove from favorites
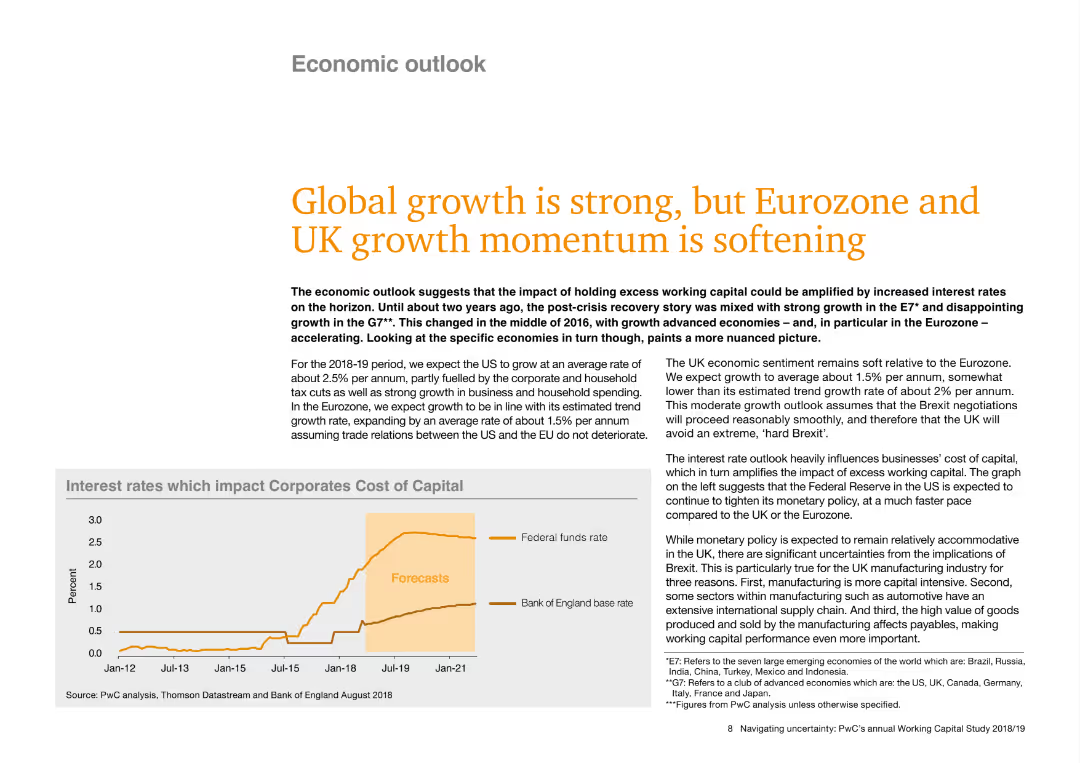
The slide features a main title in large text, followed by several paragraphs of detailed content. A line chart at the bottom shows interest rates impacting corporate cost of capital from 2012 to 2021. Two lines represent the Federal funds rate and Bank of England base rate.
Market Analysis and Trends
Financial Services
The slide discusses the economic outlook, highlighting strong global growth with softening momentum in the Eurozone and UK. It predicts growth rates for the US, Eurozone, and UK, and discusses the impact of interest rates on corporate costs.
Economic outlook, interest rates, US growth, UK growth, Eurozone, corporate cost, Federal funds rate, Bank of England rate
false
Market Analysis and Trends
Financial Services
Mixed Chart
PwC/Strategy&
Add to my slides
Remove from favorites
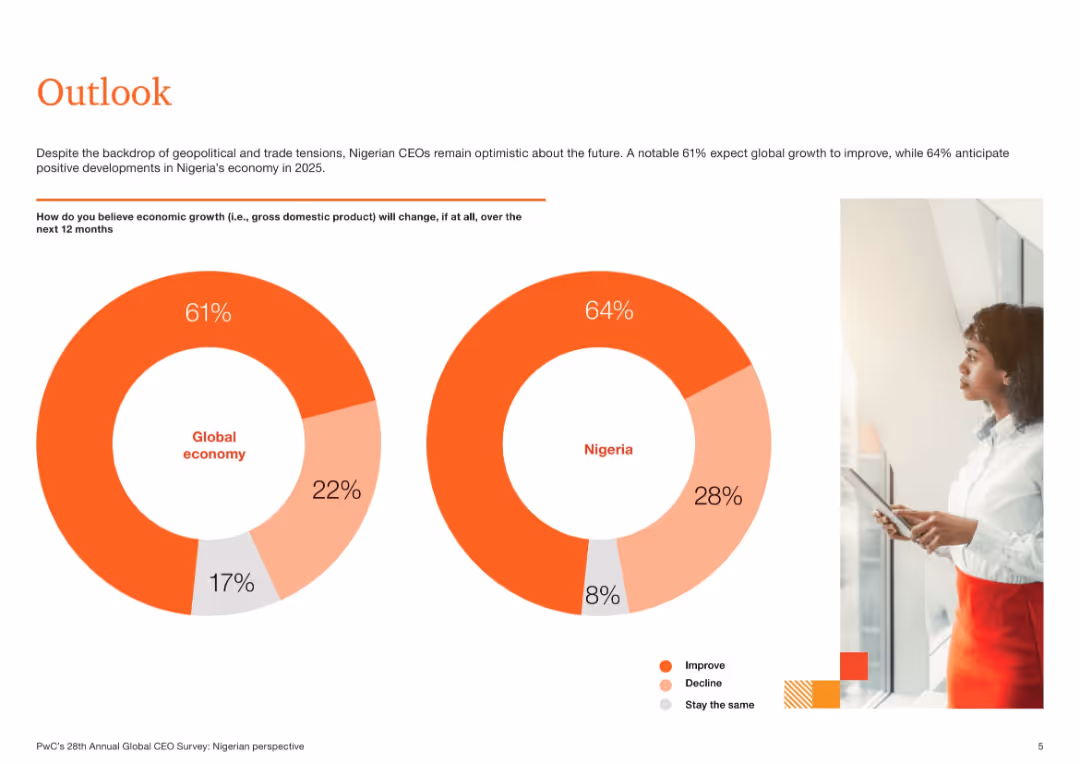
Two donut charts comparing CEO expectations for economic growth globally and in Nigeria. Orange and white minimalist color scheme with right-aligned image of a businesswoman.
Market Analysis and Trends
Professional Services
This slide reveals optimistic economic sentiment among Nigerian CEOs, with 64% expecting national growth and 61% expecting global growth in 2025. It conveys the forward-looking expectations regarding GDP change and portrays a positive economic outlook despite global tensions.
economic outlook, Nigeria, global growth, CEO sentiment, GDP, 2025, optimism
false
Market Analysis and Trends
Professional Services
Single Chart
PwC/Strategy&
Add to my slides
Remove from favorites
A column chart showing the evolution of economic outlook perceptions from 2014 to 2019, with accompanying text quotes.
Market Analysis and Trends
Financial Services
This slide tracks changes in economic outlook perceptions over several years, highlighting increased optimism in 2019.
economic outlook, optimism, financial services, market analysis, yearly comparison, perceptions
false
Market Analysis and Trends
Financial Services
Mixed Chart
Bain
Add to my slides
Remove from favorites
The slide has stacked bar graphs representing leaders' economic outlook and expectations for the year ahead, including revenue, profit, and capital expenditure projections.
Financial Performance
Financial Services
Displays business leaders' sentiments on the global and national economic prospects and their company’s performance, indicating general optimism for sales and profits amidst a cautious economic view.
Economic Outlook, Performance, Profit, Sales
false
Financial Performance
Financial Services
Multiple Chart
JP Morgan
Add to my slides
Remove from favorites
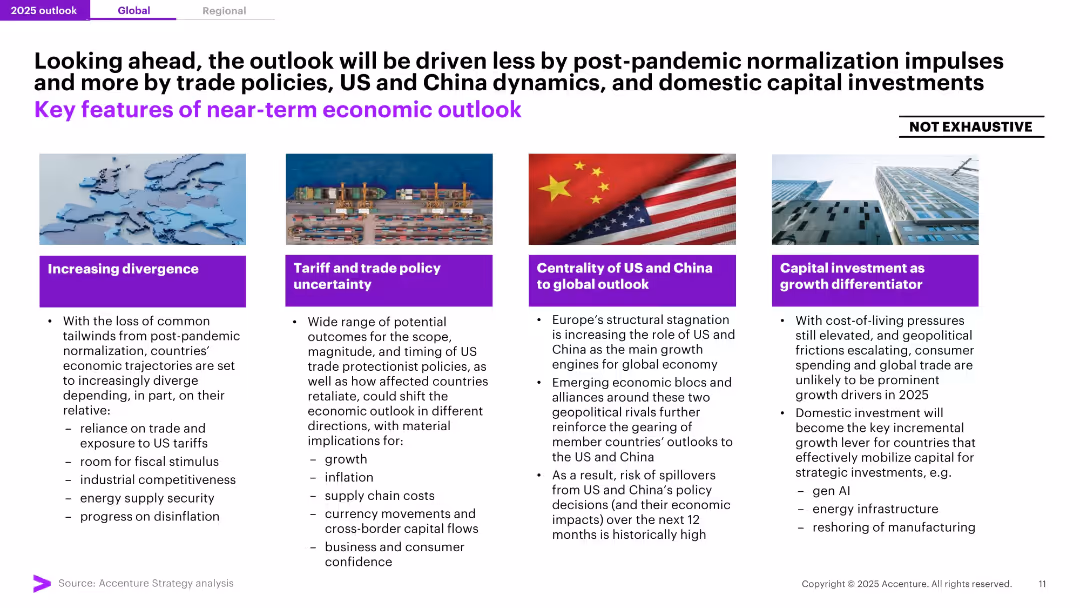
Four-panel layout with bold iconography and brief bulleted points below themed headers in purple. High-contrast layout with minimal clutter.
Strategic Planning
Professional Services
The slide summarizes the key drivers of the 2025 economic outlook: divergence in national growth paths, tariff uncertainty, US-China dynamics, and the growing importance of domestic capital investments. Highlights risk and opportunity areas shaping near-term global economic conditions.
Economic Outlook, Trade, US-China, Investment, Divergence, Tariffs, 2025, Drivers, Strategy, Growth Differentiators
false
Strategic Planning
Professional Services
Pillar
Accenture
Add to my slides
Remove from favorites
A content slide with two line charts: one showing Metro Vancouver's monthly GDP from December 2019 to June 2020, and the other showing the unemployment rate trends for Canada, British Columbia, and Metro Vancouver.
Market Analysis and Trends
Professional Services
This slide analyzes the economic output and employment impact of COVID-19 on Metro Vancouver, comparing GDP and unemployment trends with Canada and British Columbia.
economic output, employment impact, GDP, unemployment rate, COVID-19
false
Market Analysis and Trends
Professional Services
Multiple Chart
Deloitte
Add to my slides
Remove from favorites
Features a column chart comparing sectoral performance in 2023 across agriculture, industries, and services.
Financial Performance
Financial Services
Analyzes GDP performance in 2023, highlighting the significant growth in the services sector despite challenges in other sectors.
economic performance, 2023, services sector, GDP growth, agriculture, industries, sectoral performance
false
Financial Performance
Financial Services
Mixed Chart
PwC/Strategy&
Add to my slides
Remove from favorites
Donut charts showing economic value generated and distributed in FY22 and FY23 across different industry sectors
Financial Performance
Financial Services
This slide displays economic value generated and distributed at the group level, with comparisons between FY22 and FY23, highlighting various industry sectors such as automotive, healthcare, and technology
economic performance, value distribution, industry sectors, FY22, FY23
false
Financial Performance
Financial Services
Multiple Chart
PwC/Strategy&
Add to my slides
Remove from favorites
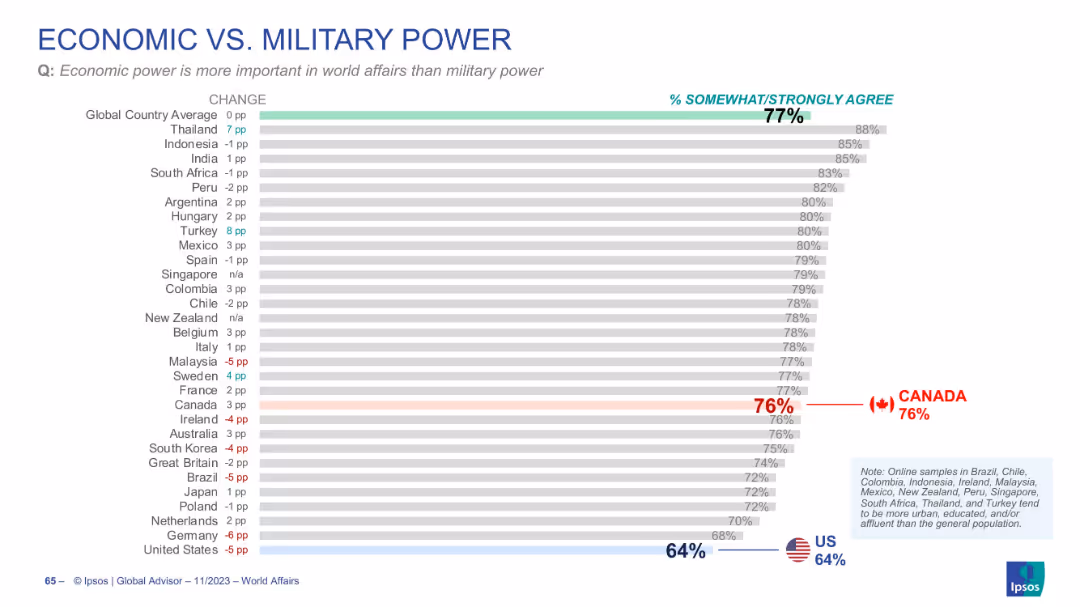
Horizontal bar graph showing agreement with the statement favoring economic power over military power; includes change indicators.
Strategic Planning
Government & Public Sector
The chart explores global sentiment that economic power outweighs military power in world affairs. The global average agreement is 77%, with highest consensus in Thailand and Indonesia, and lower agreement in the US.
economic power, military power, global opinion, Ipsos survey, international relations, strategic priorities
false
Strategic Planning
Government & Public Sector
Single Chart
IPSOS
Add to my slides
Remove from favorites
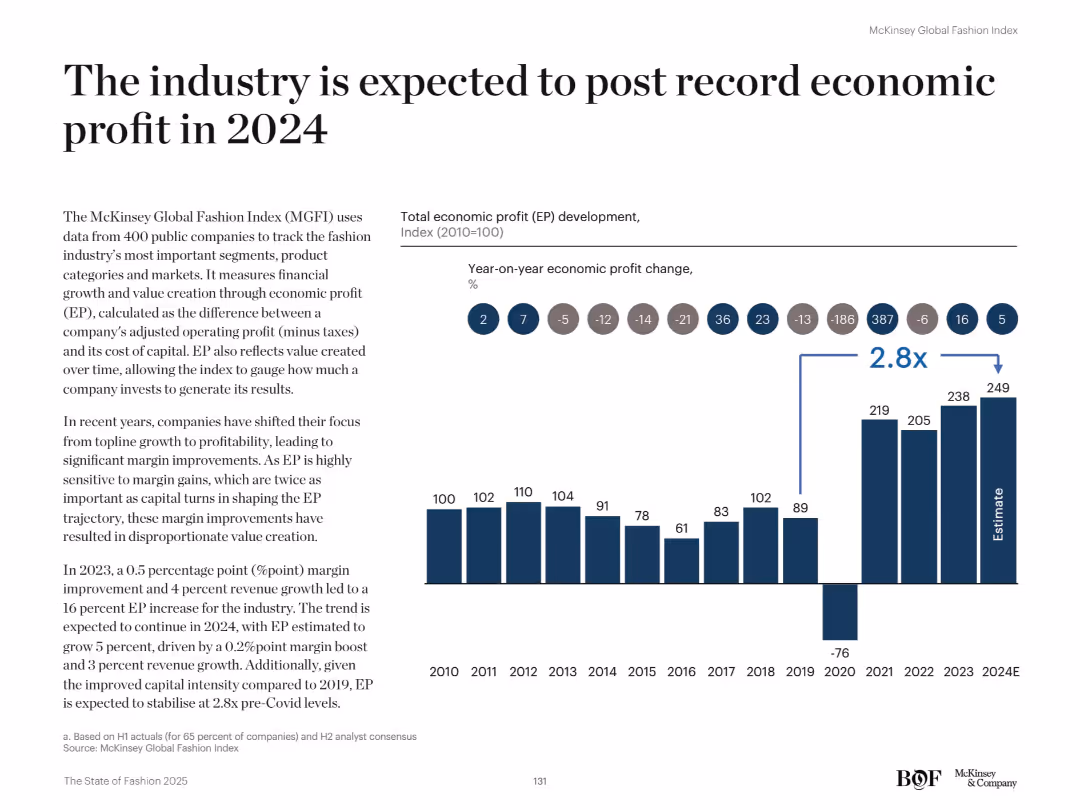
Left-aligned explanatory text with a right-side bar chart showing economic profit (EP) from 2010 to 2024E.
Financial Performance
Retail & E-commerce
The slide forecasts record-high economic profit (EP) in 2024 for the fashion industry, highlighting a 2.8x increase over pre-pandemic levels. It attributes this to margin improvements and improved capital intensity despite slower topline growth.
Economic profit, EP, financial growth, fashion index, profitability, capital intensity, 2024 forecast, margin gains, industry outlook, revenue
false
Financial Performance
Retail & E-commerce
Mixed Chart
McKinsey
Add to my slides
Remove from favorites
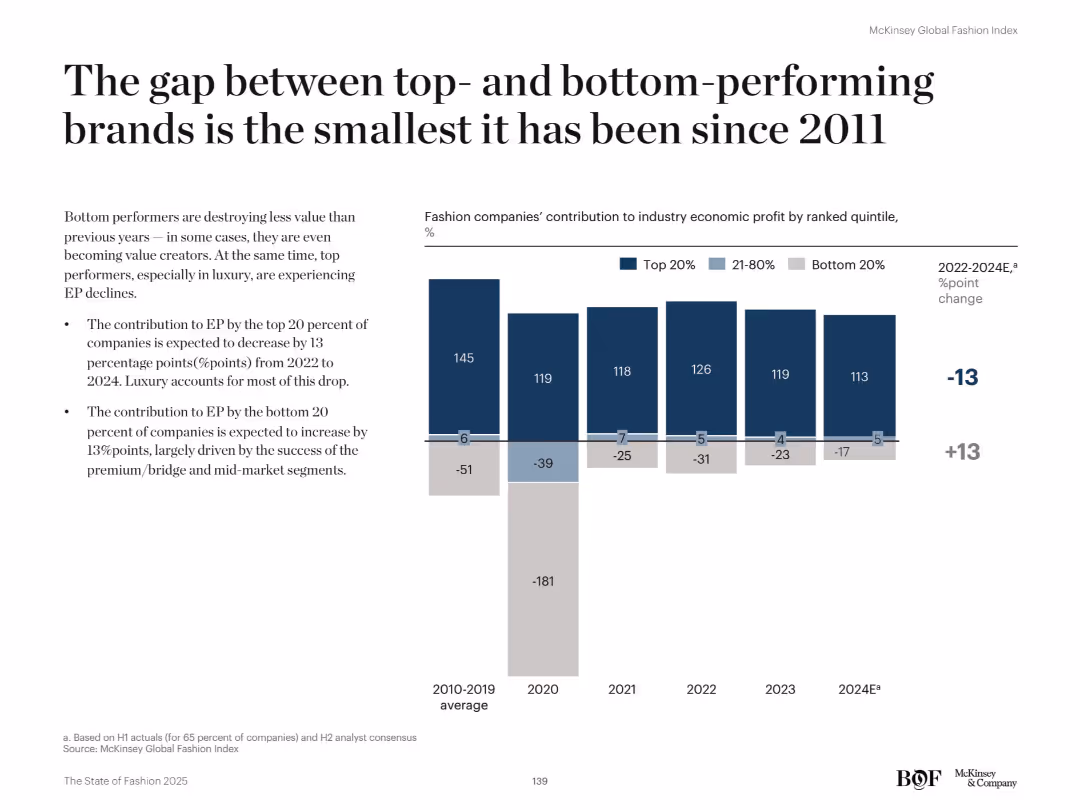
Left-aligned headline with bullet points beneath it; right side features a vertical stacked bar chart showing contribution to economic profit by company quintile from 2010 to 2024. Clear labels and dark-toned colors.
Performance Metrics and KPIs
Retail & E-commerce
The slide shows that the economic profit gap between top- and bottom-performing brands is narrowing. From 2022 to 2024, the bottom 20% of companies are expected to improve their EP contribution by 13 percentage points, while the top 20% drop by the same. Mid-market and premium segments are helping shrink the gap historically dominated by luxury.
economic profit, performance gap, quintiles, retail, premium, luxury, mid-market, EP contribution, fashion
false
Performance Metrics and KPIs
Retail & E-commerce
Mixed Chart
McKinsey
Add to my slides
Remove from favorites
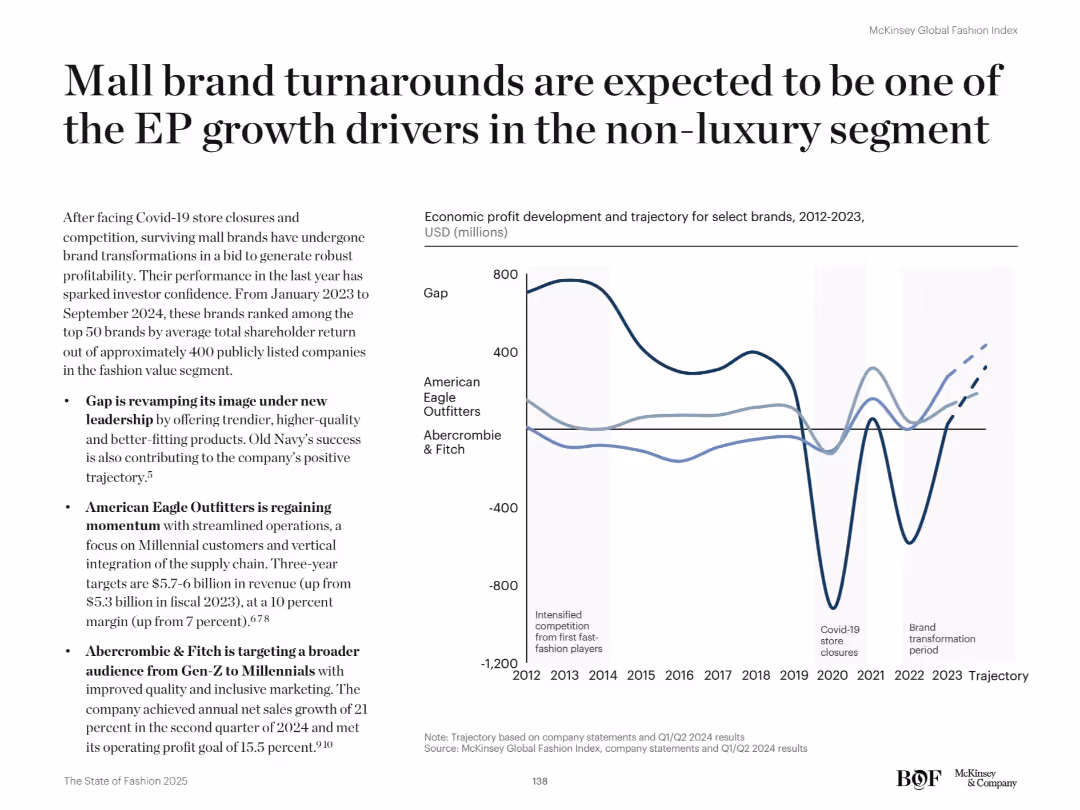
Two-column layout: left side with bullet points and summary text; right side with a multi-line graph (2012–2023) tracking economic profit of select brands. Clean white background, black serif header, and thin black graph lines.
Strategic Planning
Retail & E-commerce
The slide highlights how mall-based brands like Gap, American Eagle, and Abercrombie & Fitch are recovering and transforming post-COVID to drive economic profit in the non-luxury segment. Brand revamps, customer targeting, and streamlined operations are fueling positive shareholder returns and positioning them as top EP performers in the value fashion segment.
economic profit, retail, brand turnaround, Gap, American Eagle, Abercrombie, fashion, transformation, shareholder returns, Gen-Z
false
Strategic Planning
Retail & E-commerce
Mixed Chart
McKinsey
Add to my slides
Remove from favorites
Advanced complexity with graphical data representations and text analysis.
Financial Performance
Financial Services
Offers projections of inflation and GDP growth, comparing Southeast Asia with other markets, thus aiding in understanding regional economic trends and making informed decisions.
economic projections, GDP, inflation, Southeast Asia, growth
false
Financial Performance
Financial Services
Multiple Chart
Bain
Add to my slides
Remove from favorites
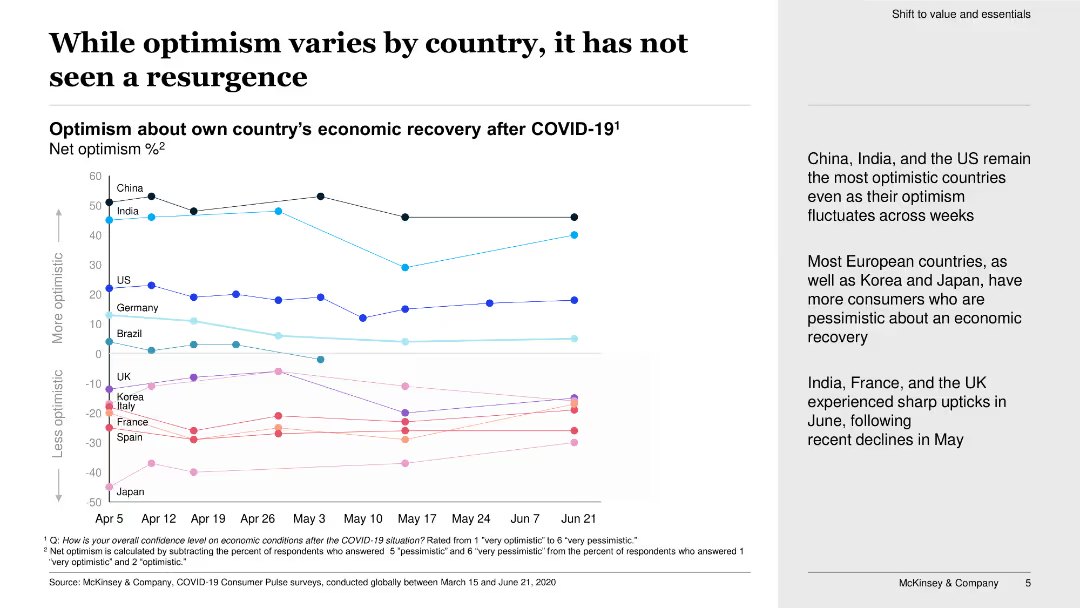
A line chart showing net optimism percentages about economic recovery post-COVID-19 across various countries, with a focus on fluctuations over time.
Market Analysis and Trends
Financial Services
The slide examines the variations in economic recovery optimism among different countries, highlighting trends and notable fluctuations in consumer sentiment during the pandemic.
economic recovery, consumer sentiment, COVID-19, optimism, country analysis
false
Market Analysis and Trends
Financial Services
Mixed Chart
McKinsey
Add to my slides
Remove from favorites
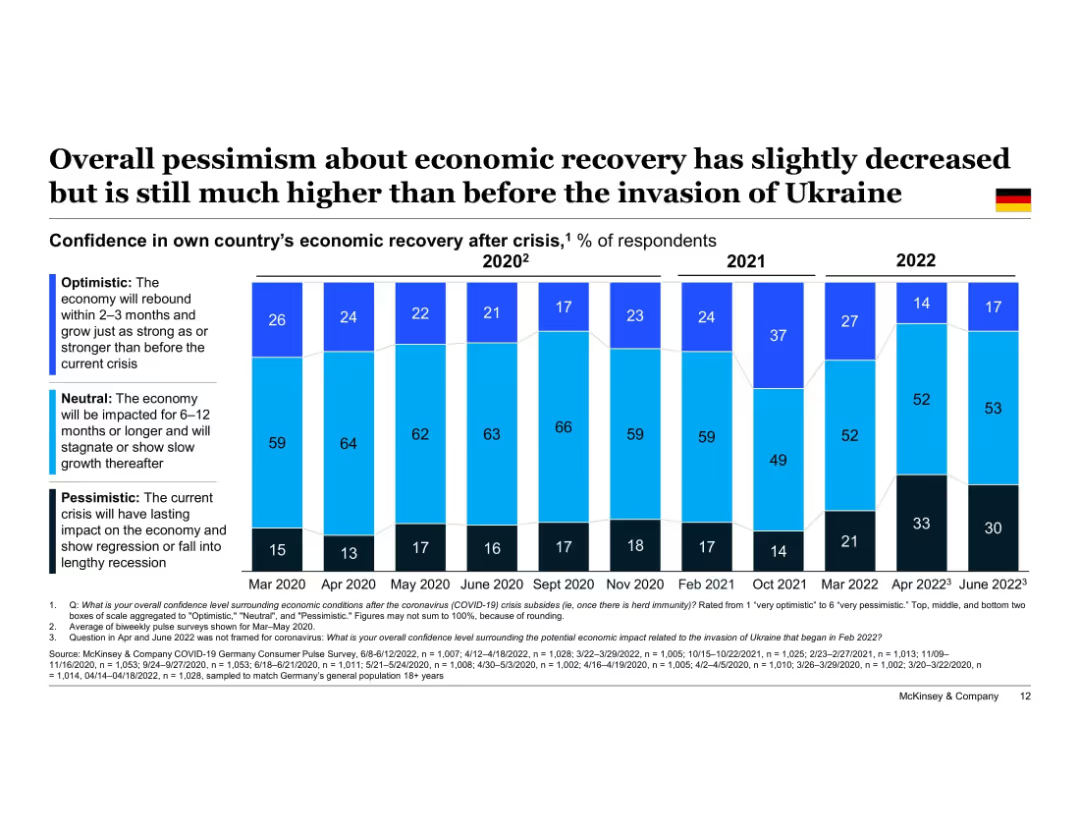
Vertical stacked bar chart timeline (Mar 2020–Jun 2022); bars segmented into "Optimistic," "Neutral," and "Pessimistic" confidence levels. German flag icon in top-right corner. Title at top, legend left side, data sourced from McKinsey surveys at bottom.
Market Analysis and Trends
Financial Services
This slide shows how German consumer sentiment on economic recovery has evolved since March 2020. While optimism slightly increased in June 2022, pessimism remains significantly higher than pre-Ukraine invasion levels. The chart illustrates the fluctuating recovery confidence over time.
economic recovery, consumer sentiment, Germany, optimism, pessimism, Ukraine invasion, timeline, confidence levels, McKinsey, survey results
false
Market Analysis and Trends
Financial Services
Single Chart
McKinsey
Add to my slides
Remove from favorites
Scatter plots and data points analyzing the correlation between local infection levels, consumer spending, mobility, and government restrictiveness in the U.S.
Risk Assessment and Management
Government & Public Sector
Investigates the link between virus containment levels and economic recovery metrics like consumer spending and mobility in the U.S.
Economic Recovery, Consumer Spending, Government Restrictions, COVID-19
true
Risk Assessment and Management
Government & Public Sector
Multiple Chart
BCG
Add to my slides
Remove from favorites
Slide includes column charts showing GDP growth by quarter and future projections compared to the rest of the world. The visual elements are organized neatly, using green and purple to differentiate between past performance and future expectations, enhancing readability.
Strategic Planning
Government & Public Sector
Analyzes China's economic recovery post-COVID-19 and its projected impact on global GDP growth, focusing on sector-specific growth and future contributions to the world economy.
economic recovery, GDP growth, China, post-COVID-19, global impact
false
Strategic Planning
Government & Public Sector
Mixed Chart
BCG
Add to my slides
Remove from favorites
Slide includes column charts showing GDP growth by quarter and future projections compared to the rest of the world. The visual elements are organized neatly, using green and purple to differentiate between past performance and future expectations, enhancing readability.
Strategic Planning
Government & Public Sector
Analyzes China's economic recovery post-COVID-19 and its projected impact on global GDP growth, focusing on sector-specific growth and future contributions to the world economy.
economic recovery, GDP growth, China, post-COVID-19, global impact
false
Strategic Planning
Government & Public Sector
Multiple Chart
BCG
Add to my slides
Remove from favorites
Bar chart showing quarterly Canadian GDP growth (annualized) from Q1 2015 to a forecast in Q2 2021, with notable changes in Q2 2020.
Market Analysis and Trends
Real Estate & Construction
The slide analyzes and forecasts economic recovery trends, highlighting significant GDP changes due to the pandemic and projecting recovery.
economic recovery, GDP growth, forecast, 2021, quarterly data, Canada
false
Market Analysis and Trends
Real Estate & Construction
Single Chart
IPSOS
Add to my slides
Remove from favorites
Three panels with economic indicators, energy sector data, and doing business metrics. Each panel uses simple arrows and text to convey changes.
Market Analysis and Trends
Financial Services
This slide highlights the post-pandemic economic recovery trends, focusing on inflation, energy sector performance, and doing business metrics.
Economic recovery, inflation, energy sector, doing business, indicators, post-pandemic, trends, metrics, analysis, performance
false
Market Analysis and Trends
Financial Services
Pillar
EY
Add to my slides
Remove from favorites
Slide includes three column charts reflecting sentiments on the impacts of economic reforms by the Macron government, focusing on foreign investment, competitiveness, and economic conditions.
Regulatory and Compliance
Government & Public Sector
Discusses the perceived impact of recent economic reforms under President Macron’s administration, particularly in enhancing France’s attractiveness to investors.
economic reforms, Macron, France, investment, government
false
Regulatory and Compliance
Government & Public Sector
Mixed Chart
Bain
Add to my slides
Remove from favorites
Features two line graphs: the US Johnson Redbook Same-Store Weekly Sales Index and US Industrial Production Index, showing data over several years with emphasis on recent growth trends post-reopening.
Market Analysis and Trends
Financial Services
Discusses the impact of economic reopening on retail and industrial sectors in developed economies, particularly the US. It illustrates the rapid rebound in consumer and industrial activity, offering insights into the resilience and adaptive strategies of markets in response to easing pandemic restrictions.
economic reopening, US markets, retail growth, industrial activity, recovery
false
Market Analysis and Trends
Financial Services
Multiple Chart
Deloitte
Add to my slides
Remove from favorites
A bar chart showing the economic risks impacting investment plans in Europe, with highlighted percentages and a detailed explanatory text box.
Risk Assessment and Management
Financial Services
The slide highlights the ongoing economic challenges and risks that will impact investment plans in Europe in 2023, such as rising interest rates and inflation.
economic risks, investment, Europe, 2023
false
Risk Assessment and Management
Financial Services
Single Chart
EY
Add to my slides
Remove from favorites
The slide is text-heavy with a series of bullet points on the left, complemented by labeled graphs on the right. The design is minimalist with a white background and uses contrasting black and blue text for emphasis.
Risk Assessment and Management
Financial Services
Outlines potential economic scenarios resulting from COVID-19's spread, public health responses, and policy decisions. It's a tool for assessing risks and planning for various outcomes in the financial sector.
Economic Scenarios, COVID-19, Health Response
false
Risk Assessment and Management
Financial Services
Table
McKinsey
Add to my slides
Remove from favorites
Three column charts depicting different economic scenarios with green, yellow, and blue colors, labeled as Steep but Short-lived Downturn, Prolonged Pandemic, and Economic Depression.
Strategic Planning
Financial Services
The slide presents three potential economic scenarios for modeling, with varying assumptions about the duration and severity of the economic downturn globally and locally.
Economic scenarios, modeling, Canadian economy, global economy, duration, severity, downturn, Metro Vancouver
false
Strategic Planning
Financial Services
Multiple Chart
Deloitte
Add to my slides
Remove from favorites
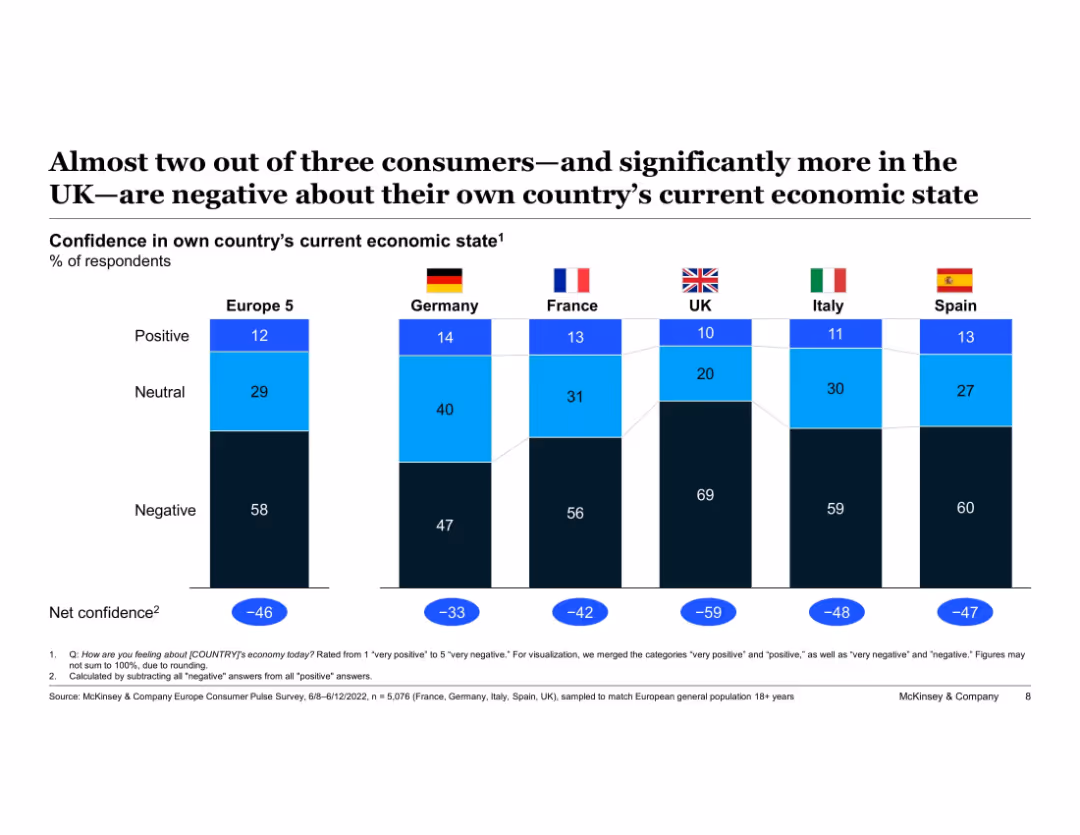
Stacked bar chart by country showing confidence levels. Uses a traffic light color scheme for sentiment (positive, neutral, negative).
Market Analysis and Trends
Consumer Goods
The slide presents a sentiment snapshot of consumers in five European countries, showing widespread negativity about the economic situation, especially in the UK. It calculates net confidence by subtracting negative from positive responses.
economic sentiment, consumer confidence, UK, Europe, net confidence, pessimism, market outlook
false
Market Analysis and Trends
Consumer Goods
Single Chart
McKinsey
Add to my slides
Remove from favorites
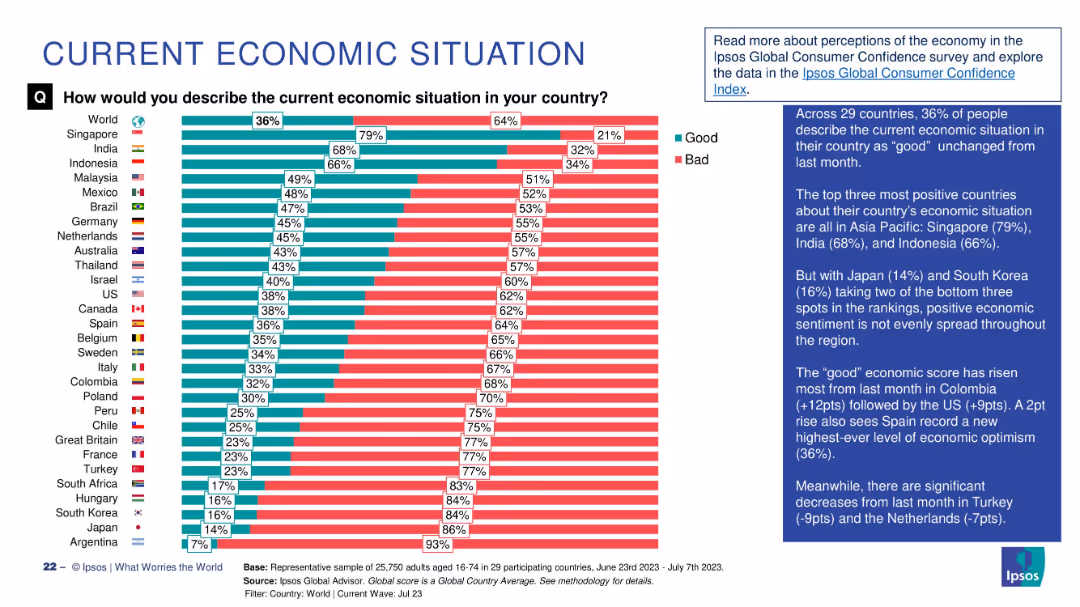
Bar chart comparing percentage of people in 29 countries describing the economy as "Good" vs "Bad", with annotations.
Market Analysis and Trends
Financial Services
This slide visualizes global public sentiment about the current economic situation, showing a 36% global average rating of "good". Singapore, India, and Indonesia lead in optimism, while Japan and Argentina have the lowest. Commentary highlights regional trends and month-over-month changes.
economic sentiment, global comparison, Ipsos, economic perception, survey, bar chart, economic optimism, Asia-Pacific, country ranking, economic trends
false
Market Analysis and Trends
Financial Services
Mixed Chart
IPSOS
Add to my slides
Remove from favorites
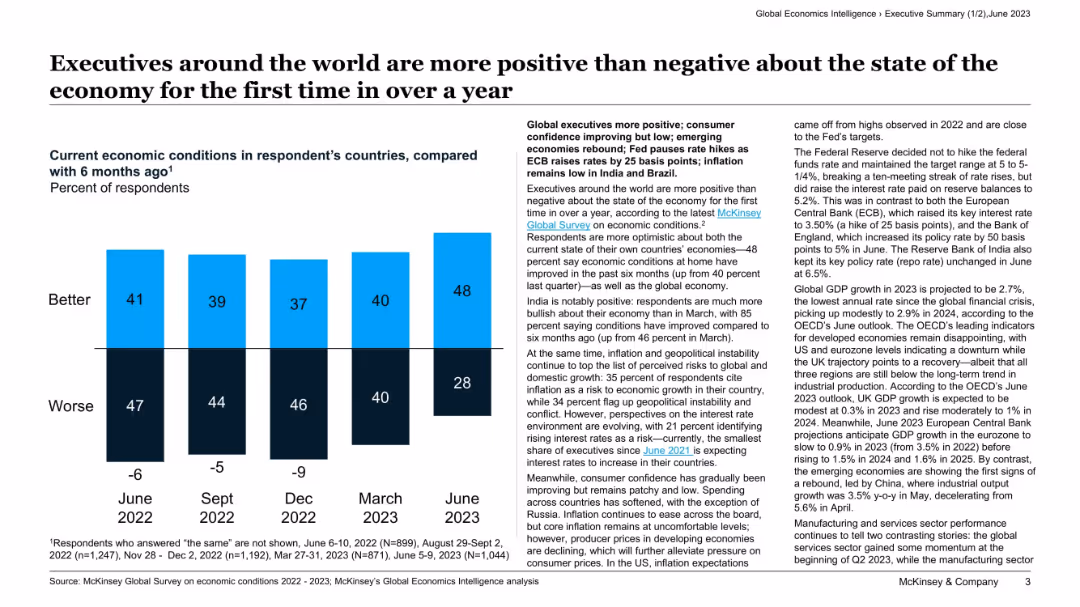
Bar chart on sentiment (better/worse) over 5 periods and right-aligned column of text commentary with bullet points and highlights.
Market Analysis and Trends
Professional Services
The slide presents executive sentiment on economic conditions, showing a significant rise in positive outlook by June 2023. Accompanying commentary explains reasons behind this shift, including easing inflation, better domestic conditions, and improving global confidence, while risks still include geopolitical instability.
economic sentiment, global economy, executive survey, inflation, interest rates, McKinsey Global Survey, GDP, outlook, recovery
false
Market Analysis and Trends
Professional Services
Mixed Chart
McKinsey
Add to my slides
Remove from favorites
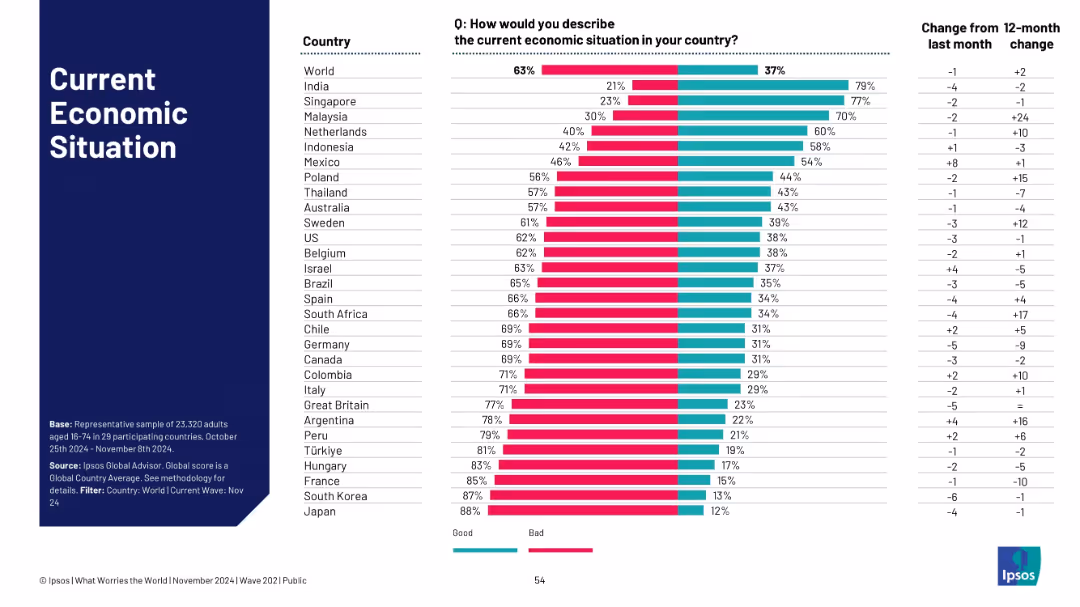
Bar chart of countries with % seeing economy as good or bad; stacked bar format; includes time-based changes.
Financial Performance
Financial Services
Assesses global sentiment on national economic conditions. The slide contrasts “good” vs. “bad” perceptions by country. India and Singapore show optimism, while Japan and South Korea remain pessimistic. Time-tracked changes show evolving sentiment.
economic sentiment, perception, financial outlook, Ipsos, optimism, pessimism, survey, recovery, inflation, public opinion
false
Financial Performance
Financial Services
Single Chart
IPSOS
Add to my slides
Remove from favorites
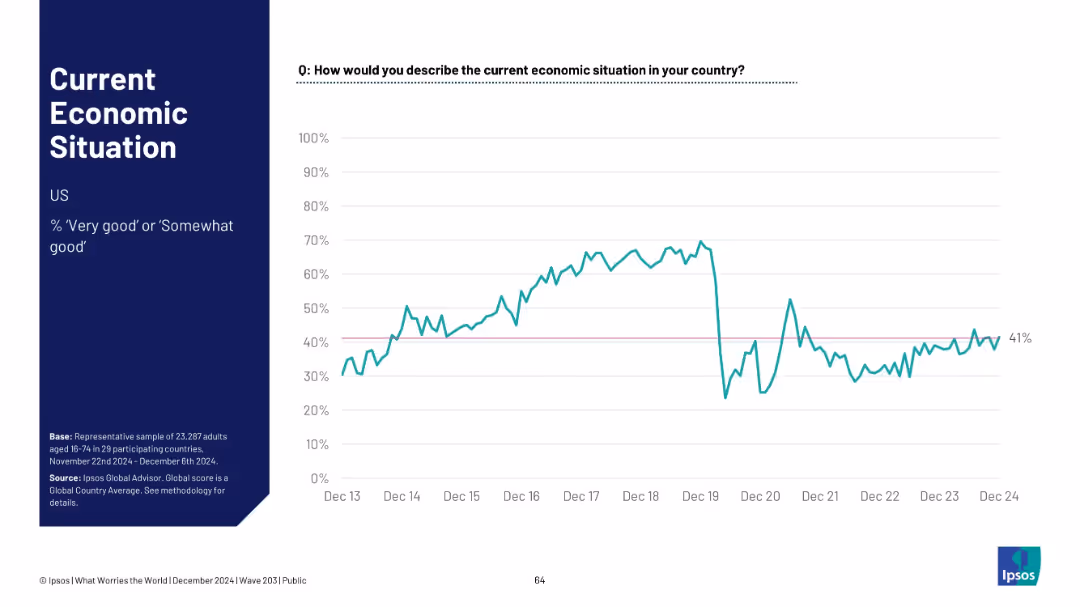
Split layout: bold text title and description on left with a time-series line chart on the right. Blue and white theme with minimal grid lines.
Market Analysis and Trends
Financial Services
The slide presents the perception of the current economic situation in the US, showing the percentage of people rating it as “Very good” or “Somewhat good” over time. The data indicates a major dip around late 2019/early 2020, with a slow recovery. The latest figure is 41%.
economic sentiment, US economy, trend analysis, Ipsos, public opinion, financial perception, time series, survey results, 2024 data, global comparison
false
Market Analysis and Trends
Financial Services
Mixed Chart
IPSOS
Add to my slides
Remove from favorites
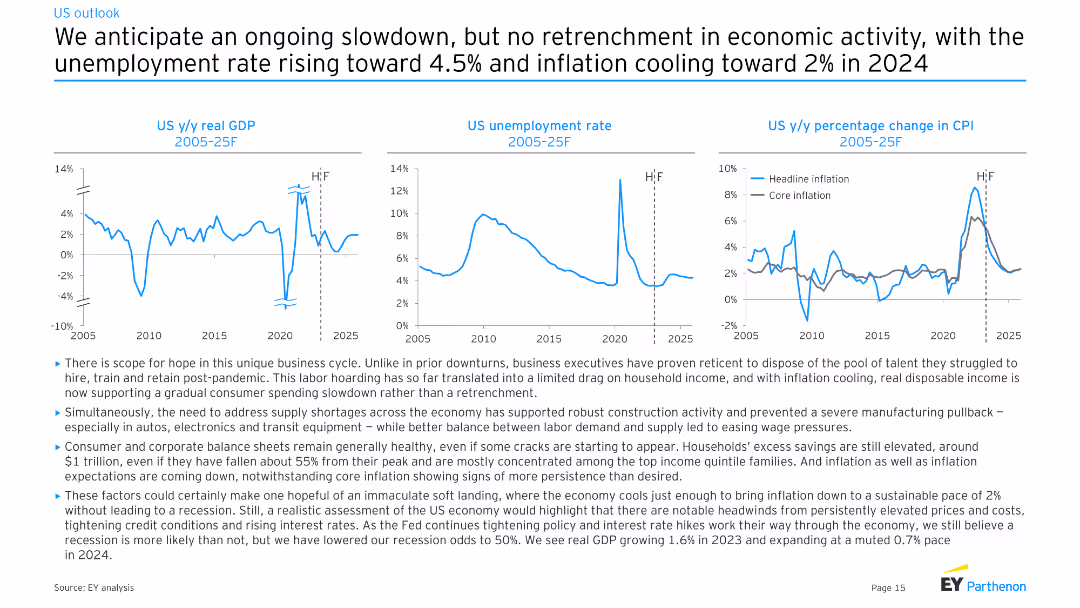
This slide includes three line charts showing US real GDP growth, unemployment rate, and percentage change in CPI from 2005 to 2025. The text box below discusses factors influencing the economic slowdown and labor market.
Market Analysis and Trends
Financial Services
The slide forecasts an economic slowdown with rising unemployment and cooling inflation in the US. It provides insights into factors like labor hoarding, consumer spending, and inflation trends, suggesting a soft landing for the economy.
Economic slowdown, GDP growth, unemployment rate, inflation trends, labor market, US economy, financial forecast, EY analysis, consumer spending
false
Market Analysis and Trends
Financial Services
Multiple Chart
EY
Add to my slides
Remove from favorites
The slide has a dark theme and presents two main sections, one with financial economics statistics and another with a layered area chart depicting revenue paths.
Investment Analysis
Financial Services
This slide informs about the economic viability of point-of-sale lending, with emphasis on on-balance sheet growth, merchant discount rates, and projected revenues.
economics, on-balance sheet, merchant lending, discount rates, APR, credit losses, revenue path, projections
false
Investment Analysis
Financial Services
Mixed Chart
Goldman Sachs
Add to my slides
Remove from favorites
Contains multiple gears representing different economic indicators like unemployment rate, inflation, and GDP growth, alongside a map highlighting Namibia's geographical context.
Market Analysis and Trends
Government & Public Sector
Offers a comprehensive overview of Namibia's key economic indicators as of January 2018, useful for understanding the broader economic climate and its potential impacts on policy and investment decisions.
Economic, Statistics, GDP, Inflation, Map
false
Market Analysis and Trends
Government & Public Sector
Graphic
PwC/Strategy&
Add to my slides
Remove from favorites
Two charts: left showing Citigroup economic surprise indices for the US and Eurozone, right showing EU Recovery Fund grants disbursement forecasts from 2021 to 2026.
Strategic Planning
Financial Services
The slide focuses on economic surprises in the Eurozone compared to the US and outlines the EU Recovery Fund grants' planned and actual disbursements, emphasizing economic recovery efforts.
economic surprise, recovery fund, Eurozone, EU, economic recovery
false
Strategic Planning
Financial Services
Multiple Chart
JP Morgan
Add to my slides
Remove from favorites
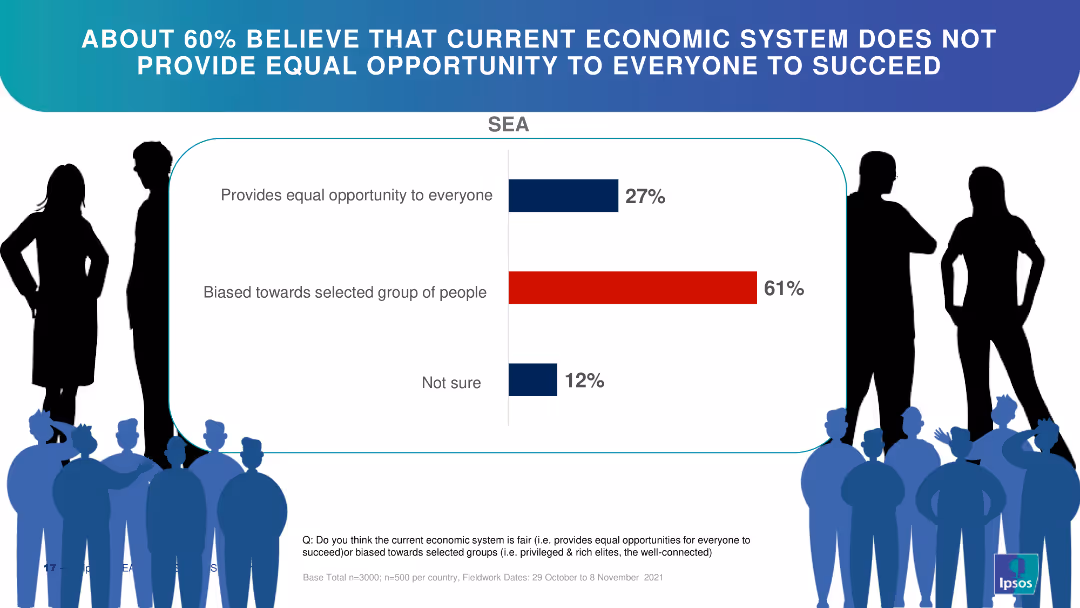
This slide features a horizontal bar chart showing the perceptions of the economic system's fairness. The chart is accompanied by silhouettes of people, enhancing the visual representation of public opinion. The bars are color-coded for clarity.
Market Analysis and Trends
Financial Services
The slide presents survey results indicating that 61% believe the economic system is biased towards a selected group, while only 27% think it provides equal opportunity, and 12% are unsure. It highlights public sentiment regarding economic fairness, which can be used for policy analysis or socio-economic studies.
economic system, survey results, fairness, public opinion, bias
false
Market Analysis and Trends
Financial Services
Single Chart
IPSOS
Add to my slides
Remove from favorites
The slide features two column charts comparing the top 15 threats for CEOs in 2019 and 2020, with over-regulation and trade conflicts topping the lists in both years.
Risk Assessment and Management
Financial Services
This slide highlights increasing concerns among CEOs about various economic and policy threats, with over-regulation and trade conflicts remaining top issues over two years.
Economic threats, trade conflicts, over-regulation, CEO concerns, policy issues
false
Risk Assessment and Management
Financial Services
Multiple Chart
PwC/Strategy&
Add to my slides
Remove from favorites
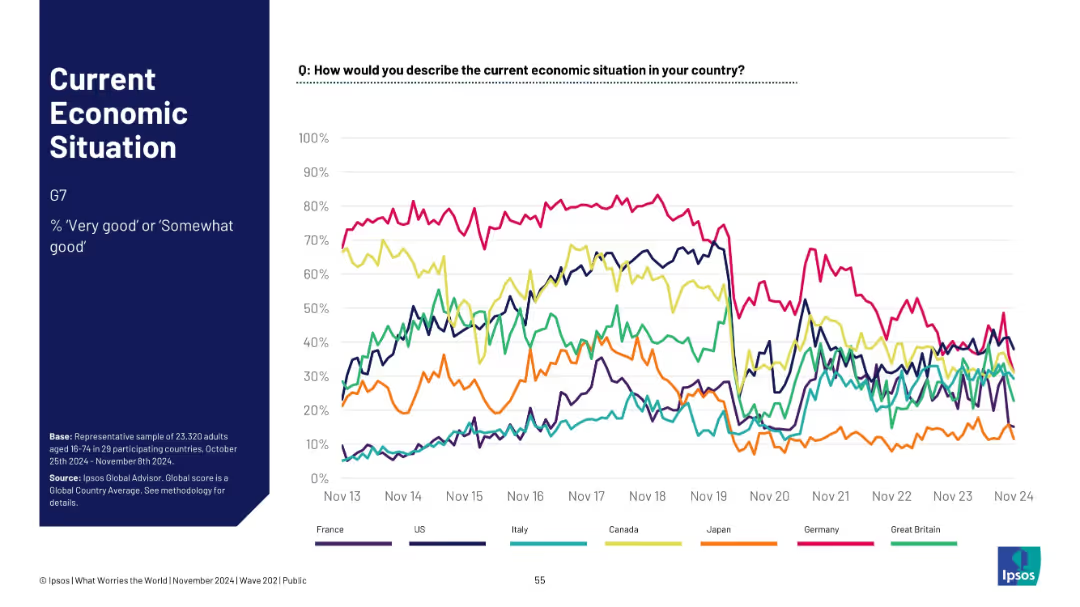
Line graph showing G7 countries' economic sentiment over time (% “good” or “somewhat good”).
Market Analysis and Trends
Financial Services
Longitudinal data from G7 nations tracking economic sentiment since 2013. Graph highlights national divergences and inflection points—such as dips around 2020—reflecting macroeconomic changes and policy responses.
economic trend, G7, sentiment, long-term, Ipsos, survey, financial outlook, comparative analysis, perception
false
Market Analysis and Trends
Financial Services
Single Chart
IPSOS
Add to my slides
Remove from favorites
Features a column chart tracking economic outlook over several years with quotes from industry leaders reflecting on the future.
Market Analysis and Trends
Professional Services
Analyzes historical and projected economic sentiment in various sectors, providing insights into industry expectations and strategic planning.
Economic Trends, Predictions, Industry Leaders, Market Stability, Conservative Predictions
false
Market Analysis and Trends
Professional Services
Mixed Chart
Bain
Add to my slides
Remove from favorites
Previous
Next
You don't have any favorites yet.
Please wait loading your favorites slides...
Create a FREE account to continue browsing
Receive Instant Access to 1,000+ slides from companies like McKinsey, Google, and Goldman Sachs
First Name
Last Name
Email
Password
I agree to all
Terms & Privacy Policy
Thank you! Your submission has been received!
Oops! Something went wrong while submitting the form.
Have an account?
Sign in
Upgrade to PRO to Save slides
Advanced Search and Filters
Access to 15,000+ slides
Access to Category Pages
Save/Bookmark Slides
PowerPoint Template Library
Pick a Plan
MONTHLY
$12/month
Billed every month, Cancel anytime.
YEARLY
$9/year
Billed $108 annually, Cancel anytime.
Checkout for $12/month
Checkout for $108/yr
Secured by Stripe | AES-256 bit encryption


![Q: And how much do you agree or disagree with the following statements? -[COUNTRY]'s economy is rigged to advantage the rich and powerful](https://cdn.prod.website-files.com/654e70fb59937215cac87b19/6899bad4f03e6a89283027d8_2ZYX6BNkjwxb5FzZGpK0ak8VxeeqF3xAPSlmT0j-j0o.avif)