My Account
My Slides
Search by Category
Companies
Slide Type
Use Case
Industry
Pricing
Templates
View All Templates
Download Template Slides
✦ AI
AI Prompt Library
AI Search
Feedback
Login
Logout
Get Started
Browse all Slides
Browse all Slides
Create a FREE Account
Instant access to 1,000+ real slides from top companies like McKinsey, BCG, Goldman Sachs, Google and many more!
First Name
Last Name
Email
Password
I agree to all
Terms & Privacy Policy
Thank you! Your submission has been received!
Oops! Something went wrong while submitting the form.
Have an account?
Sign in
Saved Slides
Total No. of slides saved
0
↻ Refresh
✖ Clear all
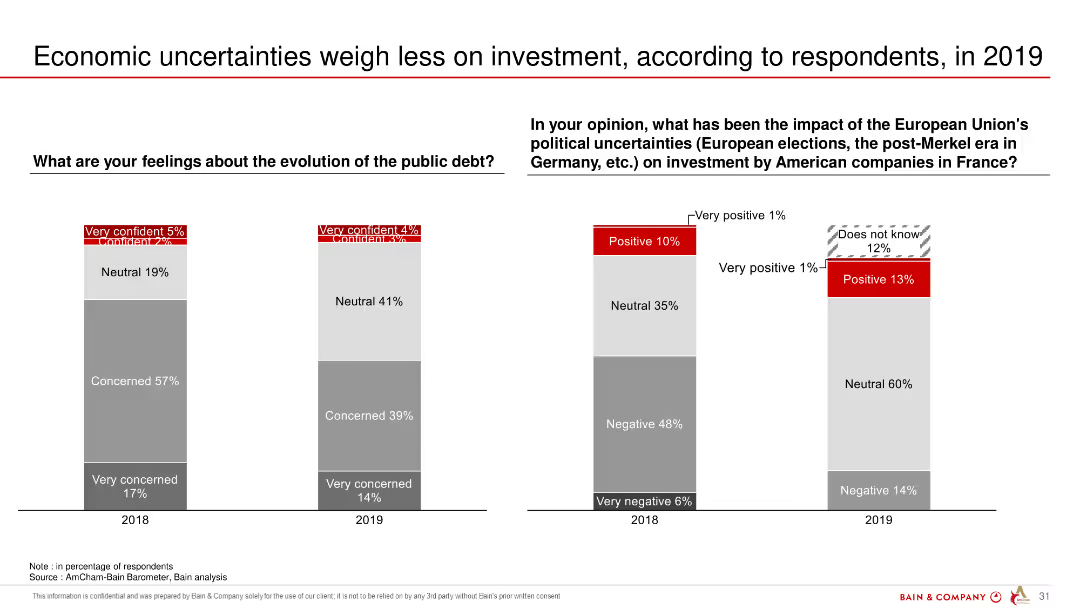
The slide includes two column charts comparing respondents' views on public debt and the impact of EU political uncertainties on American companies' investments in France, between 2018 and 2019.
Investment Analysis
Financial Services
The slide suggests that economic uncertainties, particularly public debt and political uncertainties in the EU, have lessened in their impact on investment decisions in 2019.
economic uncertainties, investment, public debt, EU, political uncertainties, survey
false
Investment Analysis
Financial Services
Multiple Chart
Bain
Add to my slides
Remove from favorites
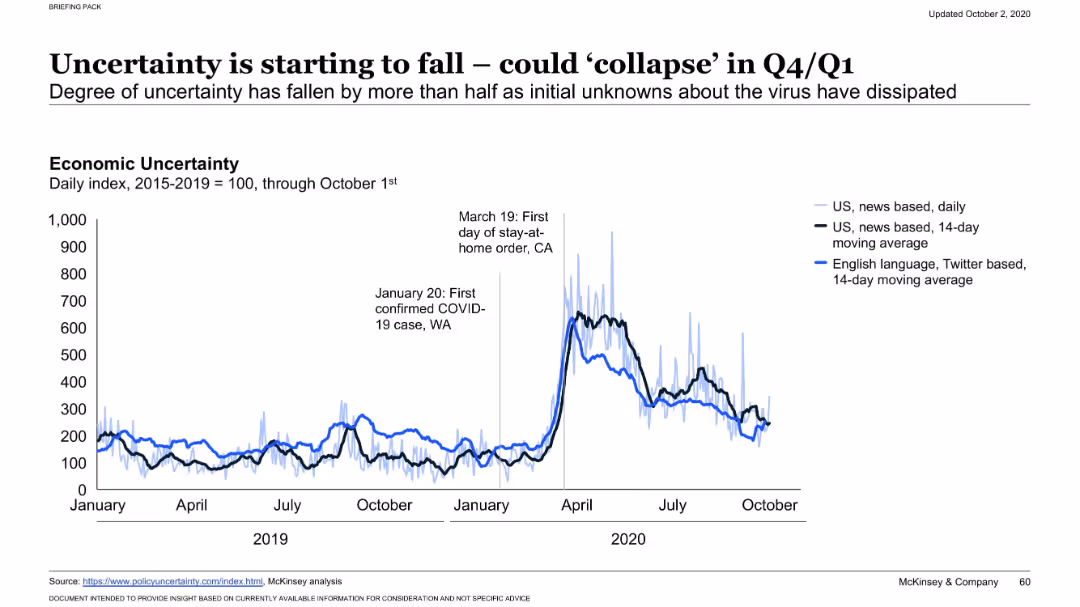
Time series line chart displaying economic uncertainty indices (news-based and Twitter-based) from 2019 to October 2020. Includes key event markers (first COVID case, stay-at-home order).
Risk Assessment and Management
Financial Services
Shows how economic uncertainty, driven by COVID-19 developments, peaked in early 2020 but has since decreased. Multiple data sources (news, social media) illustrate public sentiment, with annotations of major events for context.
economic uncertainty, COVID-19, sentiment index, market volatility, risk perception, trend analysis, news impact, public reaction, confidence indicators, timeline
false
Risk Assessment and Management
Financial Services
Single Chart
McKinsey
Add to my slides
Remove from favorites
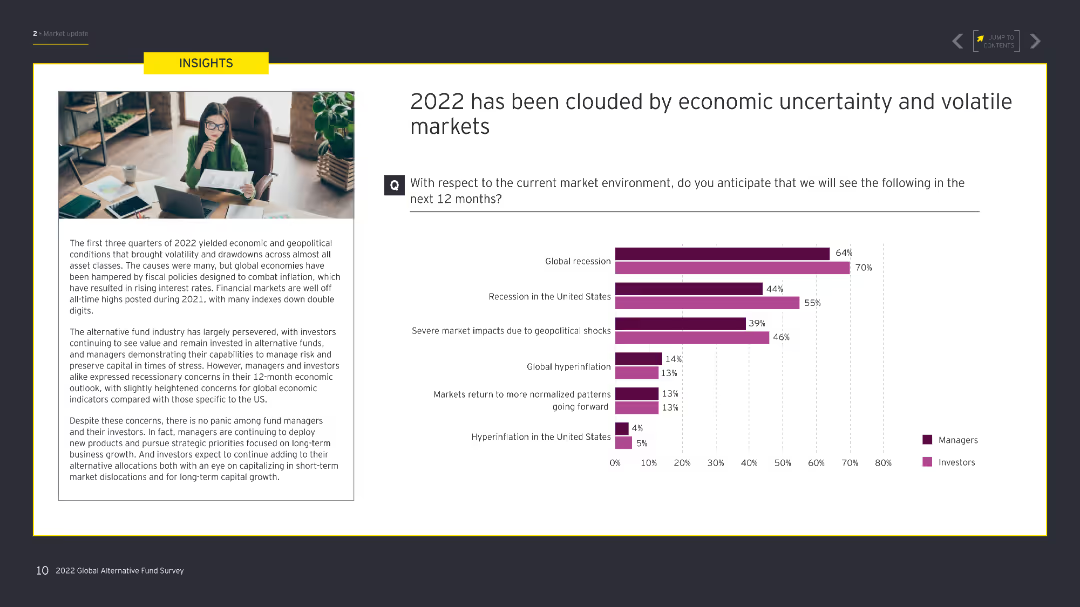
The slide contains a text box on the left detailing economic conditions, and on the right, a column chart with data comparing managers' and investors' expectations for various economic scenarios.
Risk Assessment and Management
Financial Services
This slide discusses the economic uncertainty and volatility in 2022, including expectations for recession, geopolitical shocks, and market normalization, segmented by managers and investors.
economic uncertainty, volatility, recession, market, managers, investors
false
Risk Assessment and Management
Financial Services
Mixed Chart
EY
Add to my slides
Remove from favorites
Shows line charts illustrating economic impact under low and high growth scenarios. Includes text bullet points explaining the benefits and investment impact on the economy.
Market Analysis and Trends
Energy & Utilities
Discusses how new oil and gas investments will stimulate economic activity, with detailed projections of the economic uplift and GDP impact under different growth scenarios.
Economic Uplift, GDP Impact, Oil and Gas Investment, Western Australia, Low Growth, High Growth, Economic Activity, Construction Phase
false
Market Analysis and Trends
Energy & Utilities
Mixed Chart
EY
Add to my slides
Remove from favorites
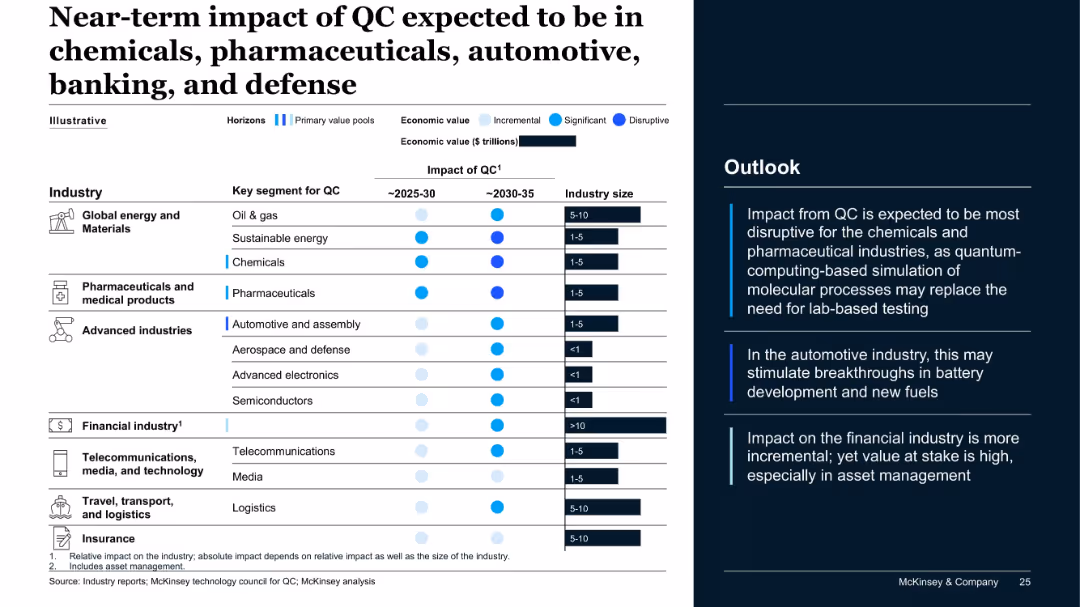
Horizontal bar chart with value pool by industry; shows impact by time horizon and economic value. Right panel gives insights and forecast impact.
Market Analysis and Trends
Artificial Intelligence
This slide forecasts where quantum computing will have the greatest near-term economic impact (~2025–2035). Disruptive effects are expected in chemicals, pharmaceuticals, and automotive sectors, while the financial industry sees high value but incremental impact.
economic value, quantum impact, pharmaceuticals, chemicals, automotive, financial, forecast
false
Market Analysis and Trends
Artificial Intelligence
Mixed Chart
McKinsey
Add to my slides
Remove from favorites
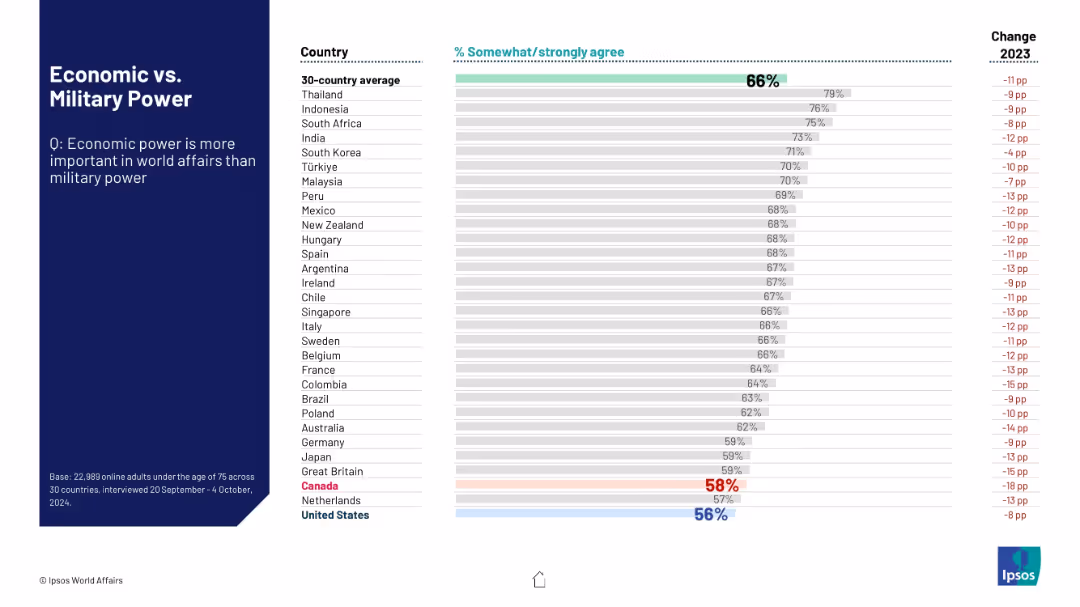
Horizontal bars showing agreement that economic power is more important than military power; bar chart format with comparative percentages and year-over-year change.
Strategic Planning
Government & Public Sector
This slide captures public agreement across countries that economic power outweighs military power in world affairs. Results indicate significant agreement overall, though there's a noticeable drop from the previous year in most regions.
economic vs military, global influence, strategic power, public opinion, Ipsos, economic strength, defense policy, international relations, year-on-year
false
Strategic Planning
Government & Public Sector
Mixed Chart
IPSOS
Add to my slides
Remove from favorites
Line chart comparing optimism about the U.S. economy over time with annotations highlighting changes influenced by COVID variants and inflation.
Market Analysis and Trends
Professional Services
Discusses trends in economic optimism among surveyed companies, influenced by external factors like COVID-19 variants and inflation, crucial for understanding market sentiment.
economy, COVID-19, inflation, market sentiment, trends
false
Market Analysis and Trends
Professional Services
Mixed Chart
Deloitte
Add to my slides
Remove from favorites
Line chart and national flags illustrating expectations for a stronger economy in SEA.
Market Analysis and Trends
Financial Services
This slide indicates an upward trend in economic expectations among SEA respondents, highlighting future economic strength.
economy expectations, SEA, line chart, future, survey
false
Market Analysis and Trends
Financial Services
Mixed Chart
IPSOS
Add to my slides
Remove from favorites
Includes multiple line graphs with a color-coded key, focusing on global GDP forecasts versus baselines.
Investment Analysis
Financial Services
Analyzes global economic forecasts with a focus on GDP growth projections and comparisons between baseline forecasts and actuals.
economy, GDP forecast, baseline, rebound, downturn, financial analysis
false
Investment Analysis
Financial Services
Multiple Chart
BCG
Add to my slides
Remove from favorites
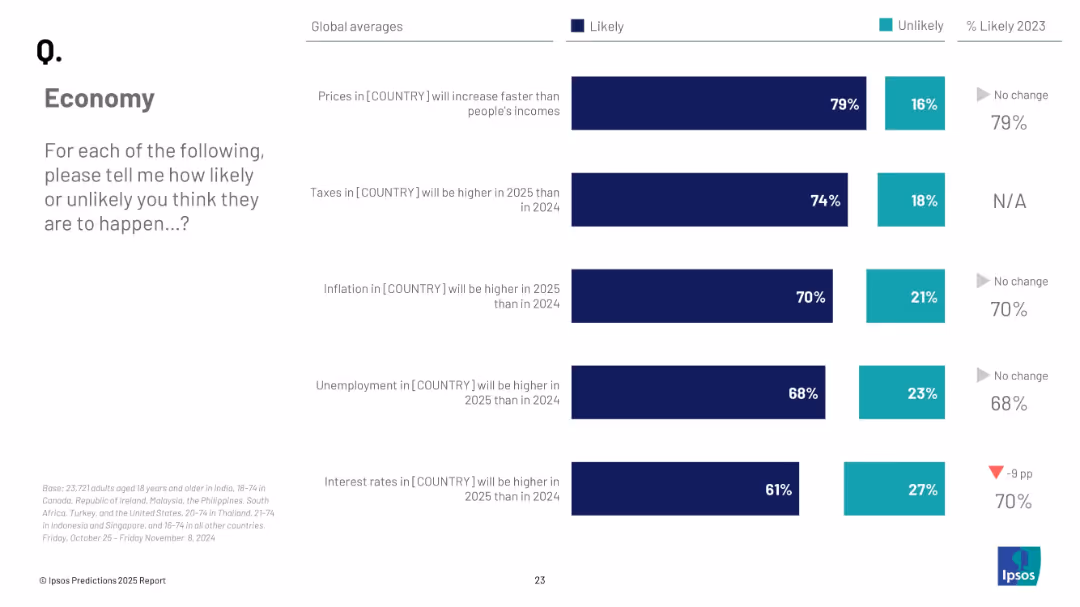
Stacked bar chart showing global averages of how likely people believe five economic events will occur in 2025, including prices, taxes, inflation, etc.
Strategic Planning
Financial Services
A global snapshot of predicted economic conditions for 2025, including anticipated changes in prices, taxes, inflation, unemployment, and interest rates. Most expectations trend toward worsening conditions.
economy, global trends, inflation, taxes, unemployment, strategic forecast, Ipsos, 2025
false
Strategic Planning
Financial Services
Mixed Chart
IPSOS
Add to my slides
Remove from favorites
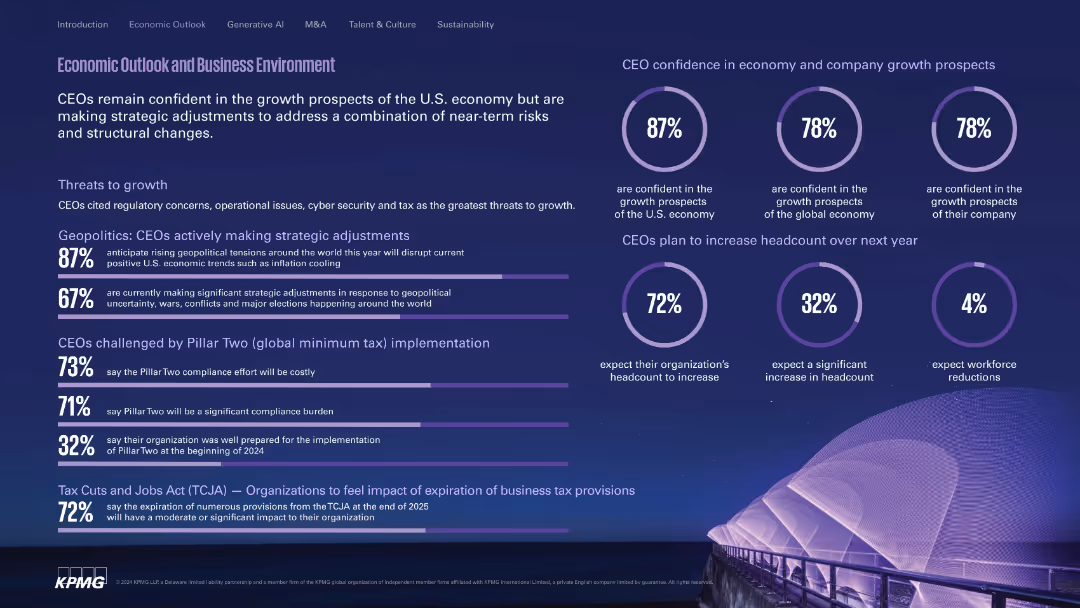
Deep purple theme with circular and horizontal stats, icons, and headlines. Modern, visually dense.
Market Analysis and Trends
Financial Services
Highlights CEO confidence levels in the U.S. and global economy, outlines key geopolitical and regulatory threats, and presents anticipated headcount changes. Includes views on tax impacts like Pillar Two and TCJA.
economy, growth, geopolitics, compliance, TCJA, headcount, Pillar Two
false
Market Analysis and Trends
Financial Services
Multiple Chart
KPMG
Add to my slides
Remove from favorites
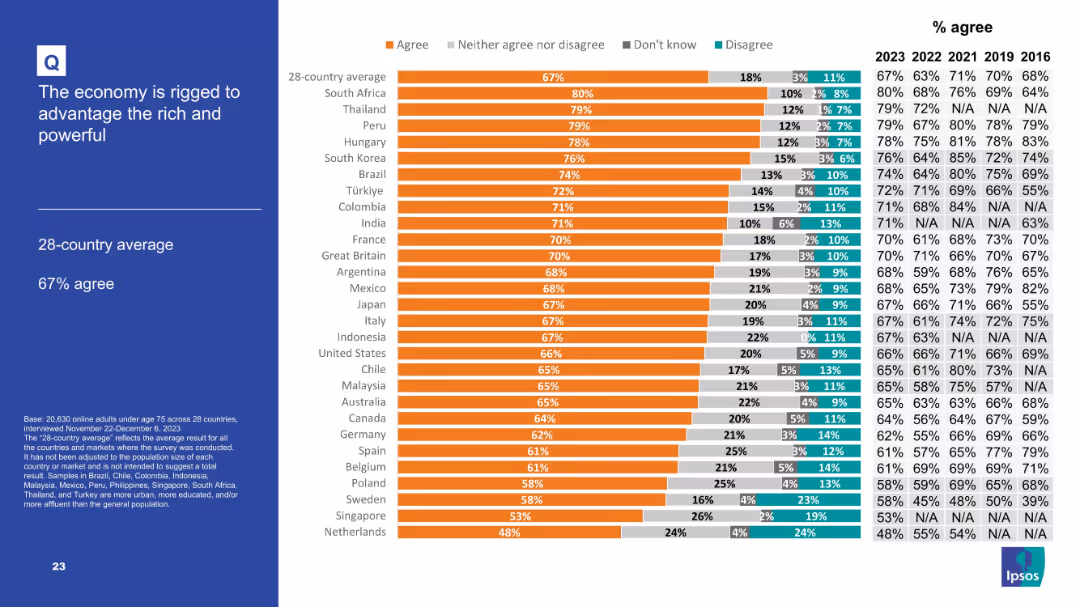
Left panel with title, global average, and methodology in blue; right side is a horizontal bar chart showing country-level agreement percentages (agree/neutral/don't know/disagree) with 5-year historical trend data on right.
Market Analysis and Trends
Government & Public Sector
This slide shows public sentiment across countries on the belief that their economies are structured to favor the rich and powerful. It includes current (2023) agreement levels along with historical data from 2016 to 2022, and a global average of 67% agreement. The data reflect a strong perception of economic inequality and favoritism globally.
economy, inequality, power, perception, public opinion, Ipsos, survey, global, fairness, trend
false
Market Analysis and Trends
Government & Public Sector
Mixed Chart
IPSOS
Add to my slides
Remove from favorites
Horizontal bar chart with segmented agreement levels; sidebar with title and average.
Market Analysis and Trends
Financial Services
Displays agreement levels with the statement that the economy benefits the rich and powerful. The 28-country average is 67%. South Africa, Thailand, and Peru show the highest agreement, indicating widespread skepticism about economic fairness.
economy, inequality, rigged system, public opinion, economic perception
false
Market Analysis and Trends
Financial Services
Mixed Chart
IPSOS
Add to my slides
Remove from favorites
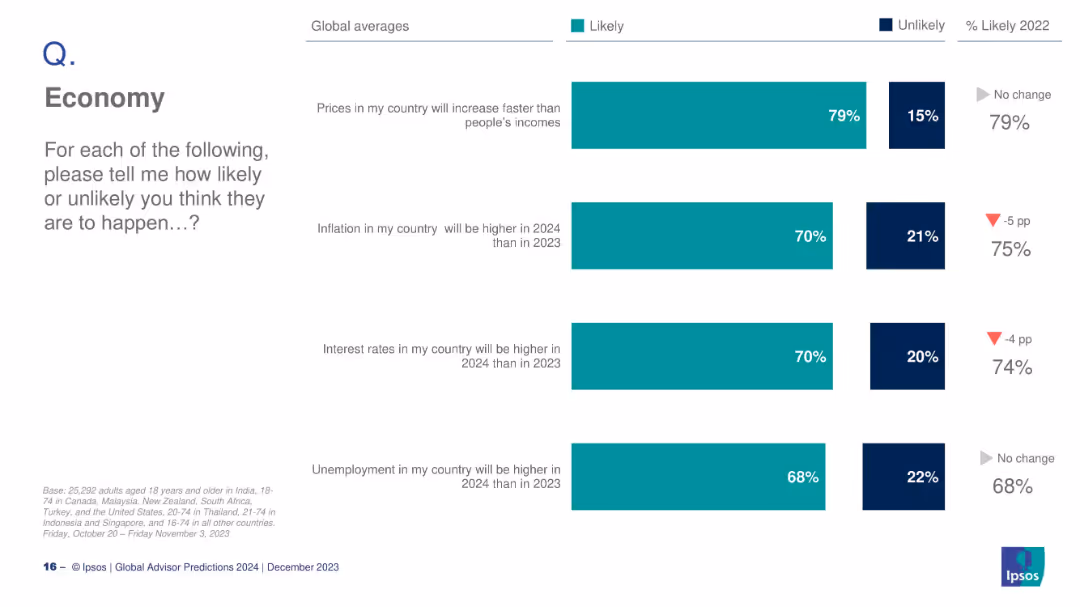
Vertical bar chart showing likelihood of four economic events in 2024: prices rising faster than incomes, inflation, interest rates, and unemployment.
Financial Performance
Professional Services
This slide presents global averages of anticipated economic issues in 2024, including 79% expecting price increases outpacing income and 70% foreseeing higher inflation and interest rates.
economy, inflation, unemployment, interest rates, 2024, Ipsos
false
Financial Performance
Professional Services
Mixed Chart
IPSOS
Add to my slides
Remove from favorites
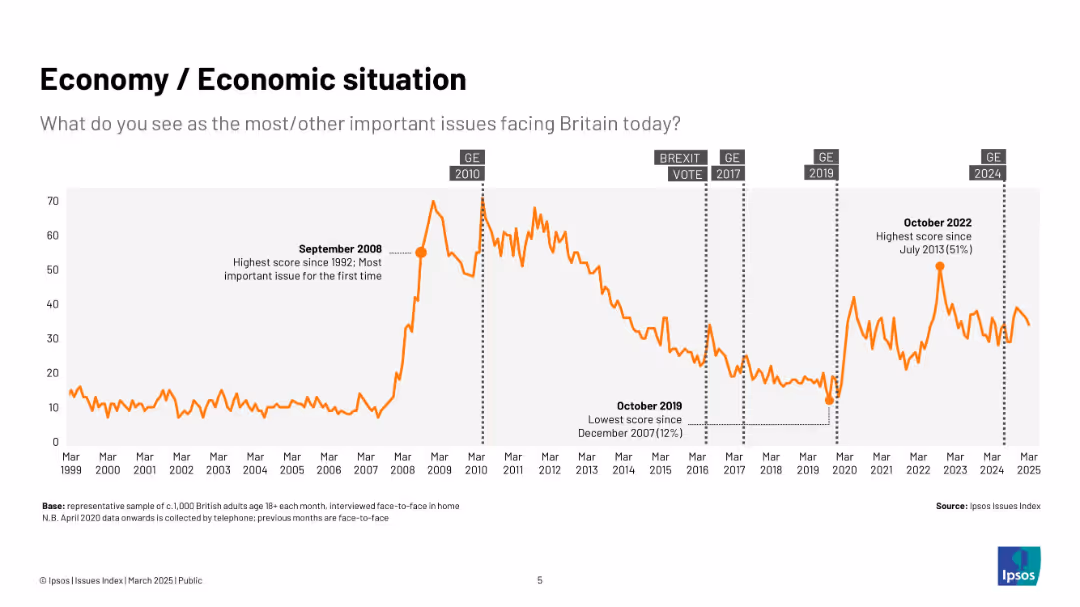
Single orange line graph (1999–2025) with annotations for key peaks and troughs (e.g. 2008 crash, 2022 peak); major events labeled.
Market Analysis and Trends
Government & Public Sector
Focuses on the public's perception of the economy as a top issue, highlighting spikes during major economic or political events. Shows historical high (2008) and recent peak (2022).
economy, Ipsos, public concern, financial crisis, political events, UK, trends
false
Market Analysis and Trends
Government & Public Sector
Single Chart
IPSOS
Add to my slides
Remove from favorites
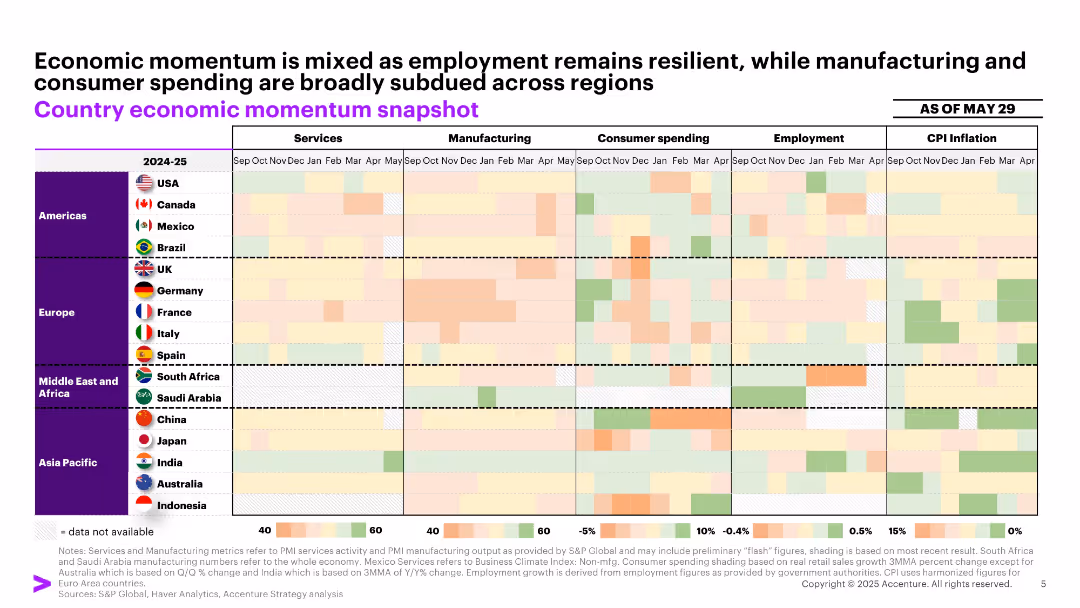
Color-coded heatmap grid segmented by region and economic categories (services, manufacturing, etc.), with month-wise data.
Market Analysis and Trends
Professional Services
Presents a high-level snapshot of economic indicators across regions through a heatmap. It reveals varied performance in employment, inflation, and consumer activity, underscoring mixed economic signals as of May 2025.
economy, momentum, employment, inflation, regional snapshot
false
Market Analysis and Trends
Professional Services
Single Chart
Accenture
Add to my slides
Remove from favorites
Split layout: dark blue text panel on the left; right side features a horizontal bar chart comparing concerns (e.g., economy, NHS, immigration) by deprivation quintiles using color-coded bars.
Market Analysis and Trends
Government & Public Sector
This slide presents data from the Ipsos Issues Index, showing the top five concerns in Britain segmented by deprivation levels. It highlights how economic concerns dominate across all quintiles, while other issues like housing and immigration vary.
economy, NHS, housing, inflation, immigration, deprivation, UK, trends, concerns, Ipsos
false
Market Analysis and Trends
Government & Public Sector
Mixed Chart
IPSOS
Add to my slides
Remove from favorites
This slide contains a line chart showing trends in U.S. economic optimism from February 2014 to February 2022. It includes labels for each data point, a color-coded key for different economic sectors, and small iconographic elements related to business types. The layout is structured with a clear title at the top and additional insights listed in a separate box on the right.
Market Analysis and Trends
Financial Services
The slide presents a line chart tracking the optimism regarding the U.S. economy over several years, with a focus on various business sectors. Insights regarding specific sectors are provided in a text box, emphasizing shifts in optimism levels and providing a comparative view across different sectors. The slide serves to analyze and communicate trends in economic sentiment.
economy, optimism, trends, economic sectors, historic average
false
Market Analysis and Trends
Financial Services
Mixed Chart
Deloitte
Add to my slides
Remove from favorites
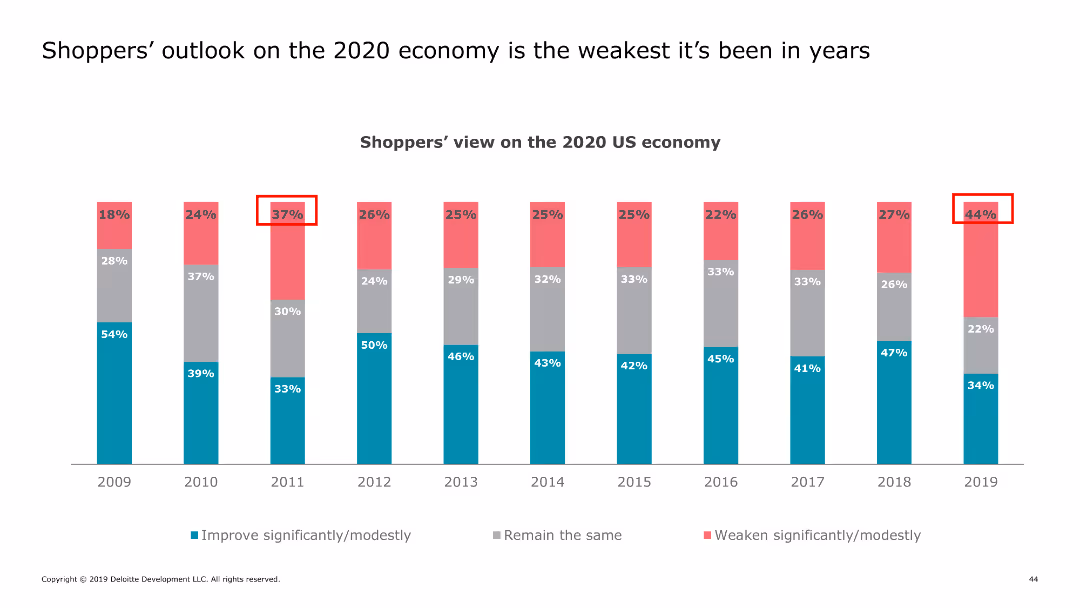
This slide presents a column chart tracking shoppers' views on the US economy over multiple years, with emphasis on the 2020 outlook. Different colors represent different levels of optimism.
Market Analysis and Trends
Retail & E-commerce
It reviews the declining optimism of shoppers regarding the US economy for the year 2020, compared to previous years, indicating a weak economic outlook.
economy, outlook, shoppers, US, trends
false
Market Analysis and Trends
Retail & E-commerce
Single Chart
Deloitte
Add to my slides
Remove from favorites
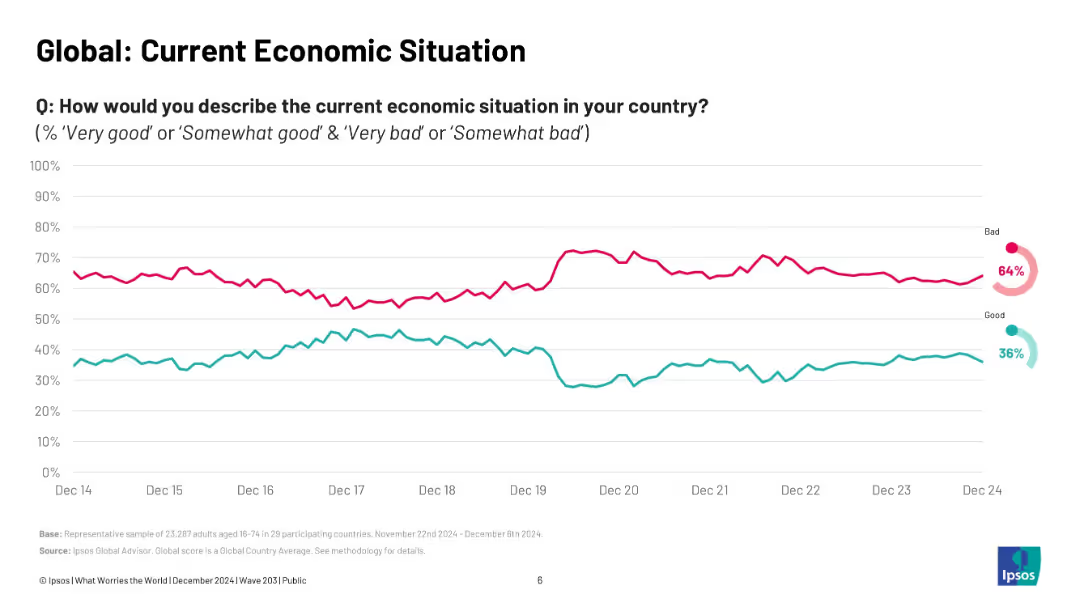
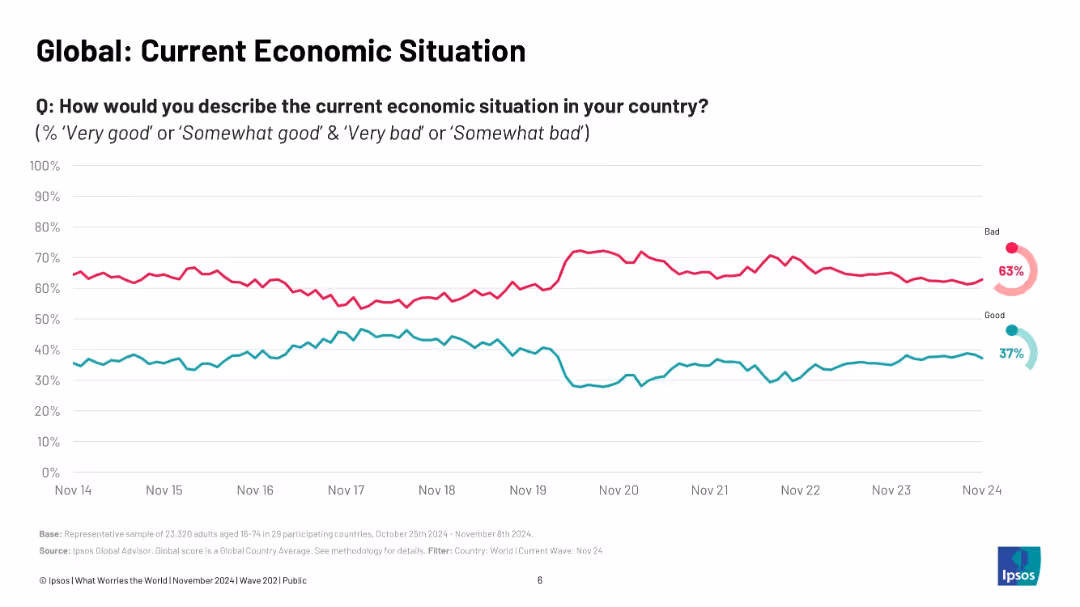
Line chart tracking public sentiment over time; two lines (good vs. bad); minimal text; annotated endpoints.
Market Analysis and Trends
Financial Services
The slide shows a long-term trend of public perception regarding national economic situations globally. Since 2020, sentiment has been increasingly negative, with a persistent majority rating conditions as "bad."
economy, perception, Ipsos, long-term trend, financial sentiment, economic health, global view, timeline, data tracking, public outlook
false
Market Analysis and Trends
Financial Services
Multiple Chart
IPSOS
Add to my slides
Remove from favorites
Full-width time-series line chart with percentage indicators for "Good" and "Bad" perceptions.
Market Analysis and Trends
Financial Services
This slide tracks global sentiment about national economic conditions over a 10-year period, contrasting the share of respondents who view the economy as good versus bad. It shows a significant long-term perception of negativity, with recent slight improvement in positive sentiment.
economy, perception, long-term trend, Ipsos, good vs bad, economic sentiment, survey, historical data
false
Market Analysis and Trends
Financial Services
Multiple Chart
IPSOS
Add to my slides
Remove from favorites
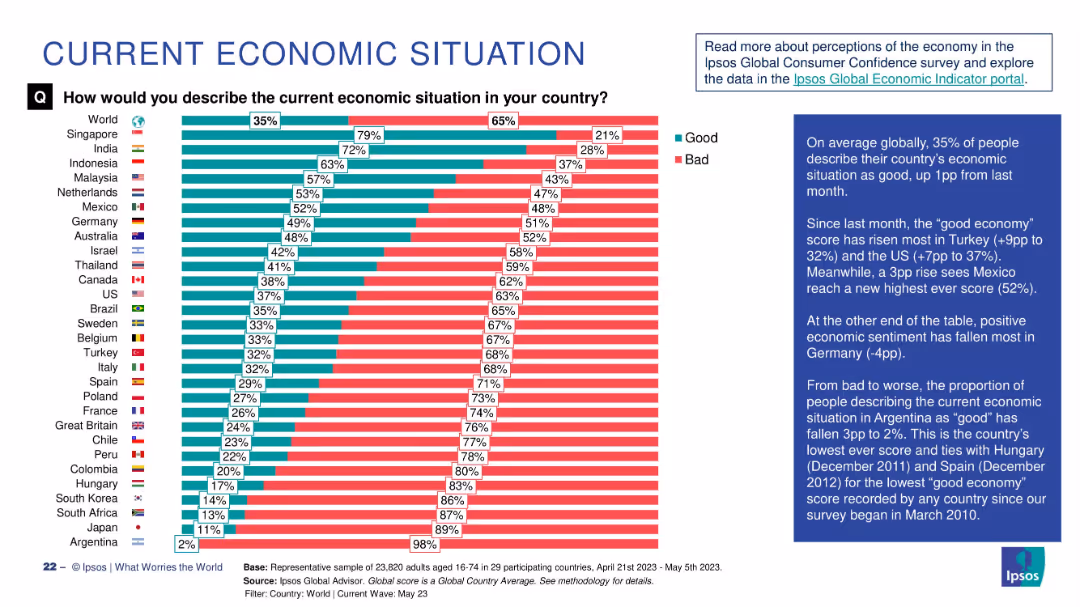
Stacked horizontal bar chart showing “Good” vs “Bad” economic sentiment per country; global average is shown first.
Strategic Planning
Financial Services
The chart compares perceptions of national economic situations. Singapore leads in positive sentiment (79%), while Argentina is lowest (2%). The red-green contrast highlights optimism vs pessimism. Commentary calls out notable shifts in Mexico (+3pp) and Germany (-4pp).
economy, public sentiment, Ipsos, global survey, good vs bad, economic perception, strategic insight, Argentina, Mexico
false
Strategic Planning
Financial Services
Single Chart
IPSOS
Add to my slides
Remove from favorites
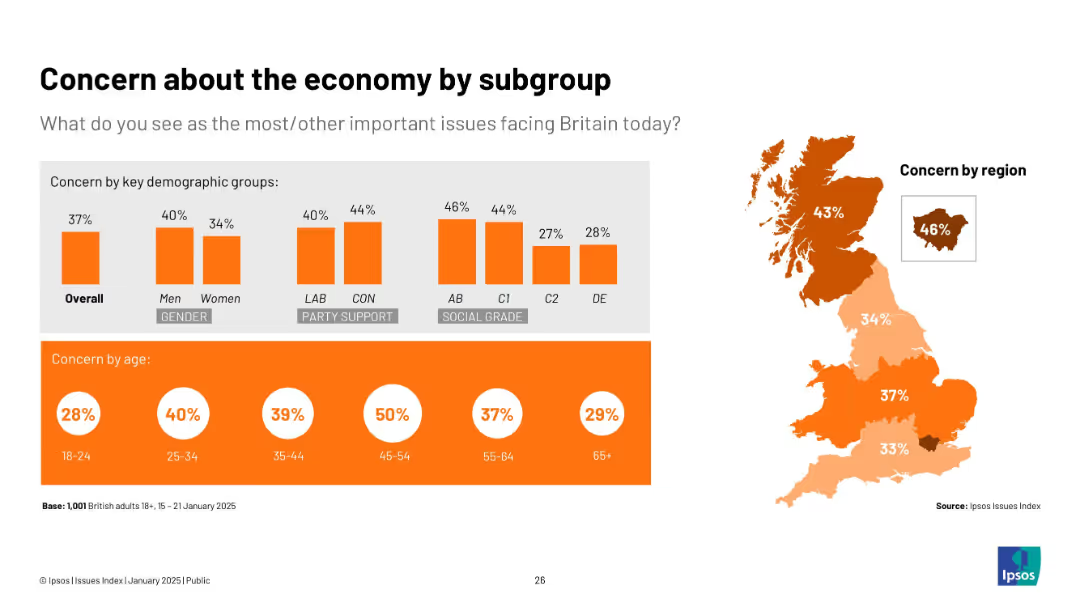
Mixed visuals: bar charts by gender, party, social grade, age + regional heat map.
Market Analysis and Trends
Government & Public Sector
This slide analyzes economic concern by subgroup. Middle-aged (45–54), higher social grades, and those in London show the most concern. Visuals highlight geographical and demographic splits on economic anxiety.
economy, region, age, gender, Ipsos, concern, segmentation
false
Market Analysis and Trends
Government & Public Sector
Multiple Chart
IPSOS
Add to my slides
Remove from favorites
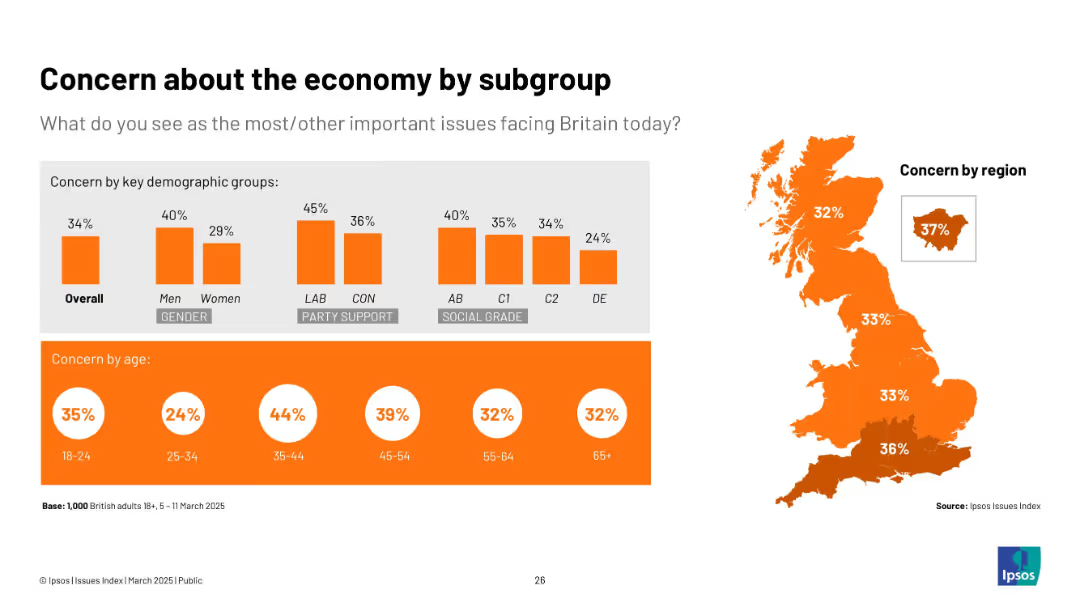
Bright orange theme; uses stacked bar and bubble charts. Demographics broken down by gender, party support, social grade, region, and age groups.
Market Analysis and Trends
Financial Services
Visualizes economic concern across key demographics. Men, Labour voters, AB grade, and 35–44 age group show highest concern. Regional concern peaks in London and South England.
economy, regional analysis, social grade, political demographics, Ipsos
false
Market Analysis and Trends
Financial Services
Multiple Chart
IPSOS
Add to my slides
Remove from favorites
Data visualization slide showing the population of Southeast Asian countries, with a simple map and corresponding data points.
Market Analysis and Trends
Technology & Software
Presents demographic data relevant to the e-Conomy SEA report, such as the population figures of countries in Southeast Asia.
e-Conomy SEA, demographics, Southeast Asia, population, country data, market analysis
false
Market Analysis and Trends
Technology & Software
Uncategorized
Bain
Add to my slides
Remove from favorites
Simple design with a title and subtitle, vibrant blue background with abstract shapes, and the logos of the collaborating companies.
Market Analysis and Trends
Technology & Software
Introduces the 'e-Conomy SEA 2021' report, indicating a focus on the digital economy of Southeast Asia during the 2020s.
e-Conomy, SEA, digital decade, market overview, technology, 2021, collaboration
false
Market Analysis and Trends
Technology & Software
Title
Bain
Add to my slides
Remove from favorites
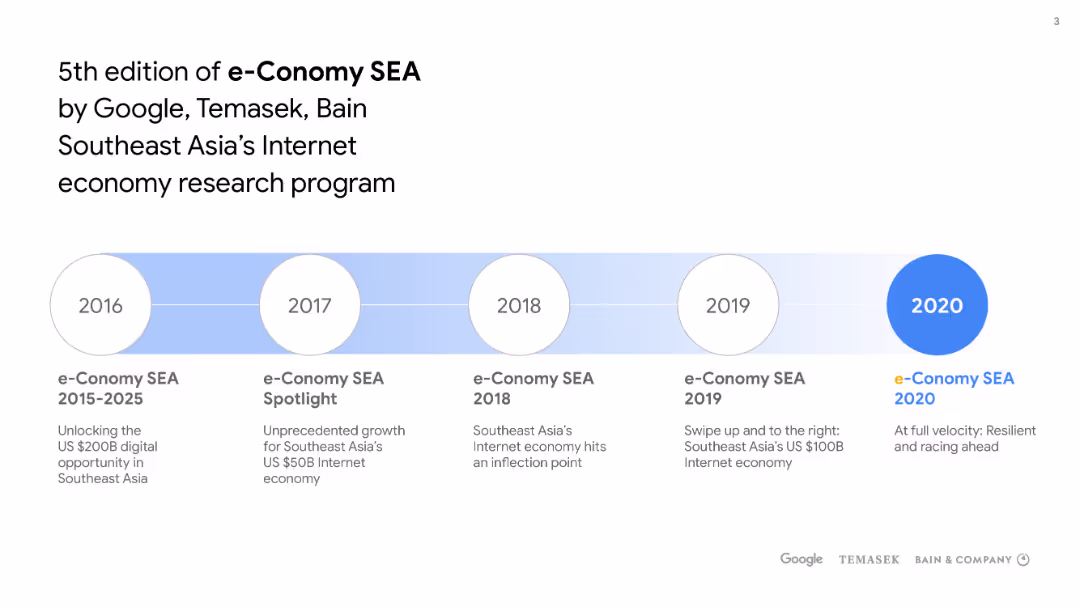
This slide has a horizontal timeline with circular nodes for the years 2016 to 2020, highlighting the progression of the e-Conomy SEA editions. The 2020 node is emphasized with a larger, filled circle. The title and subtitle are at the top, and there's a sponsors' logo section at the bottom.
Market Analysis and Trends
Technology & Software
The slide outlines the annual milestones of the e-Conomy SEA research program from 2015 to 2020, indicating growth and evolution in Southeast Asia's internet economy, supported by Google, Temasek, and Bain & Company.
e-Conomy, SEA, Google, Temasek, Bain & Company, Internet economy, Southeast Asia, research program, timeline
false
Market Analysis and Trends
Technology & Software
Pillar
Bain
Add to my slides
Remove from favorites
Timeline layout with key milestones from 2016 to 2021 and descriptions of each report edition.
Market Analysis and Trends
Technology & Software
Shows the progression of the e-Conomy SEA reports over the years, highlighting the evolution of Southeast Asia's internet economy.
e-Conomy SEA, internet economy, Southeast Asia, timeline, digital growth, market trends
false
Market Analysis and Trends
Technology & Software
Linear Flow
Bain
Add to my slides
Remove from favorites
Line chart (1999–2025) tracking public concern over economic issues with key annotations like elections
Market Analysis and Trends
Government & Public Sector
This slide focuses solely on the economy, charting public concern since 1999. Peaks correspond with major events like the 2008 crisis and 2022 inflation spikes. Election dates are marked for reference.
economy, UK, public concern, Ipsos, inflation, crisis, timeline, elections, recession, graph
false
Market Analysis and Trends
Government & Public Sector
Single Chart
IPSOS
Add to my slides
Remove from favorites
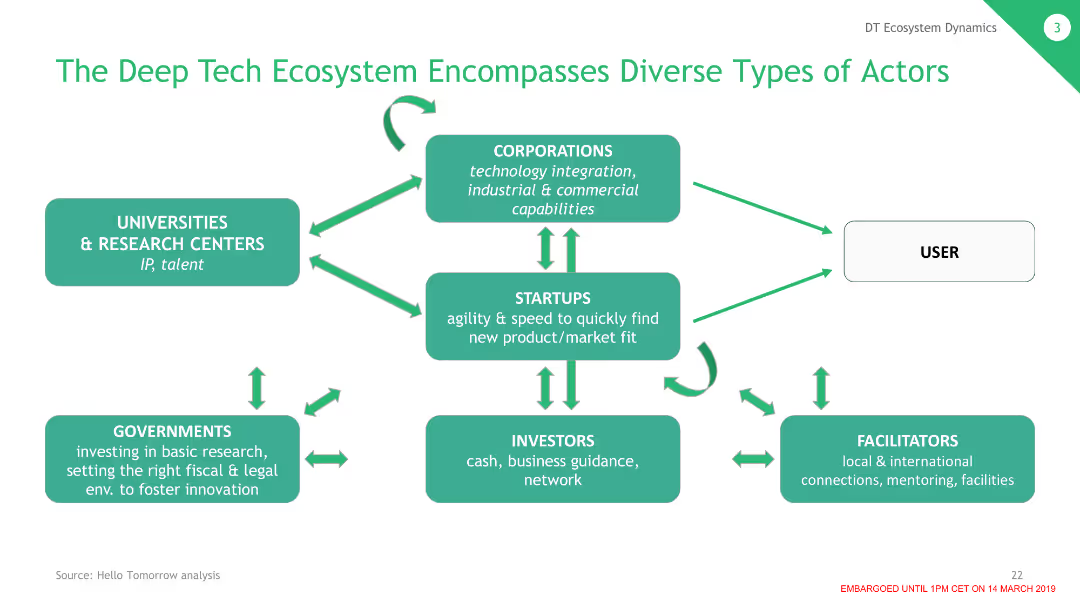
The slide features a flowchart with different types of actors in the deep tech ecosystem, including corporations, startups, investors, and governments, connected by arrows indicating interactions.
Strategic Planning
Technology & Software
This slide illustrates the deep tech ecosystem, showing the various actors and their roles in fostering innovation and technological advancements through collaboration and support.
Ecosystem, Actors, Deep Tech, Collaboration, Roles
false
Strategic Planning
Technology & Software
Single Chart
BCG
Add to my slides
Remove from favorites
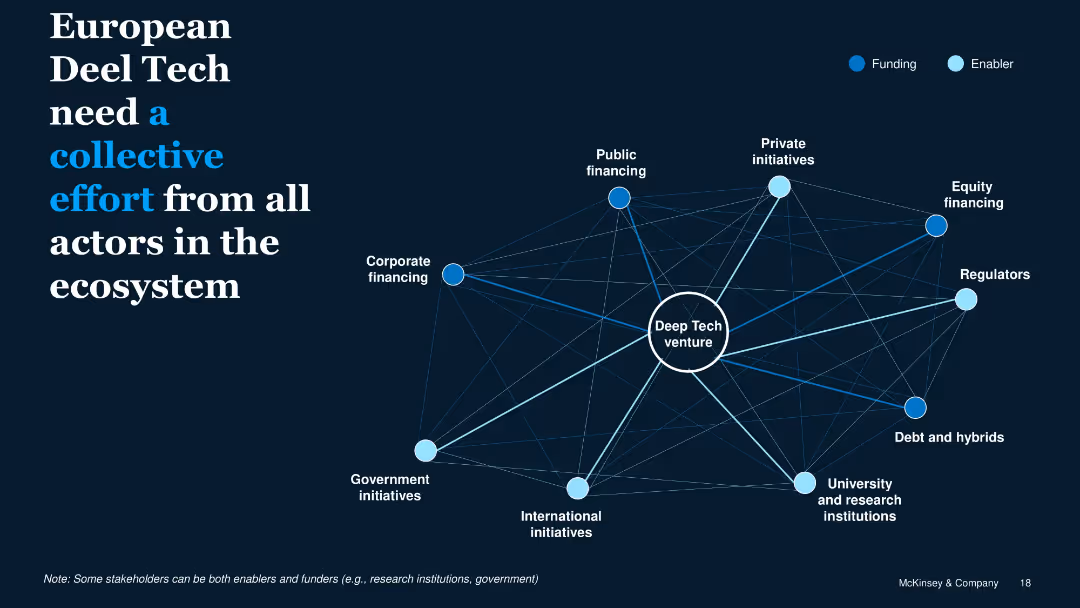
Network diagram with central Deep Tech node and surrounding ecosystem players categorized by Funding or Enabler
Organizational Structure and Change
Technology & Software
Emphasizes that successful Deep Tech ventures require coordinated actions among funding bodies (e.g., corporates, public finance) and enablers (e.g., regulators, universities), creating a connected innovation ecosystem.
ecosystem, collaboration, Deep Tech, funding, enablers, stakeholders
false
Organizational Structure and Change
Technology & Software
Framework
McKinsey
Add to my slides
Remove from favorites
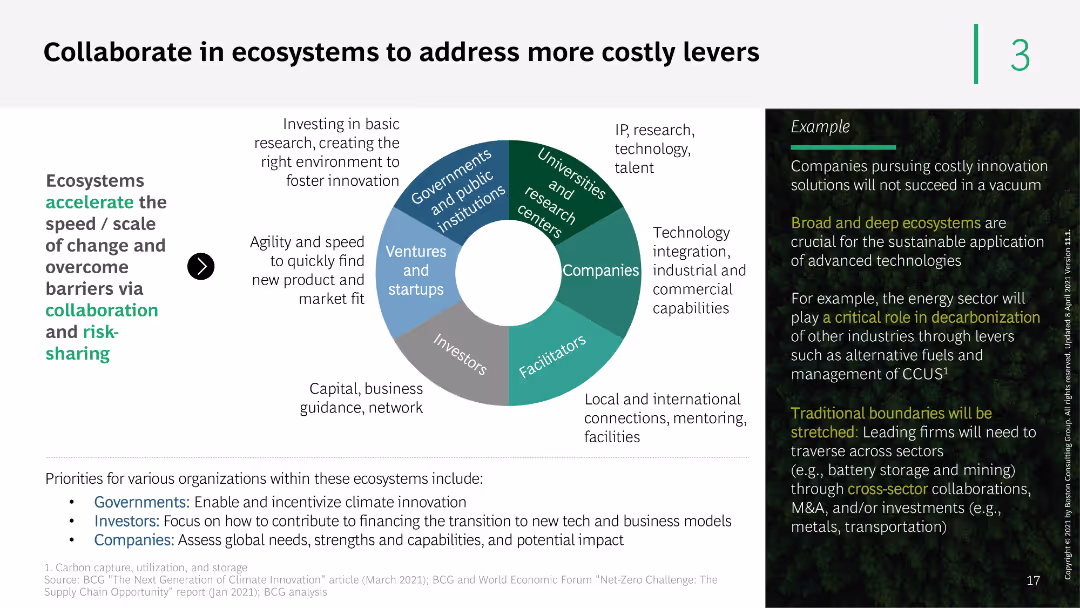
This slide features a circular diagram illustrating the various stakeholders involved in ecosystem collaboration, including governments, ventures, companies, and universities. It uses different colors and text boxes to explain each stakeholder's role.
Technology and Digital Transformation
Industrial & Manufacturing
The slide emphasizes the importance of collaboration in ecosystems to address costly innovation challenges. It outlines the roles of different stakeholders and provides an example of how such collaborations can support sustainable technology development.
ecosystem collaboration, stakeholders, innovation, sustainable technology, cost-sharing
false
Technology and Digital Transformation
Industrial & Manufacturing
Boxed
BCG
Add to my slides
Remove from favorites
Contains a circular ecosystem diagram showcasing connections between different roles like Circular Designer, and IT-sharing platform provider, supported by icons and arrows.
Operational Efficiency
Industrial & Manufacturing
Discusses the collaboration across the value chain to maximize resource efficiency in machinery and equipment, featuring role descriptions and industry examples.
ecosystem, collaboration, value chain, circular economy, roles
false
Operational Efficiency
Industrial & Manufacturing
Diagram
Accenture
Add to my slides
Remove from favorites
Circular flow diagram labeled "Chase MyHome" in the center, depicting the stages Explore, Buy, Manage. Annotations indicate various features and innovations introduced at each stage.
Technology and Digital Transformation
Financial Services
Describes the development of a unified ecosystem called Chase MyHome aimed at enhancing customer engagement and streamlining the mortgage process from property search to loan management.
Ecosystem, Engagement, Mortgage Process, Innovation, Home Buying, Loan Management
false
Technology and Digital Transformation
Financial Services
Framework
JP Morgan
Add to my slides
Remove from favorites
Central donut chart detailing the ecosystem of services and clients, surrounded by benefits listed on the right.
Strategic Planning
Financial Services
A slide focused on the strategic advantage provided by a comprehensive ecosystem of financial services, detailing the types of clients and sectors served, and the unique value propositions offered to them.
ecosystem, financial services, strategy, client service, risk management
false
Strategic Planning
Financial Services
Diagram
Goldman Sachs
Add to my slides
Remove from favorites
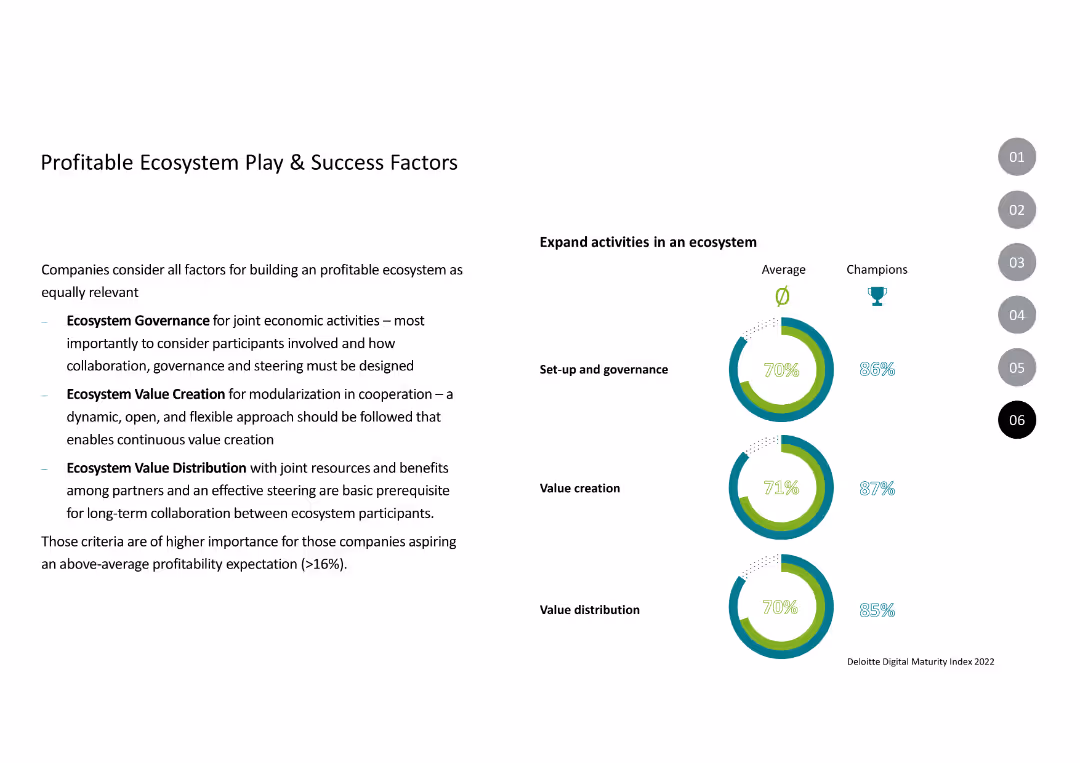
The slide has three donut charts comparing average and champion companies on set-up and governance, value creation, and value distribution. On the left, bullet points explain the importance of these factors for building a profitable ecosystem, supported by visual comparison.
Strategic Planning
Technology & Software
Explains the critical factors for building a profitable ecosystem, including governance, value creation, and value distribution. It highlights how champion companies excel in these areas compared to the average, aiming for above-average profitability.
Ecosystem, Governance, Value, Distribution, Planning
false
Strategic Planning
Technology & Software
Multiple Chart
Deloitte
Add to my slides
Remove from favorites
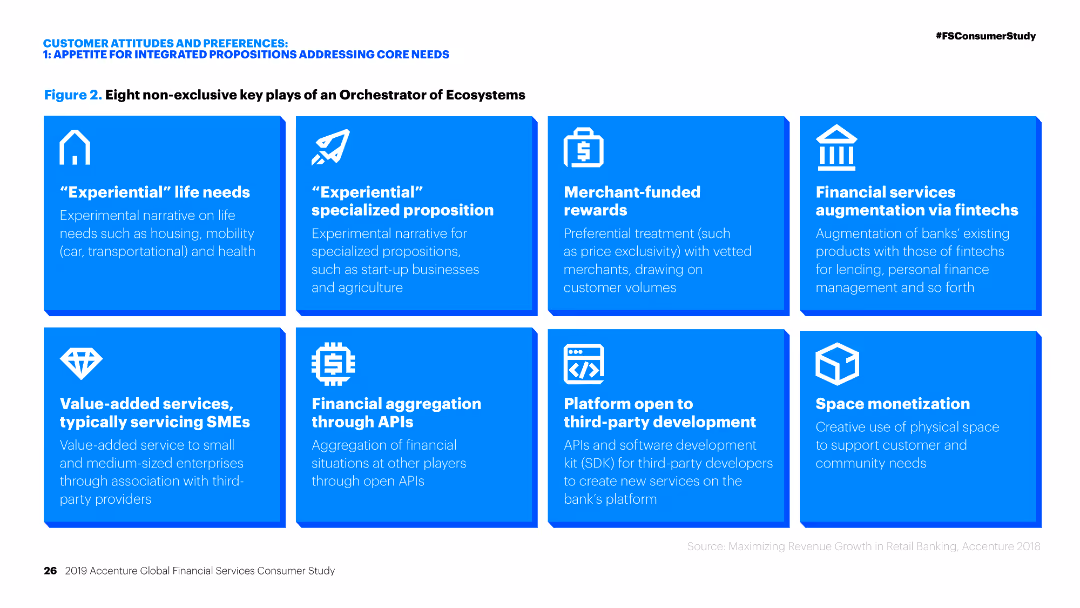
Grid layout listing eight key plays of an orchestrator of ecosystems.
Operational Efficiency
Financial Services
Overview of eight key strategies for financial services to enhance their ecosystem orchestration, focusing on experiential needs and financial services.
Ecosystem orchestration, financial services, key strategies, experiential needs, value-added services, fintech, APIs, platform development, space monetization
false
Operational Efficiency
Financial Services
Table
Accenture
Add to my slides
Remove from favorites
This slide has a five-part comparison with icons and brief descriptions, including 'THE ECOSYSTEM', 'THE ORGANIZATION', 'THE TEAM', 'THE LEADER', and 'THE INDIVIDUAL', with corresponding visual metaphors for each concept.
Organizational Structure and Change
Professional Services
Highlights five layers through which adaptable organizations can be viewed, focusing on their operations, organization, delivery, management, and individual execution. Intended to be used for discussions on corporate structure and change management in professional services.
ecosystem, organization, team, leader, individual, adaptable, management
false
Organizational Structure and Change
Professional Services
Pillar
Deloitte
Add to my slides
Remove from favorites
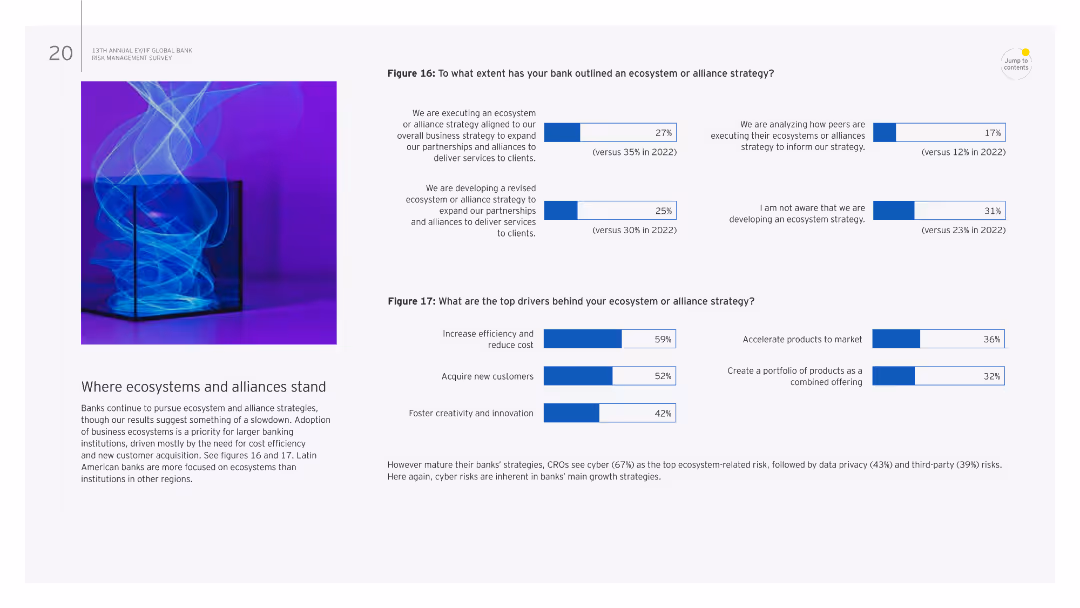
The slide features text and two column charts. The charts detail the extent of ecosystem or alliance strategies and top drivers behind these strategies.
Strategic Planning
Financial Services
It discusses the current state of ecosystem and alliance strategies in banks, including the extent of implementation and key drivers such as efficiency and innovation.
Ecosystems, alliances, strategies, efficiency, innovation
false
Strategic Planning
Financial Services
Multiple Chart
EY
Add to my slides
Remove from favorites
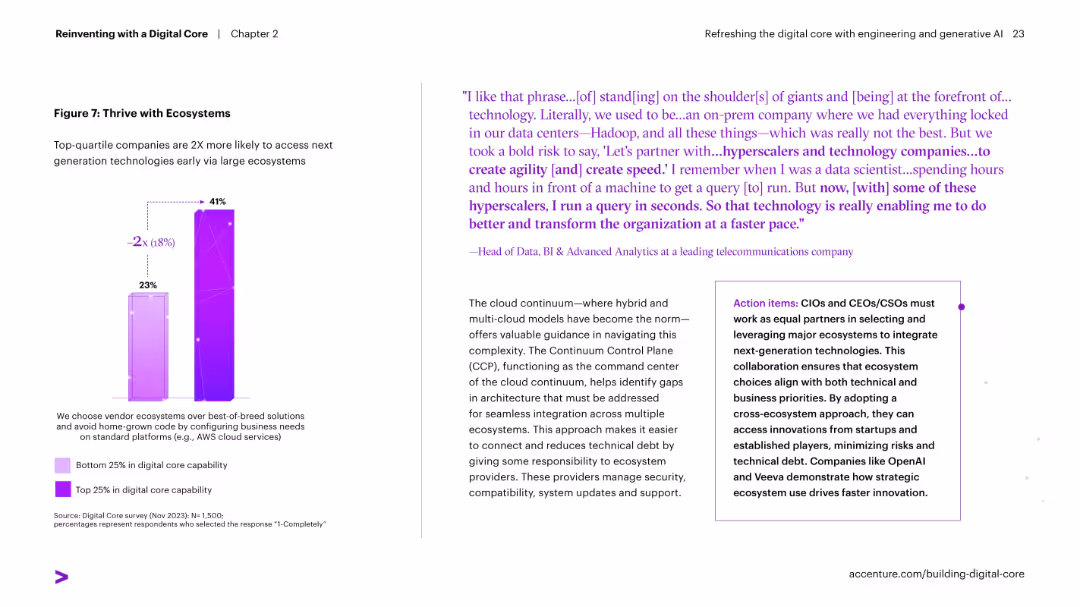
Split layout with a quote and paragraph on right and a bar chart on left comparing digital ecosystem adoption between top and bottom quartile companies.
Strategic Planning
Technology & Software
Shows how top digital performers leverage large ecosystems to access new technologies faster. Emphasizes the value of vendor ecosystems over home-grown solutions.
ecosystems, cloud, innovation, digital adoption, vendor strategy, hyperscalers, agility
false
Strategic Planning
Technology & Software
Mixed Chart
Accenture
Add to my slides
Remove from favorites
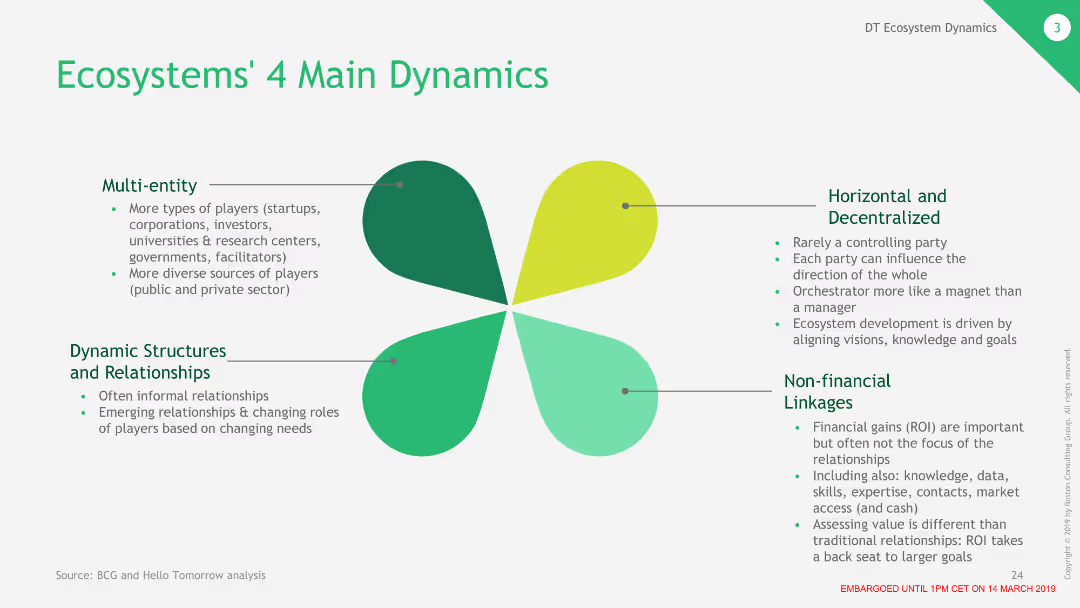
The slide features a four-leaf clover diagram, with each leaf representing one of the main dynamics of ecosystems: multi-entity, horizontal and decentralized, dynamic structures, and non-financial linkages.
Strategic Planning
Technology & Software
This slide outlines the four primary dynamics of ecosystems in deep tech, focusing on the variety of participants, decentralized nature, dynamic relationships, and importance of non-financial connections.
Ecosystems, Dynamics, Participants, Decentralized
false
Strategic Planning
Technology & Software
Framework
BCG
Add to my slides
Remove from favorites
Slide with three column and icons related to "Ecosystem co-innovation", "Transition support", and "Regional collaboration". Includes detailed actions for regions and sectors to improve sustainability efforts.
Strategic Planning
Environmental Services & Sustainability
Expands on previous discussions about enhancing SEA's green economy at an ecosystem level, outlining specific collaborative actions and support mechanisms necessary for environmental sustainability.
ecosystem, SEA, sustainability, collaboration, innovation
false
Strategic Planning
Environmental Services & Sustainability
Pillar
Bain
Add to my slides
Remove from favorites
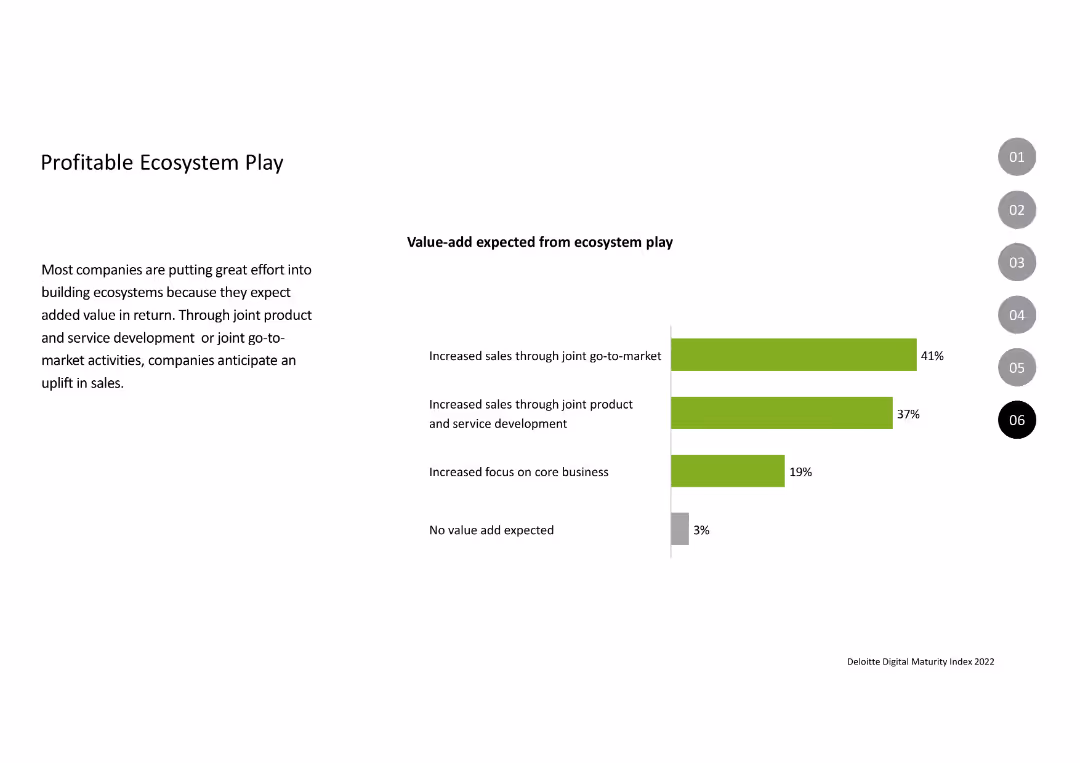
Contains a column chart displaying the expected value-add from ecosystem play, with bars in green and gray indicating percentages. The text on the left explains the rationale behind building ecosystems, highlighting benefits like increased sales and focus on core business.
Strategic Planning
Technology & Software
Describes the efforts companies are making to build ecosystems to enhance sales and focus on core business. The slide presents data on the anticipated value additions from joint go-to-market strategies and product development, with a small percentage expecting no value-add.
Ecosystem, Value-add, Sales, Development, Strategy
false
Strategic Planning
Technology & Software
Mixed Chart
Deloitte
Add to my slides
Remove from favorites
Features images of digital platforms and logos of main partners. A clean, professional layout showcases the integration of services and key statistics highlighting the scale of the marketplace.
Industry Overview
Financial Services
Introduces the eCred platform, illustrating its role in connecting banks and fintechs with users. Highlights the significant membership base and key partners involved.
eCred, fintech, banking
false
Industry Overview
Financial Services
Linear Flow
Barclays
Add to my slides
Remove from favorites
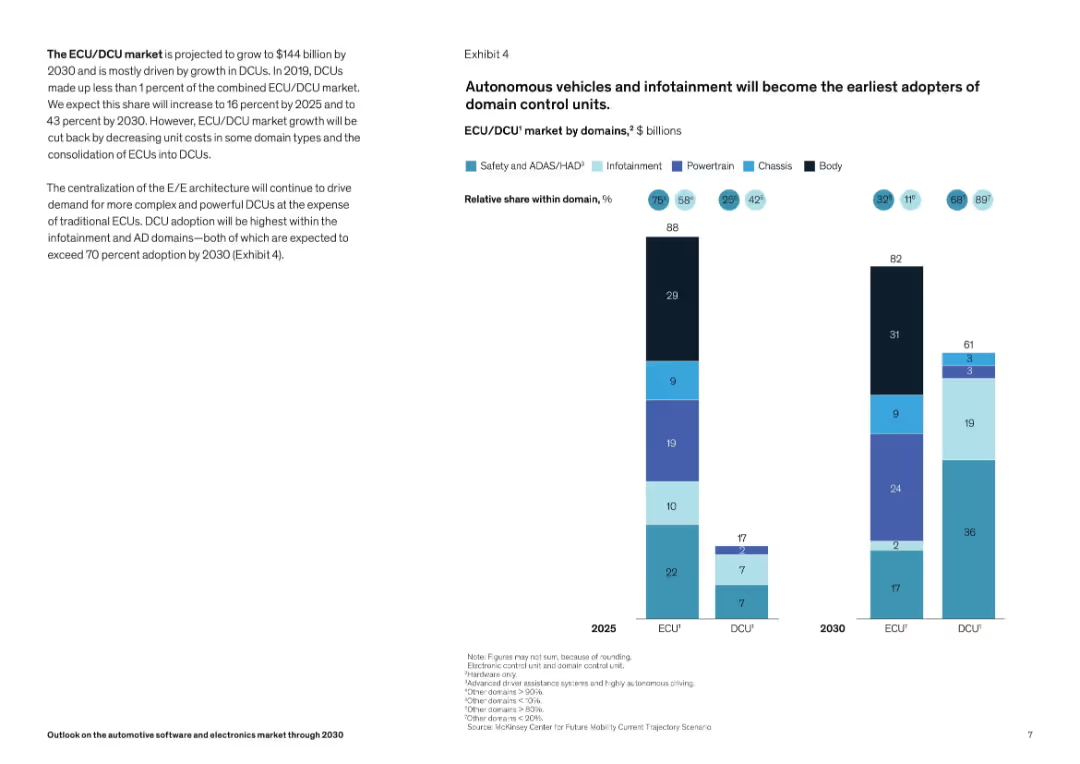
Two-column layout; left side has textual insights, right side features a stacked bar chart comparing ECU and DCU market values and domain shares for 2025 and 2030. Color-coded bars indicate different vehicle domains.
Market Analysis and Trends
Industrial & Manufacturing
This slide highlights the growth of the ECU/DCU market to $144B by 2030, driven by DCU adoption, especially in autonomous driving (AD) and infotainment. A bar chart shows domain-wise distribution and projected adoption trends for 2025 and 2030. Centralized E/E architecture is emphasized as a growth driver for DCUs.
ECU, DCU, ADAS, infotainment, autonomous driving, domain architecture, market growth, vehicle electronics, 2030 forecast, automotive
false
Market Analysis and Trends
Industrial & Manufacturing
Mixed Chart
McKinsey
Add to my slides
Remove from favorites
Continuation from the previous slide, this one similarly employs a mix of informative icons and text to express key points about the operational necessity of edge computing, showcased against a dark backdrop.
Technology and Digital Transformation
Technology & Software
This slide emphasizes the operational necessity of edge computing in modern business, highlighting the growing importance of data regulation, enterprise spend, and distributed computing's popularity. It lays out the escalating pace of data volume growth and the potential for edge computing to offer real-time insights and more significant operational flexibility.
Edge Computing, Data Regulation, Operational Necessity
false
Technology and Digital Transformation
Technology & Software
Pillar
McKinsey
Add to my slides
Remove from favorites
A visually engaging slide presenting a variety of computing methods like device edge, remote edge, and hybrid cloud, illustrated with relevant icons and diagrams, all on a sleek dark background.
Technology and Digital Transformation
Technology & Software
The slide provides a comprehensive overview of the cloud and edge computing trend, explaining the shift from centralized to hybrid computational models. It details various computing locations and their use cases, highlighting how they contribute to tomorrow's networks with closer user computation.
Edge Computing, Hybrid Cloud, Computational Models
false
Technology and Digital Transformation
Technology & Software
Header Horizontal
McKinsey
Add to my slides
Remove from favorites
This slide is text-dominant with a straightforward layout on a dark background, directing leaders' focus to the benefits and uncertainties associated with engaging with edge computing trends.
Technology and Digital Transformation
Technology & Software
The slide aims at guiding leaders on engaging with edge computing trends, outlining the potential benefits such as improved data latency and compliance, and risks like business model challenges and technical hurdles. It serves as a decision-making framework for leaders to assess opportunities and manage risks in adopting edge computing technologies.
Edge Computing, Leadership Considerations, Business Risks
false
Technology and Digital Transformation
Technology & Software
Boxed
McKinsey
Add to my slides
Remove from favorites
Detailed map of Edinburgh highlighting key areas with clusters of high-growth tech companies. Uses color coding to differentiate various types of organizations like universities and tech hubs.
Market Analysis and Trends
Technology & Software
Maps the concentration of tech companies and supporting infrastructure in Edinburgh, detailing the strategic importance of its central districts and peripheral areas for tech growth.
Edinburgh, tech companies, map
false
Market Analysis and Trends
Technology & Software
Graphic
Barclays
Add to my slides
Remove from favorites
The slide contrasts the adoption rates of EdTech tools pre and during COVID-19 with two circle diagrams and a side text block. The color palette includes grey for pre-COVID and blue for the current state.
Market Analysis and Trends
Education & Training
The slide illustrates the explosive growth in EdTech tool adoption during the pandemic, with a significant increase in app installations, signaling a pivot in educational practices in Southeast Asia.
EdTech, Adoption, Growth, COVID-19, App Installations, Pivot, Educational Practices, SEA, Tools, Increase
false
Market Analysis and Trends
Education & Training
Single Chart
Bain
Add to my slides
Remove from favorites
Includes a column chart for market size by year, bullet points explaining factors contributing to growth, and a pie chart for market division.
Market Analysis and Trends
Education & Training
This slide reflects the accelerated adoption of ed-tech in tier 2 and tier 3 cities, with a focus on the impact of COVID-19 on educational technology uptake. It discusses the systematic changes needed to fully harness the potential of ed-tech, highlighting growth drivers and future market expectations.
Ed-Tech, COVID-19, Market Growth, Systematic Push, Education System, Online Learning
false
Market Analysis and Trends
Education & Training
Mixed Chart
Kearney
Add to my slides
Remove from favorites
Slide features a clear diagram categorizing various EdTech solutions along the teaching and learning journey, with a side panel listing target audiences. It utilizes blue and grey for text and background contrast.
Industry Overview
Education & Training
This slide maps the ecosystem of EdTech startups in Southeast Asia, displaying a range of solutions and the respective educational segments they serve, from K-12 to corporate training.
EdTech, Ecosystem, Startups, SEA, Solutions, Education, Learning Journey, K-12, Corporate Training, Segmentation
false
Industry Overview
Education & Training
Table
Bain
Add to my slides
Remove from favorites
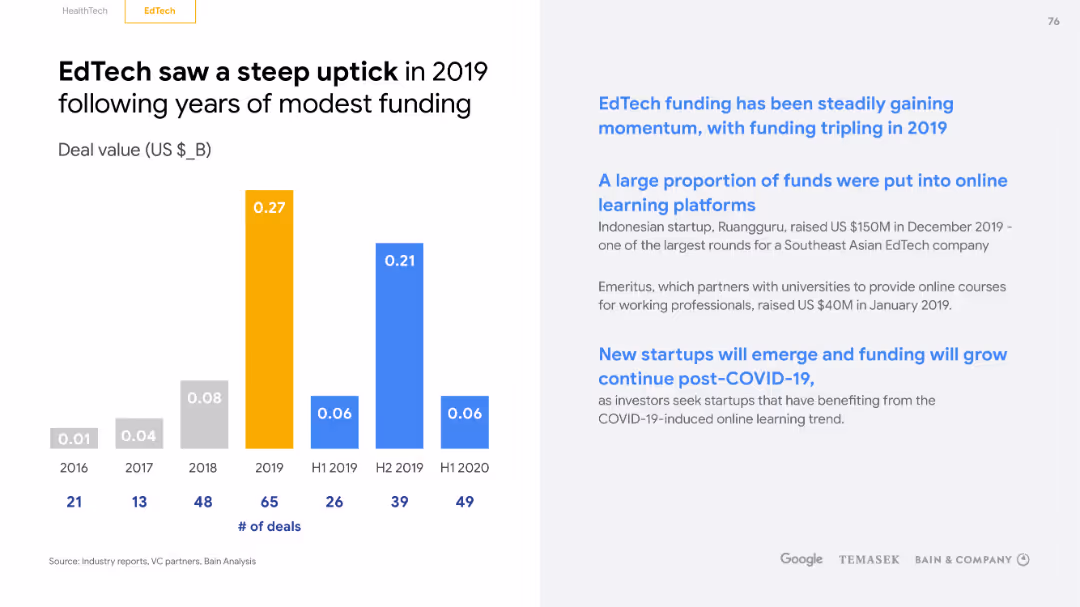
A dual-colored column chart displays EdTech funding over years with annotations. The layout includes a title at the top and a footnote, with a yellow and blue theme.
Investment Analysis
Education & Training
The slide highlights a significant increase in EdTech funding, particularly in 2019, and discusses the types of platforms that received investment, suggesting ongoing momentum and the potential for new startups in the post-COVID era.
EdTech, Funding, Increase, Investment, Startups, COVID-19, Platforms, Momentum, Growth, Potential
false
Investment Analysis
Education & Training
Single Chart
Bain
Add to my slides
Remove from favorites
Displays a column chart with total deal values in the Edtech sector, accompanied by key insights in a sidebar. The design utilizes color coding to make distinctions between different years and highlights a trend in deal sizes.
Investment Analysis
Education & Training
Explores the increasing investor interest in Edtech despite scaling challenges. It notes the predominance of early-stage deals and suggests the need for region-specific approaches to ensure effective educational technology dissemination.
Edtech, Investment, Scaling, SEA
false
Investment Analysis
Education & Training
Mixed Chart
Bain
Add to my slides
Remove from favorites
The slide includes a column chart depicting edtech funding over time, with annotations and a yellow circle highlighting trends. Text boxes with bullet points are present to explain the chart's context.
Market Analysis and Trends
Education & Training
Discusses the trend of decreased investment in edtech post-pandemic, with a focus on the impact of economic reopening and shifting investor interests towards other sectors like SaaS and Web3.
edtech, investments, pandemic, e-learning, in-person learning, funding, SaaS, Web3, economic reopening
false
Market Analysis and Trends
Education & Training
Single Chart
Bain
Add to my slides
Remove from favorites
This slide is moderate in complexity with a dual-tab layout, one focusing on HealthTech and one on EdTech, with text boxes and color-coded areas indicating various levels of technology adoption during the lockdown.
Market Analysis and Trends
Education & Training
The slide discusses the significant yet incomplete adoption of EdTech tools in education during lockdowns, with a focus on areas with heavy, moderate, and potential for increased adoption.
EdTech, lockdown, adoption, video lectures, methodologies
false
Market Analysis and Trends
Education & Training
Table
Bain
Add to my slides
Remove from favorites
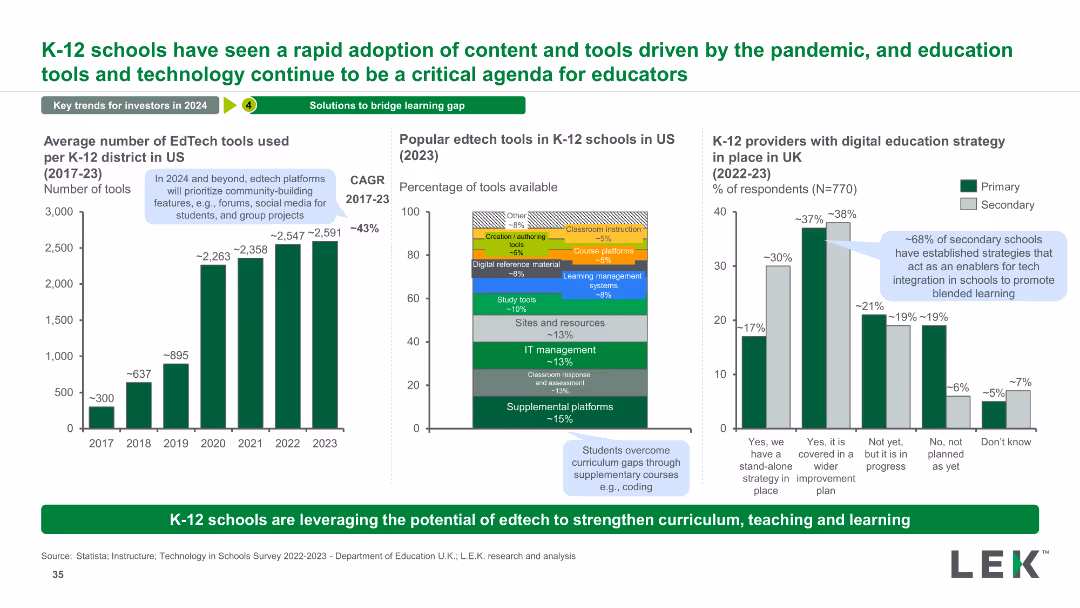
The slide has three charts: a column chart showing the average number of EdTech tools used from 2017 to 2023, a stacked bar chart of popular EdTech tools in 2023, and a column chart of UK schools with digital education strategies.
Technology and Digital Transformation
Education & Training
This slide highlights the rapid adoption of EdTech tools in K-12 schools, showing growth trends, popular tools, and digital strategies in UK schools.
EdTech, Tools, Adoption, K-12, Technology, Trends, Growth, Education, Digital, Strategy
false
Technology and Digital Transformation
Education & Training
Multiple Chart
LEK
Add to my slides
Remove from favorites
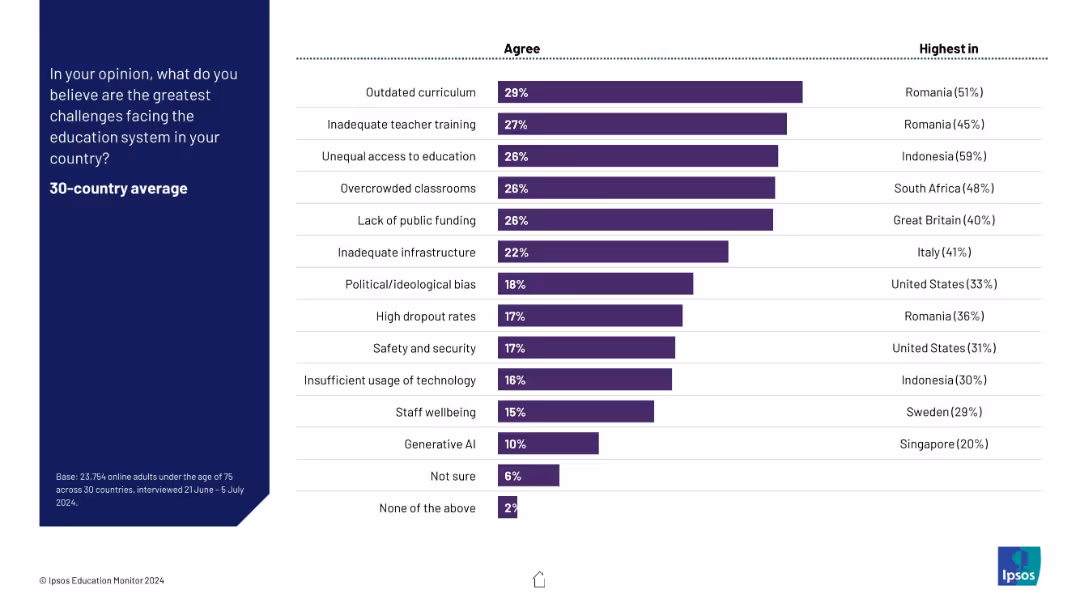
Vertical bar chart of 13 challenges, sorted by agreement level. Purple bars with “Highest in” country indicated per issue.
Risk Assessment and Management
Education & Training
This slide presents the most commonly cited educational challenges across 30 countries, with “outdated curriculum” and “inadequate teacher training” as top concerns. It also shows which countries report these issues most strongly.
educational challenges, risks, curriculum, teacher training, infrastructure, survey responses
false
Risk Assessment and Management
Education & Training
Mixed Chart
IPSOS
Add to my slides
Remove from favorites
Features column charts comparing graduates in technology-related fields versus business administration across Brazil, the US, Germany, Estonia, and India. Each country's flag is displayed above the respective columns.
Human Resources and Talent Management
Education & Training
Focuses on the proportion of tech to non-tech graduates in various countries, highlighting Brazil's large disparity. Useful for discussions on educational reforms or workforce development strategies.
education, Brazil, tech talent, graduates, comparison
false
Human Resources and Talent Management
Education & Training
Single Chart
McKinsey
Add to my slides
Remove from favorites
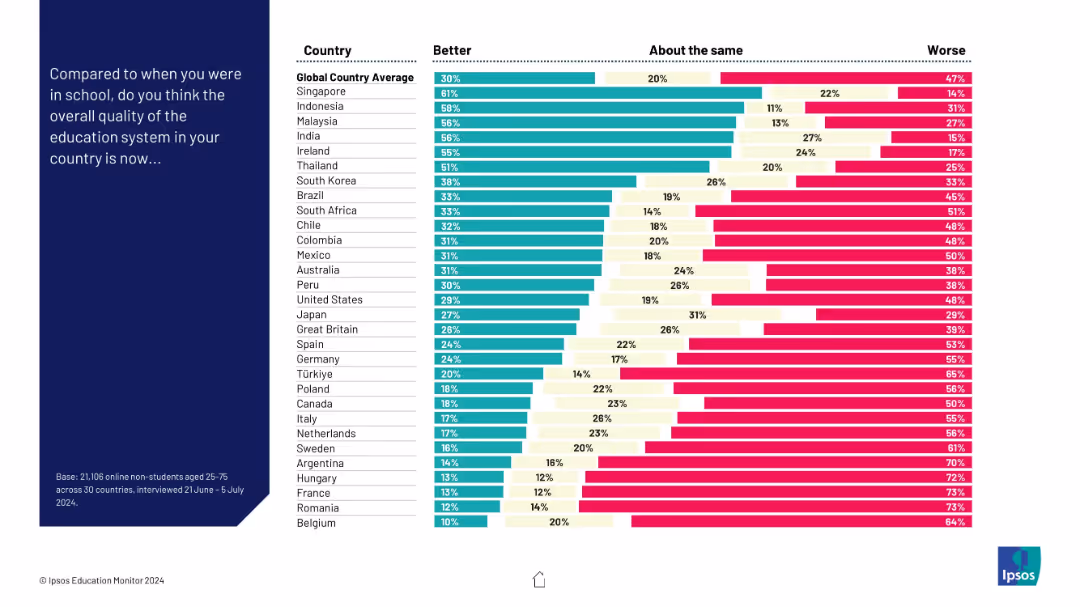
Horizontal bar chart displaying whether adults think their country’s education quality has improved, stayed the same, or worsened since their school years.
Strategic Planning
Education & Training
This slide captures generational change in public sentiment around education quality. While countries like Indonesia and Malaysia report improvements, many in Europe and South America feel their systems have deteriorated over time.
education change, perception, generations, Ipsos, quality, country comparison
false
Strategic Planning
Education & Training
Mixed Chart
IPSOS
Add to my slides
Remove from favorites
The slide contains a combination of icon-based bar charts and isometric illustrations. There are three key statistics presented with corresponding icons: a baby carriage, pencils, and desks. Colors are blue, grey, and green.
Customer and Market Segmentation
Education & Training
This slide highlights statistics regarding access to education and childcare services. It showcases specific deficits in education availability, such as adult education and childcare, using graphical representations to clearly communicate the data.
education, childcare, statistics, access, deficits
false
Customer and Market Segmentation
Education & Training
Single Chart
Deloitte
Add to my slides
Remove from favorites
The stacked column chart illustrates global education and EdTech expenditures from 2019 to 2025, showing the growing share of digital spending within the education sector.
Market Analysis and Trends
Education & Training
Projects the future trend in education technology spending, highlighting an increasing share of digital investments within the global education expenditure from 2019 to 2025. It emphasizes the accelerated shift towards digital education due to the pandemic.
education, digital, spending, 2025, trend
false
Market Analysis and Trends
Education & Training
Mixed Chart
Roland Berger
Add to my slides
Remove from favorites
The slide features a title at the top with a subtitle underneath, followed by two column charts for 2022 and 2023, comparing the perceived preparedness of France for future professional challenges in digital and energy sectors. Quotes from various executives provide qualitative insights on the right.
Market Analysis and Trends
Professional Services
This slide evaluates perceptions of France's preparedness for future professions related to digital and energy transitions, showing increasing concern from 2022 to 2023.
education, digital transition, energy transition, France, preparedness, professional training, talent, innovation, public opinion, workforce challenges
false
Market Analysis and Trends
Professional Services
Mixed Chart
Bain
Add to my slides
Remove from favorites
Bar charts show enrollment rates and degree considerations among first-generation and continuing-generation students.
Market Analysis and Trends
Education & Training
Analyzes educational preferences and outcomes, focusing on enrollment differences between student groups.
education, enrollment rates, student choices, outcomes
false
Market Analysis and Trends
Education & Training
Multiple Chart
BCG
Add to my slides
Remove from favorites
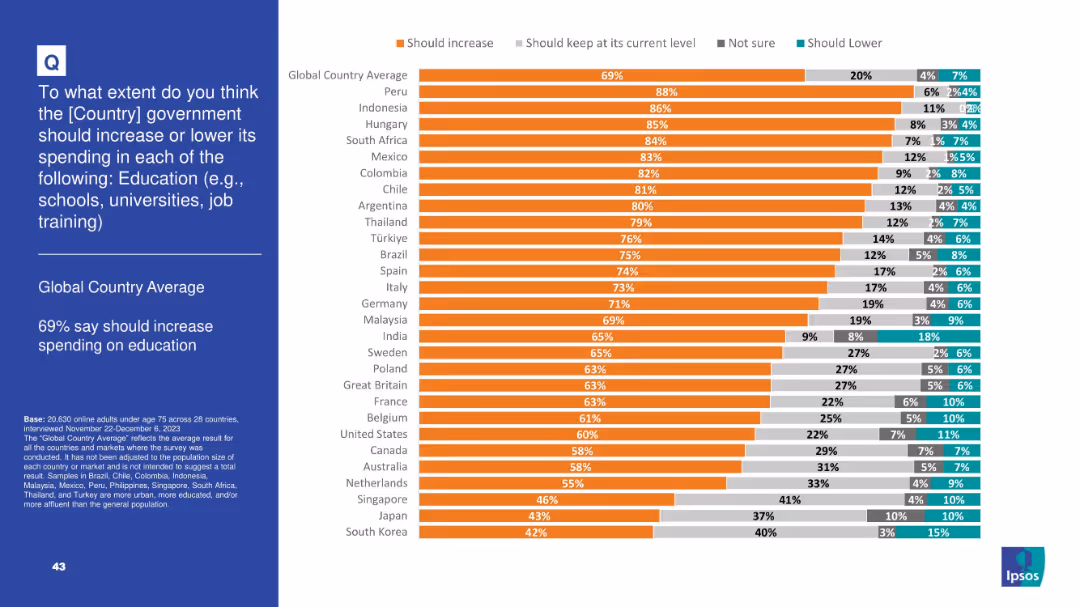
Orange-dominant bar chart with country ranking; education-specific focus.
Strategic Planning
Government & Public Sector
This slide illustrates near-universal public support for increasing education funding, with a 69% average across 28 countries. Countries are ranked by level of agreement, and minimal support is shown for lowering such spending.
education funding, public investment, education reform, global opinion, Ipsos 2023, education priorities
false
Strategic Planning
Government & Public Sector
Mixed Chart
IPSOS
Add to my slides
Remove from favorites
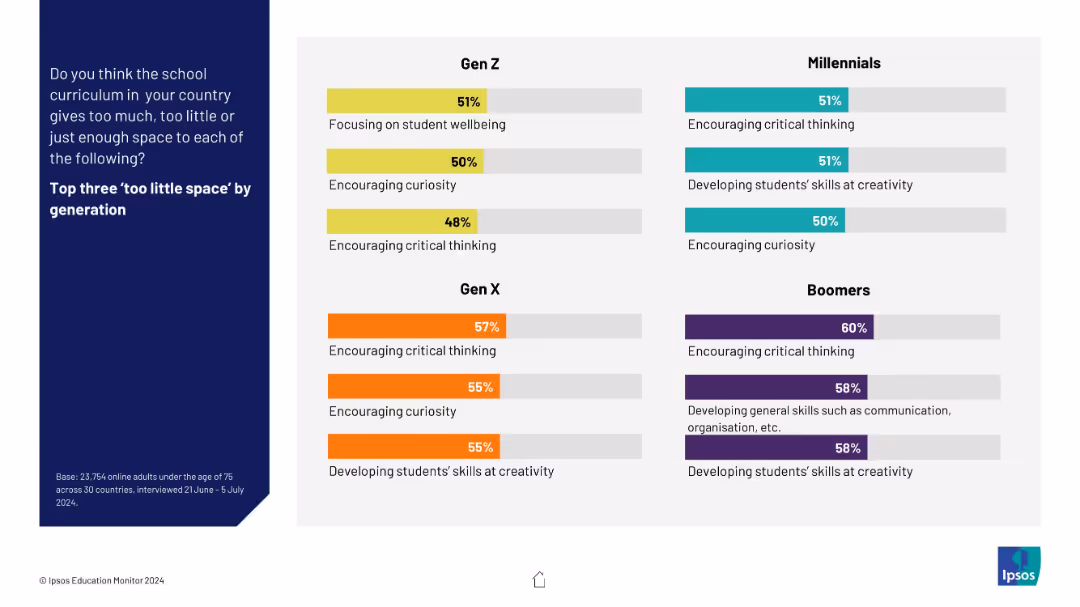
Four quadrant-style boxes segmented by generation, showing the top three areas lacking space in the curriculum. Each entry includes a percentage.
Customer and Market Segmentation
Education & Training
The slide details generational perspectives on which parts of the curriculum receive too little emphasis. Boomers most frequently cite critical thinking, while Gen Z highlights wellbeing and curiosity.
education gaps, generational perspective, curriculum critique, critical thinking, wellbeing
false
Customer and Market Segmentation
Education & Training
Mixed Chart
IPSOS
Add to my slides
Remove from favorites
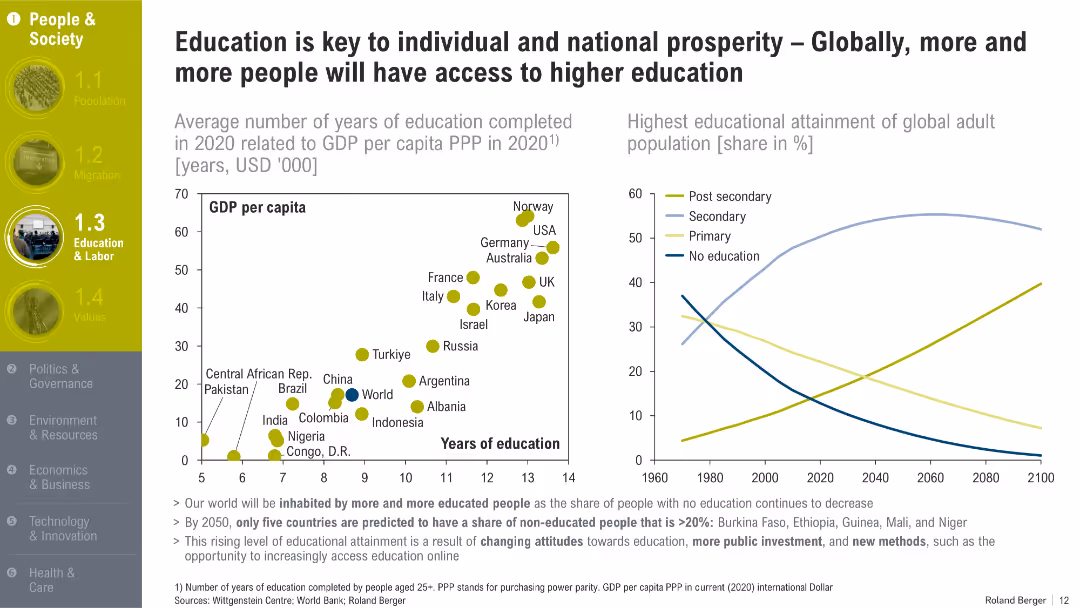
Two charts—one scatterplot correlating years of education with GDP per capita and another line graph showing changes in global educational attainment over time.
Strategic Planning
Education & Training
The slide correlates education with economic prosperity, showing how educational attainment is expected to rise globally. It predicts only five countries will remain with >20% uneducated adult populations by 2050.
education, GDP, global attainment, education trends, literacy, knowledge economy, development
false
Strategic Planning
Education & Training
Multiple Chart
Roland Berger
Add to my slides
Remove from favorites
A bar graph highlights the percentage of women enrolled in tertiary education by region for 2018, using different shades to depict each region.
Market Analysis and Trends
Education & Training
This slide explores gender disparities in tertiary education enrollment by region as of 2018, noting that women have overtaken men in most areas. It discusses shifts in gender parity and its implications for global educational trends.
education, gender disparity, tertiary, 2018
false
Market Analysis and Trends
Education & Training
Mixed Chart
Roland Berger
Add to my slides
Remove from favorites
Contains icons and a list of different educational initiatives by governments worldwide to bridge the tech education gap, alongside images of a globe and a person.
Human Resources and Talent Management
Education & Training
Summarizes various global efforts to enhance tech education, including opening new tech programs and online learning. Useful for policy discussions or educational development meetings.
education, global, government, tech, initiatives
false
Human Resources and Talent Management
Education & Training
Table
McKinsey
Add to my slides
Remove from favorites
The slide features a world map with highlighted regions, specifically Africa. It indicates areas where L.E.K. Global Education Practice has on-ground experience, with a focus on 20+ African countries. The slide uses shading to highlight regions and a callout for additional emphasis.
Market Analysis and Trends
Education & Training
This slide highlights L.E.K. Consulting’s global education practice, particularly their experience in Africa. It underscores the firm's extensive on-ground experience in over 20 African countries, emphasizing their global reach and specialized expertise in education.
education, global practice, Africa, experience, consulting
false
Market Analysis and Trends
Education & Training
Graphic
LEK
Add to my slides
Remove from favorites
A column chart depicts the increase in global adult education levels from 1990 to projections for 2050, with separate columns for educational stages. The layout is clear with distinct colors for each educational level.
Market Analysis and Trends
Education & Training
This slide tracks the progress in global educational attainment from 1990, showing the growing trend through 2020 and projecting further increases by 2050. It highlights shifts towards higher education levels globally, with clear demographic segmentation.
education, global, trend, projection, levels
false
Market Analysis and Trends
Education & Training
Mixed Chart
Roland Berger
Add to my slides
Remove from favorites
The slide features a column chart showing global gross value added by sector in trillions of USD, with education highlighted among the top 10 sectors, along with a map indicating sector distribution worldwide.
Industry Overview
Education & Training
The slide provides an overview of the education sector's global economic impact, positioning it among the top 10 sectors in terms of gross value added, with a compound annual growth rate (CAGR) of approximately 3% between 2009 and 2019.
Education, global value, sector, economic impact, growth
false
Industry Overview
Education & Training
Single Chart
LEK
Add to my slides
Remove from favorites
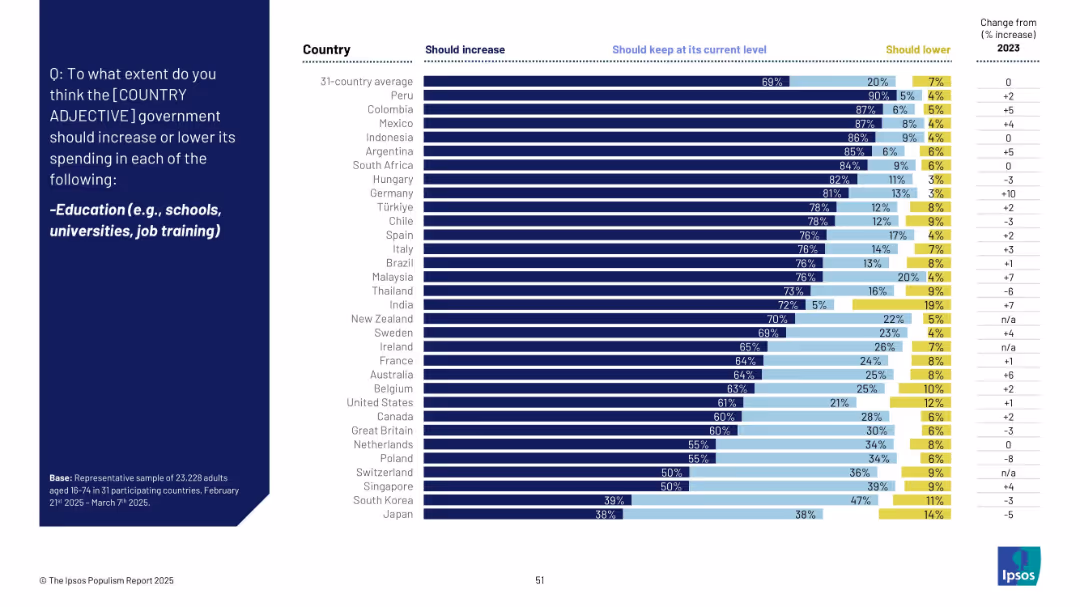
Similar three-part bar chart showing support for increased, maintained, or decreased government education spending.
Strategic Planning
Education & Training
A high percentage of respondents globally (69% average) support increasing education spending. Peru, Colombia, and Mexico lead with over 85%. Japan and South Korea show lower support, possibly due to existing systems or differing priorities.
education, government spending, schools, universities, job training, opinion, investment, Ipsos
false
Strategic Planning
Education & Training
Mixed Chart
IPSOS
Add to my slides
Remove from favorites
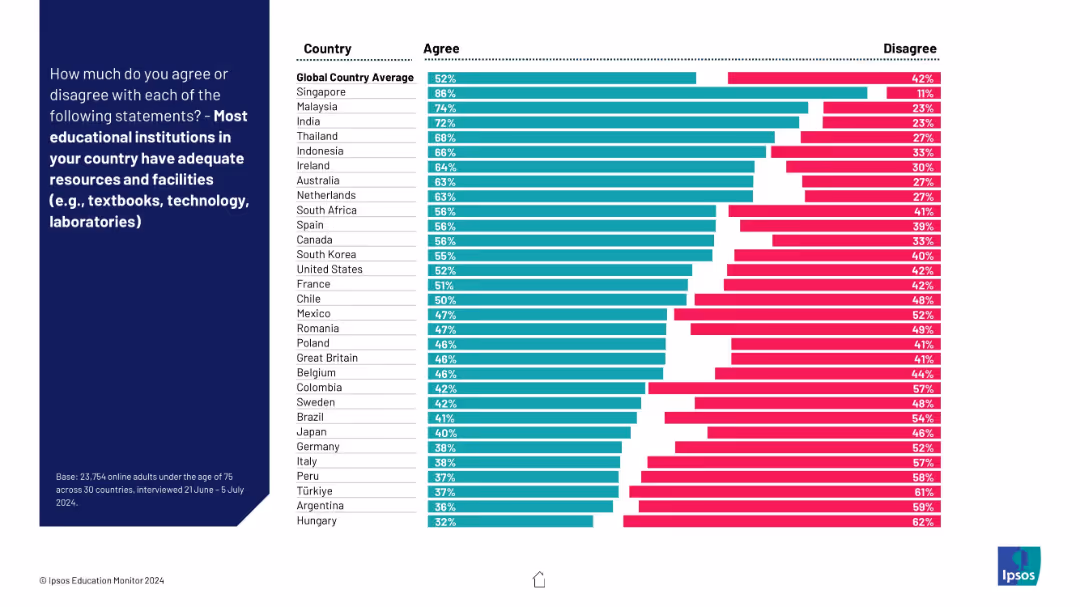
Country ranking bar chart with agree/disagree bars. Clear labeling and high contrast for data comparison.
Performance Metrics and KPIs
Education & Training
This slide shows public perception by country regarding adequacy of school resources and facilities. Singapore leads in agreement while Hungary is lowest. The slide provides global context for education infrastructure confidence.
education infrastructure, resources, facilities, country ranking, perceptions, global data
false
Performance Metrics and KPIs
Education & Training
Mixed Chart
IPSOS
Add to my slides
Remove from favorites
Scatter plot comparing Global Innovation Index 2021 against average PISA outcome 2018, with emerging markets and advanced countries highlighted. Text discusses the role of education in innovation.
Technology and Digital Transformation
Education & Training
The slide correlates Global Innovation Index scores with PISA outcomes, showing the relationship between educational performance and innovation capability. It emphasizes that countries with better education systems tend to be more innovative, highlighting the importance of investing in education for future economic growth.
Education, Innovation, PISA, GII
false
Technology and Digital Transformation
Education & Training
Mixed Chart
Roland Berger
Add to my slides
Remove from favorites
Column chart comparing art and design student participation across cities; text boxes with school rankings
Market Analysis and Trends
Education & Training
Highlights Melbourne's education strengths, comparing art and design student participation in global context
Education institutions, student participation, global ranking, Melbourne, art and design schools
false
Market Analysis and Trends
Education & Training
Mixed Chart
BCG
Add to my slides
Remove from favorites
The slide features a flowchart with statistical data, grouped under two categories: formal and informal education users. It includes percentage statistics, positive and negative impact highlights, and color coding for clarity (purple and blue). The right side presents a summary block with overall impact statistics.
Market Analysis and Trends
Telecommunications
This slide explores the impact of nbn broadband on educational outcomes, highlighting both positive and negative aspects as reported by users.
Education, Internet, Broadband, Impact, Statistics, Positive, Negative, Formal, Informal, Telecommunications
false
Market Analysis and Trends
Telecommunications
Multiple Chart
Accenture
Add to my slides
Remove from favorites
Column chart showing the number of deals in Africa by education segment and total disclosed deal value.
Market Analysis and Trends
Education & Training
This slide provides an overview of investment deals in the education sector in Africa from 2014-2018.
education, investment, Africa, deals, chart
false
Market Analysis and Trends
Education & Training
Mixed Chart
LEK
Add to my slides
Remove from favorites
An illustration of a stick figure writing on a blackboard, with a prominent title and a subtitle in bold purple text on a white background.
Industry Overview
Education & Training
The title slide introduces the theme of the presentation, hinting at a focus on transformative changes in education due to intelligent technologies.
Education, Learning, Intelligent Technologies, Skills Acquisition, Future of Work, Title Slide, Presentation, Technology Impact, Training
false
Industry Overview
Education & Training
Title
Accenture
Add to my slides
Remove from favorites
Slide features a column chart comparing loan originations across years, with an accompanying bar for forecast data, and textual information below the chart.
Financial Performance
Education & Training
This slide tracks the origination volumes of private education loans, highlighting historical data and forecasts. It is suitable for assessing the trend in loan disbursement and predicting future performance in the private education lending market.
Education, Loans, Originations, Forecast, Trend, Financial Analysis, Private, Market Share
false
Financial Performance
Education & Training
Single Chart
Morgan Stanley
Add to my slides
Remove from favorites
Includes a dual-section infographic showing the size of the global private education market and the share of Asia, with color coding and annotations.
Market Analysis and Trends
Education & Training
This slide gives an overview of the global private education market size with a detailed breakdown of the Asian sector.
education market, global, Asia, private education, market size, regional breakdown, investment potential
false
Market Analysis and Trends
Education & Training
Mixed Chart
EY
Add to my slides
Remove from favorites
Presents a column chart comparing the average weekly study hours of students in Nigerian public schools to those in various other countries, highlighting the educational challenges in Nigeria.
Strategic Planning
Education & Training
Analyzes the limitations in study hours faced by students in Nigerian public schools due to inadequate power supply, using international benchmarks to underscore the need for infrastructural improvements like solar power installations.
education, Nigeria, study hours, international comparison, public schools, power supply, benchmarks
false
Strategic Planning
Education & Training
Multiple Chart
BCG
Add to my slides
Remove from favorites
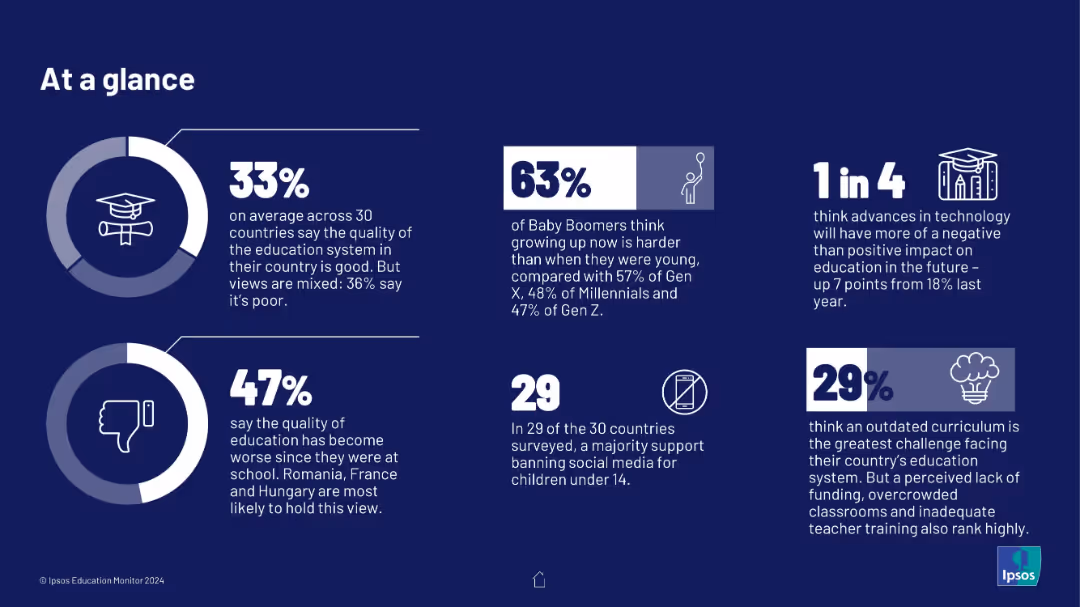
Grid of six statistic-based info-boxes on a dark blue background, each containing a percentage figure and icon, with minimal text explaining educational attitudes and perceptions.
Industry Overview
Education & Training
The slide provides a snapshot of global perceptions of education systems, tech’s impact, and social media concerns. It shows generational and geographic variances in confidence in education, curriculum quality, and views on childhood challenges.
education, perception, curriculum, technology, social media, quality, generational views
false
Industry Overview
Education & Training
Multiple Chart
IPSOS
Add to my slides
Remove from favorites
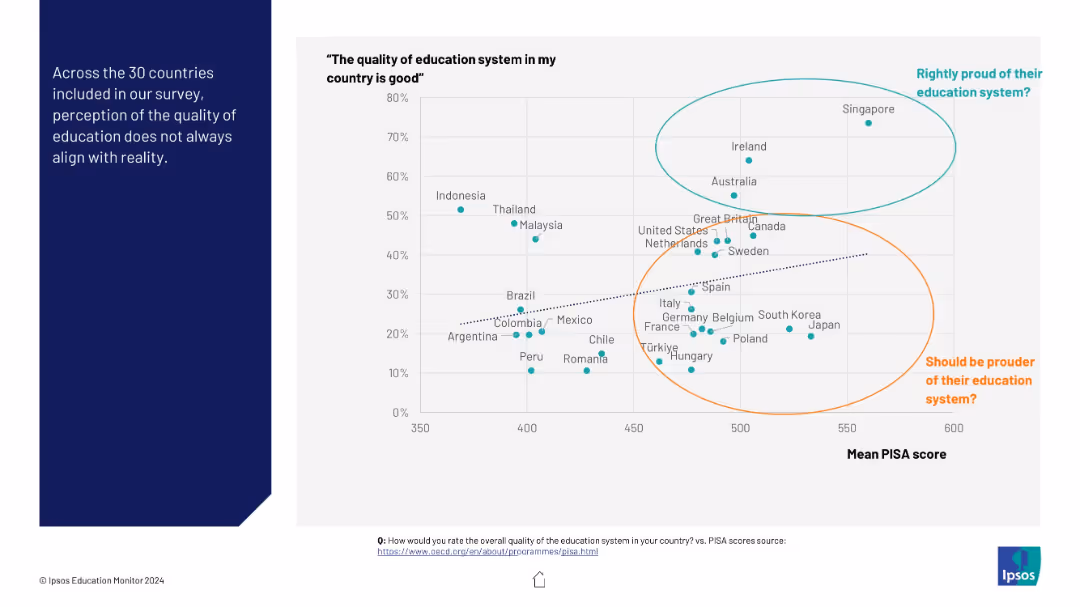
Scatter plot comparing countries’ self-rated education quality against their mean PISA scores, with regions circled to distinguish perception-reality mismatches.
Performance Metrics and KPIs
Education & Training
This visual compares public perception of education system quality with actual performance using PISA scores. Countries are grouped to highlight those underestimating or overestimating their system’s effectiveness.
education, PISA, perception, quality, comparison, countries, Ipsos, chart
false
Performance Metrics and KPIs
Education & Training
Mixed Chart
IPSOS
Add to my slides
Remove from favorites
Features multiple column charts correlating the availability of power with the hours spent studying in Nigerian schools, including potential improvements with solar energy adoption.
Strategic Planning
Education & Training
Analyzes the correlation between power supply and educational outcomes in Nigeria, advocating for solar power as a solution to increase study hours and improve overall educational quality.
education, power supply, Nigeria, solar power, study hours, school performance, infrastructure
false
Strategic Planning
Education & Training
Single Chart
BCG
Add to my slides
Remove from favorites
Contains an octagonal diagram highlighting various aspects of education reform needed to bridge the skills gap due to automation. The diagram emphasizes areas like lifelong learning, employer-informed curricula, integration of stakeholders, and policy development.
Human Resources and Talent Management
Education & Training
This slide proposes a multi-faceted approach to educational reform aimed at bridging the skills gap created by technological advancements. It emphasizes the importance of dynamic, continuous learning and collaboration between educational institutions and employers, presenting a framework for future discussions on enhancing the adaptability and skill levels of the workforce.
education reform, skills gap, lifelong learning, policy
false
Human Resources and Talent Management
Education & Training
Framework
McKinsey
Add to my slides
Remove from favorites
Displays pie charts with educational attainment levels of refugees.
Product and Service Analysis
Government & Public Sector
Details educational backgrounds of refugees and compares them with general refugee statistics.
education, refugees, background, analysis
false
Product and Service Analysis
Government & Public Sector
Mixed Chart
Deloitte
Add to my slides
Remove from favorites
A series of column charts compare post-secondary educational attainment across various regions from 2020 to 2050. Each region's chart uses two-tone color bars to distinguish between the years.
Market Analysis and Trends
Education & Training
The slide compares post-secondary educational attainment in different global regions for 2020 and projects for 2050. It discusses disparities and growth, emphasizing variances in educational progress across continents.
education, regional, 2020, 2050, comparison
false
Market Analysis and Trends
Education & Training
Multiple Chart
Roland Berger
Add to my slides
Remove from favorites
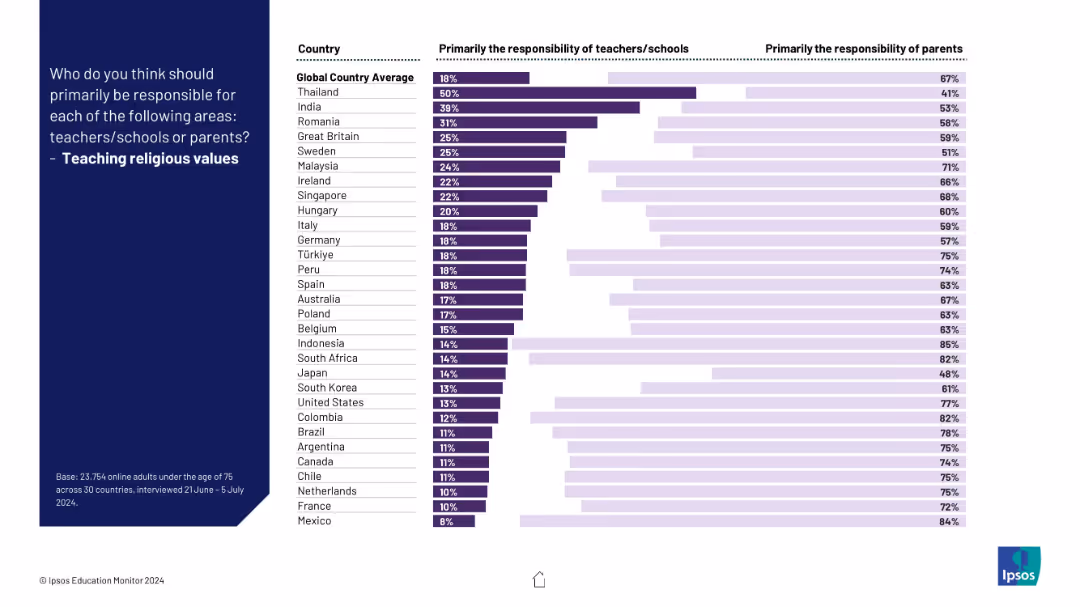
Dual horizontal bar chart comparing "teachers/schools" vs. "parents" responsibility across countries; text panel on left and Ipsos branding bottom-right.
Human Resources and Talent Management
Education & Training
This slide shows survey results from 30 countries on who should primarily teach religious values—schools or parents. Most respondents favored parents, with significant variation by country.
education, religion, values, parents, schools, survey, Ipsos, comparison, responsibility, global data
false
Human Resources and Talent Management
Education & Training
Mixed Chart
IPSOS
Add to my slides
Remove from favorites
Comparative column charts detailing perceptions of ROI on different educational degrees among Gen Z students.
Market Analysis and Trends
Education & Training
Compares the perceived value and ROI of four-year degrees versus associates’ degrees among different student demographics.
education, ROI, Gen Z, degree value, student perceptions
false
Market Analysis and Trends
Education & Training
Multiple Chart
BCG
Add to my slides
Remove from favorites
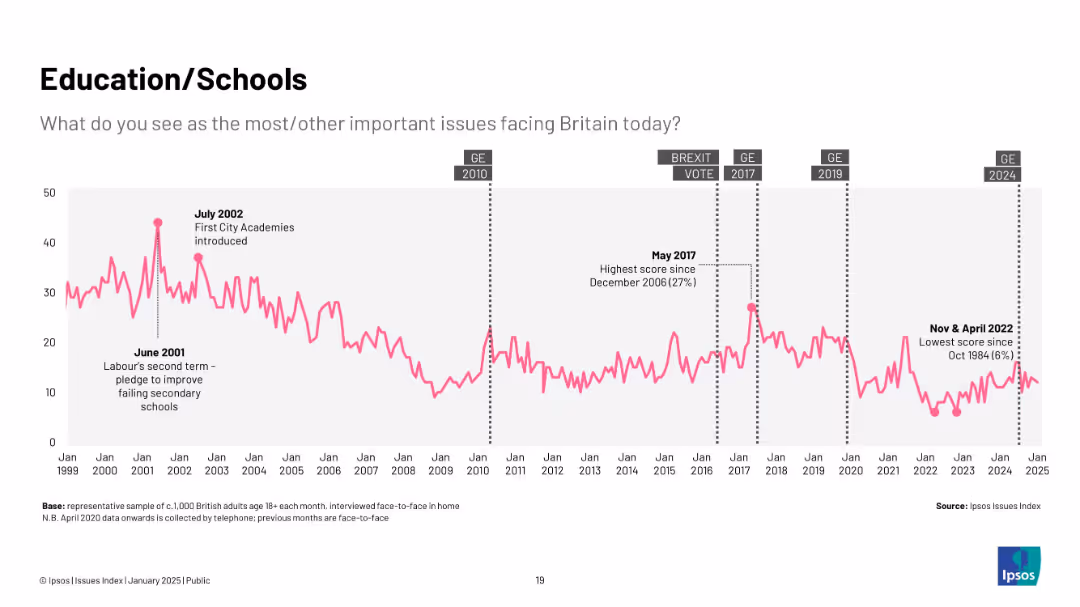
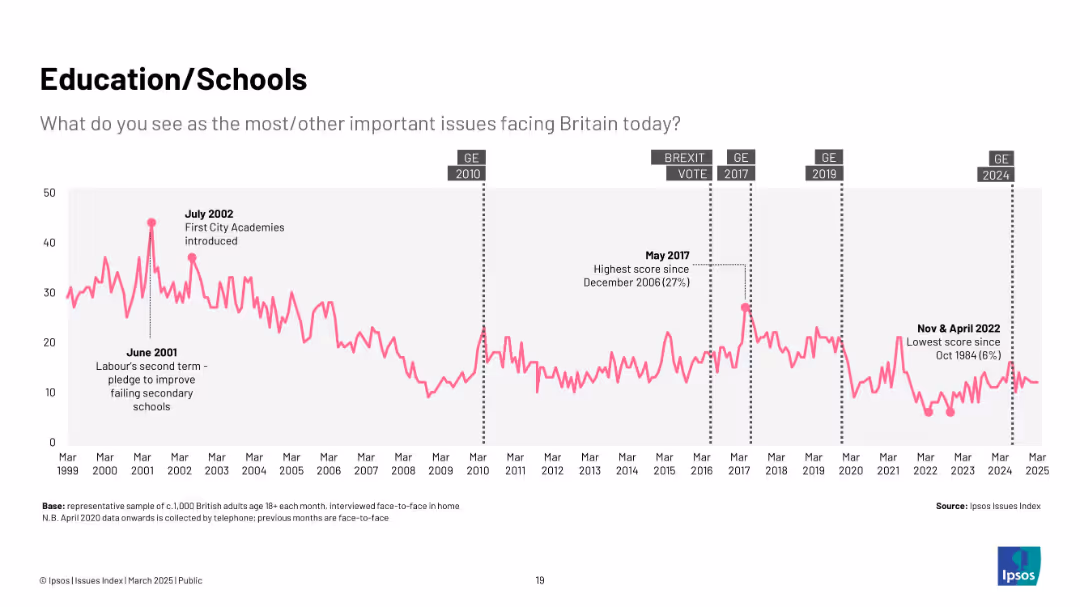
Pink line chart spanning 1999–2025; fluctuations annotated with policy shifts and education reforms (e.g., academies, pledges); visual grid consistent.
Human Resources and Talent Management
Education & Training
Tracks concern over education quality and schooling, highlighting notable rises in 2002 and 2017, with record lows in 2022.
education, schools, policy, UK, Ipsos, public concern, schooling trends
false
Human Resources and Talent Management
Education & Training
Single Chart
IPSOS
Add to my slides
Remove from favorites
Pink line graph from 1999–2025, highlighting key education reforms and concern levels.
Market Analysis and Trends
Education & Training
Displays changing public concern about education, with spikes during reforms like the introduction of City Academies. Concern has decreased steadily since 2020.
education, schools, public concern, UK policy, Ipsos, reform, secondary education, Labour government
false
Market Analysis and Trends
Education & Training
Single Chart
IPSOS
Add to my slides
Remove from favorites
A matrix-like table compares characteristics across six different education segments against five attributes. Characteristics are marked with checkmarks, tilde signs, or left blank to indicate presence, partial presence, or absence.
Market Analysis and Trends
Education & Training
This slide categorizes various education segments by their attributes such as revenue visibility and demand-supply dynamics. It aids in assessing the diverse nature of the education market, reflecting on how different segments such as K-12 and vocational education vary in terms of investment characteristics.
Education Segments, Attributes, Comparison, Higher Education, K-12, Vocational, English Language Learning, Transnational
false
Market Analysis and Trends
Education & Training
Table
EY
Add to my slides
Remove from favorites
Horizontal bar chart showing predicted likelihood across countries. Visual format consistent with prior slides.
Regulatory and Compliance
Education & Training
This slide illustrates public sentiment toward banning smartphones in schools by 2025. The Netherlands and Belgium have the highest perceived likelihood, while countries like Japan and Singapore show strong skepticism. The slide reflects varying cultural attitudes toward tech in education.
education, smartphone ban, schools, regulation, public sentiment
false
Regulatory and Compliance
Education & Training
Mixed Chart
IPSOS
Add to my slides
Remove from favorites
Contains column charts showing the potential increase in study hours per week if solar power were widely implemented in Nigerian boarding schools, along with projected academic benefits.
Strategic Planning
Education & Training
Proposes solutions for extending study hours in Nigerian boarding schools through enhanced power supply via solar installations, suggesting a significant uplift in educational outcomes as a result.
education, solar power, Nigeria, boarding schools, study hours, academic benefits, power supply
false
Strategic Planning
Education & Training
Mixed Chart
BCG
Add to my slides
Remove from favorites
Compares the weekly study hours before and after solar power adoption in Nigerian boarding schools, using column charts to visualize the data.
Strategic Planning
Education & Training
Highlights the effectiveness of solar power in increasing study hours at night, presenting data that shows enhanced educational outcomes and improved academic performance among students.
education, solar power, Nigeria, boarding schools, study hours, night studies, academic improvement
false
Strategic Planning
Education & Training
Mixed Chart
BCG
Add to my slides
Remove from favorites
Displays comparative data on the average study hours per week for students in Nigerian boarding schools before and after solar power implementation, using column charts for visual comparison.
Strategic Planning
Education & Training
Evaluates the impact of improved power supply on study hours in Nigerian schools, illustrating a significant increase in study time due to better lighting conditions enabled by solar power, linking this to potential academic performance improvements.
education, solar power, Nigeria, study hours, boarding schools, academic performance, lighting
false
Strategic Planning
Education & Training
Single Chart
BCG
Add to my slides
Remove from favorites
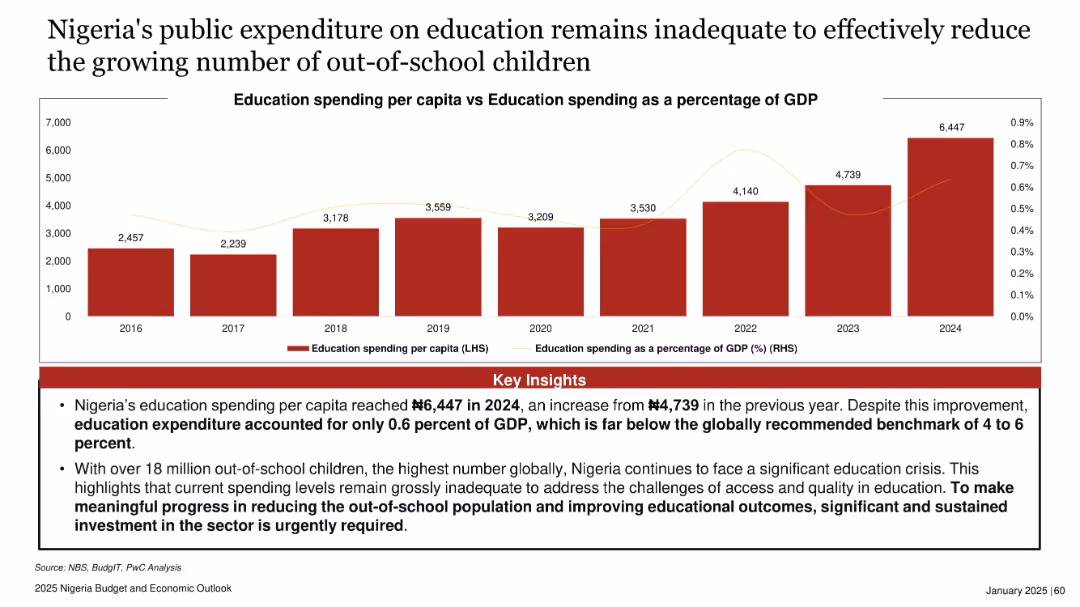
Bar chart showing education spending per capita (2016–2024) and line showing percentage of GDP. Red theme with emphasis on key insights.
Regulatory and Compliance
Education & Training
The slide criticizes Nigeria’s education funding, showing low per capita spending and GDP share. Despite increases, the current levels are far below global benchmarks. With 18 million out-of-school children, major investment is urgently needed.
education, spending, GDP, Nigeria, out-of-school children, budget, policy, 2024 data
false
Regulatory and Compliance
Education & Training
Mixed Chart
PwC/Strategy&
Add to my slides
Remove from favorites
Similar visual to previous slide, showing percentage support by country for increasing education spending (e.g., schools, universities, job training)
Strategic Planning
Government & Public Sector
69% of global respondents favor more education spending. Peru and Indonesia lead in support. This indicates strong global consensus on the value of enhancing education systems and job training.
education, spending, government, public opinion, investment, schools, universities, Ipsos, learning, public services
false
Strategic Planning
Government & Public Sector
Mixed Chart
IPSOS
Add to my slides
Remove from favorites
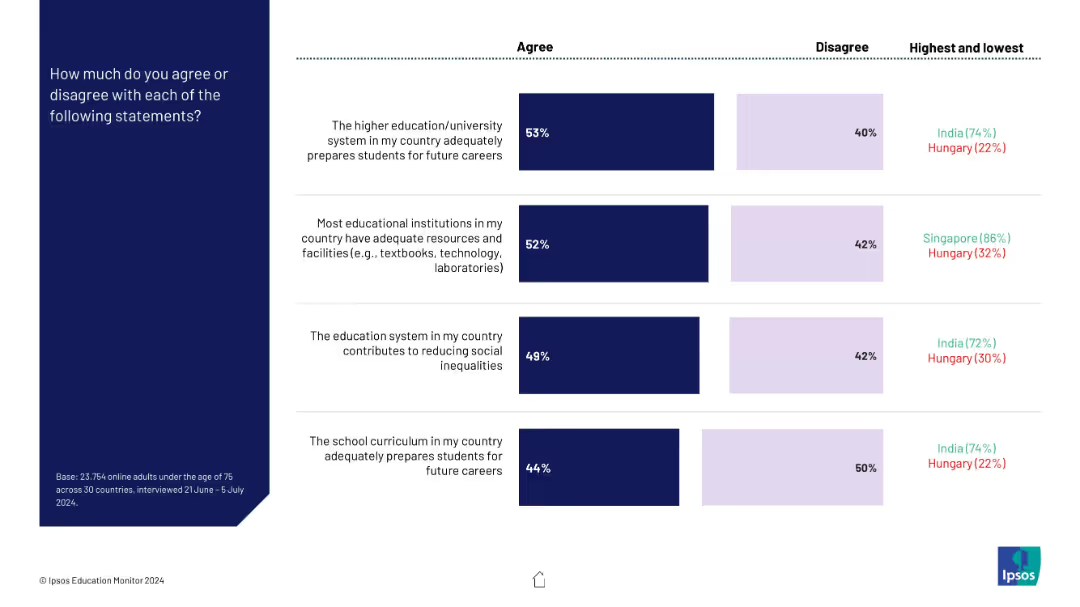
Four horizontal bar charts comparing agreement/disagreement with statements on education systems. Highest and lowest agreement countries shown on the right. Dark blue and light purple represent agree/disagree.
Market Analysis and Trends
Education & Training
This slide displays public sentiment across countries regarding how well national education systems prepare students, provide resources, reduce inequalities, and support future careers. It also shows comparative data by country, highlighting India and Hungary at performance extremes.
education systems, survey data, global comparison, career preparation, inequality, facilities, agreement levels
false
Market Analysis and Trends
Education & Training
Mixed Chart
IPSOS
Add to my slides
Remove from favorites
Previous
Next
You don't have any favorites yet.
Please wait loading your favorites slides...
Create a FREE account to continue browsing
Receive Instant Access to 1,000+ slides from companies like McKinsey, Google, and Goldman Sachs
First Name
Last Name
Email
Password
I agree to all
Terms & Privacy Policy
Thank you! Your submission has been received!
Oops! Something went wrong while submitting the form.
Have an account?
Sign in
Upgrade to PRO to Save slides
Advanced Search and Filters
Access to 15,000+ slides
Access to Category Pages
Save/Bookmark Slides
PowerPoint Template Library
Pick a Plan
MONTHLY
$12/month
Billed every month, Cancel anytime.
YEARLY
$9/year
Billed $108 annually, Cancel anytime.
Checkout for $12/month
Checkout for $108/yr
Secured by Stripe | AES-256 bit encryption


![The [country]’s economy is rigged to advantage the rich and powerful](https://cdn.prod.website-files.com/654e70fb59937215cac87b19/6899bd33bc303b7d94f020c6_nwlLcDaR75EG8HegXhVNafjPdkNrgG9No-hREEHRNyk.avif)


![To what extent do you think the [Country] government should increase or lower its spending... Education](https://cdn.prod.website-files.com/654e70fb59937215cac87b19/6899be61526ac1c44abbc5b6_VFBsdr-7MzDTqwU8S9MsXP1DapOJ_cxRO0rWvFT5kZY.avif)


![Smartphones will be banned from schools in [COUNTRY]](https://cdn.prod.website-files.com/654e70fb59937215cac87b19/6899b947de546b616c79f81e_B5FdFdV9XNzxrCUowEueurmdCkn2sE3KYX0y-yduI74.avif)