My Account
My Slides
Search by Category
Companies
Slide Type
Use Case
Industry
Pricing
Templates
View All Templates
Download Template Slides
✦ AI
AI Prompt Library
AI Search
Feedback
Login
Logout
Get Started
Browse all Slides
Browse all Slides
Create a FREE Account
Instant access to 1,000+ real slides from top companies like McKinsey, BCG, Goldman Sachs, Google and many more!
First Name
Last Name
Email
Password
I agree to all
Terms & Privacy Policy
Thank you! Your submission has been received!
Oops! Something went wrong while submitting the form.
Have an account?
Sign in
Saved Slides
Total No. of slides saved
0
↻ Refresh
✖ Clear all
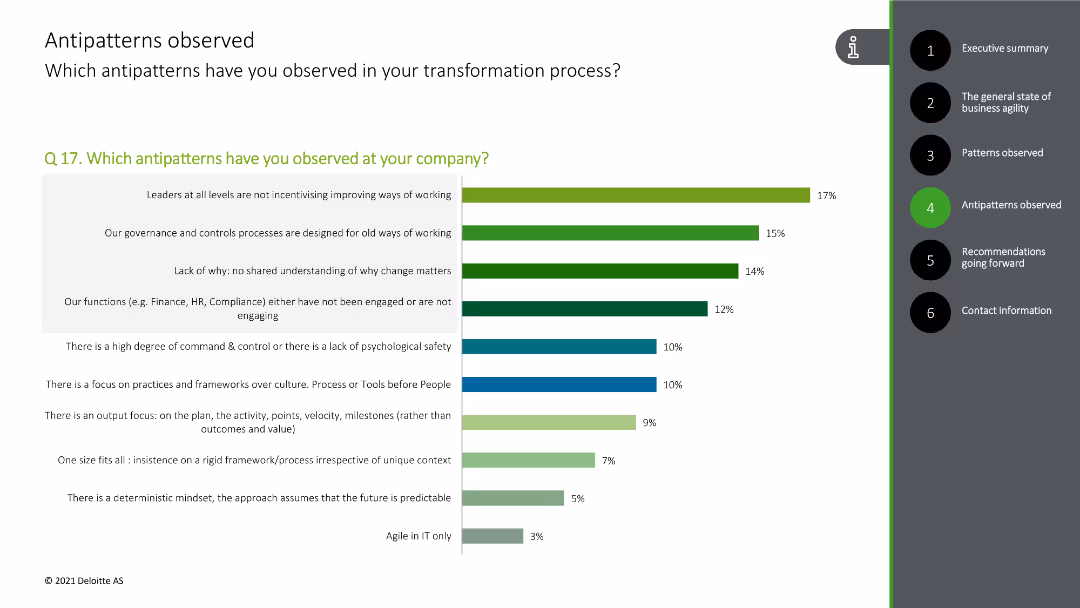
Slide features a bar chart illustrating the main challenges organizations face in their transition to ESG-focused operations. Challenges such as lack of expertise and policy incentives are shown, with bars horizontally displayed.
Risk Assessment and Management
Environmental Services & Sustainability
Highlights the significant barriers to adopting ESG practices within organizations, including gaps in expertise and insufficient governmental support. This insight is crucial for understanding the hurdles that companies must overcome to fully integrate ESG principles into their business strategies.
ESG, challenges, transition, barriers, 2023
false
Risk Assessment and Management
Environmental Services & Sustainability
Single Chart
PwC/Strategy&
Add to my slides
Remove from favorites
A column chart on the slide displays top ESG characteristics included in investment decisions. An image of a green building is on the left.
Market Analysis and Trends
Financial Services
Investigates which ESG characteristics investors consider in their decision-making process, highlighting governance, climate risk, and other factors.
ESG, characteristics, governance, climate risk, investors, investment decisions, green building, analysis
false
Market Analysis and Trends
Financial Services
Mixed Chart
EY
Add to my slides
Remove from favorites
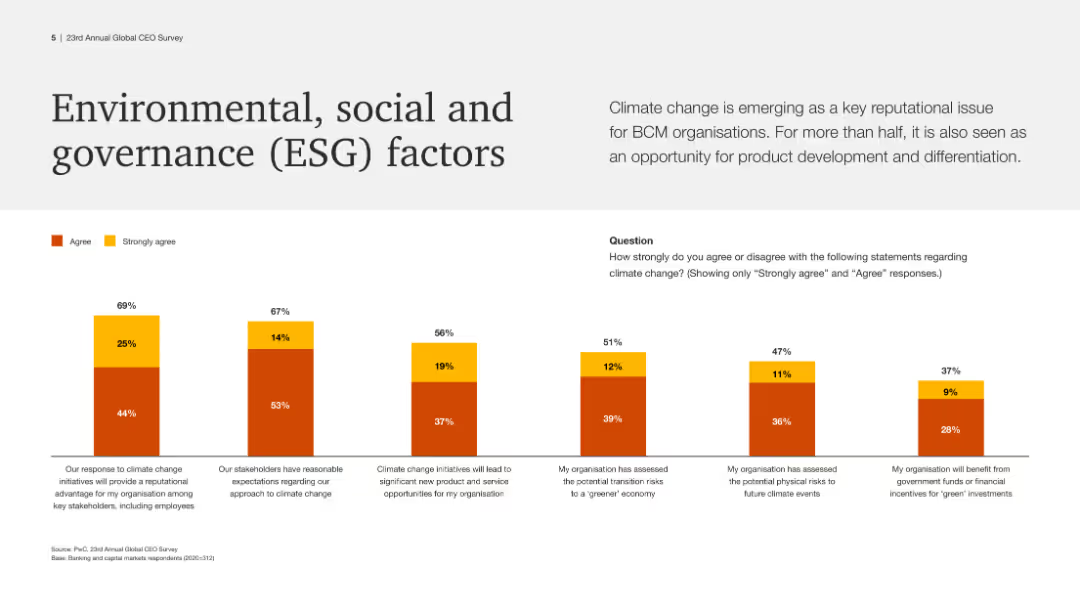
The slide features a white background with a large title at the top. Below, a column chart with orange and yellow bars shows responses to ESG factors.
Risk Assessment and Management
Financial Services
This slide outlines how BCM organizations view ESG factors, with percentages showing the extent of agreement with statements regarding climate change and related policies.
ESG, climate change, BCM, organizations, policies, risks, environment, social, governance
false
Risk Assessment and Management
Financial Services
Mixed Chart
PwC/Strategy&
Add to my slides
Remove from favorites
Features column and line charts comparing emission reduction targets with vibrant colors and a clear title. The layout is complemented by bullet-pointed text and annotations.
Strategic Planning
Environmental Services & Sustainability
Communicates LANXESS's commitment to achieving climate neutrality, detailing their reduction targets and comparing their progress to EU regulations.
ESG, Climate Neutrality, Targets, LANXESS
false
Strategic Planning
Environmental Services & Sustainability
Multiple Chart
Morgan Stanley
Add to my slides
Remove from favorites
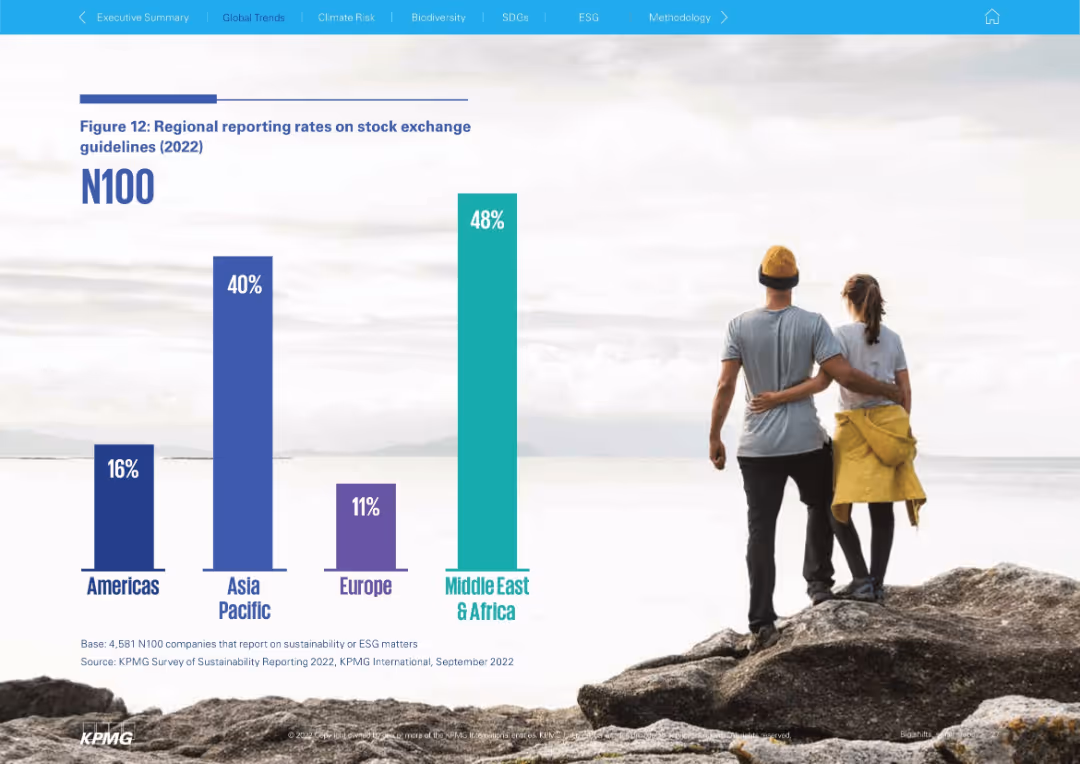
Full-screen vertical bar chart with minimal text and a photo of a couple on a rock background
Regulatory and Compliance
Professional Services
Provides a 2022 regional breakdown of N100 reporting rates based on stock exchange guidelines. Middle East & Africa leads at 48%, followed by Asia Pacific (40%), while Europe and the Americas lag behind.
ESG compliance, stock exchange, N100, Middle East, Asia Pacific, sustainability standards
false
Regulatory and Compliance
Professional Services
Single Chart
KPMG
Add to my slides
Remove from favorites
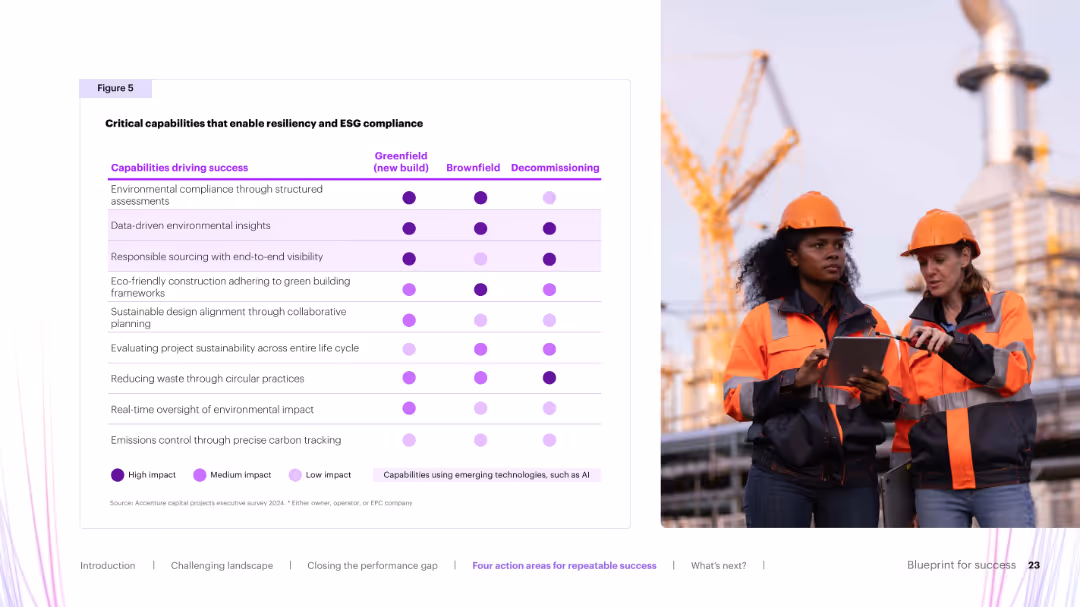
Matrix similar to previous slide but focused on ESG capabilities across project stages. Purple dots denote impact and emerging tech use.
Regulatory and Compliance
Environmental Services & Sustainability
Displays critical ESG-related capabilities and their relevance across project types. Emphasizes high-impact practices like environmental assessments, data-driven insights, and sustainable sourcing. Highlights emerging tech integration.
ESG, compliance, sustainability, data insights, green building
false
Regulatory and Compliance
Environmental Services & Sustainability
Table
Accenture
Add to my slides
Remove from favorites
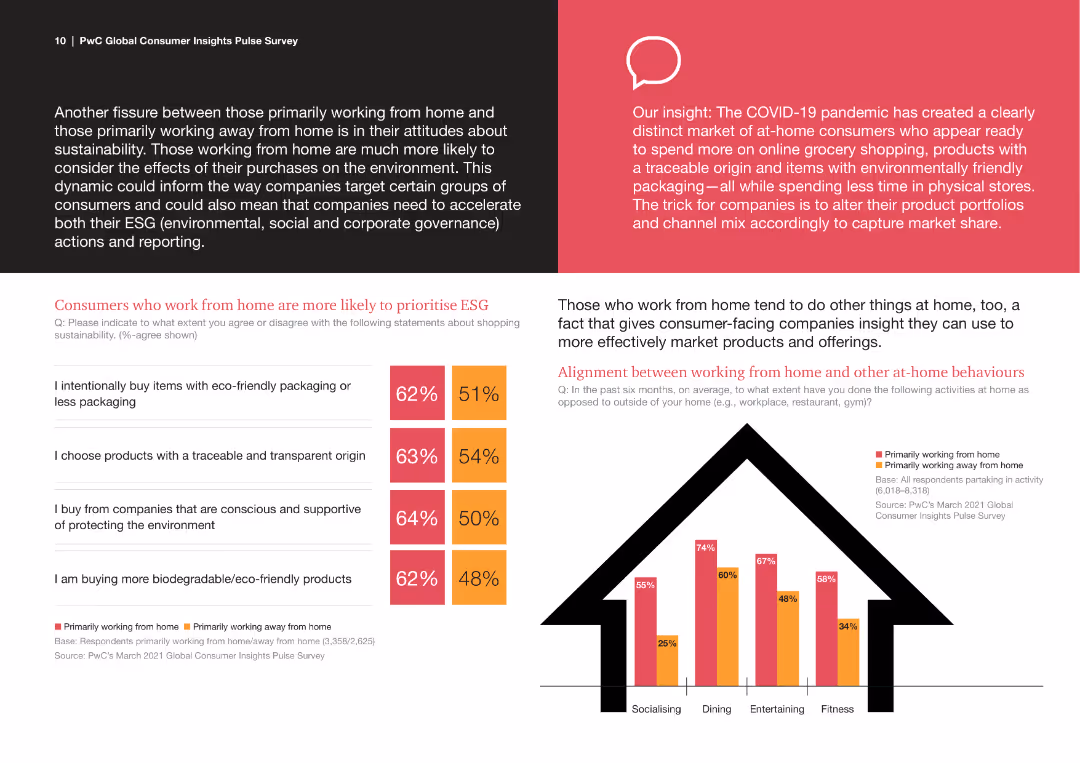
The slide features multiple elements, including text blocks, a column chart, and comparison statistics. The design uses a black background for text and bright colors for charts.
Market Analysis and Trends
Consumer Goods
The slide compares attitudes towards ESG among consumers who work from home vs. those who do not. It includes statistics on eco-friendly purchases and behaviors related to working from home.
ESG, Consumer Behavior, Remote Work, Sustainability, Market Trends
false
Market Analysis and Trends
Consumer Goods
Mixed Chart
PwC/Strategy&
Add to my slides
Remove from favorites
The slide contains a two-column layout listing the contents of the ESG report with sections on insights, clients, and the firm's operations.
Corporate Finance and Valuation
Government & Public Sector
It outlines the contents of McKinsey's ESG Report, detailing sections on company overview, strategy, governance, and key initiatives for sustainable growth.
ESG, Contents, McKinsey, Sustainable Growth, Corporate Strategy, Governance, Report Sections
false
Corporate Finance and Valuation
Government & Public Sector
Agenda
McKinsey
Add to my slides
Remove from favorites
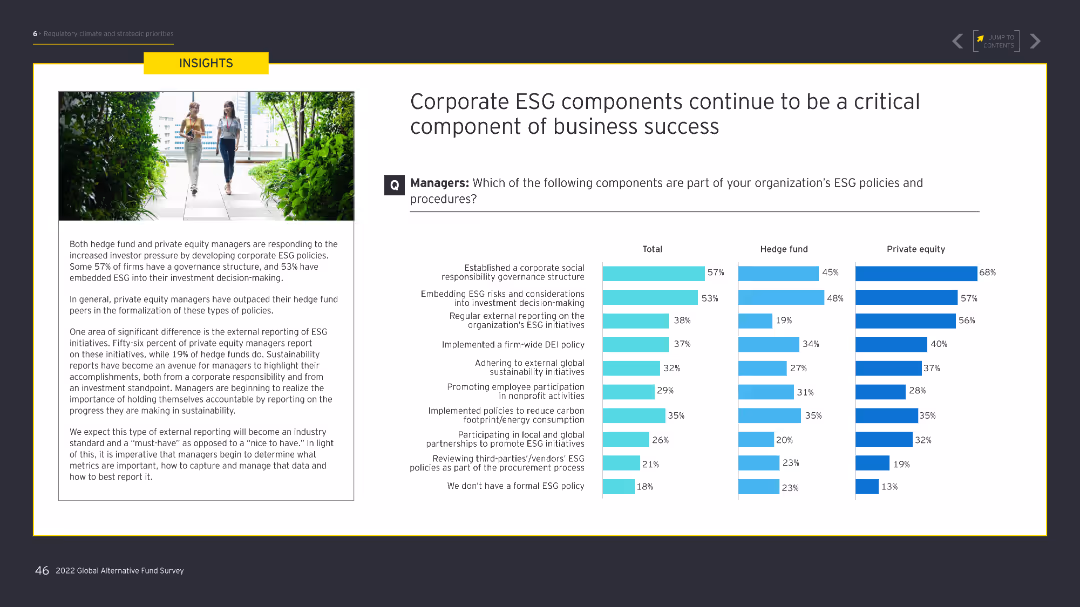
Includes a large image on the left and column charts on the right comparing hedge funds and private equity managers on various ESG policy components.
Regulatory and Compliance
Financial Services
The slide explores the importance of corporate ESG policies, showing how different components are integrated into hedge fund and private equity management practices.
ESG, corporate, business success, hedge funds, private equity
false
Regulatory and Compliance
Financial Services
Multiple Chart
EY
Add to my slides
Remove from favorites
The slide contains text and bar charts analyzing the impact of ESG commitments on business operations and the prevalence of corporate greenwashing.
Regulatory and Compliance
Environmental Services & Sustainability
Discusses the importance of ESG (Environmental, Social, and Governance) performance, its impact on business operations, and the risks of corporate greenwashing.
ESG, corporate responsibility, greenwashing, business impact, regulatory compliance
false
Regulatory and Compliance
Environmental Services & Sustainability
Multiple Chart
IPSOS
Add to my slides
Remove from favorites
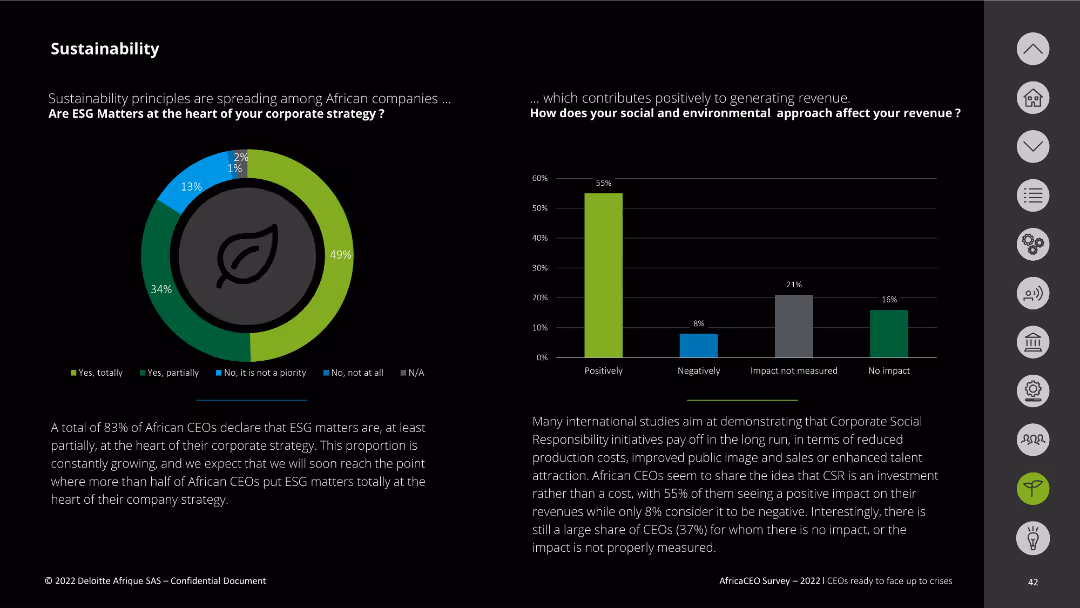
This slide includes a donut chart and a vertical bar chart. It displays data on the importance of ESG matters in corporate strategies and their impact on revenue.
Corporate Finance and Valuation
Environmental Services & Sustainability
The slide highlights how ESG matters are becoming integral to corporate strategies among African CEOs and their positive effects on revenue.
ESG, corporate strategy, revenue impact, sustainability, African CEOs
false
Corporate Finance and Valuation
Environmental Services & Sustainability
Multiple Chart
Deloitte
Add to my slides
Remove from favorites
Three main sections with icons and brief bullet points illustrate the company's commitment to Environmental, Social, and Governance (ESG) principles. Clear and straightforward layout with a balance of text and graphics.
Regulatory and Compliance
Financial Services
Slide illustrates company values in ESG, demonstrating the initiatives and achievements in social responsibility. Could be used to underscore the ethical framework and operational philosophy of the company.
ESG, corporate values, social responsibility, governance, sustainability
false
Regulatory and Compliance
Financial Services
Pillar
Goldman Sachs
Add to my slides
Remove from favorites
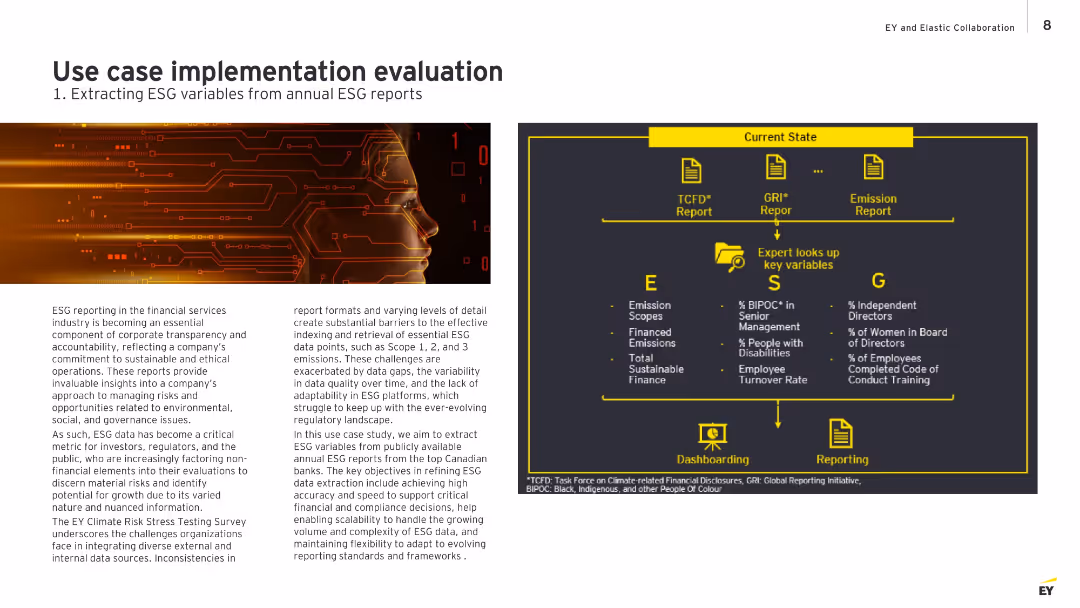
Split layout with left side showing a digital face illustration and descriptive text; right side contains an infographic with current ESG report structure, expert lookup, and dashboard/reporting flow.
Technology and Digital Transformation
Financial Services
Describes the challenge of ESG data extraction from inconsistent report formats and highlights EY's approach to improve efficiency and accuracy in extracting key ESG variables using structured reports from top Canadian banks. It outlines the manual process experts follow and the intended transition to a digital, scalable solution.
ESG, data extraction, financial reports, compliance, automation, sustainability, EY
false
Technology and Digital Transformation
Financial Services
Diagram
EY
Add to my slides
Remove from favorites
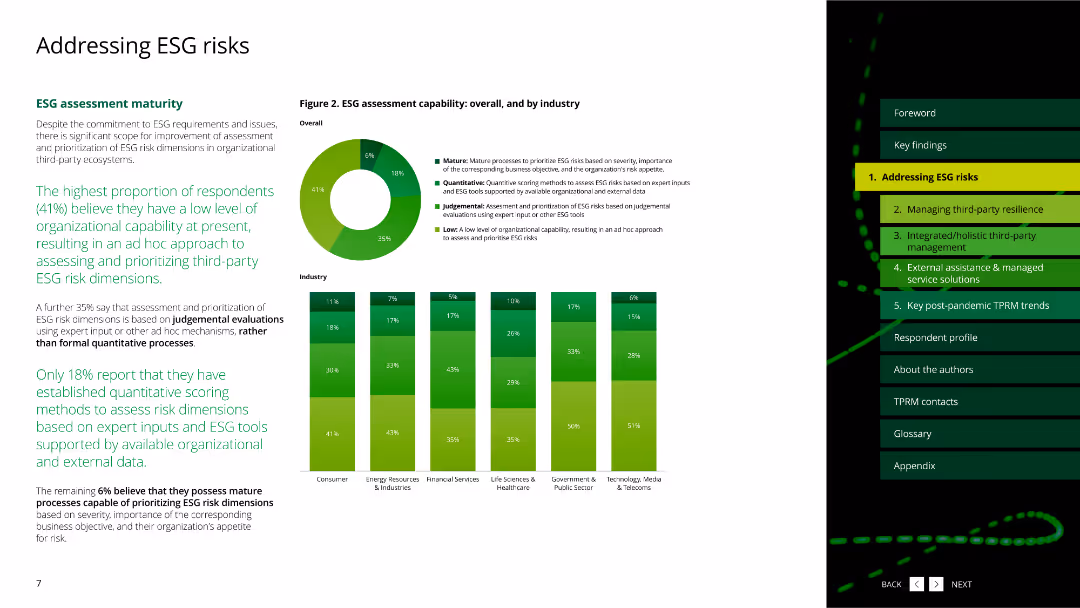
The slide includes column charts displaying ESG dimensions managed by respondents.
Risk Assessment and Management
Environmental Services & Sustainability
This slide highlights the quality of data used for managing and reporting ESG risks across various industries.
ESG, data quality, reporting, dimensions, industries
false
Risk Assessment and Management
Environmental Services & Sustainability
Multiple Chart
Deloitte
Add to my slides
Remove from favorites
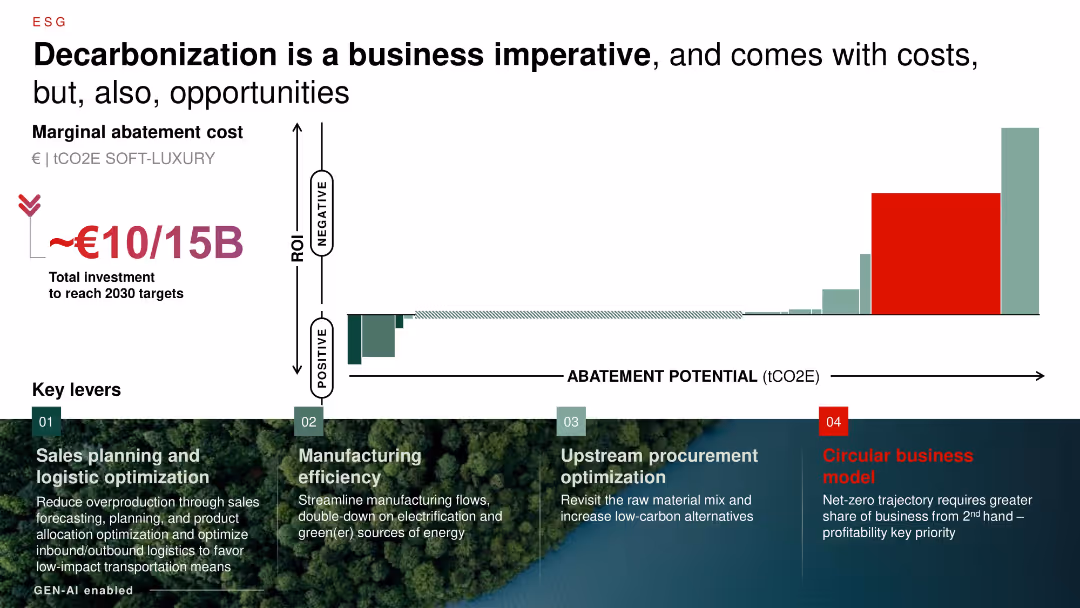
Bar chart showing marginal abatement costs (horizontal axis), ROI (vertical axis), and total investment; green/eco-themed visual section at bottom with 4 levers.
Regulatory and Compliance
Environmental Services & Sustainability
Emphasizes need for €10–15B investment in soft luxury sector to reach 2030 decarbonization targets. Highlights levers such as logistics, manufacturing, procurement, and circular business models. ROI varies with abatement potential.
ESG, decarbonization, investment, abatement, circular economy, manufacturing, logistics
false
Regulatory and Compliance
Environmental Services & Sustainability
Mixed Chart
Bain
Add to my slides
Remove from favorites
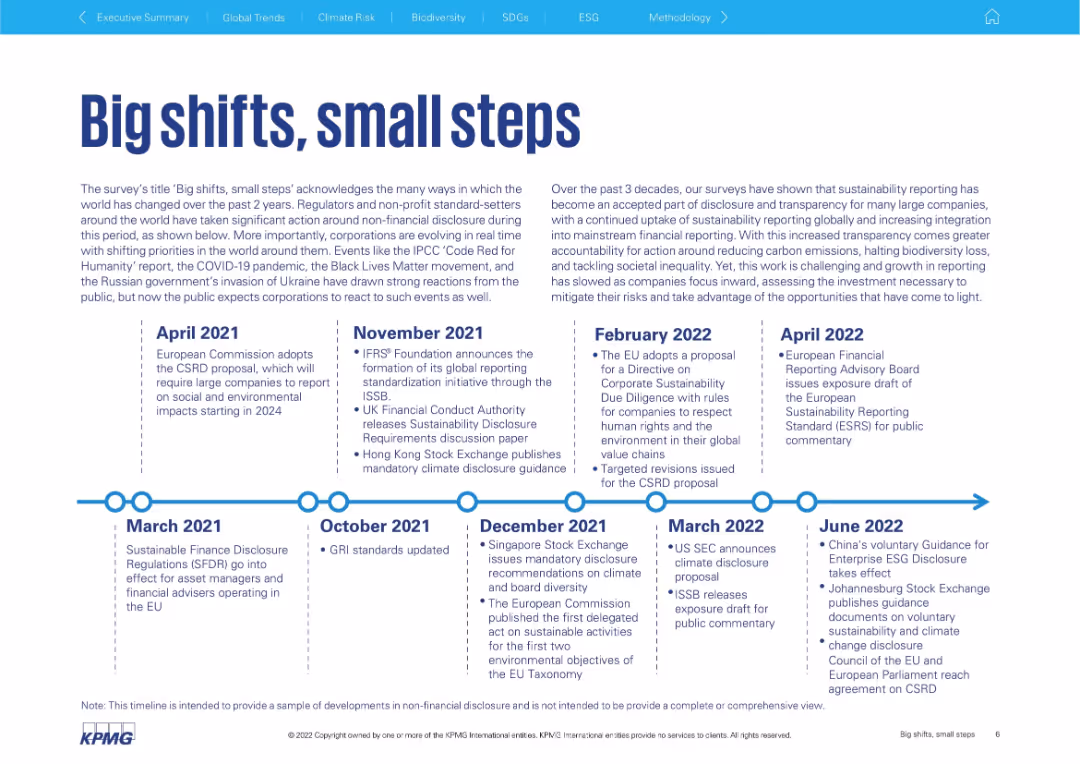
Horizontal timeline with text boxes summarizing major ESG policy/regulatory events from 2021 to 2022.
Regulatory and Compliance
Government & Public Sector
Summarizes regulatory and policy milestones impacting corporate sustainability disclosures from 2021–2022. Highlights actions by the EU, UK, ISSB, and other governing bodies. Supports the idea that corporations must adapt to evolving environmental and social disclosure mandates.
ESG, disclosure, regulation, corporate reporting, timeline, sustainability policy, compliance, EU, ISSB
false
Regulatory and Compliance
Government & Public Sector
Linear Flow
KPMG
Add to my slides
Remove from favorites
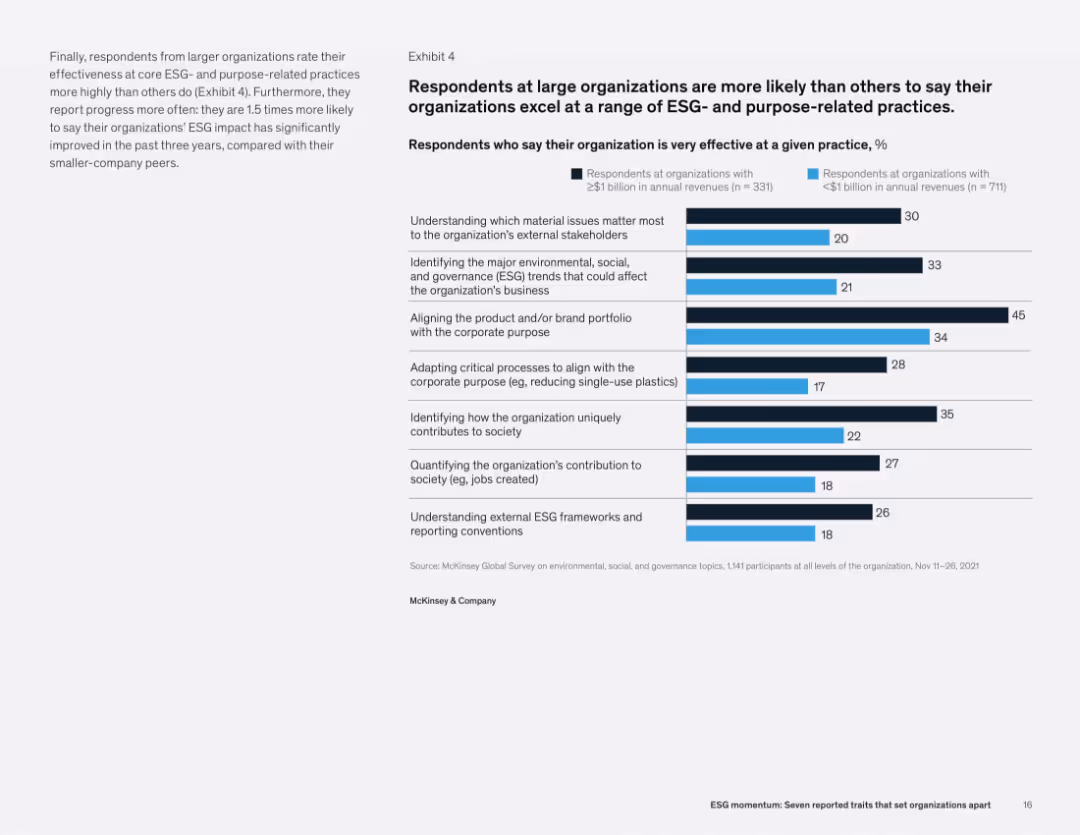
Text on left, and a bar chart on right showing how effective large vs. small organizations are at ESG practices like alignment, contribution tracking, and stakeholder engagement.
Operational Efficiency
Professional Services
Larger organizations report significantly higher effectiveness in various ESG practices, including stakeholder engagement, brand alignment with purpose, and trend identification. The data suggests a broader and more integrated ESG strategy in large firms.
ESG effectiveness, organizational practices, purpose alignment, stakeholder engagement, corporate strategy
false
Operational Efficiency
Professional Services
Mixed Chart
McKinsey
Add to my slides
Remove from favorites
Slide features a central graphic summarizing ESG commitments with icons and lists around it, highlighting different aspects of ESG initiatives.
Regulatory and Compliance
Environmental Services & Sustainability
Showcases Permian Resources' dedication to ESG through various initiatives like minimizing impact, reducing emissions, and ensuring diversity and inclusion, aiming at holistic ESG excellence.
ESG, environmental impact, emissions reduction, diversity, shareholder alignment, community benefit
false
Regulatory and Compliance
Environmental Services & Sustainability
Framework
Barclays
Add to my slides
Remove from favorites
A visually balanced slide with text sections and a central infographic illustrating the organization's strategy. The graphic is divided into three main areas, each with concise bullet points.
Strategic Planning
Government & Public Sector
The slide presents a strategic framework focusing on environmental, social, and governance aspects. It could be utilized to communicate a firm’s comprehensive strategy for sustainable and inclusive growth.
ESG, Environmental, Social, Governance, Strategy, Sustainable Growth
false
Strategic Planning
Government & Public Sector
Framework
McKinsey
Add to my slides
Remove from favorites
The layout is split into three sections for environment, social, and governance, each with bullet points and icons. At the bottom, there's a section with key FY19 highlights and corresponding icons.
Regulatory and Compliance
Financial Services
Showcases Macquarie's ESG commitment and achievements, outlining key principles, initiatives, and FY19 highlights, important for stakeholder engagement and showcasing corporate responsibility.
ESG, environment, social, governance, sustainability, corporate responsibility, Macquarie
false
Regulatory and Compliance
Financial Services
Table
Goldman Sachs
Add to my slides
Remove from favorites
The slide features a column chart with annotations, and two iconographic bullet points. Red and grey are the primary colors used in the graphics.
Financial Performance
Financial Services
The slide outlines Leonardo's ESG-linked financial sources, including transactions and key performance indicators aligned with the company's strategy and long-term plans. It emphasizes sustainability in finance.
ESG, finance, sustainability, KPI, funding, credit facility, term loan, CO2 emissions reduction, STEM employment
false
Financial Performance
Financial Services
Mixed Chart
Goldman Sachs
Add to my slides
Remove from favorites
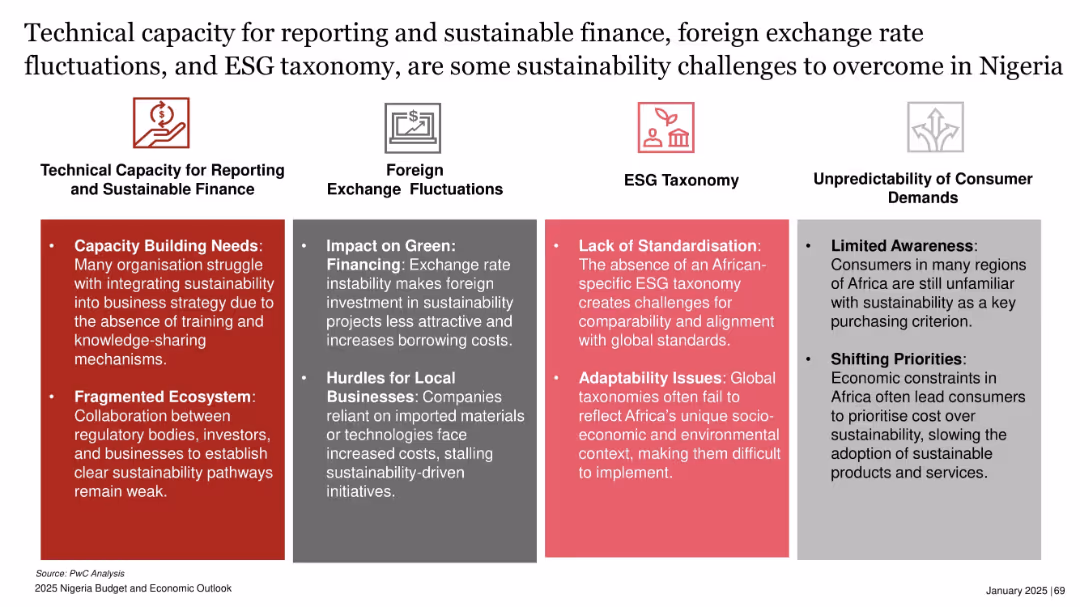
Multi-column layout with four categories, each with color-coded headers and bullet point issues
Regulatory and Compliance
Environmental Services & Sustainability
The slide outlines four main challenges to sustainability in Nigeria: weak technical capacity, exchange rate instability, lack of ESG standardization, and unpredictable consumer demand. Each category lists specific issues impacting green financing, reporting, and adoption of sustainable practices.
ESG, finance, sustainability, Nigeria, green financing, reporting, taxonomy, exchange rate
false
Regulatory and Compliance
Environmental Services & Sustainability
Pillar
PwC/Strategy&
Add to my slides
Remove from favorites
Presents a balanced text and image slide highlighting investor attitudes towards ESG priorities within companies. Uses iconography and a focused layout for the effective presentation of information.
Regulatory and Compliance
Financial Services
Explores the decreasing focus of investors on ESG agendas in favor of financial health, relevant for discussions on corporate governance and sustainable investing strategies.
ESG, Financial Health, Investor Focus, Corporate Governance, Sustainable Investing, Risk Management, Environmental Policy, Social Responsibility, Governance Standards, Long-term Strategy
false
Regulatory and Compliance
Financial Services
Text Only
BCG
Add to my slides
Remove from favorites
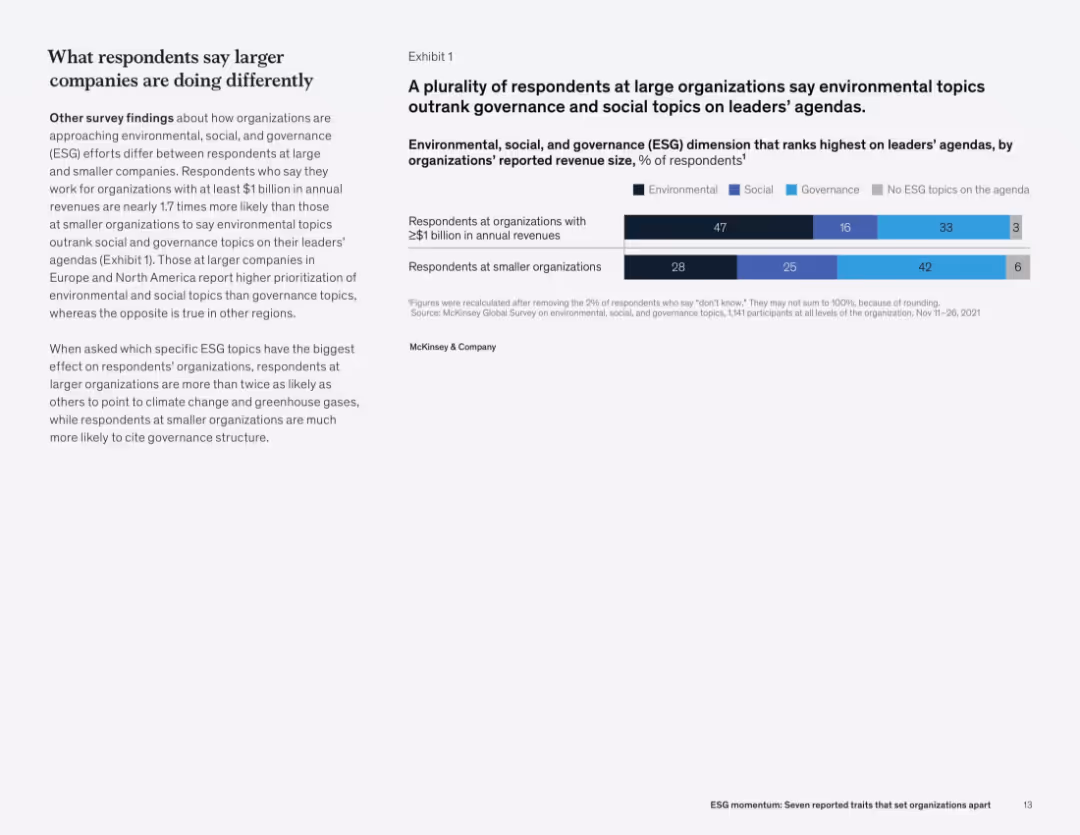
Two-column layout: left side contains text and analysis, right side presents a horizontal stacked bar chart segmented by organization size and ESG topic category.
Market Analysis and Trends
Professional Services
This slide shows that large organizations prioritize environmental issues on leadership agendas more than governance or social topics. Smaller organizations focus more on governance. This distinction is influenced by company size and region, with climate issues more prevalent at large firms.
ESG focus, environmental issues, governance, company size, leadership agenda, survey, revenue, McKinsey
false
Market Analysis and Trends
Professional Services
Mixed Chart
McKinsey
Add to my slides
Remove from favorites
Slide includes a column chart showing funding channels for ESG projects, like internal cash flow and green bonds. The chart is vertical and color-coded to differentiate between 2022 and 2023, indicating shifts in funding preferences over time.
Financial Performance
Environmental Services & Sustainability
Focuses on the financing strategies companies are adopting for ESG projects, particularly the increasing reliance on internal funding in response to higher interest rates and tighter credit markets. This shift underscores the practical aspects of funding sustainable initiatives amid broader economic pressures.
ESG, funding, finance, green bonds, 2023
false
Financial Performance
Environmental Services & Sustainability
Single Chart
PwC/Strategy&
Add to my slides
Remove from favorites
Displays a pie chart and a bar chart illustrating the role and focus on ESG within GBS organizations, detailing specific areas like social responsibility and ESG process support.
Regulatory and Compliance
Environmental Services & Sustainability
Highlights the extent and manner in which GBS organizations are integrating ESG into their operational and strategic frameworks.
ESG, GBS, social responsibility, sustainability, strategic integration
false
Regulatory and Compliance
Environmental Services & Sustainability
Multiple Chart
Deloitte
Add to my slides
Remove from favorites
This slide uses a flow chart with dotted and solid lines to connect various committees and operational elements. Icons and color coding categorize the ESG components like governance and environment.
Strategic Planning
Industrial & Manufacturing
The slide conveys how Michelin embeds ESG awareness and oversight within its governance, outlining the roles of different committees and operational groups. It is likely used to demonstrate the company's commitment to ESG principles.
ESG, Governance, Committees, Operations, Ethics, Environment
false
Strategic Planning
Industrial & Manufacturing
Diagram
Morgan Stanley
Add to my slides
Remove from favorites
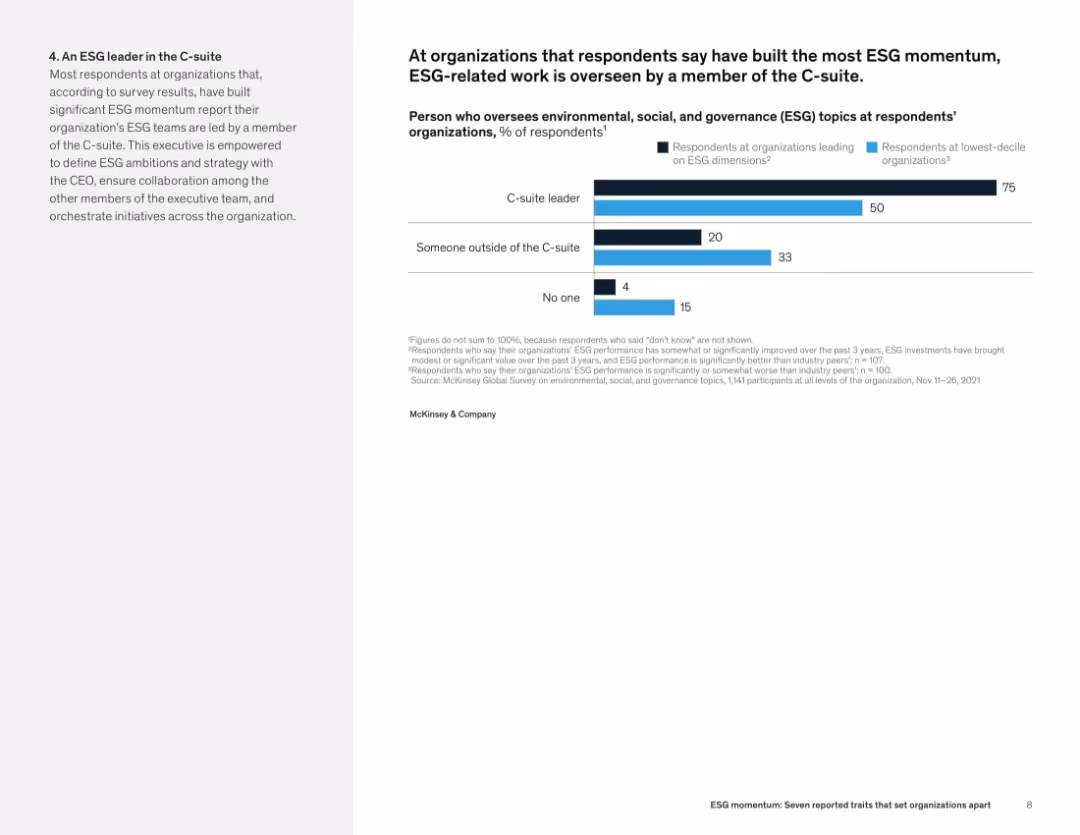
Left-aligned text alongside a horizontal bar chart showing who manages ESG at leading vs. lagging organizations.
Organizational Structure and Change
Professional Services
This slide indicates that C-suite leadership is a hallmark of high-performing ESG organizations. 75% of such firms have ESG led by C-level executives, compared to just 50% of bottom performers. The data suggests that senior oversight enhances ESG outcomes.
ESG governance, executive leadership, C-suite, organizational structure, ESG performance, oversight roles
false
Organizational Structure and Change
Professional Services
Mixed Chart
McKinsey
Add to my slides
Remove from favorites
Diagram-centric slide with a detailed circular infographic illustrating the governance structure for ESG topics, complemented by text explanations.
Regulatory and Compliance
Environmental Services & Sustainability
It explains the governance mechanism in place for ESG matters within the company, detailing roles from the Board to specialized committees.
ESG, Governance, Structure, Management, Oversight
false
Regulatory and Compliance
Environmental Services & Sustainability
Diagram
Booz Allen Hamilton
Add to my slides
Remove from favorites
The slide is divided into sections with each key message presented in a colored box containing icons and brief text, making the information clear and visually segmented.
Regulatory and Compliance
Environmental Services & Sustainability
Summarizes the pivotal findings of the survey, emphasizing high priorities like ESG remaining a top agenda, the need for a common taxonomy for ESG reporting, and the necessity of updating tax policies to foster a better environment for green finance.
ESG, Green finance, Tax policies, Reporting, Market maturity
false
Regulatory and Compliance
Environmental Services & Sustainability
Pillar
PwC/Strategy&
Add to my slides
Remove from favorites
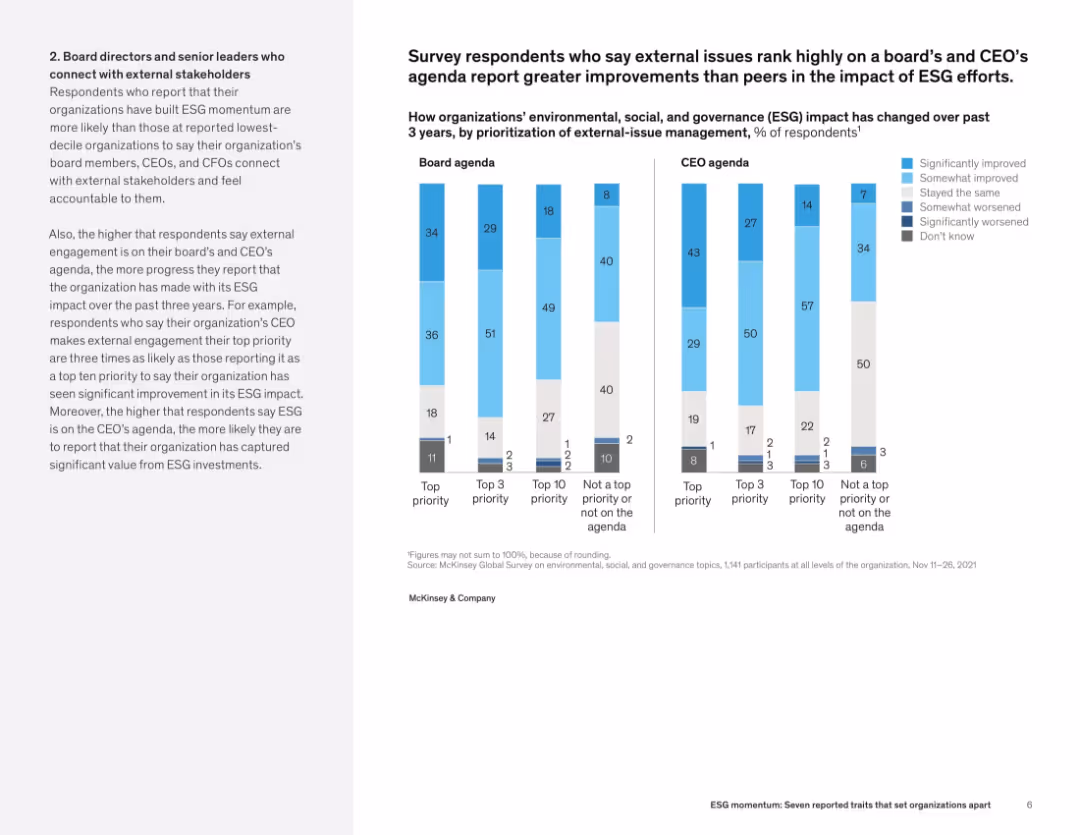
Left-aligned narrative with side-by-side vertical bar charts comparing ESG improvements based on board and CEO prioritization.
Human Resources and Talent Management
Professional Services
This slide links ESG success with the prioritization of external issues on leadership agendas. Organizations with high board and CEO ESG focus report significantly better ESG impact outcomes. Charts compare performance across four priority levels.
ESG impact, board leadership, CEO agenda, organizational outcomes, external engagement, ESG prioritization
false
Human Resources and Talent Management
Professional Services
Mixed Chart
McKinsey
Add to my slides
Remove from favorites
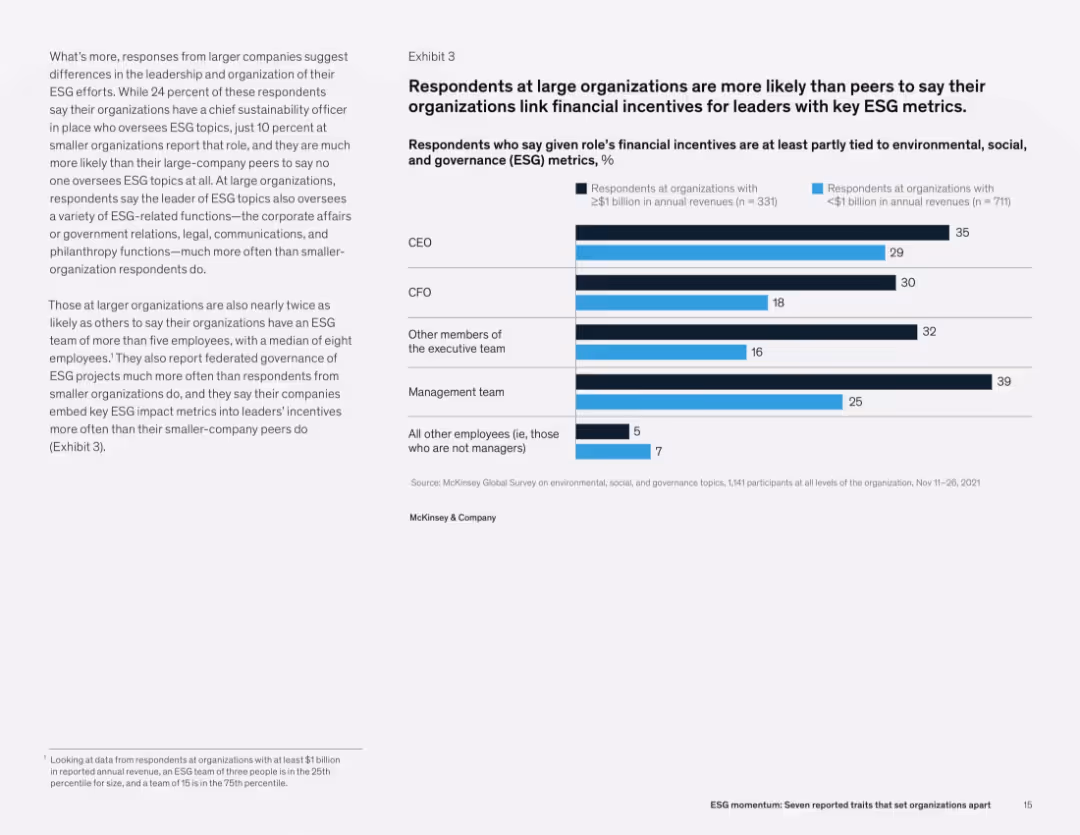
Split layout with explanatory text on left and bar chart on right comparing incentive ties by role across large vs. small organizations.
Human Resources and Talent Management
Professional Services
This slide highlights that large organizations are more likely to link ESG metrics to leadership financial incentives compared to smaller ones. This includes executives and management teams, reinforcing ESG's institutional importance in larger firms.
ESG incentives, leadership, company size, HR strategy, executive compensation, McKinsey, survey
false
Human Resources and Talent Management
Professional Services
Mixed Chart
McKinsey
Add to my slides
Remove from favorites
The slide includes text on the left describing the ESG Champions initiative and a timeline at the bottom showing the ESG Champion process in Croatia, with five steps from application to publication and feedback. An image of wind turbines is on the right.
Strategic Planning
Environmental Services & Sustainability
The slide introduces the ESG Champions initiative, a program to assess companies' ESG maturity across environmental, social, and governance dimensions. It details the timeline for the initiative's process in Croatia, from data collection to publication of results.
ESG, initiative, champions, assessment, timeline
false
Strategic Planning
Environmental Services & Sustainability
Linear Flow
Kearney
Add to my slides
Remove from favorites
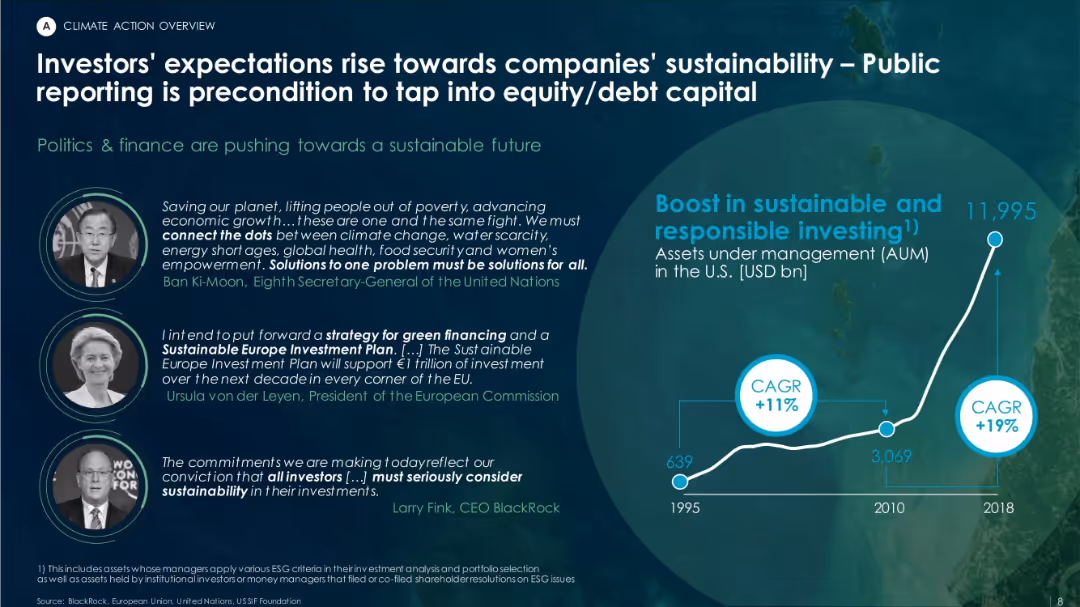
Two-column layout with political/financial quotes on the left and a sharp upward trend chart of sustainable AUM in the U.S. on the right.
Corporate Finance and Valuation
Environmental Services & Sustainability
Highlights increasing investor demand for sustainability transparency. Supported by quotes from global leaders, the chart shows U.S. AUM in sustainable investing rising from $639B in 1995 to nearly $12T in 2018.
ESG investing, public reporting, AUM, sustainable finance, investor pressure, green finance
false
Corporate Finance and Valuation
Environmental Services & Sustainability
Mixed Chart
Roland Berger
Add to my slides
Remove from favorites
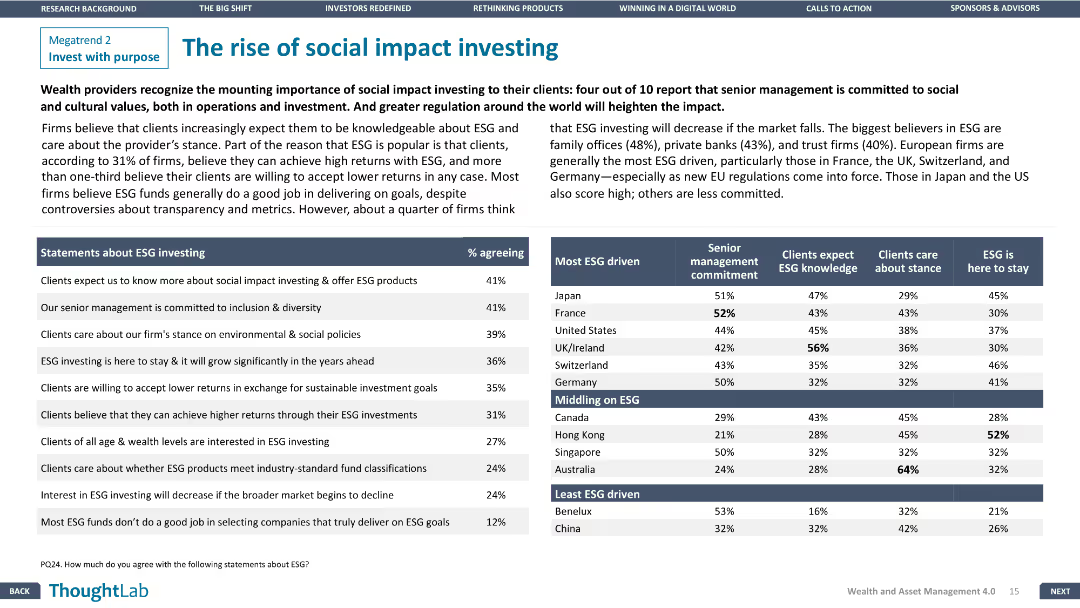
The slide features a column chart with statements about ESG investing and a table comparing regions on ESG criteria.
Investment Analysis
Financial Services
The slide examines the increasing importance of ESG investing, highlighting regional differences and investor expectations.
ESG investing, Social impact, Financial Services, Investment, Regional comparison
false
Investment Analysis
Financial Services
Table
Deloitte
Add to my slides
Remove from favorites
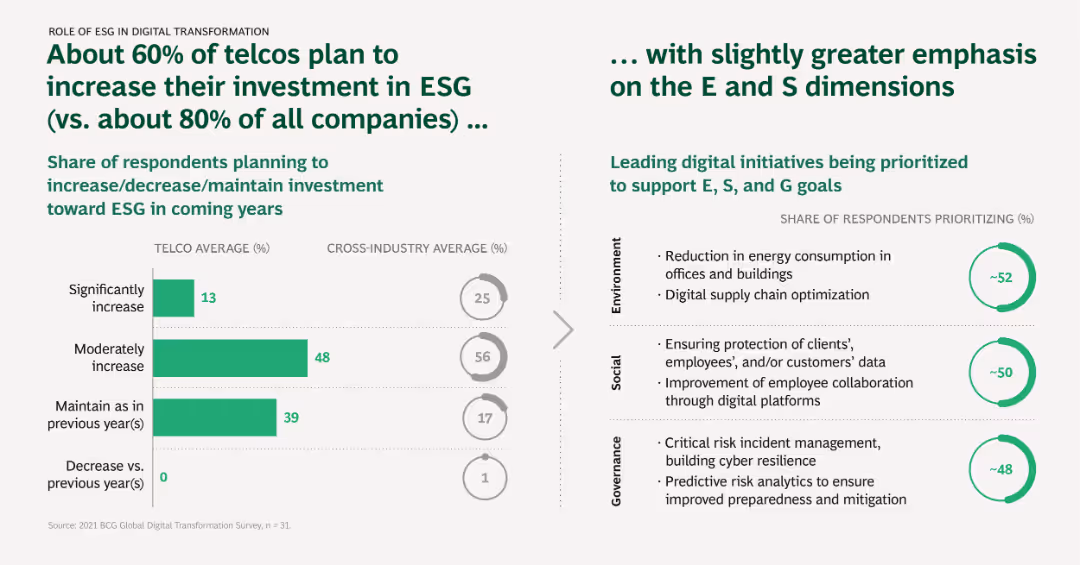
Horizontal bar chart showing telcos' planned investments in ESG (Environmental, Social, Governance) initiatives, comparing telco average to cross-industry average.
Regulatory and Compliance
Telecommunications
This slide illustrates the emphasis telcos place on ESG investments, highlighting environmental, social, and governance initiatives being prioritized to support ESG goals.
ESG investment, Environmental initiatives, Social initiatives, Governance, Digital transformation
false
Regulatory and Compliance
Telecommunications
Multiple Chart
BCG
Add to my slides
Remove from favorites
The slide includes a mix of pie charts and bar graphs showing the impact of societal and environmental changes on companies and their ESG strategies.
Regulatory and Compliance
Environmental Services & Sustainability
The slide examines the impact of societal and environmental changes on companies and their ESG strategies, with data on current and future ESG plans.
ESG, investment, societal changes, environmental impact, governance
false
Regulatory and Compliance
Environmental Services & Sustainability
Multiple Chart
EY
Add to my slides
Remove from favorites
The slide presents a pie chart comparing the levels of ESG investment planned by organizations for 2023 versus 2022. The chart uses color distinctions to show changes in investment strategies, such as increases or decreases.
Investment Analysis
Environmental Services & Sustainability
Analyzes trends in corporate ESG investment, highlighting a cautious approach in the wake of economic challenges. It indicates shifts in corporate spending on sustainability initiatives, providing insights into how businesses plan to navigate financial uncertainties while still prioritizing ESG goals.
ESG, investment, trends, corporate spending, 2023
false
Investment Analysis
Environmental Services & Sustainability
Multiple Chart
PwC/Strategy&
Add to my slides
Remove from favorites
The slide includes a pie chart on investor requirements for ESG solutions and an image of professionals outdoors with solar panels.
Market Analysis and Trends
Financial Services
Examines investor demand for ESG solutions, focusing on governance and climate risk, and details the percentage of investors required to invest in socially responsible products.
ESG, investor demand, governance, climate risk, socially responsible, investment, solar panels, professionals, analysis
false
Market Analysis and Trends
Financial Services
Mixed Chart
EY
Add to my slides
Remove from favorites
The slide contains four doughnut charts illustrating attitudes towards ESG risks and opportunities among investors. Accompanied by bullet points, each chart is encircled by a yellow ring indicating percentage agreement. The slide's background is white with minimal design elements to emphasize the data.
Market Analysis and Trends
Financial Services
This slide evaluates the economic impacts and challenges related to ESG (Environmental, Social, and Governance) factors in investment decisions. It highlights that a significant percentage of investors consider ESG risks important and expect companies to integrate ESG targets into executive pay, despite potential impacts on short-term profitability.
ESG, Investors, Risks, Opportunities, Executive Pay, Profitability, Doughnut Chart
false
Market Analysis and Trends
Financial Services
Multiple Chart
PwC/Strategy&
Add to my slides
Remove from favorites
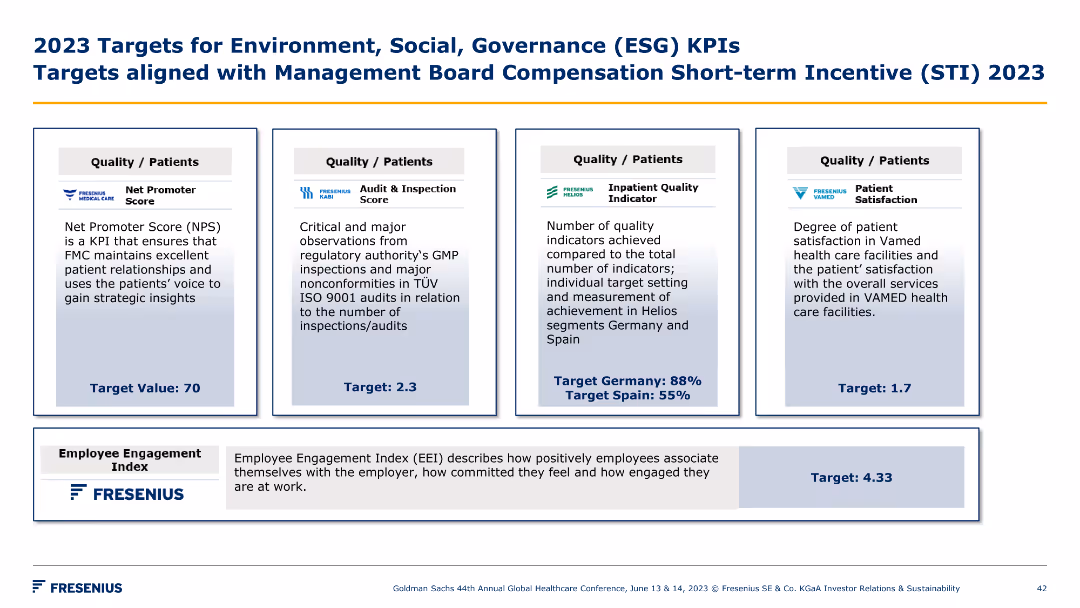
A detailed table presenting ESG KPI targets for 2023, including Net Promoter Score, Audit & Inspection Score, Inpatient Quality Indicator, and Employee Engagement Index.
Operational Efficiency
Environmental Services & Sustainability
The slide outlines Fresenius's 2023 targets for ESG KPIs, aligned with management board compensation, covering patient quality, inspection scores, and employee engagement.
ESG, KPIs, targets, governance, quality, engagement
false
Operational Efficiency
Environmental Services & Sustainability
Pillar
Goldman Sachs
Add to my slides
Remove from favorites
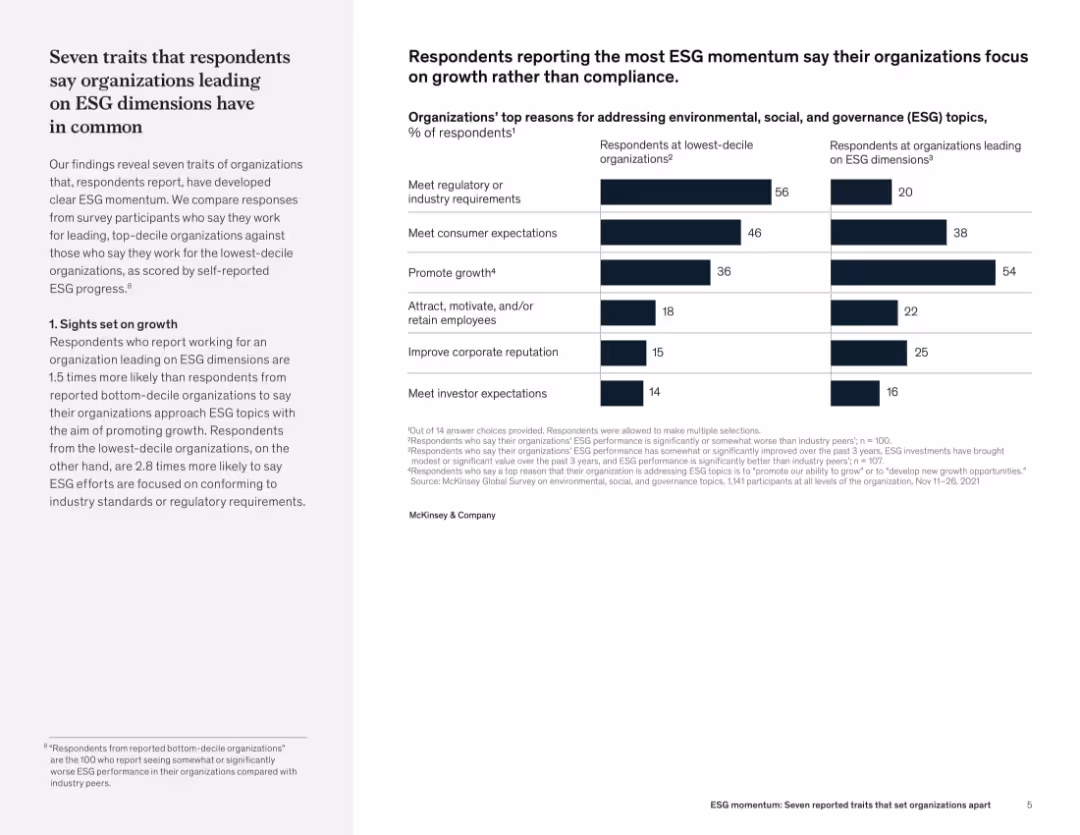
Two-column layout with narrative on the left and bar chart on the right comparing ESG motivations between top- and bottom-performing organizations.
Organizational Structure and Change
Professional Services
The slide reveals that organizations with strong ESG performance prioritize growth, unlike weaker performers who focus on compliance. A comparison chart illustrates differences in motivations—such as promoting growth, attracting talent, and improving reputation—between top and bottom ESG performers.
ESG leadership, strategic traits, growth vs. compliance, stakeholder engagement, sustainability traits, organizational performance
false
Organizational Structure and Change
Professional Services
Mixed Chart
McKinsey
Add to my slides
Remove from favorites
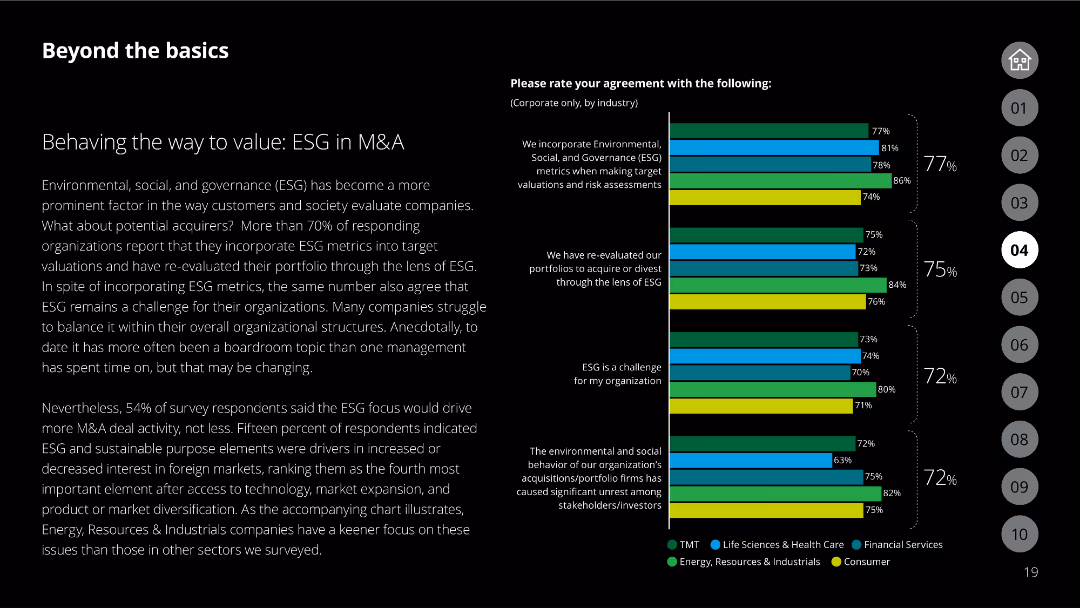
The slide includes a column chart showing agreement with various ESG-related statements across industries.
Regulatory and Compliance
Financial Services
Discusses the integration of ESG metrics in M&A and the challenges companies face with ESG compliance.
ESG, M&A, compliance, corporate, industry trends
false
Regulatory and Compliance
Financial Services
Mixed Chart
Deloitte
Add to my slides
Remove from favorites
This slide is divided into three sections with bullet points summarizing Macquarie’s commitments to environmental, social, and governance aspects. It uses a combination of icons and text, with a consistent color palette and an organized layout that facilitates ease of reading and comprehension.
Regulatory and Compliance
Financial Services
It details Macquarie's dedication to ESG principles and highlights actions and goals in these areas. The slide is used to communicate to stakeholders about Macquarie’s initiatives and commitment to sustainability, social responsibility, and ethical governance practices.
ESG, Macquarie, environmental, social, governance, sustainability, corporate responsibility, ethical practices, commitment
false
Regulatory and Compliance
Financial Services
Pillar
Morgan Stanley
Add to my slides
Remove from favorites
This slide has a large image on the left and column charts on the right, detailing the impact of ESG policies on investment decisions and investor satisfaction with these policies.
Regulatory and Compliance
Financial Services
The slide discusses the evolution of ESG policies among managers and the increasing focus of investors on these policies, highlighting their importance in investment decisions.
ESG, managers, investors, policies, corporate
false
Regulatory and Compliance
Financial Services
Multiple Chart
EY
Add to my slides
Remove from favorites
Complex slide with a materiality matrix diagram, accompanied by a descriptive analysis of how AI is leveraged for ESG-related risk management.
Regulatory and Compliance
Environmental Services & Sustainability
Discusses the importance of materiality in ESG efforts and showcases how AI tools aid in identifying and managing ESG-related risks and opportunities.
ESG, Materiality, AI, Risk Management, Sustainability
false
Regulatory and Compliance
Environmental Services & Sustainability
Diagram
Booz Allen Hamilton
Add to my slides
Remove from favorites
Four bar chart comparisons on left, with accompanying explanatory text on right in dark-themed box. Charts cover processing time, accuracy, context relevancy, and scalability.
Performance Metrics and KPIs
Financial Services
Compares Elastic RAG to a Naive RAG method across various metrics (accuracy, processing time, relevancy, scalability) for ESG data extraction. The analysis shows that Elastic RAG consistently outperforms in extracting relevant data with better accuracy and speed. Highlights its robustness, scalability, and potential to improve ESG data handling in a scalable AI-driven platform.
ESG metrics, Elastic RAG, performance comparison, context relevancy, AI, scalability
false
Performance Metrics and KPIs
Financial Services
Multiple Chart
EY
Add to my slides
Remove from favorites
Split layout: left column contains a paragraph of text, right column features a horizontal bar chart comparing responses across five roles for high vs. low ESG momentum organizations.
Performance Metrics and KPIs
Professional Services
This slide illustrates that organizations with higher ESG momentum are more likely to tie financial incentives to ESG metrics across leadership and management roles. CEOs and CFOs are especially more likely to be incentivized, underscoring ESG as a strategic priority.
ESG metrics, incentives, leadership, ESG momentum, performance metrics, CEO, CFO, McKinsey, survey, governance
false
Performance Metrics and KPIs
Professional Services
Mixed Chart
McKinsey
Add to my slides
Remove from favorites
The slide is data-heavy with multiple statistics and figures relating to Macquarie’s ESG efforts, presented in a mix of text, icons, and numerals. It has a structured design with a clear division of sections, each focusing on a specific ESG aspect. The color scheme and visual elements are consistent and clean.
Regulatory and Compliance
Financial Services
It showcases quantitative achievements in Macquarie’s ESG efforts, like carbon neutrality and investment in renewable energy. The slide could be used for detailed reporting to stakeholders on Macquarie’s ESG performance metrics, reflecting transparency and commitment to sustainable practices.
ESG metrics, Macquarie, carbon neutrality, renewable energy, sustainable operations, corporate reporting, ESG achievements, transparency
false
Regulatory and Compliance
Financial Services
Pillar
Morgan Stanley
Add to my slides
Remove from favorites
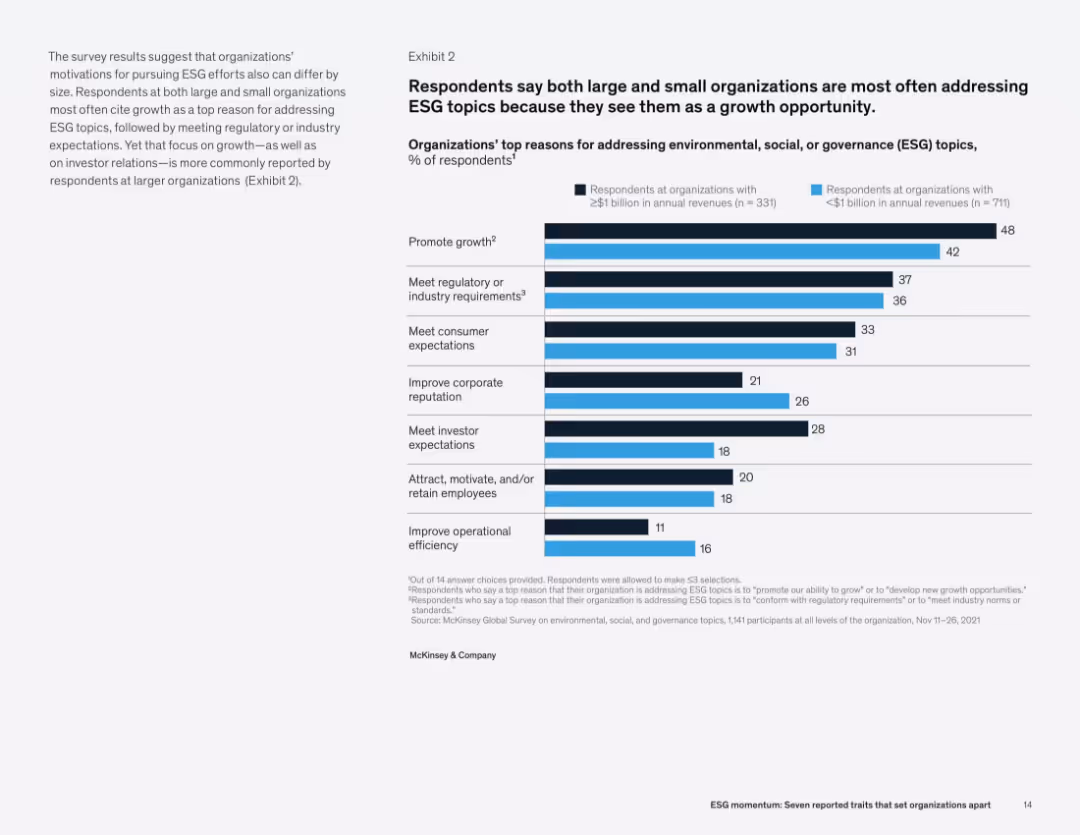
Right-side bar chart compares reasons for ESG focus by company size. Left column contains supporting narrative and analysis.
Strategic Planning
Professional Services
The primary reason organizations pursue ESG topics is to promote growth, followed by compliance and meeting stakeholder expectations. Larger firms more frequently cite investor relations and reputation management as key drivers compared to smaller firms.
ESG motivation, growth, regulation, consumer expectations, corporate reputation, investor expectations, survey
false
Strategic Planning
Professional Services
Mixed Chart
McKinsey
Add to my slides
Remove from favorites
This slide features icons and tables. Each chart corresponds to a different rating agency and shows the ESG rating criteria, score range, specific scores, and rating development. The design is clean with blue and white color scheme.
Financial Performance
Financial Services
The slide presents Deutsche Bank's ESG performance as evaluated by several rating agencies. It details the criteria, score, and trends in ratings, demonstrating how the bank stands on environmental, social, and governance factors as of February 2024.
ESG, performance, rating agencies, trends, finance
false
Financial Performance
Financial Services
Table
Deutsche Bank
Add to my slides
Remove from favorites
Slide with three columns using icons and lists to discuss environment, social, and governance topics.
Regulatory and Compliance
Financial Services
Outlines ESG achievements and goals, emphasizing improvements in policy and corporate culture.
ESG, policy, corporate governance, sustainability, achievements
false
Regulatory and Compliance
Financial Services
Pillar
Barclays
Add to my slides
Remove from favorites
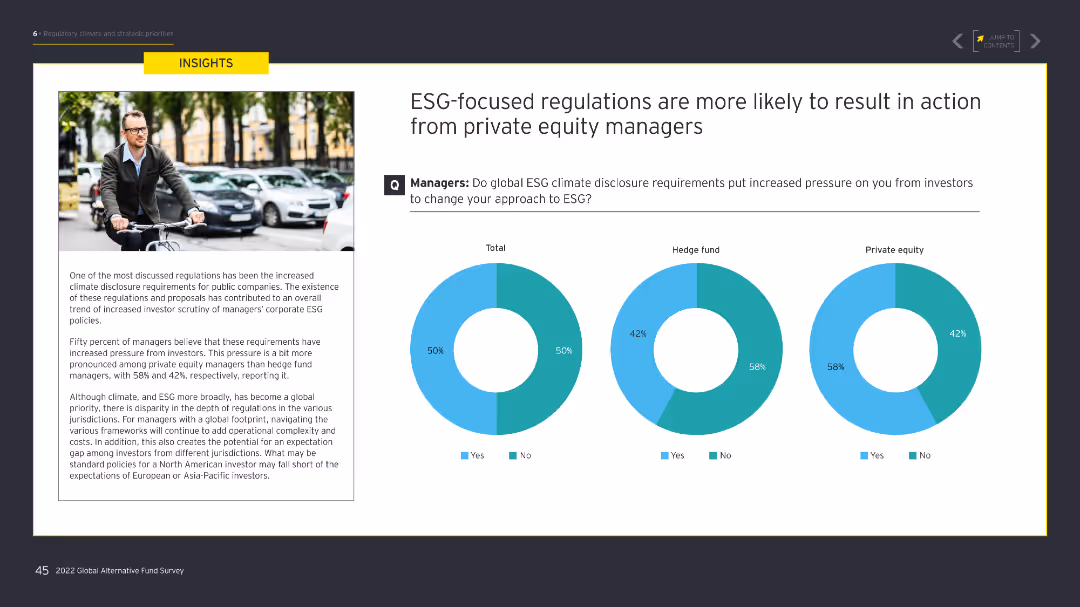
Features three pie charts showing responses from total managers, hedge funds, and private equity managers about ESG climate disclosure requirements. The slide also includes a large image on the left.
Regulatory and Compliance
Financial Services
The slide presents survey data on how ESG-focused regulations influence private equity managers compared to hedge fund managers, emphasizing the increased pressure from investors to change ESG approaches.
ESG, private equity, hedge funds, regulations, climate
false
Regulatory and Compliance
Financial Services
Multiple Chart
EY
Add to my slides
Remove from favorites
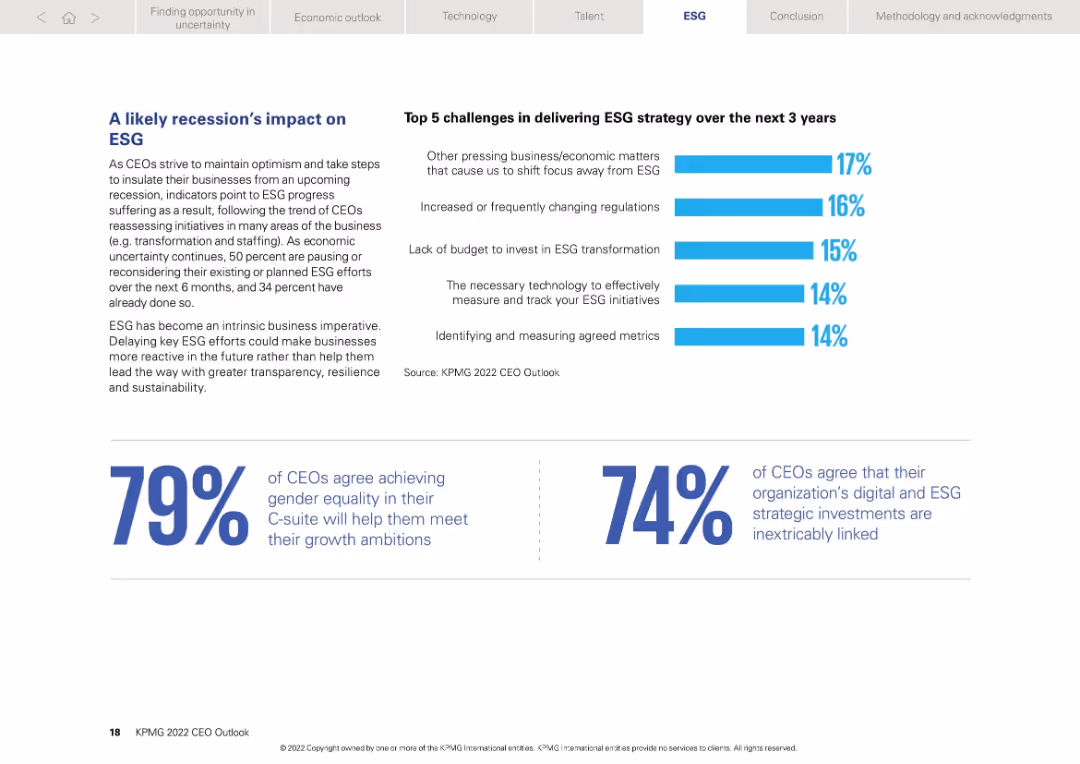
Two-column format with text on left and bar chart on right. Large percentage callouts at bottom.
Strategic Planning
Professional Services
Discusses how looming recession risks are causing CEOs to pause or reconsider ESG efforts. Lists top five ESG challenges for the next 3 years and highlights CEO sentiments on gender equity and ESG-tech alignment.
ESG, recession, challenges, budget, metrics, gender equity, KPMG
false
Strategic Planning
Professional Services
Mixed Chart
KPMG
Add to my slides
Remove from favorites
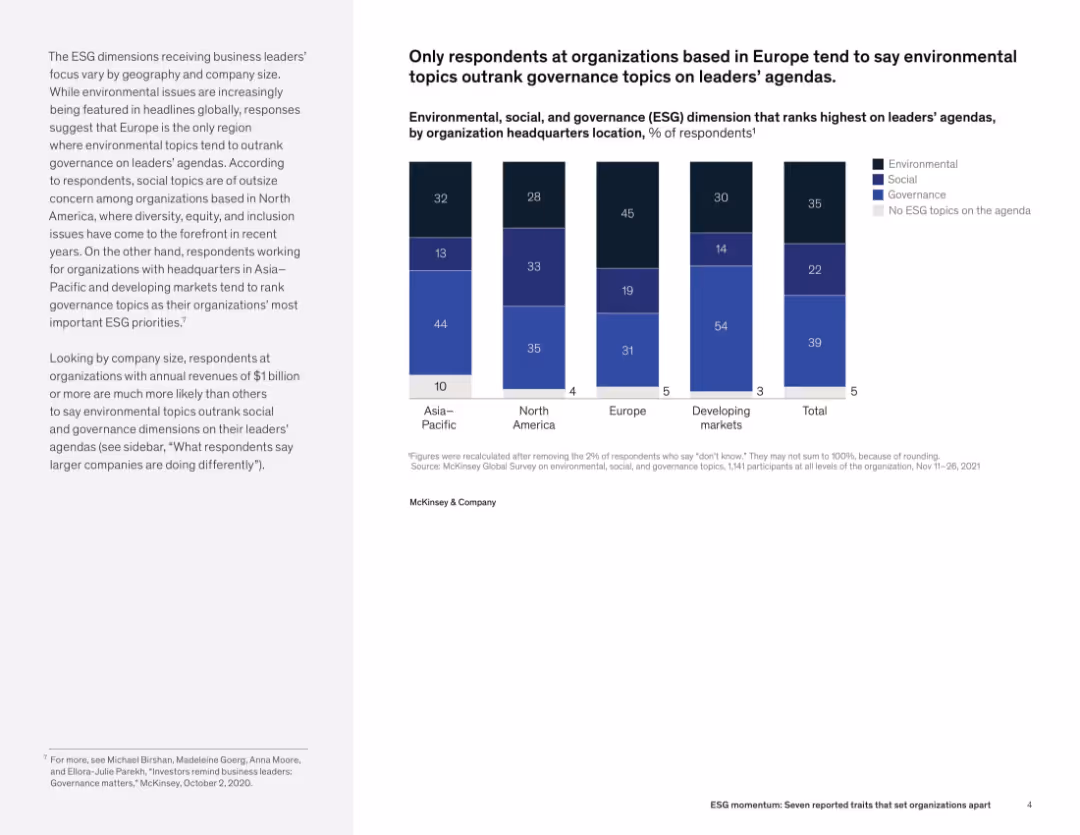
Text and vertical stacked bar chart showing ESG topic prioritization by global region. Regions include Asia–Pacific, North America, Europe, and developing markets.
Strategic Planning
Professional Services
This slide shows regional variations in prioritization of ESG dimensions. Europe leads with environmental concerns topping the agenda, while North America emphasizes social topics. Developing markets and Asia–Pacific show stronger preferences for governance.
ESG, regional comparison, governance, environmental topics, organizational agenda, sustainability, leadership focus
false
Strategic Planning
Professional Services
Mixed Chart
McKinsey
Add to my slides
Remove from favorites
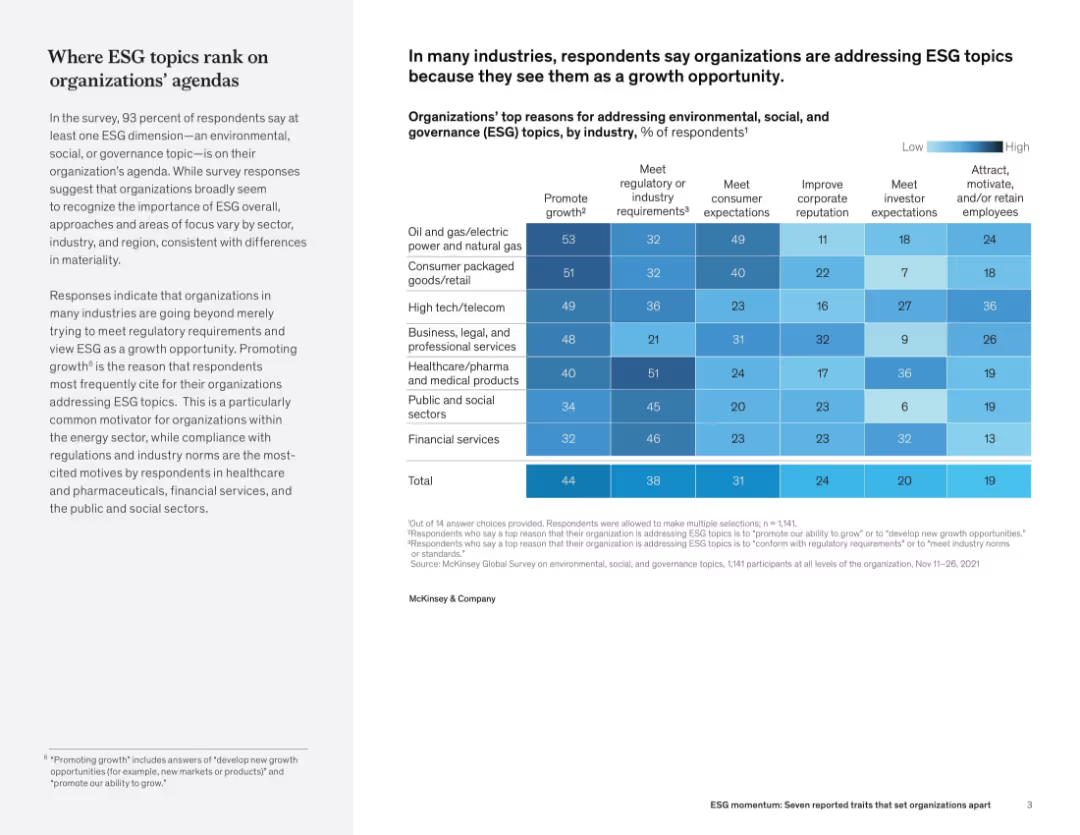
Split layout with narrative on the left and a heatmap chart on the right showing percentages of organizations addressing ESG topics by industry and reason.
Regulatory and Compliance
Professional Services
The slide details how different industries prioritize ESG issues and their reasons—primarily to promote growth or meet regulatory demands. The chart breaks down ESG motivations (e.g., compliance, reputation, employee retention) across multiple sectors, showing strong emphasis in energy, healthcare, and public services.
ESG, regulation, industry comparison, sustainability, corporate responsibility, survey data, public sector, compliance
false
Regulatory and Compliance
Professional Services
Mixed Chart
McKinsey
Add to my slides
Remove from favorites
This slide features a circular diagram and a list of bullet points to the left, explaining the current ESG landscape on the Isle of Man. It uses a simple color scheme, primarily red and black, to denote various aspects of the regulatory environment and company reactions.
Regulatory and Compliance
Environmental Services & Sustainability
This slide addresses the lack of ESG regulation in the Isle of Man, noting that companies are still developing strategies due to external pressures and market expectations. It's used to discuss how entities can prepare for future regulations and leverage ESG for value, despite current non-regulation.
ESG, Regulation, Isle of Man, Market Expectations, Strategy Development, Diagram
false
Regulatory and Compliance
Environmental Services & Sustainability
Framework
PwC/Strategy&
Add to my slides
Remove from favorites
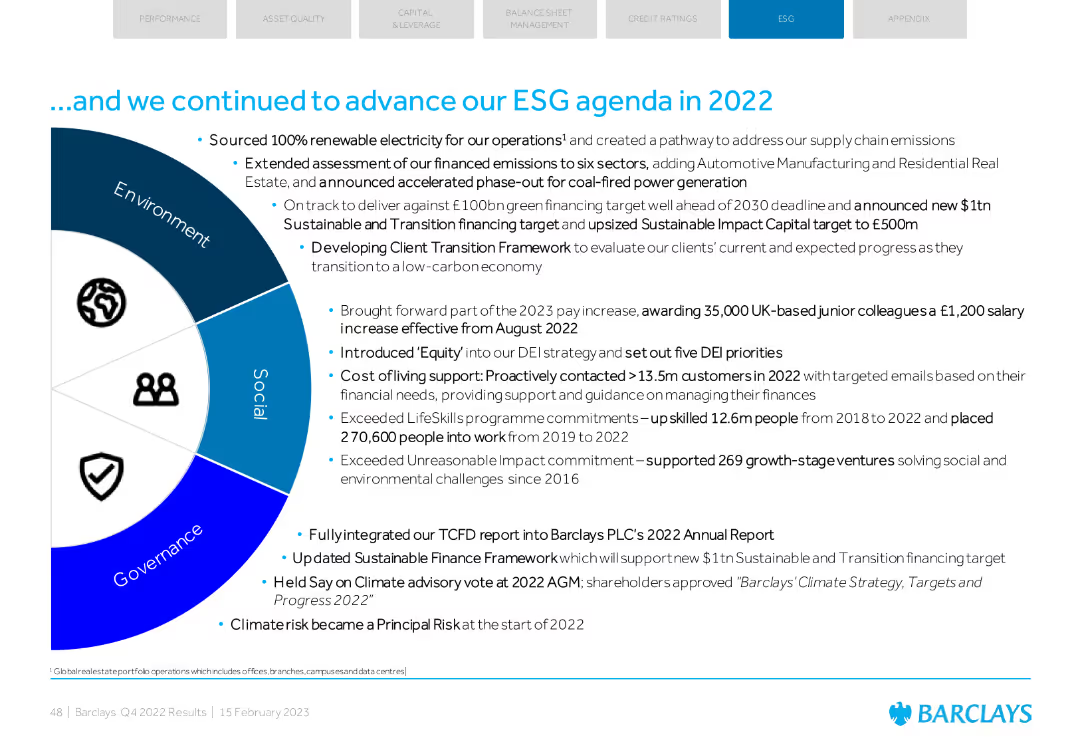
A mix of text and an infographic wheel illustrating ESG progress across Environment, Social, and Governance.
Regulatory and Compliance
Financial Services
Summarizes Barclays' ESG advancements in 2022, including renewable energy sourcing, DEI initiatives, and support for social and environmental ventures.
ESG, renewable energy, DEI, social impact, governance
false
Regulatory and Compliance
Financial Services
Diagram
Barclays
Add to my slides
Remove from favorites
The slide has a dynamic design with diagonal split composition, incorporating multiple images that represent various aspects of ESG: space, technology, teamwork, and data analysis.
Industry Overview
Environmental Services & Sustainability
This title slide introduces the 2022 Environmental, Social, Governance Report, emphasizing the company's focus on a secure, resilient, and equitable future.
ESG, Report, Environment, Social, Governance, 2022
false
Industry Overview
Environmental Services & Sustainability
Title
Booz Allen Hamilton
Add to my slides
Remove from favorites
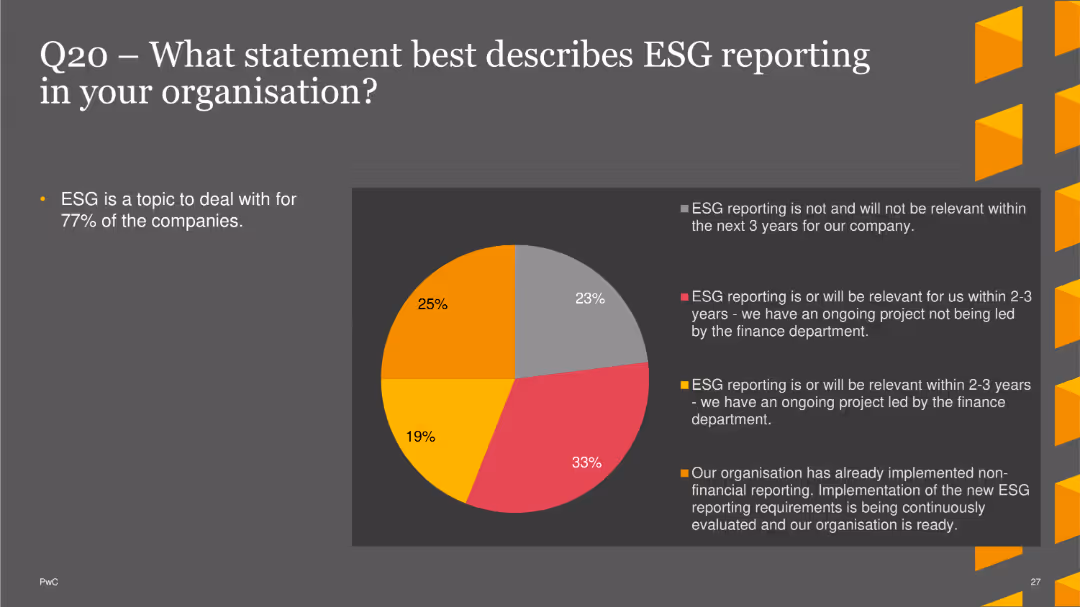
The slide displays a pie chart depicting the relevance of ESG reporting in organizations. Statements include whether ESG reporting is or will be relevant within the next 2-3 years, whether there is an ongoing project, and whether non-financial reporting has already been implemented. The chart uses various colors to represent different responses. A brief text section summarizes the importance of ESG for most companies.
Regulatory and Compliance
Financial Services
This slide presents survey data on the relevance and implementation of ESG reporting in organizations, indicating that a significant number of companies find ESG reporting important or have ongoing projects in this area. It provides insights into current compliance trends and future directions.
ESG reporting, compliance, finance, regulatory, trends
false
Regulatory and Compliance
Financial Services
Single Chart
PwC/Strategy&
Add to my slides
Remove from favorites
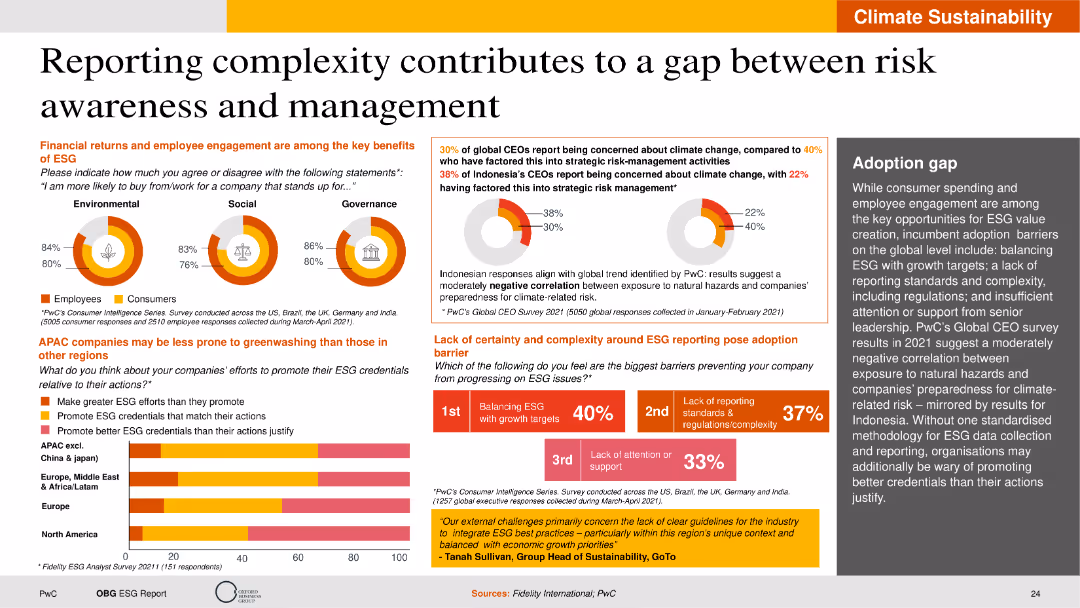
The slide is visually detailed with pie charts, bar charts, and text boxes. It uses a clear layout to present data on CEO concerns about climate change, ESG reporting barriers, and engagement benefits.
Risk Assessment and Management
Financial Services
The slide examines the complexity of ESG reporting and its impact on risk awareness and management. It highlights the concerns of global and Indonesian CEOs regarding climate change, the key benefits of ESG in terms of financial returns and employee engagement, and the barriers to effective ESG reporting. The slide also discusses regional differences in greenwashing susceptibility and adoption gaps.
ESG reporting, risk management, climate change, CEO concerns, greenwashing
false
Risk Assessment and Management
Financial Services
Multiple Chart
PwC/Strategy&
Add to my slides
Remove from favorites
The slide features two column charts showing the value that ESG projects bring to companies over time, comparing increased revenue and brand credibility across different time spans (less than 1 year, 2-5 years, 5-10 years, and 10+ years).
Market Analysis and Trends
Environmental Services & Sustainability
This slide emphasizes the long-term financial benefits of ESG initiatives, showing how companies with mature ESG programs see increased revenue and brand credibility over various time periods. It highlights the importance of sustained ESG efforts for long-term gains.
ESG, revenue, brand, long-term, benefits
false
Market Analysis and Trends
Environmental Services & Sustainability
Multiple Chart
Kearney
Add to my slides
Remove from favorites
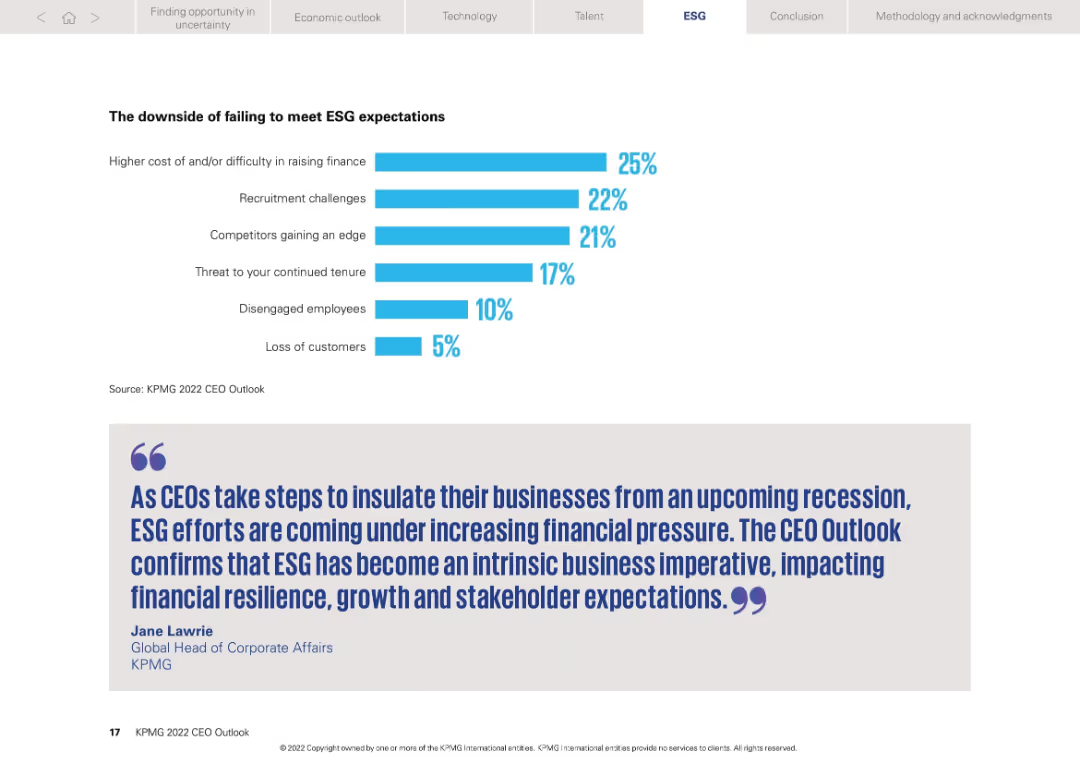
Clean, minimalist layout with horizontal bar chart and quote section. Blue theme with bold fonts.
Risk Assessment and Management
Professional Services
This slide outlines the business risks associated with failing to meet ESG expectations, such as difficulty in financing, recruitment issues, and disengaged employees. A quote emphasizes ESG as a core business imperative linked to resilience and stakeholder expectations.
ESG, risk, recruitment, finance, disengagement, stakeholder, KPMG, quote
false
Risk Assessment and Management
Professional Services
Mixed Chart
KPMG
Add to my slides
Remove from favorites
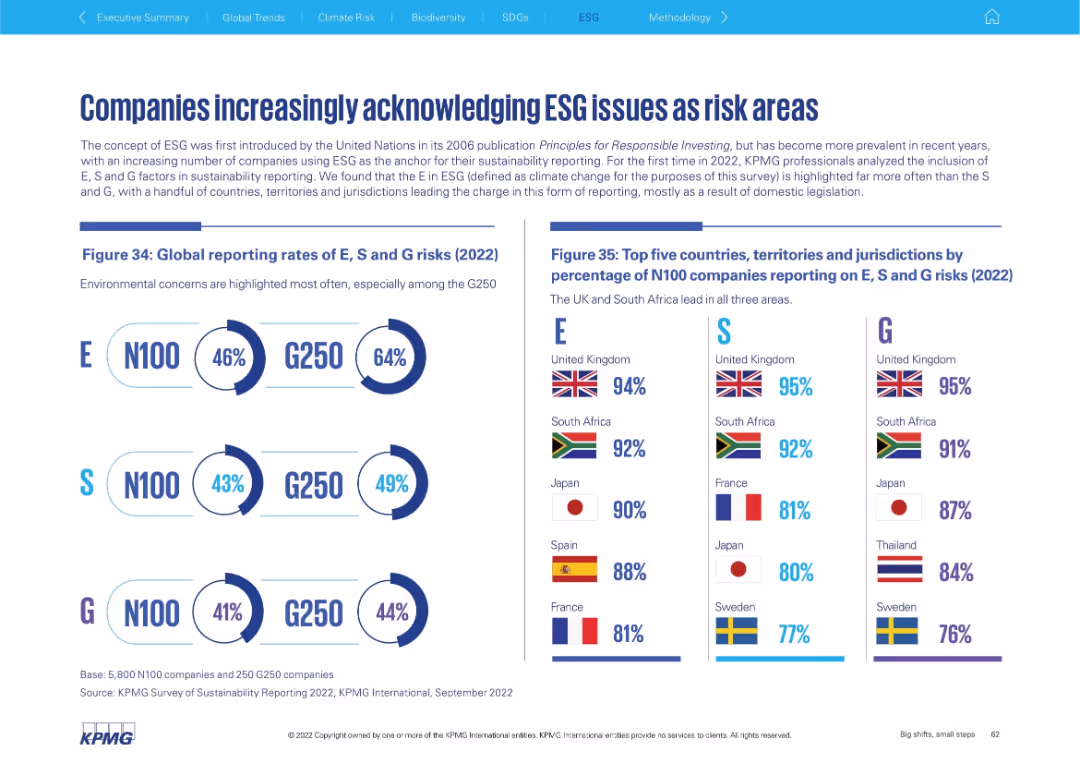
Clean two-part layout with circular percentage graphics on the left for E, S, G risks and vertical flag-based comparisons on the right.
Risk Assessment and Management
Professional Services
The slide emphasizes growing corporate acknowledgment of ESG risks, particularly environmental ones. It shows reporting rates for E, S, and G risks in N100 and G250 and lists countries leading in each area (UK, South Africa, Japan).
ESG risks, environment, governance, social issues, risk reporting, country rankings, N100, G250, sustainability
false
Risk Assessment and Management
Professional Services
Mixed Chart
KPMG
Add to my slides
Remove from favorites
The slide includes a pie chart and column charts, with text describing the evolution of ESG awareness.
Regulatory and Compliance
Environmental Services & Sustainability
This slide discusses how organizations are evolving in their focus on ESG risks, with statistics and survey results.
ESG, risks, evolution, awareness, survey
false
Regulatory and Compliance
Environmental Services & Sustainability
Single Chart
Deloitte
Add to my slides
Remove from favorites
Displays multiple text sections with icons, quotes, and bullet points. There's a graphical element indicating environmental, social, and governance approaches.
Corporate Finance and Valuation
Financial Services
This slide presents the company's commitment to ESG, highlighting scholarship contributions and workforce support, intended for sustainability reports.
ESG, Scholarships, Workforce Support, Environmental Impact, Governance
false
Corporate Finance and Valuation
Financial Services
Mixed Chart
Morgan Stanley
Add to my slides
Remove from favorites
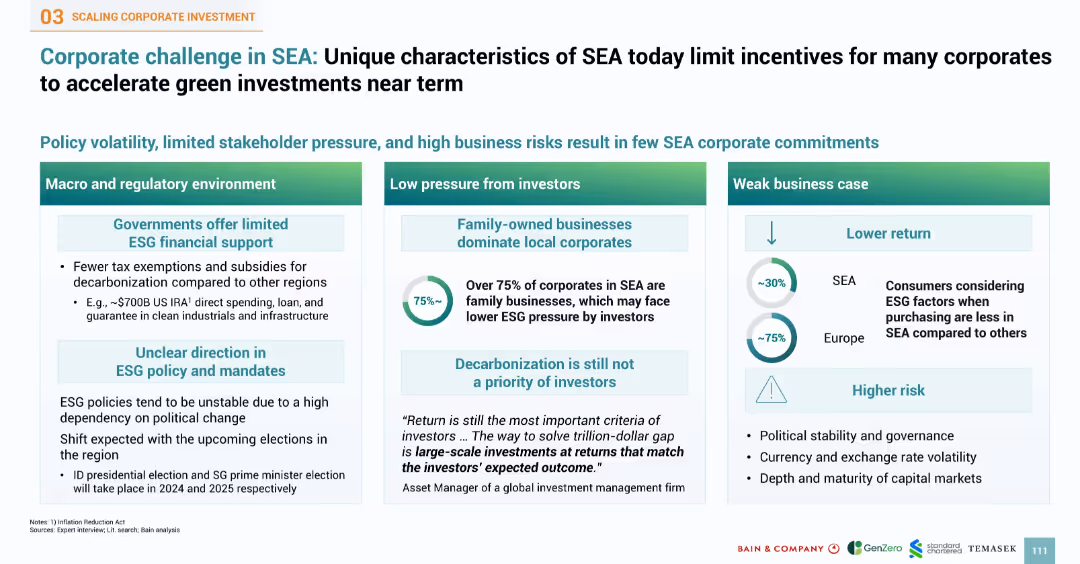
Three-column layout with colored headers categorizing issues into macro/regulatory, investor pressure, and business case, using icons, percentages, and text boxes
Strategic Planning
Environmental Services & Sustainability
Highlights the structural barriers to accelerating green investment in Southeast Asia (SEA), including limited government ESG support, low investor pressure (particularly in family-owned businesses), and weak business cases due to low consumer ESG awareness and high risks
ESG, SEA, investor pressure, policy risk, low return, sustainability barriers, green investment, governance
false
Strategic Planning
Environmental Services & Sustainability
Mixed Chart
Bain
Add to my slides
Remove from favorites
The slide contains a column chart showing different ESG structures investors plan to invest in. The left side features an image of professionals working outdoors.
Market Analysis and Trends
Financial Services
Details how investors are gaining exposure to socially responsible products, including various ESG structures and investment plans, highlighting different fund types.
ESG, socially responsible, investment, products, fund managers, investors, structures, analysis, outdoor professionals
false
Market Analysis and Trends
Financial Services
Mixed Chart
EY
Add to my slides
Remove from favorites
Features a central circular diagram with arrows pointing to related components, emphasizing integration of ESG strategies with corporate strategy.
Strategic Planning
Financial Services
Focuses on the integration of ESG strategies with corporate strategies, discussing material topics, ESG opportunities, and vision alignment.
ESG, strategy, corporate strategy, integration, material topics, opportunities, vision
false
Strategic Planning
Financial Services
Framework
PwC/Strategy&
Add to my slides
Remove from favorites
A content slide with graphical elements such as icons representing "EMPLOYER DIVERSE TALENT," "MAKE INNOVATION ACCESSIBLE TO ALL," and "DRIVE COMMUNITY RESILIENCE." Green and yellow color theme with text sections and labeled graphics.
Strategic Planning
Professional Services
Slide detailing a company's ESG strategy including internal and external drivers with three main pillars aimed at securing a resilient and equitable future.
ESG, strategy, diversity, innovation, resilience, governance, sustainability
false
Strategic Planning
Professional Services
Pillar
Booz Allen Hamilton
Add to my slides
Remove from favorites
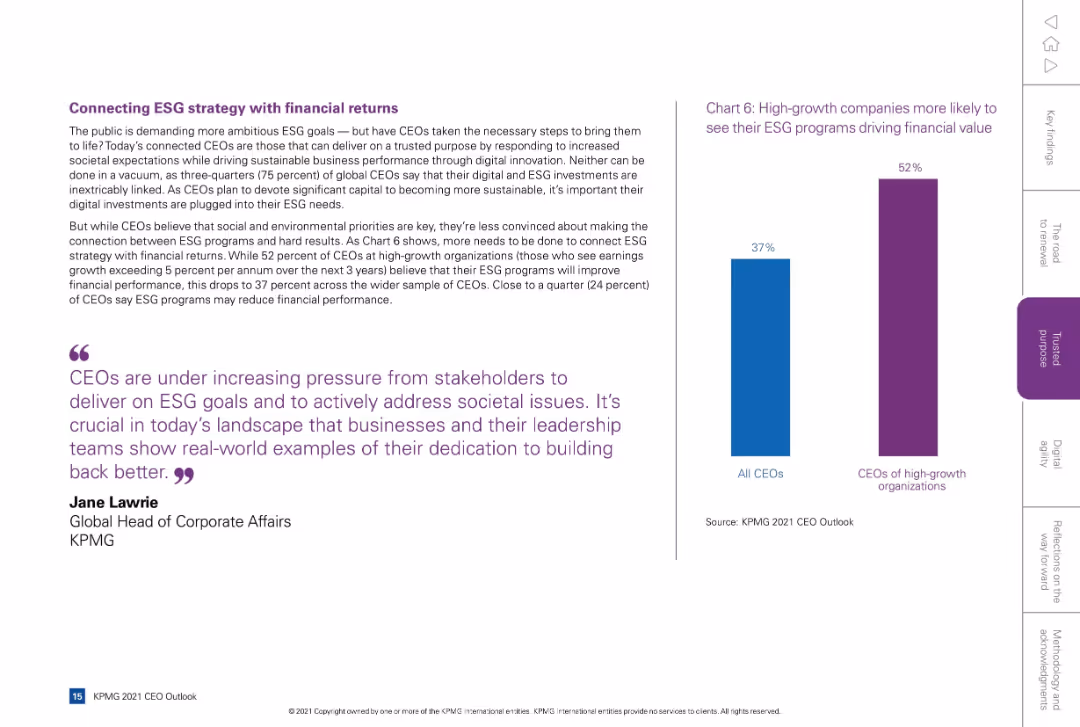
Left column contains narrative and a quote, right side features a comparative bar chart showing perceptions of ESG's financial impact by CEO type.
Financial Performance
Environmental Services & Sustainability
Explores whether CEOs see ESG goals as delivering financial value. 52% of high-growth company CEOs believe ESG improves performance versus 37% of general CEOs. Stresses the need to integrate ESG with digital strategies and stakeholder expectations.
ESG strategy, ROI, high-growth, stakeholder pressure, sustainability
false
Financial Performance
Environmental Services & Sustainability
Mixed Chart
KPMG
Add to my slides
Remove from favorites
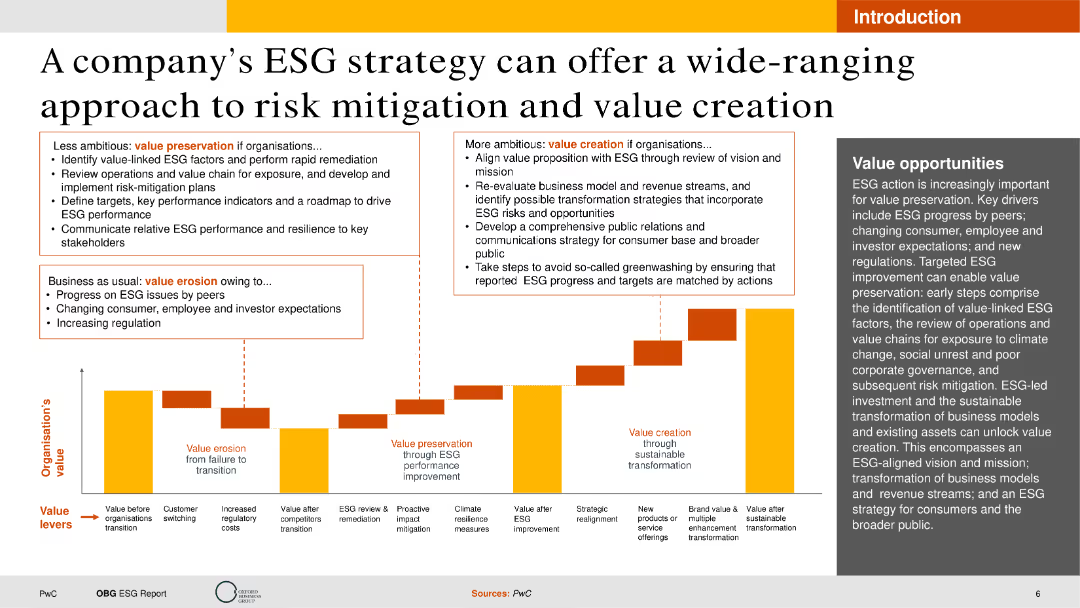
This slide includes text boxes describing value preservation and creation strategies, a column chart depicting organizational value, and a narrative section on value opportunities. The layout is information-dense but organized for readability.
Strategic Planning
Environmental Services & Sustainability
It discusses how companies can use ESG strategies for risk mitigation and value creation. The slide outlines less and more ambitious approaches, emphasizing the benefits of strategic ESG integration for long-term value.
ESG, Strategy, Value, Risk Mitigation, Opportunities
false
Strategic Planning
Environmental Services & Sustainability
Mixed Chart
PwC/Strategy&
Add to my slides
Remove from favorites
Two column charts showing ESG ratings and risk, with a blue color theme. Accompanied by a list of awards on the right side, contrasting against a white background.
Regulatory and Compliance
Financial Services
Showcases the company’s ESG ratings and recognitions to convey commitment to sustainable and ethical operations, likely used in reports or presentations to highlight achievements and market position in terms of responsibility.
ESG, sustainability, awards, ethical operations, market position
false
Regulatory and Compliance
Financial Services
Multiple Chart
Goldman Sachs
Add to my slides
Remove from favorites
The slide features three charts: a pie chart of climate commitments of sustainability leaders, a column chart of ESG bonds issued, and a table showing the share of companies meeting climate recommendations. The layout is clean and uses a blue and white color scheme with clear labels and legends.
Strategic Planning
Environmental Services & Sustainability
The slide discusses the value of comprehensive approaches to sustainability, supported by data on climate commitments of sustainability leaders, ESG bond issuance, and the share of companies meeting climate recommendations across different sectors.
ESG, sustainability, climate commitments, ESG bonds, corporate climate
false
Strategic Planning
Environmental Services & Sustainability
Multiple Chart
EY
Add to my slides
Remove from favorites
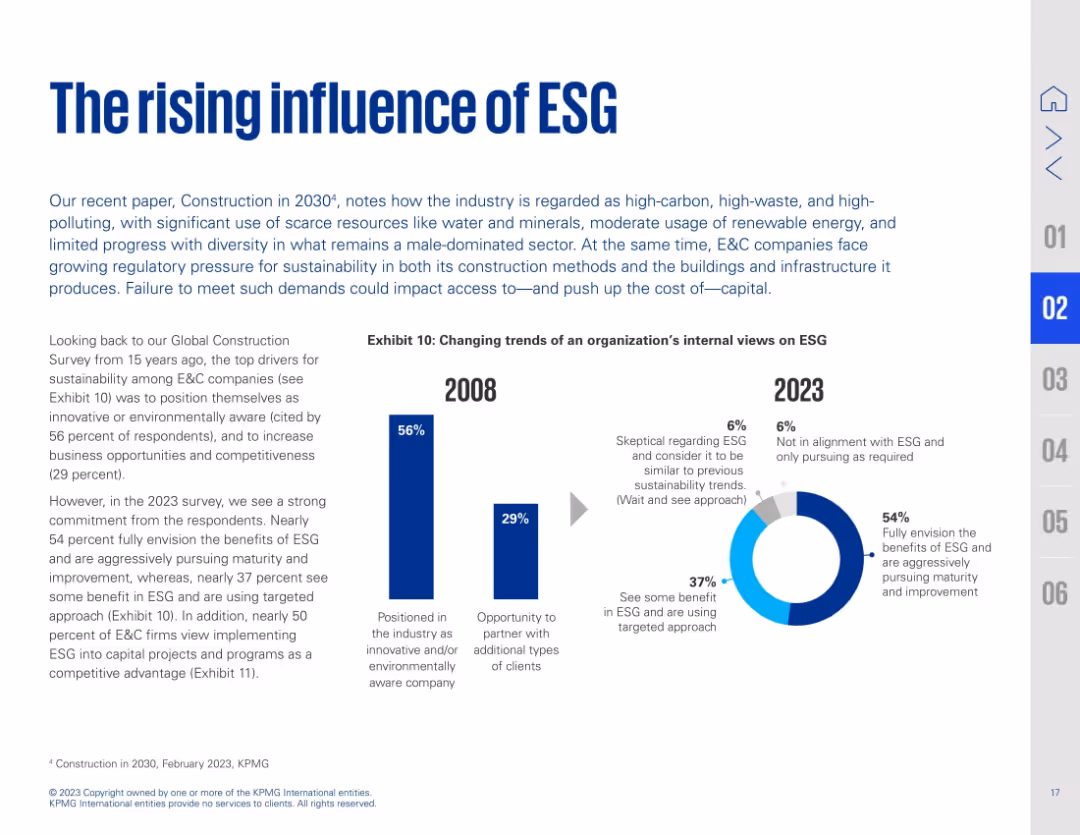
Text on left with a bold title and subtitle; right side features side-by-side bar and donut charts showing ESG perception shifts from 2008 to 2023. Blue accents highlight key data.
Strategic Planning
Real Estate & Construction
This slide presents the growing importance of ESG in construction. It compares ESG sentiment from 2008 to 2023, noting a shift from surface-level awareness to full integration. 54% now fully embrace ESG's value, with significant increases in those pursuing ESG maturity. The industry recognizes ESG as both a strategic and compliance priority.
ESG, sustainability, construction, awareness, maturity, climate, corporate strategy, environmental policy
false
Strategic Planning
Real Estate & Construction
Multiple Chart
KPMG
Add to my slides
Remove from favorites
The slide contains three sections with icons (Environmental, Social, Governance), multiple bullet points, and images symbolizing growth, teamwork, and governance.
Regulatory and Compliance
Transportation & Logistics
Discusses environmental and social initiatives and corporate governance, highlighting efforts in fleet efficiency, compliance, and corporate transparency.
ESG, sustainability, corporate governance, fleet efficiency, compliance, transparency, environmental initiatives, social responsibility
false
Regulatory and Compliance
Transportation & Logistics
Header Vertical
Deutsche Bank
Add to my slides
Remove from favorites
This slide features three sets of column charts comparing 'Electricity', 'Fuel', and 'Heat' purchased or acquired from 2019 to 2021, in MWh. The charts are placed side by side in a muted color scheme. Each chart has a corresponding table below detailing the exact figures. The overall design is clean, utilizing white space effectively.
Financial Performance
Environmental Services & Sustainability
The slide provides a visual comparison of energy consumption data over three years. It's used for analyzing environmental sustainability efforts, specifically in tracking energy usage trends to inform corporate ESG strategies. It illustrates changes in consumption, which may reflect the effectiveness of conservation measures or shifts in operational scale.
ESG, Sustainability, Energy, Trends, Consumption, Comparison, Data, Corporate, Environment
false
Financial Performance
Environmental Services & Sustainability
Multiple Chart
McKinsey
Add to my slides
Remove from favorites
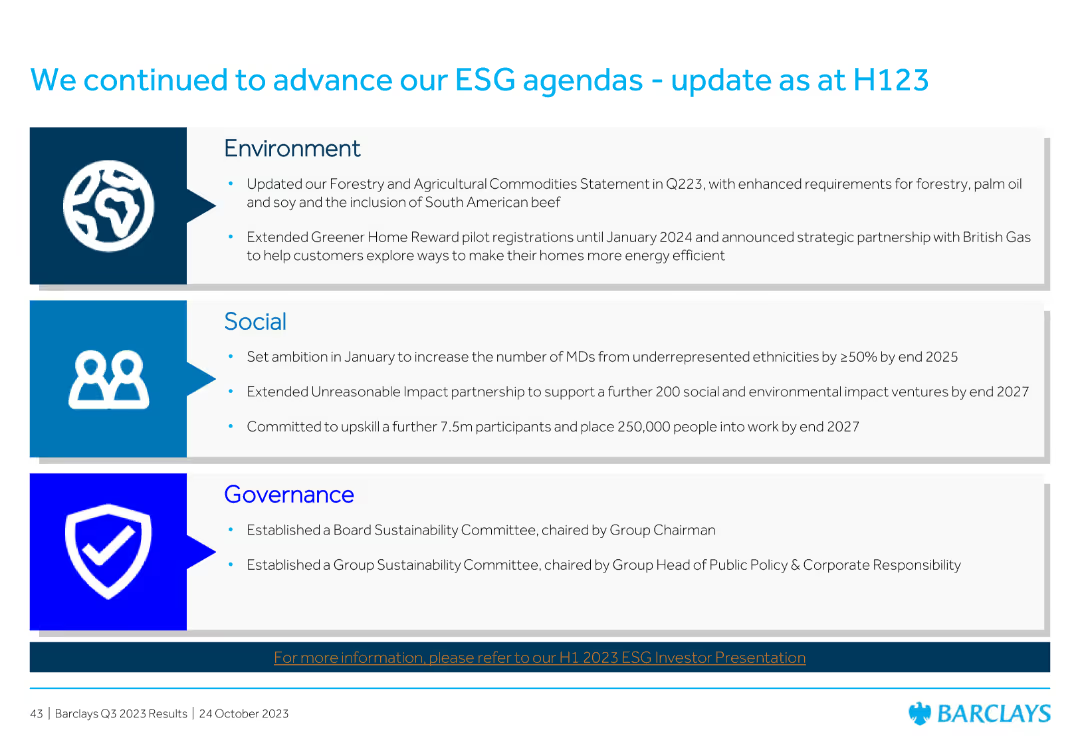
Divided into three sections: Environment, Social, and Governance, each with bullet points summarizing recent initiatives and achievements.
Market Analysis and Trends
Financial Services
Summarizes Barclays' progress on its ESG (Environmental, Social, and Governance) agendas as of H123, detailing initiatives in each area to enhance sustainability and social impact.
ESG, sustainability, environment, social, governance, Barclays, initiatives, H123, progress
false
Market Analysis and Trends
Financial Services
Header Vertical
Barclays
Add to my slides
Remove from favorites
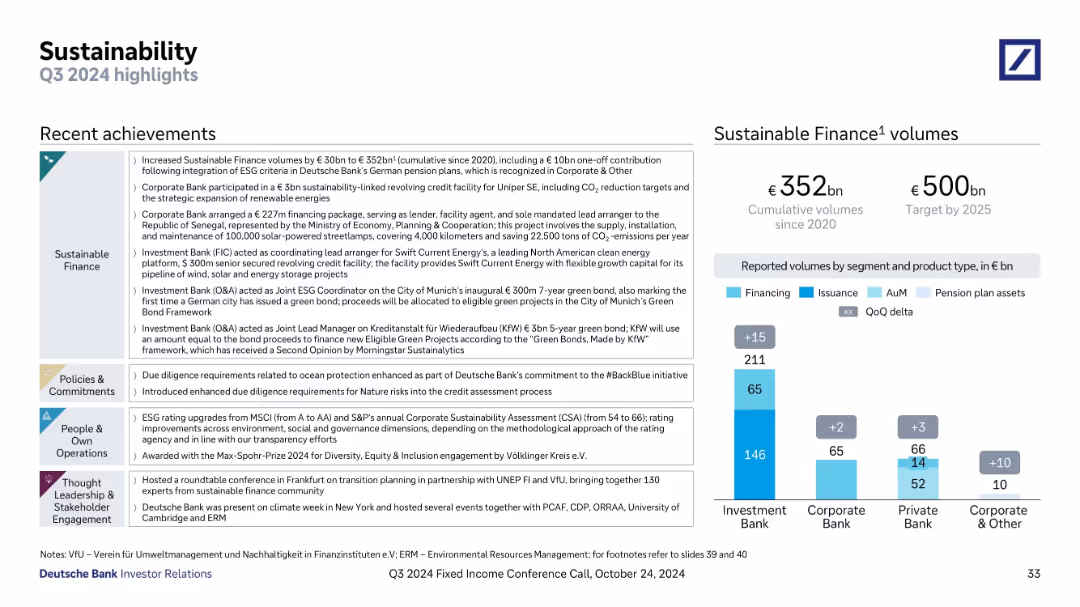
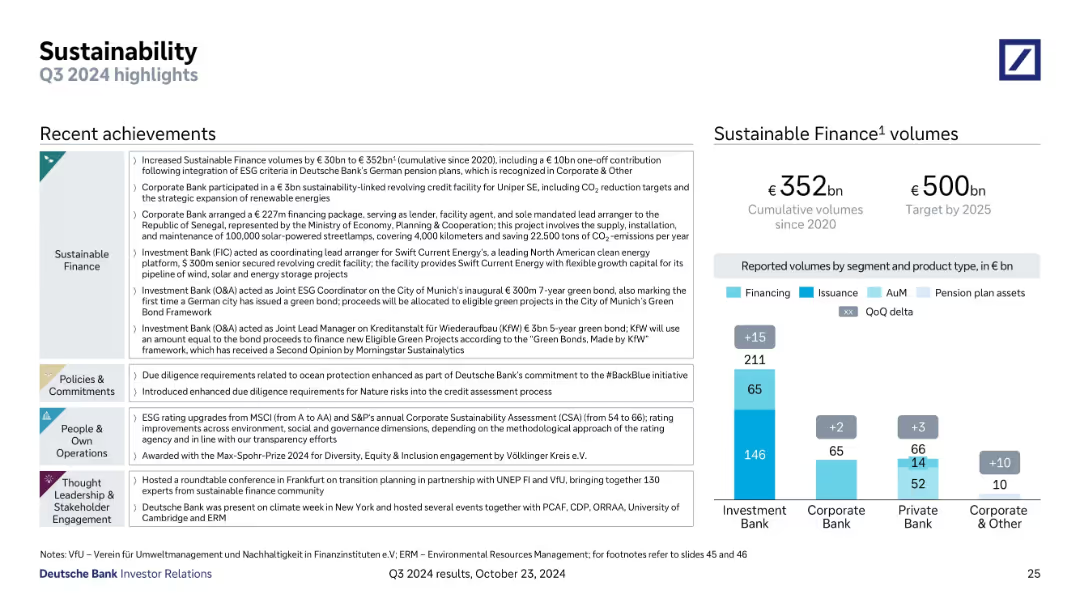
Left: bullet-based achievements by theme (Finance, Commitments, Operations, Thought Leadership); Right: vertical bar chart with segment breakdown
Strategic Planning
Financial Services
Highlights Deutsche Bank’s Q3 2024 sustainability efforts, with updates on green financing, ESG initiatives, and policy changes. Shows cumulative sustainable finance volumes and targets by 2025, segmented by business unit and type.
ESG, sustainability, green bonds, sustainable finance, corporate responsibility, Q3 2024, Deutsche Bank, investment banking
false
Strategic Planning
Financial Services
Mixed Chart
Deutsche Bank
Add to my slides
Remove from favorites
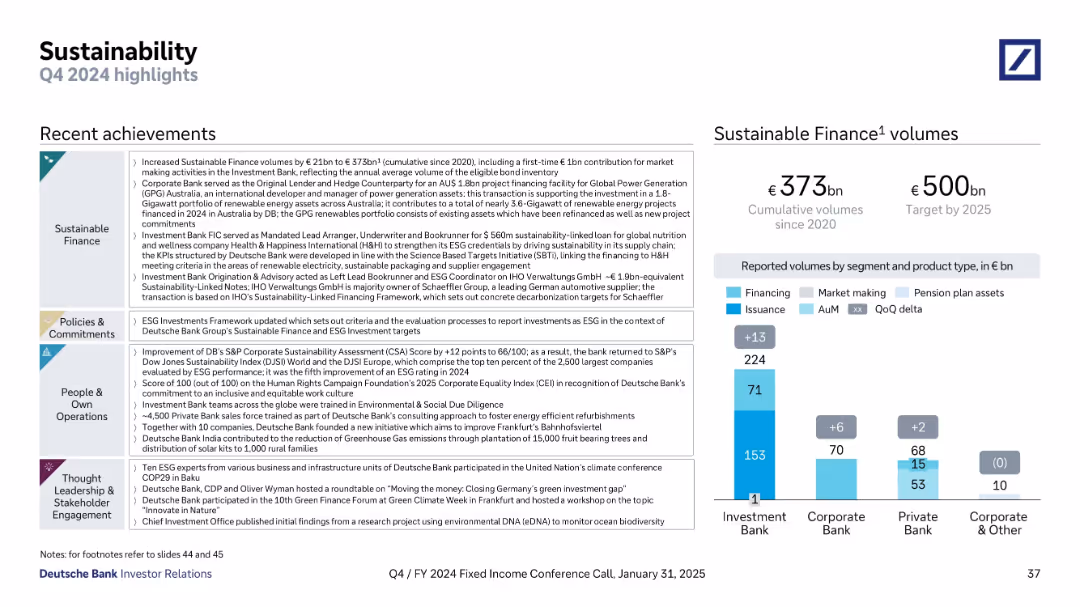
Left side lists sustainability achievements across finance, operations, and policy; right shows cumulative volumes by segment toward €500bn 2025 target.
Regulatory and Compliance
Financial Services
Highlights Q4 2024 ESG milestones, including €373bn in sustainable finance volumes and strategic deals in Australia and ESG-linked bonds. Notes corporate ESG frameworks, internal initiatives, and 2025 target of €500bn.
ESG, sustainability, green finance, investment, compliance, 2025 targets
false
Regulatory and Compliance
Financial Services
Mixed Chart
Deutsche Bank
Add to my slides
Remove from favorites
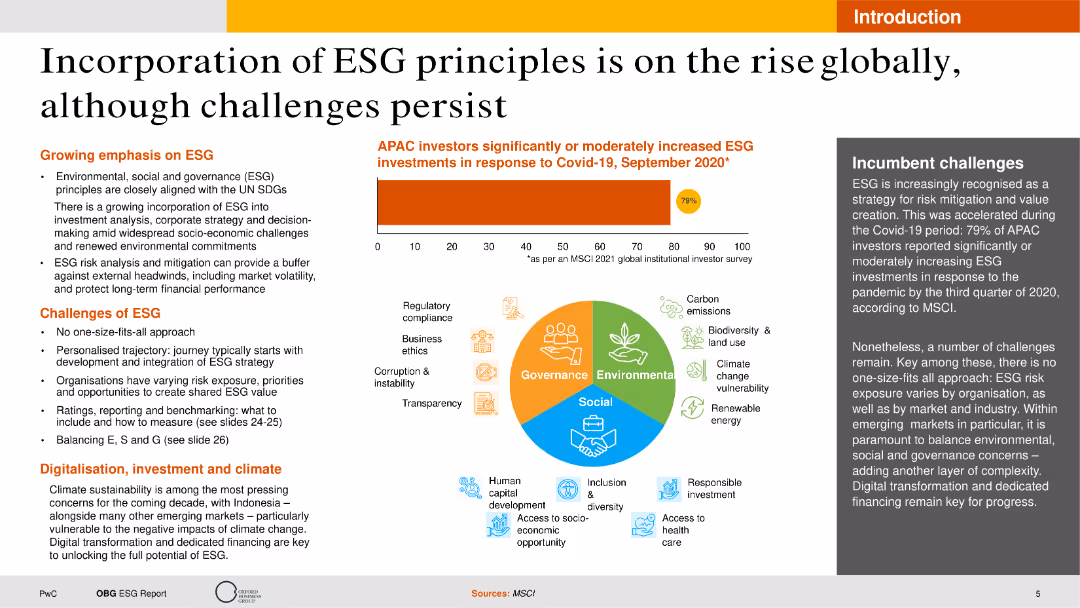
The slide features multiple text sections with a column chart showing ESG investment increases and an infographic illustrating governance, environmental, and social components. The layout is visually balanced with ample white space.
Strategic Planning
Environmental Services & Sustainability
This slide explains the growing emphasis on ESG principles, highlighting challenges, digital investment, and climate sustainability. It provides insights into the importance of ESG in investment analysis and long-term financial performance.
ESG, Sustainability, Investment, Challenges, Trends
false
Strategic Planning
Environmental Services & Sustainability
Mixed Chart
PwC/Strategy&
Add to my slides
Remove from favorites
The slide contains pie charts, bar charts, and text sections. The left side emphasizes the focus on corporate sustainability goals with a quote and statistics.
Strategic Planning
Energy & Utilities
It discusses the role of procurement leaders in corporate sustainability, metrics to measure impact, and commitment levels. It is used for showcasing sustainability.
ESG, sustainability, procurement, corporate goals, impact, commitments, metrics
false
Strategic Planning
Energy & Utilities
Mixed Chart
Kearney
Add to my slides
Remove from favorites
The slide contains pie charts, bar charts, and text sections. The left side emphasizes the focus on corporate sustainability goals with a quote and statistics.
Strategic Planning
Energy & Utilities
It discusses the role of procurement leaders in corporate sustainability, metrics to measure impact, and commitment levels. It is used for showcasing sustainability.
ESG, sustainability, procurement, corporate goals, impact, commitments, metrics
false
Strategic Planning
Energy & Utilities
Multiple Chart
Kearney
Add to my slides
Remove from favorites
This Data-Driven Slide presents Michelin’s ratings from various ESG agencies, along with distribution graphs showing the market average performance and Michelin's standing. The visual elements, including the column charts, rating icons, and color-coded tables, create a data-rich yet clear and structured presentation. It demonstrates Michelin’s strong ESG performance in an impactful and visually effective manner.
Corporate Finance and Valuation
Industrial & Manufacturing
The slide highlights Michelin’s exemplary ESG ratings, showcasing their strong performance in non-financial aspects like sustainability, compared to industry and global averages. It demonstrates their leadership and commitment to environmental and social governance, aligning with investors' and consumers' increasing focus on corporate responsibility.
ESG, sustainability, ratings, performance, Michelin, industry average, leadership, non-financial
false
Corporate Finance and Valuation
Industrial & Manufacturing
Multiple Chart
Morgan Stanley
Add to my slides
Remove from favorites
Image of an icy landscape. Column chart showing how organizations incorporate ESG factors and sustainability risk into risk management agendas.
Risk Assessment and Management
Environmental Services & Sustainability
This slide discusses the integration of ESG and sustainability risks into risk management frameworks. It covers various approaches, including incorporating these risks into business strategies and monitoring potential ESG-related reputation risks. It highlights the importance of aligning risk management with ESG principles.
ESG, sustainability, risk management, business strategy, reputation risks
false
Risk Assessment and Management
Environmental Services & Sustainability
Multiple Chart
EY
Add to my slides
Remove from favorites
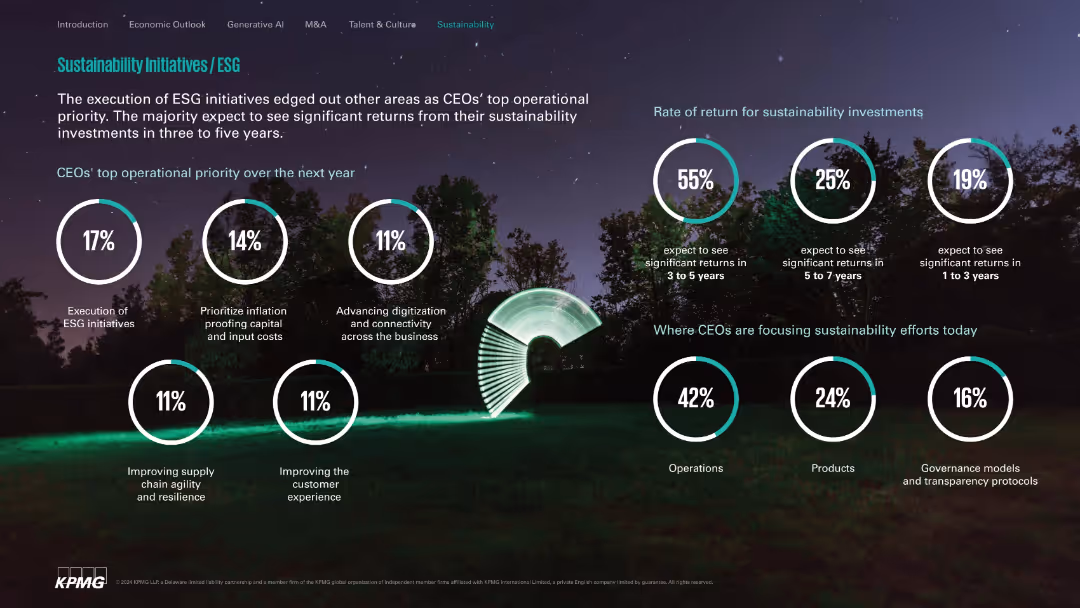
Nature-themed background with white circle stats; clean and segmented layout.
Customer and Market Segmentation
Environmental Services & Sustainability
Highlights ESG execution as a top CEO priority, expected investment return timelines, and primary focus areas like operations, products, and governance. Communicates optimism on sustainability ROI within 3–5 years.
ESG, sustainability, ROI, operations, governance, digital transformation
false
Customer and Market Segmentation
Environmental Services & Sustainability
Single Chart
KPMG
Add to my slides
Remove from favorites
A graph slide with a bar chart showing the levels of concern across different sectors for ESG dimensions. The slide is divided into three sections with color-coded bars corresponding to environment, social, and governance concerns.
Risk Assessment and Management
Technology & Software
Analyzes ESG concerns in SEA's core digital economy sectors, highlighting the higher levels of concern in areas like e-commerce, transport, and gaming.
ESG, sustainability, SEA, digital economy, concerns, environment, social, governance, sectors
false
Risk Assessment and Management
Technology & Software
Table
Bain
Add to my slides
Remove from favorites
A graphical timeline illustrating significant ESG milestones from pre-2020 to 2024, marked with icons and brief descriptions of each achievement.
Strategic Planning
Financial Services
Outlines Barclays' progression in ESG initiatives over several years, demonstrating commitments like joining the Paris Pledge and setting new financing restrictions.
ESG, sustainability, strategic milestones, climate action, corporate responsibility, green financing
false
Strategic Planning
Financial Services
Linear Flow
Barclays
Add to my slides
Remove from favorites
The slide includes a bar chart showing various actions organizations are taking to drive ESG transformation, such as adopting alternative energy sources and deploying advanced technologies. The bars are horizontal, indicating the percentage of respondents engaging in each action.
Operational Efficiency
Environmental Services & Sustainability
Explores the different initiatives companies are undertaking to enhance their sustainability practices. It reflects a comprehensive approach to ESG transformation encompassing energy use, supply chain reconfiguration, and staff upskilling, highlighting the multi-faceted nature of sustainable business practices.
ESG, sustainability, transformation, actions, 2023
false
Operational Efficiency
Environmental Services & Sustainability
Single Chart
PwC/Strategy&
Add to my slides
Remove from favorites
This slide has a central Goldman Sachs logo with surrounding text describing different roles such as "Investor," "Business," "Operator," "Issuer," and "Employer." The layout is organized with clear, readable segments.
Strategic Planning
Government & Public Sector
It explains the role of Goldman Sachs' Sustainable Finance Group in mobilizing expertise to address clients' ESG needs. The slide is pertinent for discussing strategic planning and commercial opportunities within sustainable finance, detailing how the firm engages with various stakeholders.
ESG, sustainable finance, Goldman Sachs, strategic planning, expertise
false
Strategic Planning
Government & Public Sector
Framework
Goldman Sachs
Add to my slides
Remove from favorites
Two-part layout with bullet points of recent ESG achievements on the left and a bar chart on the right showing Sustainable Finance volumes by bank segment and type.
Regulatory and Compliance
Financial Services
Deutsche Bank reports sustainable finance progress, with €352bn cumulative volumes and a €500bn target by 2025. The slide showcases major deals, green bond arrangements, ESG ratings, and thought leadership activities. Volumes are segmented by bank division and asset type.
ESG, sustainable finance, green bond, volumes, CSR, climate, ESG ratings
false
Regulatory and Compliance
Financial Services
Mixed Chart
Deutsche Bank
Add to my slides
Remove from favorites
A content slide featuring text on the left with two column charts on the right. The columns compare various ESG growth opportunities and tracking methods.
Risk Assessment and Management
Financial Services
The slide discusses banks' progress in sustainable finance and ESG, highlighting opportunities in ESG products and banks' early stages in tracking environment-related products.
ESG, sustainable finance, opportunities, risks, tracking
false
Risk Assessment and Management
Financial Services
Multiple Chart
EY
Add to my slides
Remove from favorites
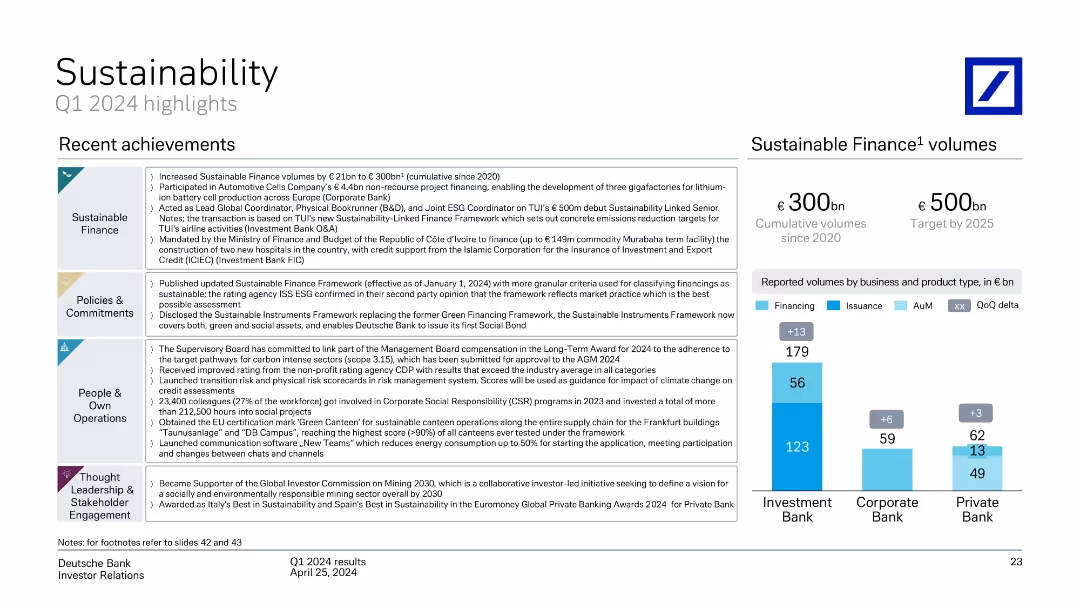
Multi-section slide: achievements grouped under themes; bar chart of sustainable finance volumes
Regulatory and Compliance
Financial Services
Provides highlights of Deutsche Bank’s Q1 2024 sustainability progress, including updated frameworks, ESG commitments, and €300bn in cumulative sustainable finance volumes. Initiatives span finance, governance, and social responsibility.
ESG, sustainable finance, policies, green loans, AuM, CDP, ISS ESG
false
Regulatory and Compliance
Financial Services
Mixed Chart
Deutsche Bank
Add to my slides
Remove from favorites
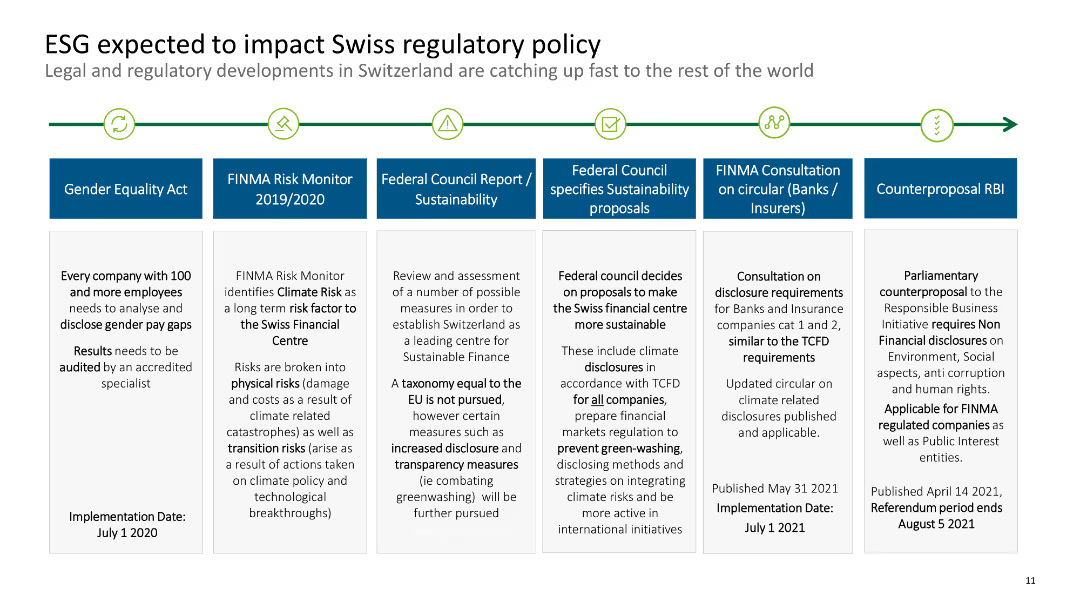
The slide includes a timeline with various regulatory milestones related to ESG and their expected impacts on Swiss policy.
Regulatory and Compliance
Financial Services
It discusses the expected impacts of ESG on Swiss regulatory policy, covering various acts and initiatives from the Gender Equality Act to the Parliamentary Counterproposal RBI.
ESG, Swiss, regulatory, policy, timeline
false
Regulatory and Compliance
Financial Services
Linear Flow
Deloitte
Add to my slides
Remove from favorites
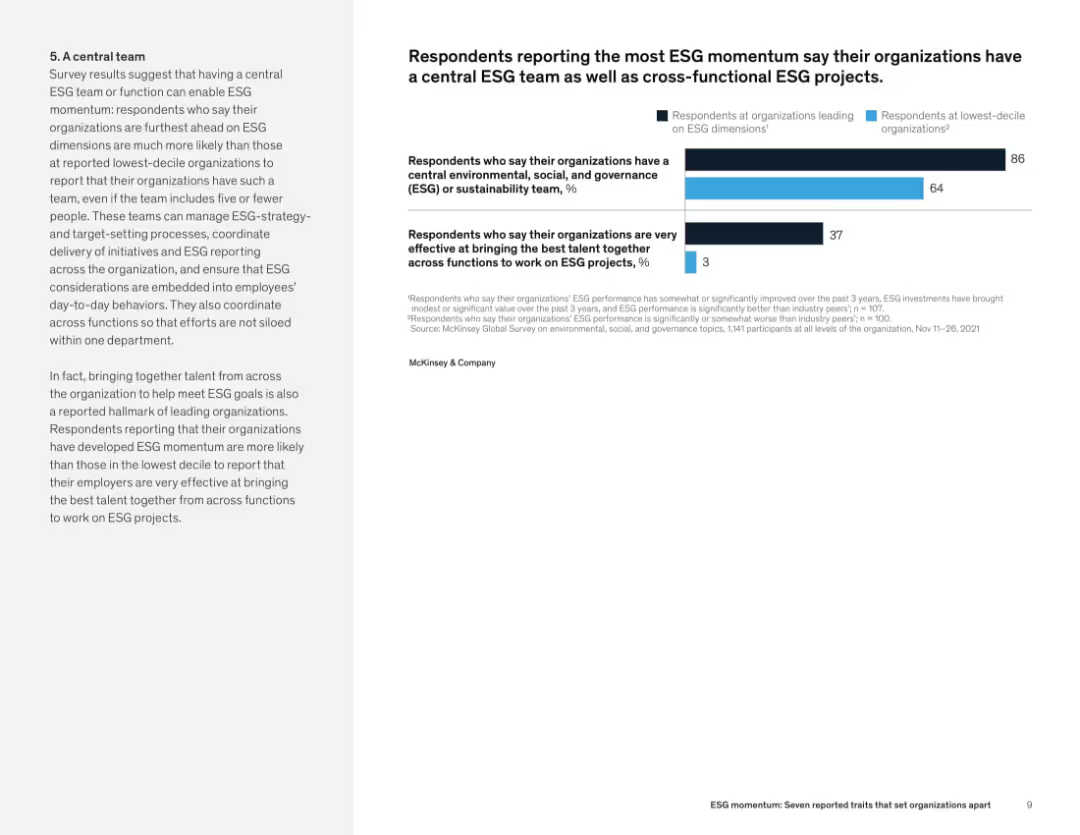
Left-side narrative paired with two horizontal bar charts comparing central ESG team presence and talent coordination across organizations.
Organizational Structure and Change
Professional Services
The slide emphasizes the role of centralized ESG teams and cross-functional collaboration in driving ESG success. High-momentum organizations are more likely to report effective cross-functional teamwork and the existence of dedicated ESG teams.
ESG team, cross-functional, organizational collaboration, sustainability structure, talent alignment, ESG initiatives
false
Organizational Structure and Change
Professional Services
Mixed Chart
McKinsey
Add to my slides
Remove from favorites
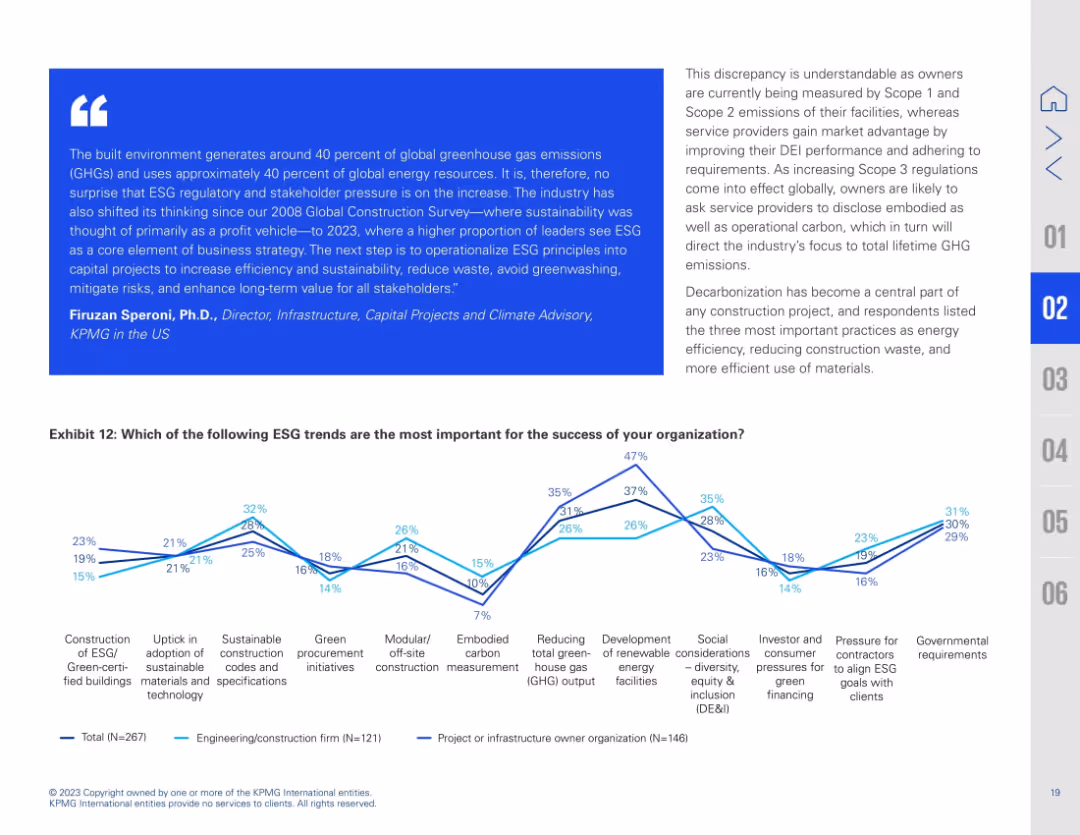
Split layout with a quote on the left in a blue box and a connected line graph on the right (Exhibit 12). Graph shows importance of different ESG trends, segmented by organization type.
Strategic Planning
Real Estate & Construction
This slide shows which ESG trends are considered most important for success. Top trends include reducing GHG emissions, energy efficiency, and sustainable construction. Differences between owners and contractors are evident, driven by differing ESG measurement scopes. Overall, the data reinforces ESG as a core focus in project planning and execution.
ESG trends, construction, energy efficiency, emissions, DE&I, sustainability, owner vs contractor, Scope 3, materials use
false
Strategic Planning
Real Estate & Construction
Mixed Chart
KPMG
Add to my slides
Remove from favorites
The slide is divided into three columns comparing benefits of ESG in various categories, levels of ESG integration, and why companies are in the ESG game. It uses bar charts and percentages to compare different categories and their benefits.
Market Analysis and Trends
Environmental Services & Sustainability
The slide discusses the long-term value created by ESG initiatives, highlighting benefits like increased revenue, cost savings, and brand credibility. It also examines the integration levels of ESG in companies and the reasons behind their ESG initiatives.
ESG, value, benefits, integration, credibility
false
Market Analysis and Trends
Environmental Services & Sustainability
Multiple Chart
Kearney
Add to my slides
Remove from favorites
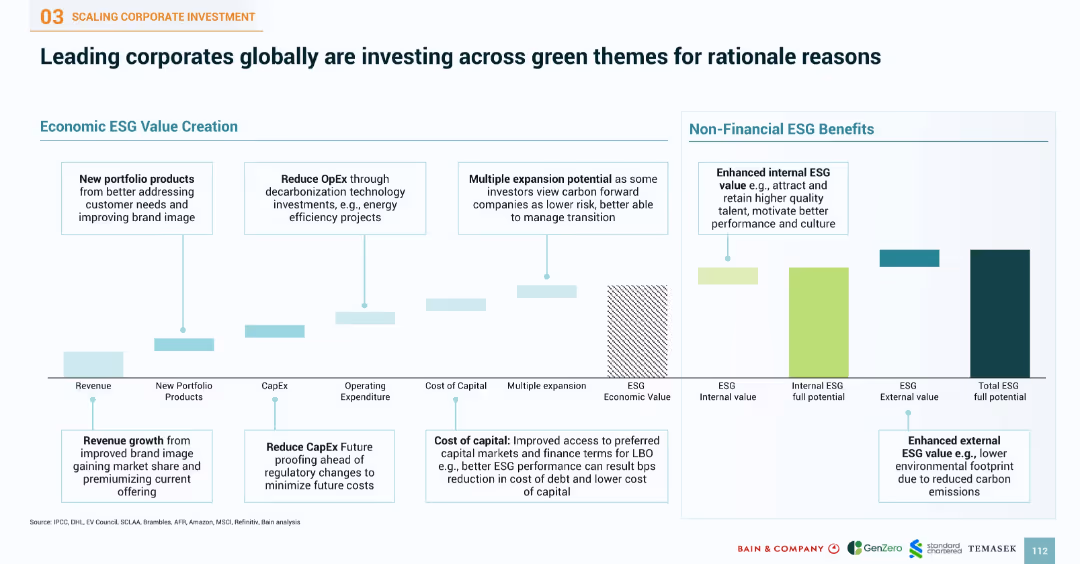
Horizontal bar structure combining text boxes and vertical impact lines, showing both economic and non-financial ESG benefits
Investment Analysis
Environmental Services & Sustainability
Describes tangible reasons companies are investing in ESG, outlining value creation like new products, cost reductions, capital access, and brand enhancement, alongside non-financial benefits such as talent attraction and performance culture
ESG value, CapEx reduction, OpEx savings, brand value, talent retention, carbon transition, green finance
false
Investment Analysis
Environmental Services & Sustainability
Single Chart
Bain
Add to my slides
Remove from favorites
The slide displays three bar graphs comparing the importance of ESG considerations in VC investments across environmental, social, and governance aspects. Commentary text is placed to the right. The graphs use a grey-blue palette, maintaining a professional appearance.
Investment Analysis
Financial Services
The slide examines how venture capital investors rate the importance of ESG dimensions in their investment processes, with additional insights provided on the slide. This can be used in discussions about investment strategies and sustainability practices in the VC industry.
ESG, VC investment, importance rating, environmental, social, governance
false
Investment Analysis
Financial Services
Mixed Chart
Bain
Add to my slides
Remove from favorites
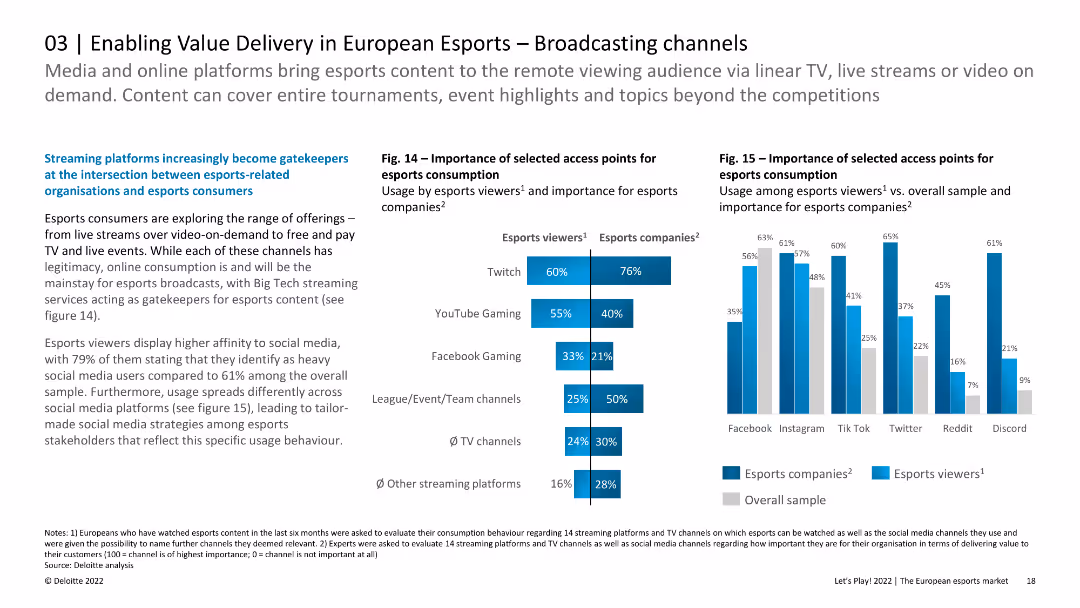
The slide includes column charts showing the importance of access points for esports consumption and usage among viewers. The layout is detailed and informative.
Strategic Planning
Media & Entertainment
The slide explores the role of various broadcasting channels in esports consumption in Europe, emphasizing the dominance of Twitch and YouTube Gaming. It discusses the importance of different access points for both viewers and esports companies.
Esports, Broadcasting, Channels, Europe, Consumption
false
Strategic Planning
Media & Entertainment
Multiple Chart
Deloitte
Add to my slides
Remove from favorites
Previous
Next
You don't have any favorites yet.
Please wait loading your favorites slides...
Create a FREE account to continue browsing
Receive Instant Access to 1,000+ slides from companies like McKinsey, Google, and Goldman Sachs
First Name
Last Name
Email
Password
I agree to all
Terms & Privacy Policy
Thank you! Your submission has been received!
Oops! Something went wrong while submitting the form.
Have an account?
Sign in
Upgrade to PRO to Save slides
Advanced Search and Filters
Access to 15,000+ slides
Access to Category Pages
Save/Bookmark Slides
PowerPoint Template Library
Pick a Plan
MONTHLY
$12/month
Billed every month, Cancel anytime.
YEARLY
$9/year
Billed $108 annually, Cancel anytime.
Checkout for $12/month
Checkout for $108/yr
Secured by Stripe | AES-256 bit encryption