My Account
My Slides
Search by Category
Companies
Slide Type
Use Case
Industry
Pricing
Templates
View All Templates
Download Template Slides
✦ AI
AI Prompt Library
AI Search
Feedback
Login
Logout
Get Started
Browse all Slides
Browse all Slides
Create a FREE Account
Instant access to 1,000+ real slides from top companies like McKinsey, BCG, Goldman Sachs, Google and many more!
First Name
Last Name
Email
Password
I agree to all
Terms & Privacy Policy
Thank you! Your submission has been received!
Oops! Something went wrong while submitting the form.
Have an account?
Sign in
Saved Slides
Total No. of slides saved
0
↻ Refresh
✖ Clear all
Column chart detailing adjusted pre-tax income/loss and adjustments for various divisions.
Financial Performance
Financial Services
Analyzes the financial performance of Credit Suisse in 4Q22, focusing on losses due to Investment Bank performance.
financial performance, net loss, investment bank, client activity, pre-tax income
false
Financial Performance
Financial Services
Single Chart
Credit Suisse
Add to my slides
Remove from favorites
This slide includes a column chart showing the organic growth in Zone AOA from 2013 to 2022, a small line chart for 10-year organic growth average, and a bar chart for underlying TOP margin comparison between 2013 and 2022.
Financial Performance
Consumer Goods
Summarizes the decade-long financial and operational performance in Zone AOA, highlighting consistent organic growth and profitability improvements. Useful for historical performance reviews and future forecasting in these regions.
financial performance, organic growth, profitability, historical data, AOA
false
Financial Performance
Consumer Goods
Multiple Chart
Deutsche Bank
Add to my slides
Remove from favorites
This slide includes two column charts comparing the budget outlook and profitability/EBITDA margin outlook for public hospitals by region and private hospitals.
Financial Performance
Healthcare & Pharmaceuticals
This slide compares the financial performance of public and private hospitals across different regions, highlighting Vietnam and Indonesia as top performers.
financial performance, public hospitals, private hospitals, regional comparison, budget outlook
false
Financial Performance
Healthcare & Pharmaceuticals
Multiple Chart
LEK
Add to my slides
Remove from favorites
Includes column charts depicting financial performance metrics for 9M 2022 and 9M 2023 with comparative analysis and descriptive annotations.
Financial Performance
Financial Services
Analyzes the bank's financial performance showing a trend in pre-provision profit and other key financial metrics over nine months, highlighting operational efficiencies and strategic financial management.
Financial Performance, Resilience, Profit, Trends, Metrics, 2023
false
Financial Performance
Financial Services
Mixed Chart
Deutsche Bank
Add to my slides
Remove from favorites
Multiple column charts illustrating the bank's financial metrics over years, including return on equity and cost/income ratio.
Financial Performance
Financial Services
Reflects the bank's financial performance with emphasis on return on equity, cost management, and capital ratios, highlighting achieved targets and strategic outcomes.
financial performance, return on equity, cost management, capital ratios, targets, bank
false
Financial Performance
Financial Services
Multiple Chart
Deutsche Bank
Add to my slides
Remove from favorites
Features column charts showcasing 'Strong Returns', 'Cost Saves', 'Low Volatility', and 'Potential for Better Revenue Growth', with annotations and comparison to peers. The slide uses varying shades to differentiate the data points.
Financial Performance
Financial Services
The slide compiles key financial performance indicators, such as returns, cost savings, and volatility, to underscore the company’s momentum. It also projects potential revenue growth areas, positioning the company as a strong player in the financial industry.
Financial Performance, Returns, Cost Savings, Volatility, Revenue Growth
false
Financial Performance
Financial Services
Multiple Chart
Goldman Sachs
Add to my slides
Remove from favorites
Slide includes column charts of revenue and balance sheet metrics across periods, and a line graph illustrating profitability trends.
Financial Performance
Financial Services
Provides a financial overview showcasing growth in revenue and assets, aimed at stakeholders interested in corporate financial health and performance metrics.
financial, performance, revenue, growth, assets
false
Financial Performance
Financial Services
Multiple Chart
Barclays
Add to my slides
Remove from favorites
Includes multiple column charts all detailing financial metrics such as revenue growth, CIR development, and capital ratios in a clear, organized manner.
Financial Performance
Financial Services
Presents the bank's financial performance in the current year, showing revenue growth, efficiency metrics, and capital management, suitable for reviewing year-to-date financial health.
financial, performance, revenue, growth, CIR, capital, ratios, year-to-date, efficiency, metrics
false
Financial Performance
Financial Services
Multiple Chart
Deutsche Bank
Add to my slides
Remove from favorites
The slide is densely packed with column charts representing various financial metrics over three years, such as revenue, net income, and return on equity. The layout separates these data sets clearly, making it easy to compare year-over-year performance.
Financial Performance
Financial Services
This slide offers a comprehensive view of JPMorgan's financial outcomes in 2018, showcasing growth in key performance metrics.
financial performance, revenue, net income, ROE, banking, client engagement, deposits, loans
false
Financial Performance
Financial Services
Multiple Chart
JP Morgan
Add to my slides
Remove from favorites
This slide has a clear, comparative layout with arrows pointing to lists of key strengths on both sides. The center features a dashed outline with financial target percentages. It is visually balanced and easy to interpret.
Financial Performance
Financial Services
The slide presents JPMorgan Chase & Co.'s strategic advantages and financial targets, likely used to convey the company's robustness and medium-term financial goals to stakeholders.
financial, performance, ROTCE, overhead ratio, CET1 ratio, global, diversified
false
Financial Performance
Financial Services
Framework
JP Morgan
Add to my slides
Remove from favorites
Complex visual with column charts tracking quarterly financial data such as income, costs, and profitability metrics, specifically focusing on return on tangible equity (RoTE).
Financial Performance
Financial Services
Highlights the financial performance of Barclays UK in Q423, emphasizing profitability and efficiency in various banking services.
financial performance, RoTE, Barclays, Q423, banking, profitability, costs, income
false
Financial Performance
Financial Services
Multiple Chart
Barclays
Add to my slides
Remove from favorites
Slide contains column chart and data points representing financial performance metrics for FY23.
Financial Performance
Financial Services
Detailed annual financial performance review of FY23, focusing on key metrics such as RoTE, income, and costs, beneficial for financial analysis and shareholder reports.
financial, performance, RoTE, income, costs
false
Financial Performance
Financial Services
Mixed Chart
Barclays
Add to my slides
Remove from favorites
The slide features a table and a column chart presenting 2022 performance data against targets set at the 2022 Investor Day, with future outlooks. Color differentiation is used to distinguish between various types of data and forecasts, with textual annotations for clarification.
Financial Performance
Financial Services
Provides a comprehensive review of a financial firm's performance relative to its targets, showing areas of growth and projections for future earnings. It could serve to evaluate business performance, communicate financial results to stakeholders, or strategize for upcoming fiscal periods.
financial performance, targets, investor day, revenue growth
false
Financial Performance
Financial Services
Single Chart
JP Morgan
Add to my slides
Remove from favorites
This slide is dominated by a large, purple column chart that breaks down total spending into categories such as engineering, support, and infrastructure. Text boxes provide context and outline opportunities for development excellence and technology modernization.
Financial Performance
Financial Services
Explores financial strategies aimed at leveraging technology and development practices to enhance productivity and manage expense growth.
Financial Performance, Technology Modernization, Strategic Planning, Financial Services, Productivity, Cost Efficiency
false
Financial Performance
Financial Services
Mixed Chart
JP Morgan
Add to my slides
Remove from favorites
Column charts comparing YTD financial results with previous years, highlighted with key financial metrics.
Financial Performance
Financial Services
Summarizes Deutsche Bank's YTD financial performance for 2023, including pre-provision profit and risk management statistics.
financial performance, YTD results, banking, revenue growth, risk management
false
Financial Performance
Financial Services
Mixed Chart
Deutsche Bank
Add to my slides
Remove from favorites
Contains column chart and bullet points demonstrating revenue trajectories and growth drivers for upcoming years. Emphasizes areas like Corporate Bank and Investment Bank, with annotations for projected growth.
Financial Performance
Financial Services
Details the bank's strategic positioning and expected revenue growth, focusing on specific financial services sectors and strategies for diversification and resilience in market positioning.
financial planning, revenue growth, strategic positioning, diversification, banking
false
Financial Performance
Financial Services
Mixed Chart
Deutsche Bank
Add to my slides
Remove from favorites
This slide features arrows ranking five spending priorities in descending order, with annotations on budget allocation percentages and specific focus areas like old age grants.
Regulatory and Compliance
Government & Public Sector
Outlines the government's top financial priorities and the strategic allocation of funds to these areas.
Financial priorities, budget allocation, strategic planning
false
Regulatory and Compliance
Government & Public Sector
Linear Flow
PwC/Strategy&
Add to my slides
Remove from favorites
This slide contains a large heading, three primary metric highlights, and three pie charts displaying product lines, geographies, and revenue models. The slide is visually balanced with significant use of purple.
Financial Performance
Healthcare & Pharmaceuticals
Highlights the financial performance and distribution of QuidelOrtho's Point of Care Business Unit for Q3 2023. It includes revenue figures, product line distribution, geographical reach, and revenue models.
Financial, Product, Geography, Revenue, Healthcare
false
Financial Performance
Healthcare & Pharmaceuticals
Multiple Chart
JP Morgan
Add to my slides
Remove from favorites
The slide uses imagery of smartphones and a desktop to showcase digital banking tools, along with checklists and icons for services offered. It has a blue and white corporate design.
Product and Service Analysis
Financial Services
Details Chase's array of financial products and services tailored for small businesses, highlighting banking and cash management, lending, and merchant services. The slide is designed to analyze product offerings and digital banking services.
Financial products, Services, SMB, Chase, Digital banking, Cash management, Lending, Merchant services, Business tools, Analysis
false
Product and Service Analysis
Financial Services
Table
JP Morgan
Add to my slides
Remove from favorites
The slide features financial figures, including a large orange free cash flow number, a column chart for debt maturity, and text for undrawn credit lines. The layout is data-centric and clearly presented.
Financial Performance
Financial Services
The slide presents Ipsos' strong financial profile, highlighting free cash flow, low net debt, and available credit lines, emphasizing financial stability and sound management.
financial profile, cash flow, debt maturity, credit lines, stability
false
Financial Performance
Financial Services
Mixed Chart
IPSOS
Add to my slides
Remove from favorites
Includes a bar chart and multiple column charts representing financial projections and synergy estimates post-acquisition, presented in a clear, structured manner.
Financial Performance
Financial Services
Provides detailed financial projections following Faurecia's acquisition of Clarion, emphasizing expected synergies and EPS growth, and showcasing the financial strategy and its expected outcomes.
financial projections, synergies, EPS, growth, strategy, acquisition
false
Financial Performance
Financial Services
Multiple Chart
Deutsche Bank
Add to my slides
Remove from favorites
This slide includes two column charts showing budget outlook and profitability/EBITDA margin outlook for public and private hospitals over three timeframes.
Financial Performance
Healthcare & Pharmaceuticals
This slide analyzes the financial prospects for public and private hospitals, comparing their budget outlook and profitability margins for the past, present, and future.
financial prospects, public hospitals, private hospitals, budget outlook, profitability
false
Financial Performance
Healthcare & Pharmaceuticals
Multiple Chart
LEK
Add to my slides
Remove from favorites
The slide features a vertical column chart detailing the loss-absorbing capacity in various capital tiers, complemented by bullet points explaining the relevance and regulatory implications. The design is straightforward with a clear focus on data presentation.
Regulatory and Compliance
Financial Services
Explains the protective measures in place for depositors and counterparties through loss-absorbing capacity in financial contexts, crucial for discussions on financial stability and regulatory compliance.
financial protection, compliance, banking, capital
false
Regulatory and Compliance
Financial Services
Mixed Chart
Deutsche Bank
Add to my slides
Remove from favorites
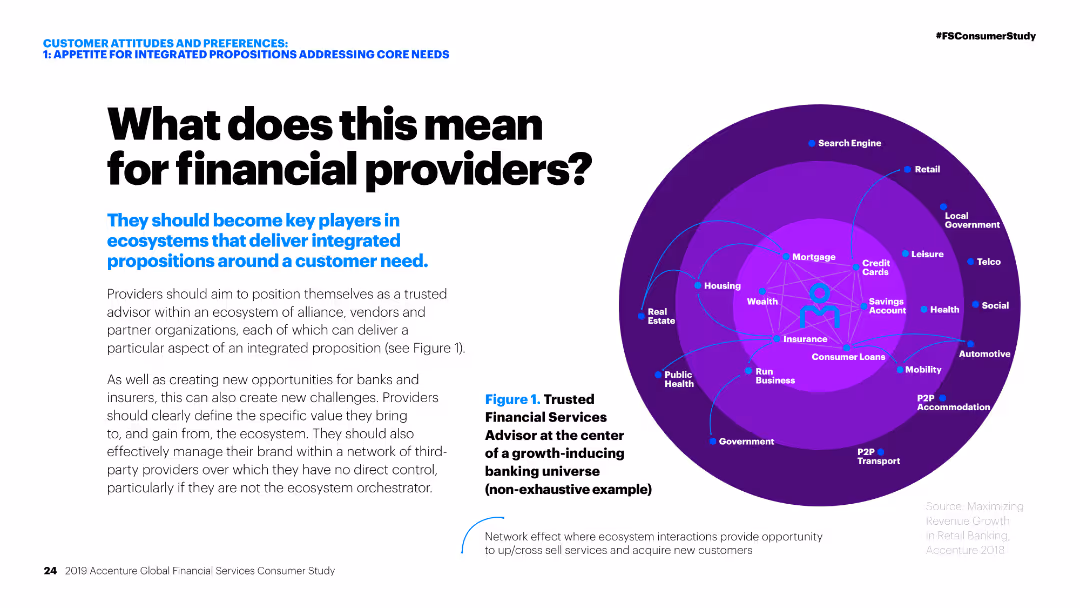
Diagram of a trusted financial services advisor at the center of a growth-inducing banking universe.
Strategic Planning
Financial Services
Strategic implications for financial providers to become key players in ecosystems delivering integrated propositions around customer needs.
Financial providers, strategy, ecosystems, integrated propositions, customer needs, financial services, growth, strategic planning, ecosystem orchestrator
false
Strategic Planning
Financial Services
Diagram
Accenture
Add to my slides
Remove from favorites
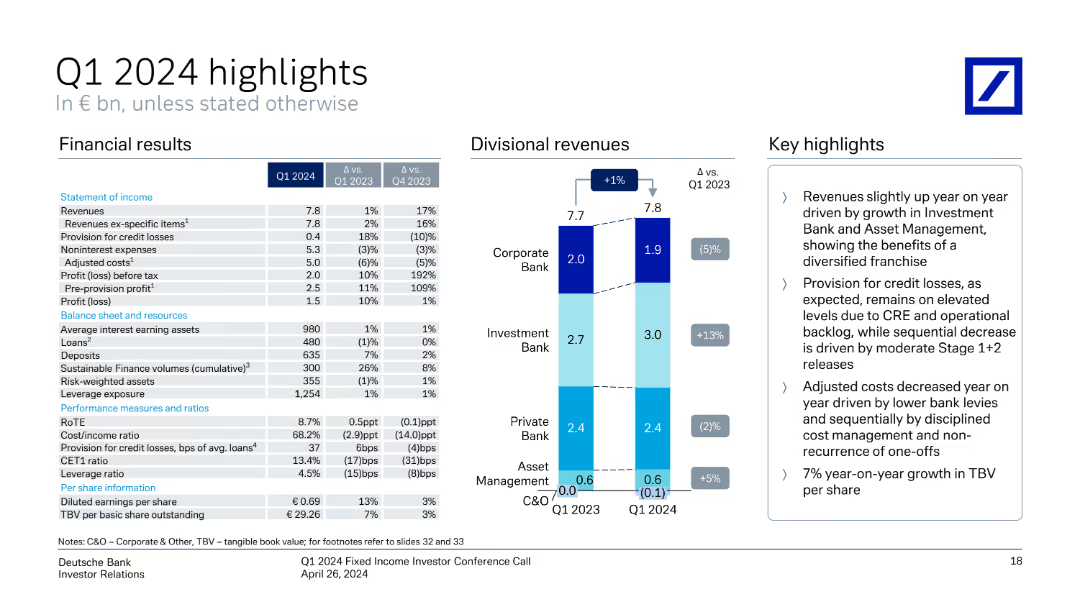
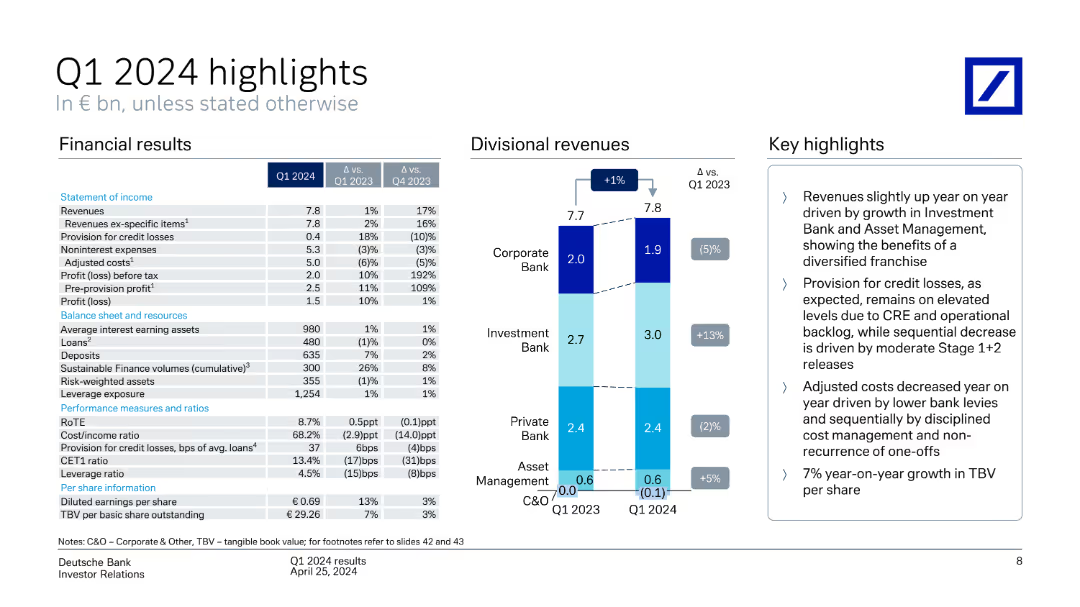
This slide has a column chart showing divisional revenues and a table with financial results for Q1 2024, with key highlights on the right.
Financial Performance
Financial Services
The slide summarizes Q1 2024 financial results, including revenues, profit, balance sheet metrics, and divisional revenues, with key insights.
financial, Q1 2024, highlights, revenue, profit, divisional, results, analysis, metrics, Deutsche Bank
false
Financial Performance
Financial Services
Mixed Chart
Deutsche Bank
Add to my slides
Remove from favorites
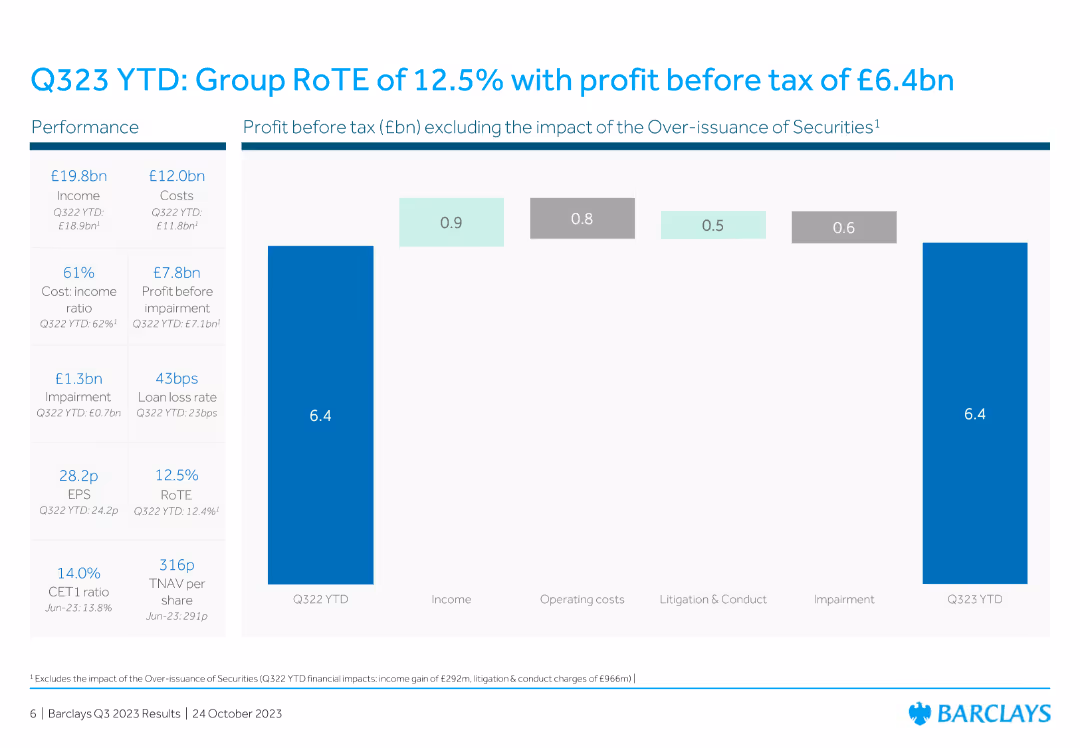
The slide contains a column chart with five vertical bars representing profit before tax (£bn) excluding the impact of the over-issuance of securities. There is also a performance summary with financial metrics on the left side.
Financial Performance
Financial Services
The slide presents Barclays' financial performance for Q323 YTD, highlighting a Group RoTE of 12.5% and profit before tax of £6.4bn. It also includes various financial ratios and metrics.
Financial, Q323, profit, RoTE, metrics
false
Financial Performance
Financial Services
Mixed Chart
Barclays
Add to my slides
Remove from favorites
This slide presents a comparison of ratings from different agencies over time using a simple bar chart and lists to highlight improvements.
Financial Performance
Financial Services
Discusses the improvement in financial ratings of a bank, signifying successful business transformations and enhanced financial stability.
financial ratings, improvement, transformation, stability
false
Financial Performance
Financial Services
Table
Deutsche Bank
Add to my slides
Remove from favorites
Contains bullet points and column chart comparing different capital requirement metrics with annotations explaining surplus and deficits.
Regulatory and Compliance
Financial Services
Analyzes compliance with MREL/TLAC financial regulations, displaying the bank's capital against required thresholds, highlighting surpluses and shortages.
financial regulation, compliance, capital requirements, banking
false
Regulatory and Compliance
Financial Services
Multiple Chart
Deutsche Bank
Add to my slides
Remove from favorites
This slide features two sets of column charts comparing fiscal year results with annotations explaining each financial figure. The color red is used for textual emphasis and outlining chart areas.
Financial Performance
Industrial & Manufacturing
It's a financial report slide transitioning from EBITA to net results, showing year-over-year changes. Such a slide would be used in financial presentations to stakeholders to outline the company’s financial health and operational results.
Financial Report, EBITA, Net Result, Fiscal Year, Corporate Finance
false
Financial Performance
Industrial & Manufacturing
Multiple Chart
Goldman Sachs
Add to my slides
Remove from favorites
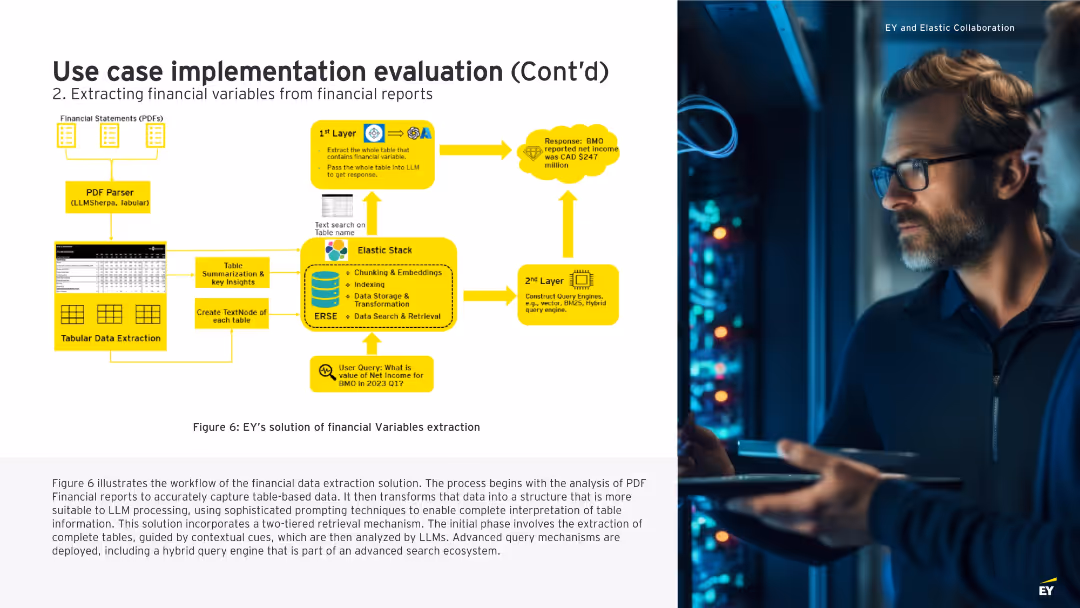
Left side includes a flowchart of the data extraction pipeline from PDFs; right side shows a man working in a tech environment.
Technology and Digital Transformation
Financial Services
Describes EY’s two-tiered approach for extracting financial data from PDF reports. The process involves parsing, summarizing tables, using embeddings for data indexing, and applying a hybrid search engine for context-aware query results. This automated pipeline enables efficient, structured financial data analysis through LLM-based techniques.
financial reports, LLM, AI, table extraction, hybrid retrieval, Elastic stack, EY
false
Technology and Digital Transformation
Financial Services
Diagram
EY
Add to my slides
Remove from favorites
Slide contains a column chart, text sections, and icons in blue and black palette. The layout is dense, presenting financial data and metrics in a visually organized manner.
Financial Performance
Financial Services
The slide presents data on PPNR margin, loan loss reserve, capital ratios, and credit mix. It describes improvements in financial resilience, underwriting, proactive management, and recession readiness, intended for financial analysis and investor communications.
financial resilience, PPNR, loan loss, capital ratios, credit mix
false
Financial Performance
Financial Services
Mixed Chart
Barclays
Add to my slides
Remove from favorites
This slide features a dark background, a pie chart illustrating revenue distribution, a column chart showing return on equity, and stats on firmwide revenues and shareholder returns.
Financial Performance
Financial Services
Illustrating financial resilience, this slide provides a revenue breakdown and return on equity over different market conditions, reflecting performance stability.
financial resilience, revenue distribution, return on equity, market conditions, net revenues, shareholder returns, firmwide performance
false
Financial Performance
Financial Services
Multiple Chart
Goldman Sachs
Add to my slides
Remove from favorites
The slide presents a column chart of CET1 capital and charts on risk-weighted assets and leverage ratio denominator.
Operational Efficiency
Financial Services
It illustrates significant reductions in financial resource consumption, showcasing CET1 capital and risk-weighted assets metrics.
financial resources, CET1 capital, risk-weighted assets, leverage, reductions
false
Operational Efficiency
Financial Services
Multiple Chart
UBS
Add to my slides
Remove from favorites
A bar chart comparing Millennials and Gen Z on financial responsibility, with various metrics such as budgeting, knowledge level, and financial goals.
Financial Performance
Financial Services
The slide highlights the financial responsibility of Millennials and Gen Z, comparing their budgeting habits, knowledge, and financial goal setting.
Financial responsibility, Millennials, Gen Z, budgeting, financial knowledge, financial goals, comparison, financial habits
false
Financial Performance
Financial Services
Mixed Chart
Deloitte
Add to my slides
Remove from favorites
Features two column charts showing the distribution of liabilities and capital before and after restructuring, using different colors for each category and labeled axes.
Financial Performance
Financial Services
This slide shows financial restructuring impacts, displaying reduced liabilities and new capital distribution, essential for understanding the company's financial health and stability post-restructuring.
financial restructuring, liabilities, capital, stability
false
Financial Performance
Financial Services
Mixed Chart
Barclays
Add to my slides
Remove from favorites
This slide features a three-step horizontal process diagram with accompanying text. Icons indicate a 2x, 3x, and >5x increase, respectively. The layout is balanced and clean.
Financial Performance
Financial Services
The slide presents a comparative analysis of early financial results in 2021 versus 2019, showcasing gains in three strategic areas: Gaining Access, Building Trust, and Supporting Migration to Advice.
Financial results, Comparative analysis, Trust, Access, Advice
false
Financial Performance
Financial Services
Linear Flow
Goldman Sachs
Add to my slides
Remove from favorites
A column chart showing divisional revenues, a table with financial results, and key highlights on the right. The slide is moderately dense with a balanced mix of text and visual elements.
Financial Performance
Financial Services
The slide presents Q1 2024 financial highlights for Deutsche Bank, including revenue, profit, and balance sheet metrics. It compares performance across different divisions and provides key insights.
Financial results, divisional revenues, profit, revenue, Q1 2024 highlights
false
Financial Performance
Financial Services
Mixed Chart
Deutsche Bank
Add to my slides
Remove from favorites
A slide comparing key financial metrics over three years, with blue column charts and tabular data representation.
Financial Performance
Financial Services
Analyzes JPMorgan Chase & Co.'s financial performance in 2019, emphasizing growth and client relationships.
Financial results, JPMorgan Chase, client focus, revenue growth, banking performance, comparative analysis, yearly metrics, business development
false
Financial Performance
Financial Services
Multiple Chart
JP Morgan
Add to my slides
Remove from favorites
The slide has a clean and organized design with column chart and table sections. It contrasts financial results across quarters, showing trends and changes in revenue, earnings, and profitability metrics. The use of blue hues emphasizes the financial data points.
Financial Performance
Financial Services
This slide provides an overview of financial results, comparing quarter-on-quarter and year-to-date performances. It is designed for investors or management to gauge the financial health and performance trends of the company, with a focus on revenues and earnings.
financial results, net revenues, earnings, year-to-date, overview
false
Financial Performance
Financial Services
Mixed Chart
Goldman Sachs
Add to my slides
Remove from favorites
The slide features a bar chart and table displaying financial results, specifically profit and loss data.
Financial Performance
Financial Services
Slide provides financial results for the 'Corporate & Other' segment, detailing profit/loss before tax, and highlighting impacts from funding, liquidity, legacy portfolios, and shareholder expenses. Major losses and minor gains are outlined.
financial results, profit loss, corporate, Q1 2023
false
Financial Performance
Financial Services
Mixed Chart
Deutsche Bank
Add to my slides
Remove from favorites
This slide is dense with column charts showing yearly financial results like adjusted revenues, net income, and overhead ratios, annotated with percentage changes and ROE indicators. Color-coded for clarity.
Financial Performance
Financial Services
The slide provides an overview of JP Morgan Chase's financial performance over several years, highlighting the record year in 2018. It is likely intended to communicate the company's robust financial health and trends in revenue and net income to stakeholders.
Financial Results, Revenue, Net Income, Overhead Ratio, Record Year, Trend Analysis, ROE, Banking, Financial Services, JP Morgan Chase, Performance Review
false
Financial Performance
Financial Services
Single Chart
JP Morgan
Add to my slides
Remove from favorites
The slide features a column chart illustrating Asset Management pre-tax income growth from 2015 to 3Q18. The layout is clear with blue and white tones and a comparison table on the right highlighting key financial metrics.
Financial Performance
Financial Services
This slide showcases the financial success of the asset management strategy, highlighting pre-tax income growth, adjusted PTI, RoE, AuM, and NNA. It underscores the strategic execution with impressive financial metrics.
Financial Results, Strategy, Asset Management, Pre-tax Income, Metrics
false
Financial Performance
Financial Services
Mixed Chart
Credit Suisse
Add to my slides
Remove from favorites
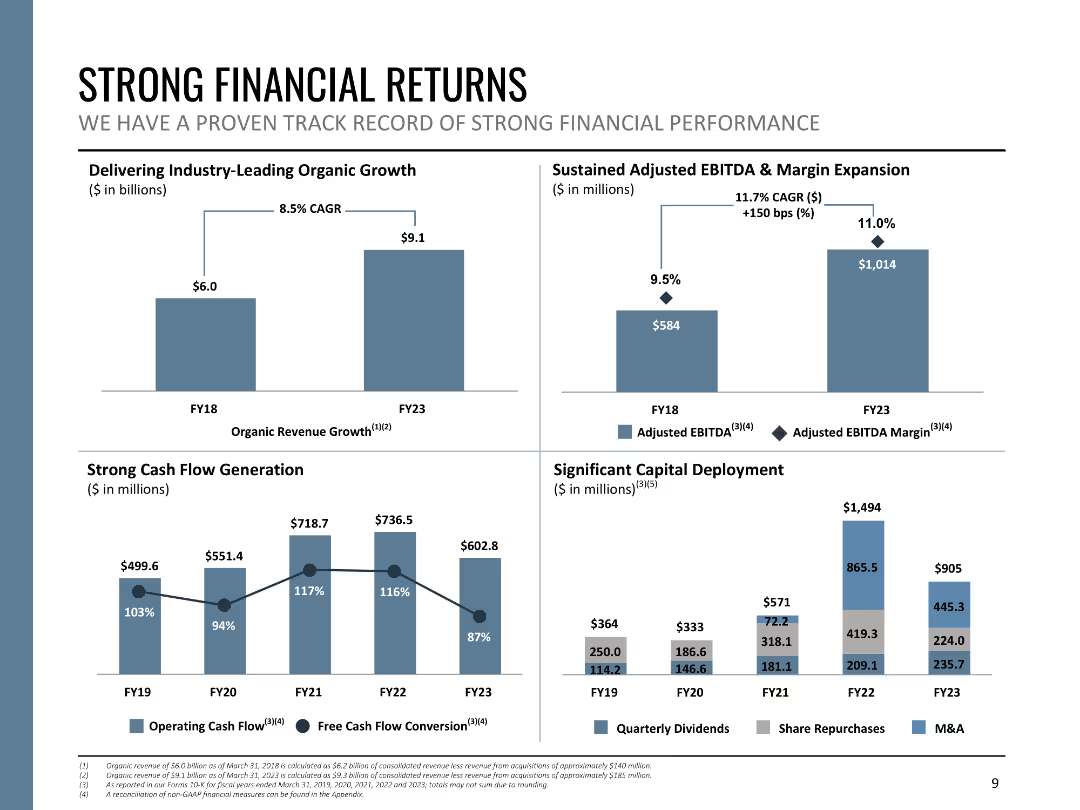
The slide includes four column charts displaying financial metrics such as organic revenue growth, adjusted EBITDA, cash flow generation, and capital deployment from FY18 to FY23. Each chart is clearly labeled with distinct colors and values.
Financial Performance
Financial Services
This slide presents Booz Allen's financial performance, showcasing strong organic growth, EBITDA margin expansion, cash flow generation, and significant capital deployment. It demonstrates the company's robust financial health and strategic investments.
financial returns, growth, EBITDA, cash flow, capital deployment
false
Financial Performance
Financial Services
Multiple Chart
Booz Allen Hamilton
Add to my slides
Remove from favorites
This slide displays three sets of column charts showing trends over fiscal years for net profit contribution, base fees, and assets under management (AUM). The design is clean with a focus on data presentation, using contrasting greens to differentiate data points. The layout is simple and effective.
Financial Performance
Financial Services
The slide is a financial performance review for Macquarie Asset Management, tracking net profit, fees, and AUM over several years. It is typically used for financial analysis, showcasing growth and financial health to stakeholders, and supporting discussions on strategic financial decisions.
financial review, Macquarie Asset Management, net profit, fees, assets under management, growth trends, strategic planning, financial health
false
Financial Performance
Financial Services
Multiple Chart
Morgan Stanley
Add to my slides
Remove from favorites
Multiple column charts and numerical data presenting financial results, turnover rates, and operational efficiencies, emphasizing the firm's growth and stability.
Strategic Planning
Professional Services
This slide reviews the financial and operational highlights of a consultancy firm, showing areas of growth, stability in staff turnover, and strategic outsourcing.
financial review, turnover, growth, bar chart
false
Strategic Planning
Professional Services
Multiple Chart
PwC/Strategy&
Add to my slides
Remove from favorites
Features dual column charts contrasting leverage exposure and risk-weighted assets across different categories such as derivatives and lending, with detailed annotations regarding changes over quarters.
Risk Assessment and Management
Financial Services
Analyzes the bank’s financial stability and exposure by showing detailed leverage and risk metrics, crucial for understanding the bank's financial health and strategic risk management.
financial, risk, assets, leverage, banking
false
Risk Assessment and Management
Financial Services
Multiple Chart
Deutsche Bank
Add to my slides
Remove from favorites
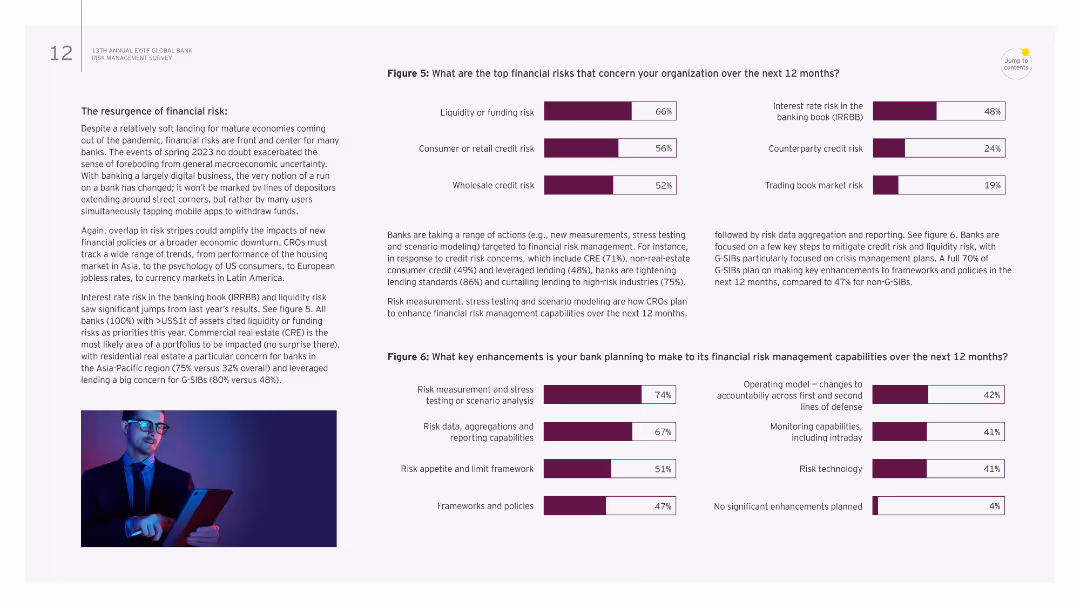
The slide includes text and two column charts on the right. The charts have horizontal bars showing the percentages of top financial risks and key enhancements.
Risk Assessment and Management
Financial Services
It highlights concerns over financial risks such as liquidity and credit risks, and outlines planned enhancements in financial risk management.
Financial risk, liquidity, credit risk, risk management, enhancements
false
Risk Assessment and Management
Financial Services
Multiple Chart
EY
Add to my slides
Remove from favorites
The slide features a two-column layout with a title and text explaining the key enhancements in financial risk management planned for the next 12 months, supported by a column chart.
Financial Performance
Financial Services
This slide presents planned enhancements in financial risk management, such as stress testing, risk measurement, and data aggregation, to improve financial stability.
financial risk management, enhancements, stress testing, risk measurement, data aggregation
false
Financial Performance
Financial Services
Mixed Chart
EY
Add to my slides
Remove from favorites
Slide with multiple pie charts and bullet points. Clean layout with distinct sections for commercial, consumer loans, investment portfolio, and long-term debt.
Financial Performance
Financial Services
This slide is structured to provide an overview of a company's loan distribution and investment portfolio details as of a specific date. It's used for financial analysis and to communicate financial health and strategy to stakeholders or investors.
Financials, Analysis, Loans, Portfolio, Debt
false
Financial Performance
Financial Services
Multiple Chart
Morgan Stanley
Add to my slides
Remove from favorites
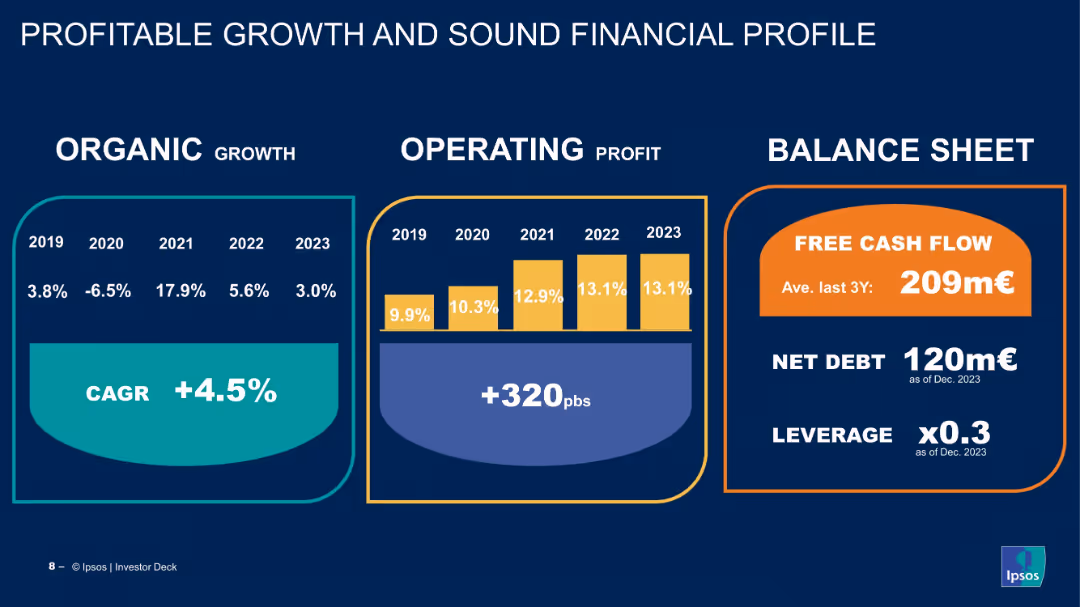
Three-panel infographic showing organic growth, operating profit, and balance sheet strength.
Financial Performance
Financial Services
The slide presents financial metrics from 2019–2023, demonstrating consistent operating margin growth and healthy cash flow, debt, and leverage indicators, reinforcing Ipsos’ financial strength.
financials, CAGR, profit margin, free cash flow, leverage, organic growth, Ipsos, performance metrics, investor information
false
Financial Performance
Financial Services
Mixed Chart
IPSOS
Add to my slides
Remove from favorites
This slide compares 'Updated' and 'Previous' financial scenarios for the year 2023, focusing on volumes, cost inflation, net price-mix vs. cost inflation factors, cash-out capex, segment operating income, and free cash flow. It uses a tabular layout with color-coded text to distinguish between the updated and previous figures. The background is a subtle gradient with the Michelin logo.
Financial Performance
Financial Services
The content outlines revised financial expectations for 2023, including volume projections and cost inflation. It provides updated guidance on cash flow and operating income, indicating the company's financial direction and strategic planning insights. The slide is likely used to communicate to stakeholders or in financial planning sessions to discuss financial health and expectations.
financial, scenario, guidance, volumes, inflation, income, cash flow, Michelin, performance, strategy
false
Financial Performance
Financial Services
Table
Morgan Stanley
Add to my slides
Remove from favorites
Features two column charts comparing estimated contract values and contract awards from 2016 to 2019, annotated with statistical data. There's also a key at the bottom for color references.
Financial Performance
Energy & Utilities
This slide provides financial data on the growth and success of integrated contracts and specific subsea projects under the Subsea Integration Alliance, highlighting significant industry collaboration and achievements.
financials, contracts, growth, subsea, integration
false
Financial Performance
Energy & Utilities
Multiple Chart
Barclays
Add to my slides
Remove from favorites
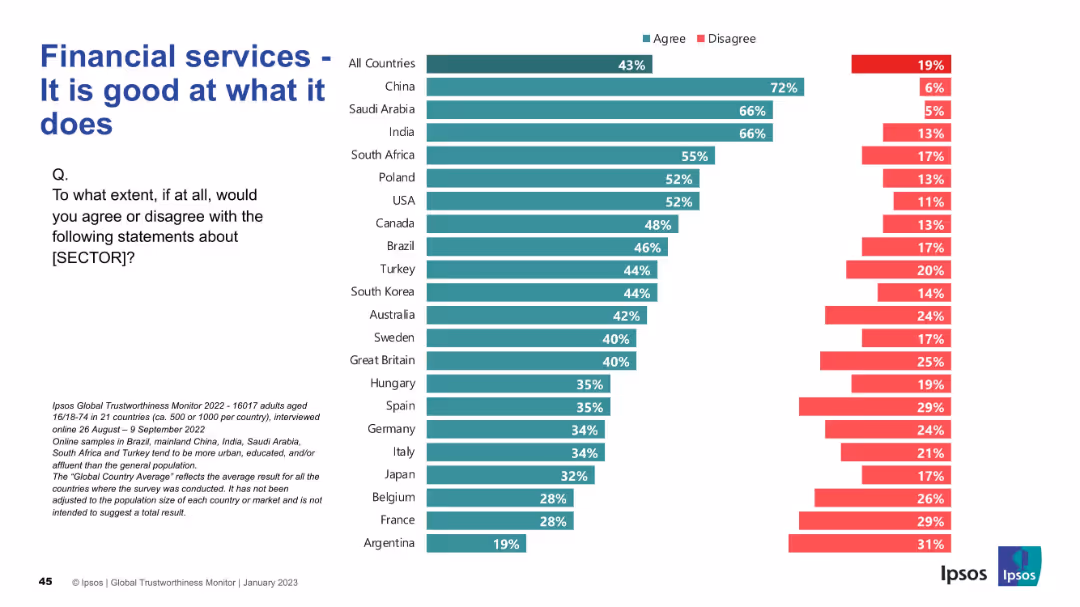
Bar chart split by "Agree" and "Disagree" responses by country; simple layout with clean segmentation
Strategic Planning
Financial Services
This slide presents a global perception of the financial services sector’s competence. China, India, and Saudi Arabia have high agreement (66–72%), indicating strong regional trust. The average global agreement is 43%.
financial services, competence, trust, international, agreement, Ipsos, bar chart, perception, countries
false
Strategic Planning
Financial Services
Mixed Chart
IPSOS
Add to my slides
Remove from favorites
Includes a timeline graphic and images of a smartphone displaying various consumer services, highlighting key phases of consumer financial engagement.
Strategic Planning
Financial Services
Outlines Serasa's strategy to provide a broad range of financial services to Brazilians, aimed at enhancing credit access and including digital solutions like e-wallets and financial education.
financial services, credit access, Serasa, digital solutions, Brazil
false
Strategic Planning
Financial Services
Mixed Chart
Barclays
Add to my slides
Remove from favorites
This slide has four sets of column charts with data on different aspects of digital financial services (DFS) such as payments, lending, insurance, and wealth. It is color-coded and has key growth metrics annotated.
Financial Performance
Financial Services
It illustrates the growth trends of various digital financial services in Malaysia, backed by government support. The slide is useful for financial analysis and projections in the digital finance space, particularly for stakeholders interested in the fintech sector.
Financial Services, Digital, Trends, Payments, Lending, Insurance, Wealth, Malaysia
false
Financial Performance
Financial Services
Multiple Chart
Bain
Add to my slides
Remove from favorites
This slide compares Financial Services, FinTech, and IBKR across various attributes in a three-column checklist. It includes a column chart with pre-tax margin comparisons.
Market Analysis and Trends
Technology & Software
It delineates the advantages of IBKR by contrasting it with traditional financial services and FinTech, emphasizing IBKR’s unique positioning and market performance.
Financial Services, FinTech, IBKR, Comparative Analysis, Pre-tax Margins, Market Position, Checklists, Column Chart
false
Market Analysis and Trends
Technology & Software
Mixed Chart
Goldman Sachs
Add to my slides
Remove from favorites
Large central image of a smiling individual, surrounded by colorful rings and icons representing various financial services, creating a visually engaging roadmap of services.
Strategic Planning
Financial Services
Envisions a comprehensive one-stop-shop financial service platform, enhancing user experience and accessibility to a broad range of financial services from credit scoring to personal finance management.
Financial services, future, roadmap
false
Strategic Planning
Financial Services
Mixed Chart
Barclays
Add to my slides
Remove from favorites
This slide features a night image of a cityscape on the right and descriptive text with bullet points on the left. It employs a professional, balanced layout.
Industry Overview
Financial Services
Describes the global financial group's attributes, suitable for providing an overview to stakeholders or new employees.
Financial Services, Global Presence, Diverse Business, Long-term Orientation
false
Industry Overview
Financial Services
Header Vertical
Morgan Stanley
Add to my slides
Remove from favorites
This slide portrays a comparative column chart showing growth over several time points in different financial sectors such as mortgages and business loans. A gray and blue color scheme is used for visual clarity, with labels and axes clearly marking the data.
Financial Performance
Financial Services
It analyzes the growth across various portfolios within the Banking and Financial Services sector, focusing on mortgages, deposits, and loans, suitable for evaluating financial growth and portfolio management within a banking context.
financial services, growth, banking, portfolio, mortgages, deposits, loans, financial analysis, column chart
false
Financial Performance
Financial Services
Multiple Chart
Goldman Sachs
Add to my slides
Remove from favorites
The slide shows column charts, bar graphs, and numerical key performance indicators. The design is streamlined with clear visual separation of sections.
Financial Performance
Financial Services
A comprehensive review of the digital financial services in Indonesia, including payment solutions and investment platforms, aimed at financial analysts or investors interested in the fintech sector.
financial services, Indonesia, fintech, investments, digital payments
false
Financial Performance
Financial Services
Multiple Chart
Bain
Add to my slides
Remove from favorites
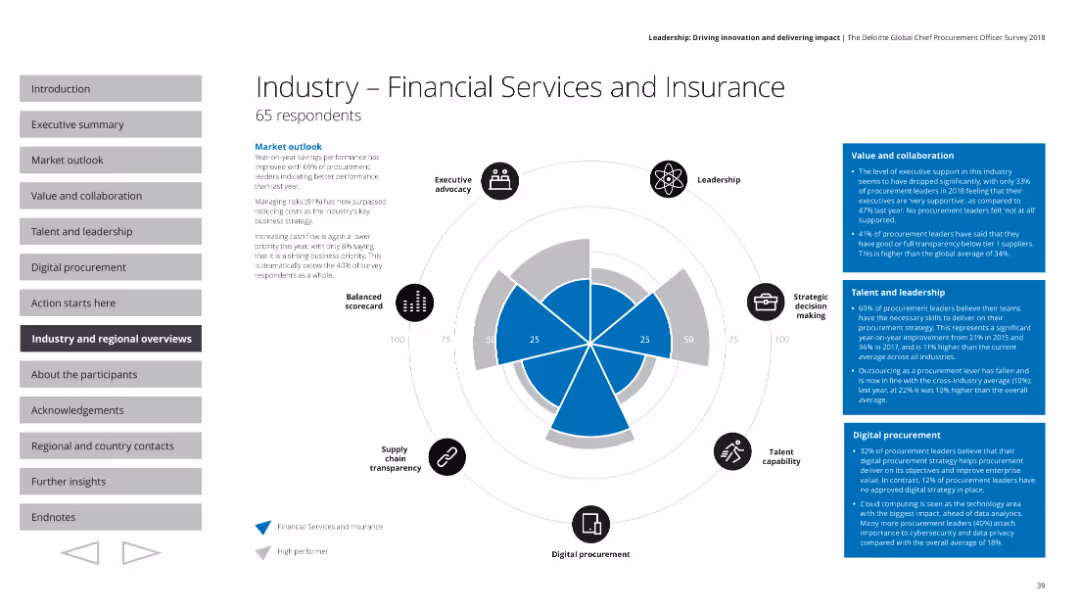
The slide contains a radar chart comparing various performance indicators. It includes small icons around the chart, text boxes with details, and a section header.
Industry Overview
Financial Services
This slide presents an overview of the financial services and insurance industry's performance based on a survey. Key aspects such as executive advocacy, leadership, strategic decision making, talent capability, digital procurement, and supply chain transparency are highlighted. It includes market outlook and specific metrics on value, collaboration, talent, and leadership.
Financial services, insurance, industry overview, radar chart, market outlook
false
Industry Overview
Financial Services
Mixed Chart
Deloitte
Add to my slides
Remove from favorites
Features pie charts and percentage breakdowns of respondents by sector and job roles within the Nigerian financial services industry.
Market Analysis and Trends
Financial Services
Analyzes the composition of survey respondents in the Nigerian financial services sector, showing major roles and industry sub-sectors.
financial services, Nigeria, survey, pie chart, sectors, respondents, analysis
false
Market Analysis and Trends
Financial Services
Mixed Chart
PwC/Strategy&
Add to my slides
Remove from favorites
Horizontal bar chart showing average number of financial products held by customers in various regions, categorized by main bank and other providers.
Market Analysis and Trends
Financial Services
Analysis of financial service products held by customers globally, highlighting the fragmentation in service provider usage across different regions.
financial services, products, customers, regions, main bank, other providers, fragmentation, analysis, global
false
Market Analysis and Trends
Financial Services
Mixed Chart
Accenture
Add to my slides
Remove from favorites
Displays a series of column charts that compare net profit contribution, BFS deposits, and loan portfolios over several fiscal years and periods.
Financial Performance
Financial Services
Evaluates the financial growth and performance of Macquarie's banking services, using comparative data on profits, deposits, and loans, essential for financial trend analysis and strategic planning.
financial services, profit contribution, deposits, loans, growth, banking, performance
false
Financial Performance
Financial Services
Multiple Chart
Goldman Sachs
Add to my slides
Remove from favorites
The slide features multiple bullet lists and bar charts arranged in a column layout.
Operational Efficiency
Financial Services
This slide details various financial advisory services like credit review, business review, and restructuring plans, outlining the scope and benefits of each to optimize business financial processes and strategies.
financial services, restructuring, credit review, advisory, strategy
false
Operational Efficiency
Financial Services
Table
Alvarez & Marsal
Add to my slides
Remove from favorites
Slide contains a header, with icons indicating types of clients. The centerpiece is a hexagonal arrangement of services provided such as "Risk", "Clearing", and "Payments", highlighted in different colors and surrounded by smaller hexagons.
Strategic Planning
Financial Services
The slide outlines the variety of financial services offered by Goldman Sachs to corporations, institutions, and individuals, emphasizing the multifaceted nature of the bank's offerings and its role as a comprehensive service provider.
financial services, risk, payments, advisory, clearing
false
Strategic Planning
Financial Services
Diagram
Goldman Sachs
Add to my slides
Remove from favorites
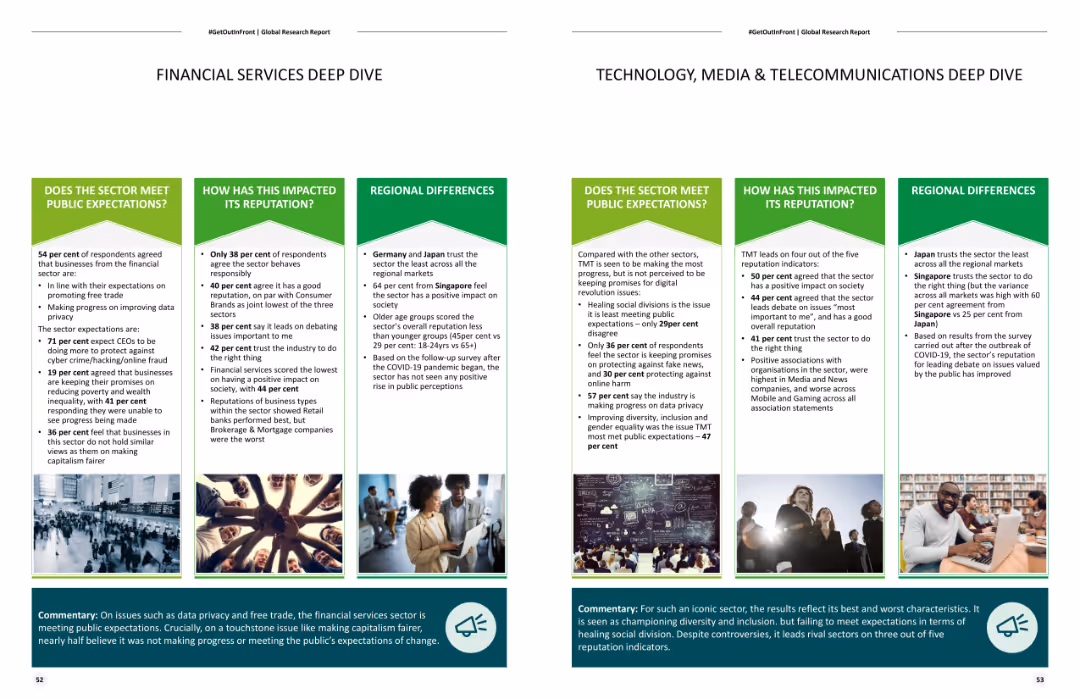
Contains detailed content and images on the public expectations and reputation impacts for the financial and TMT sectors, along with regional differences.
Industry Overview
Financial Services
Provides an in-depth analysis of the financial and TMT sectors, focusing on public expectations, reputation impacts, and regional differences in trust and perceptions.
Financial services, TMT sector, public expectations, reputation, regional differences
false
Industry Overview
Financial Services
Header Horizontal
Deloitte
Add to my slides
Remove from favorites
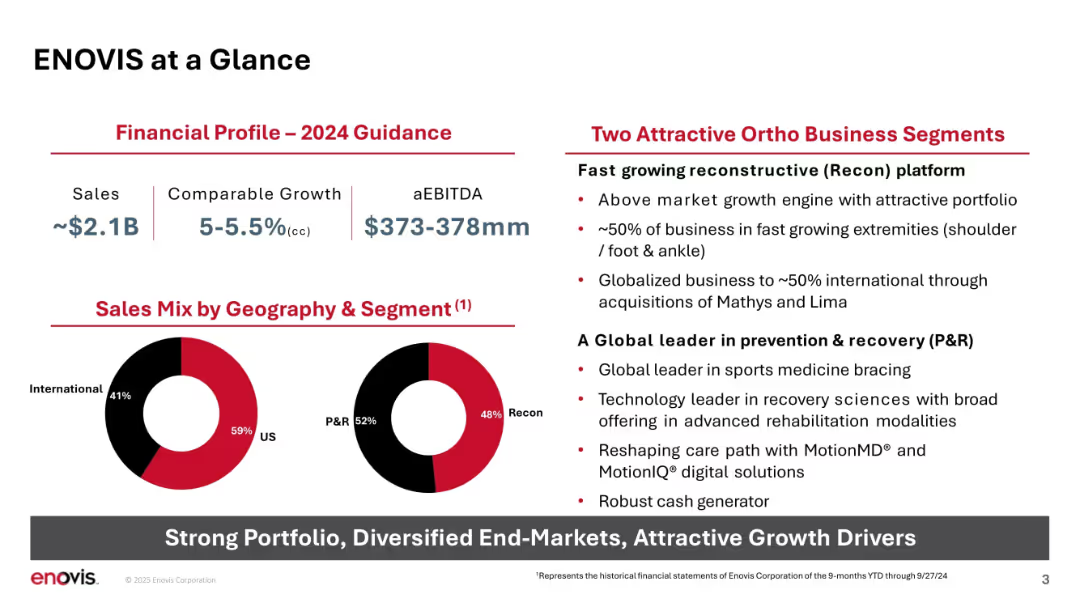
Two-column layout with financials and business segment summary; two donut charts below; red/black theme.
Strategic Planning
Healthcare & Pharmaceuticals
Provides an overview of Enovis's 2024 financial guidance, sales breakdown by geography and segment, and highlights two core business segments—Reconstructive and Prevention & Recovery. Focuses on growth, globalization, and portfolio strength.
financials, guidance, sales mix, ortho segments, growth, Recon, P&R, EBITDA, international, business overview
false
Strategic Planning
Healthcare & Pharmaceuticals
Mixed Chart
JP Morgan
Add to my slides
Remove from favorites
This slide features a combination of a line chart showing a 12-month share price trend and a data table with corporate information. The layout is clear with a concise display of financial data.
Financial Performance
Financial Services
The slide provides a snapshot of the company's financial status as of December 2018, including stock price, market capitalization, and share distribution. It serves as a financial overview for stakeholders.
financials, mining, share price, market capitalization, shareholders, company snapshot
false
Financial Performance
Financial Services
Mixed Chart
Morgan Stanley
Add to my slides
Remove from favorites
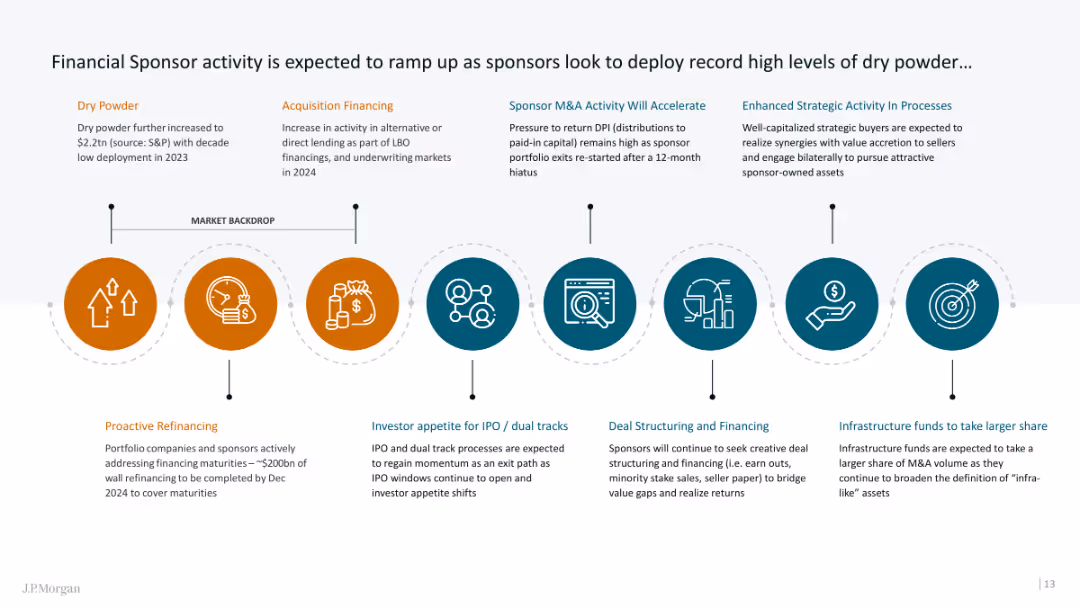
The slide contains an infographic with icons representing different aspects of financial sponsor activities and strategies.
Strategic Planning
Financial Services
It outlines the expected increase in financial sponsor activity, highlighting various financing and strategic planning elements.
Financial sponsor, dry powder, strategic planning, infographic, financing
false
Strategic Planning
Financial Services
Linear Flow
JP Morgan
Add to my slides
Remove from favorites
Displays a column chart comparing investment banking revenue from financial sponsors over a decade and a checklist of rankings in different service areas. The design is clean with blue accents and white background.
Client Case Studies
Financial Services
This slide indicates growth in investment banking revenue from financial sponsors and highlights top rankings in M&A, equity underwriting, and high-yield bonds, suitable for investor relations or showcasing client relationship strengths to stakeholders.
Financial sponsors, investment banking, revenue growth, M&A, rankings
false
Client Case Studies
Financial Services
Single Chart
Goldman Sachs
Add to my slides
Remove from favorites
Left: detailed financial table; Right: stacked bar chart of division revenues; Top-right: bullet point summary. Balanced, text-heavy layout.
Financial Performance
Financial Services
Details Q1 2024 results including €7.8bn revenue, €2.5bn pre-provision profit, and €1.5bn net profit. Highlights growth in Investment Bank and Asset Management, improved cost management, and increased TBV per share.
financials, Q1 2024, revenue, costs, TBV, divisional performance
false
Financial Performance
Financial Services
Mixed Chart
Deutsche Bank
Add to my slides
Remove from favorites
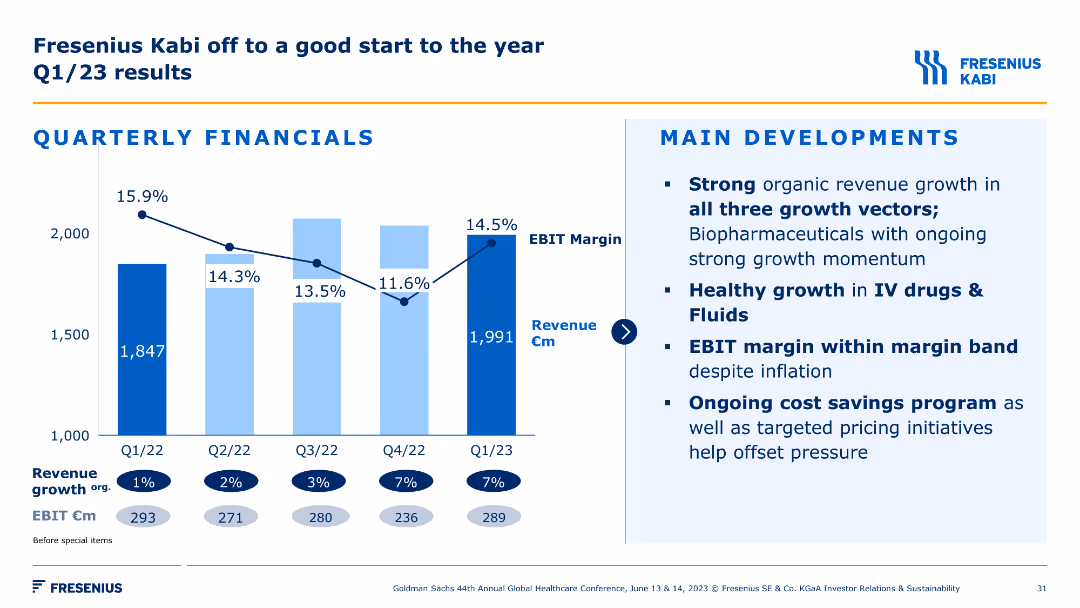
A column chart displaying quarterly financial results with revenue and EBIT margins. Accompanied by a bullet list summarizing main developments and growth vectors.
Financial Performance
Healthcare & Pharmaceuticals
This slide presents Q1/23 financial results for Fresenius Kabi, highlighting strong organic growth, healthy IV drugs and fluids growth, and ongoing cost savings programs.
financials, Q1 results, growth, revenue, EBIT
false
Financial Performance
Healthcare & Pharmaceuticals
Mixed Chart
Goldman Sachs
Add to my slides
Remove from favorites
The slide features multiple column charts detailing quarterly performance, income distribution, and income by business with annotations and percentage changes.
Financial Performance
Financial Services
This slide presents quarterly financial performance and income breakdown of different business units within the company, showing trends and changes over the quarters.
financials, quarterly, trends, performance, income
false
Financial Performance
Financial Services
Multiple Chart
Barclays
Add to my slides
Remove from favorites
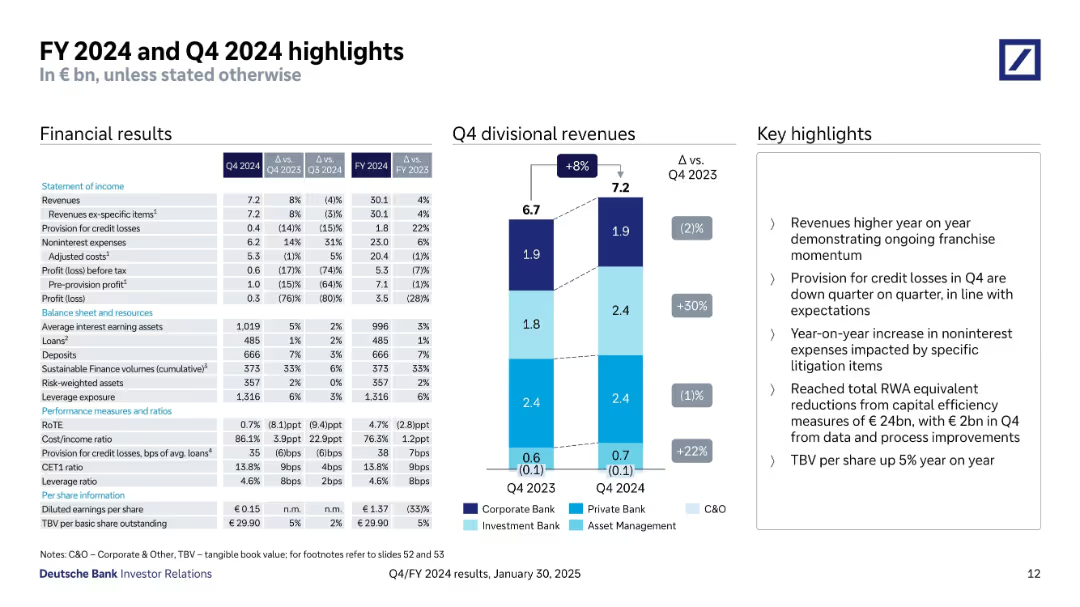
Left-aligned table with financials, center stacked bar chart for revenue breakdown, and key highlights on the right. Uses light blue and navy blue for segment distinctions.
Financial Performance
Financial Services
Provides detailed financial results for Q4 and FY 2024, including revenues, expenses, profits, and balance sheet items. Emphasizes growth areas and year-over-year comparisons with focus on divisional revenues and key operational highlights.
financials, revenue, banking, Q4 results, FY2024, Deutsche Bank
false
Financial Performance
Financial Services
Mixed Chart
Deutsche Bank
Add to my slides
Remove from favorites
Slide with bulleted lists and a small logo on the top right. It presents text information in a clean and organized manner with bold headings.
Financial Performance
Financial Services
This slide details a financial institution's capital allocation and revenue, with focus on dividends, capital ratios, and expenses. It serves to communicate financial stability and growth to investors or stakeholders.
Financials, Revenue, Dividends, Capital Ratio, Expenses, Income, Bank, Q1, Performance
false
Financial Performance
Financial Services
Header Vertical
Morgan Stanley
Add to my slides
Remove from favorites
Slide features multiple column charts and textual information outlining financial targets and historical data. Layout is clear with a direct comparison of yearly data.
Financial Performance
Financial Services
This slide presents a financial overview, showing RoTE, total income, net interest income, cost:income ratio, and other financial metrics from 2021 to projections for 2026. Each financial aspect is broken down by year with targets for 2026 clearly highlighted.
financials, RoTE, income, cost, 2026 targets, banking
false
Financial Performance
Financial Services
Multiple Chart
Barclays
Add to my slides
Remove from favorites
Features a clean layout with column charts and clear text blocks, comparing annual financial metrics across three years.
Financial Performance
Financial Services
Provides an overview of Barclays' financial performance including RoTE, income, loans, deposits, and client assets. Details yearly comparisons and targets for upcoming years.
financials, RoTE, income, loans, deposits
false
Financial Performance
Financial Services
Multiple Chart
Barclays
Add to my slides
Remove from favorites
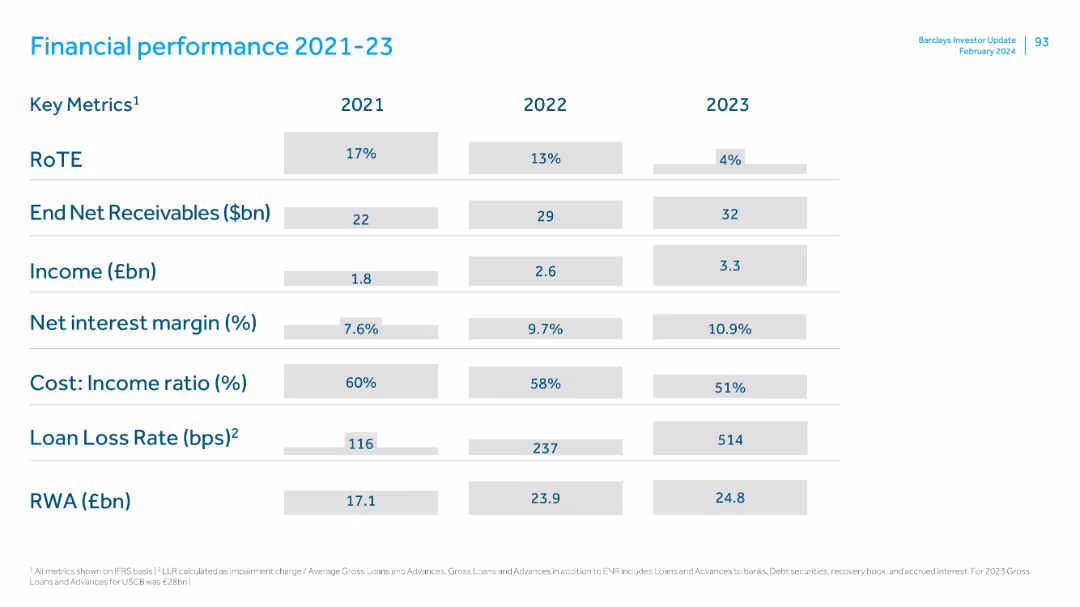
Tabular format showing annual metrics for three years, clearly segmented rows and columns, clean layout with shaded cells.
Financial Performance
Financial Services
Summarizes Barclays' key financial metrics from 2021 to 2023, showing trends in RoTE, receivables, income, net interest margin, cost-income ratio, loan loss rates, and risk-weighted assets. Notable decline in RoTE and rising loan loss rate in 2023.
financials, RoTE, income, net interest margin, receivables, cost-income ratio, RWA, loan loss
false
Financial Performance
Financial Services
Single Chart
Barclays
Add to my slides
Remove from favorites
Multiple column charts display financial performance over several years with projections up to 2026, accompanied by textual analysis.
Financial Performance
Financial Services
Reiterates Barclays' financial data focusing on RoTE, income, and other key financial indicators, setting performance targets for 2026 and illustrating past performance trends and future aspirations.
financials, RoTE, targets, 2026, performance
false
Financial Performance
Financial Services
Multiple Chart
Barclays
Add to my slides
Remove from favorites
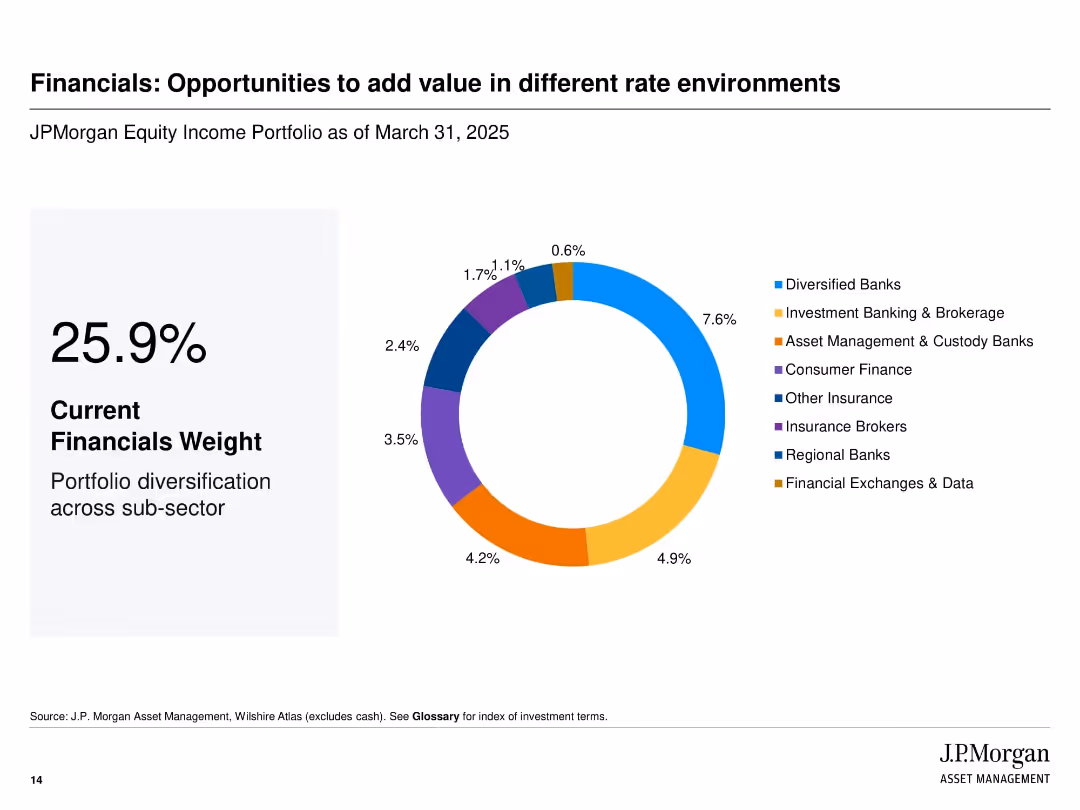
Circular pie chart with segmented color legend, focusing on financial sub-sector exposure.
Investment Analysis
Financial Services
Highlights the portfolio’s 25.9% allocation to Financials, with sub-sector breakdown across diversified banks, asset managers, insurance, and more. Emphasizes the diversification strategy within the financials sector to manage different rate environments.
financials, sub-sector, investment diversification, JPMorgan, portfolio management, rate environments
false
Investment Analysis
Financial Services
Mixed Chart
JP Morgan
Add to my slides
Remove from favorites
Column charts detailing growth in stable financing income.
Financial Performance
Financial Services
Focuses on scaling stable financing income and includes targets for upcoming years.
Financial Stability, Income Growth, Financing, Targets, Projections
false
Financial Performance
Financial Services
Mixed Chart
Barclays
Add to my slides
Remove from favorites
The slide displays line charts and informational blocks showing trends in CET1 ratio, loan deposit ratios, and other liquidity measures.
Financial Performance
Financial Services
The slide provides an overview of the bank's financial stability over time through various financial metrics like CET1 ratio and liquidity coverage ratio.
financial stability, liquidity, metrics, CET1 ratio
false
Financial Performance
Financial Services
Multiple Chart
Barclays
Add to my slides
Remove from favorites
The slide is well-structured, comprising column charts with comparisons of H1 2018 and H1 2019 across four financial metrics: Average AuMA, Revenue, Expenses, and Adjusted diluted EPS. Each graph has associated percentage changes to highlight differences between the periods.
Financial Performance
Financial Services
The slide presents a comparison of financial metrics over two half-year periods, signifying stability or growth in financial figures. It can be used to discuss financial resilience and projections, emphasizing key financial results to stakeholders.
Financial, Stability, Metrics, Comparison, Growth
false
Financial Performance
Financial Services
Multiple Chart
Morgan Stanley
Add to my slides
Remove from favorites
Text and data tables showing past and projected financials.
Strategic Planning
Financial Services
Provides a comprehensive view of financial performance and targets for 2026.
Financials, Targets, Forecasting, 2026, Performance Metrics
false
Strategic Planning
Financial Services
Multiple Chart
Barclays
Add to my slides
Remove from favorites
Contains column charts to display financial targets and current metrics.
Financial Performance
Financial Services
Provides an overview of financial metrics and future targets for 2026.
financials, targets, growth, assets, performance
false
Financial Performance
Financial Services
Multiple Chart
Barclays
Add to my slides
Remove from favorites
Slide contains multiple column charts showing financial metrics from 2021 to 2023 with projections for 2026.
Financial Performance
Financial Services
Highlights key financial targets and progress of a financial institution over several years.
financials, targets, projections, banking, metrics
false
Financial Performance
Financial Services
Multiple Chart
Barclays
Add to my slides
Remove from favorites
Circle charts with net positive/negative financial statuses compared across SEA countries.
Market Analysis and Trends
Financial Services
The slide compares the financial status of respondents to a year ago, indicating a general decrease in financial wellbeing.
financial status, SEA, comparison, circle chart, survey
false
Market Analysis and Trends
Financial Services
Multiple Chart
IPSOS
Add to my slides
Remove from favorites
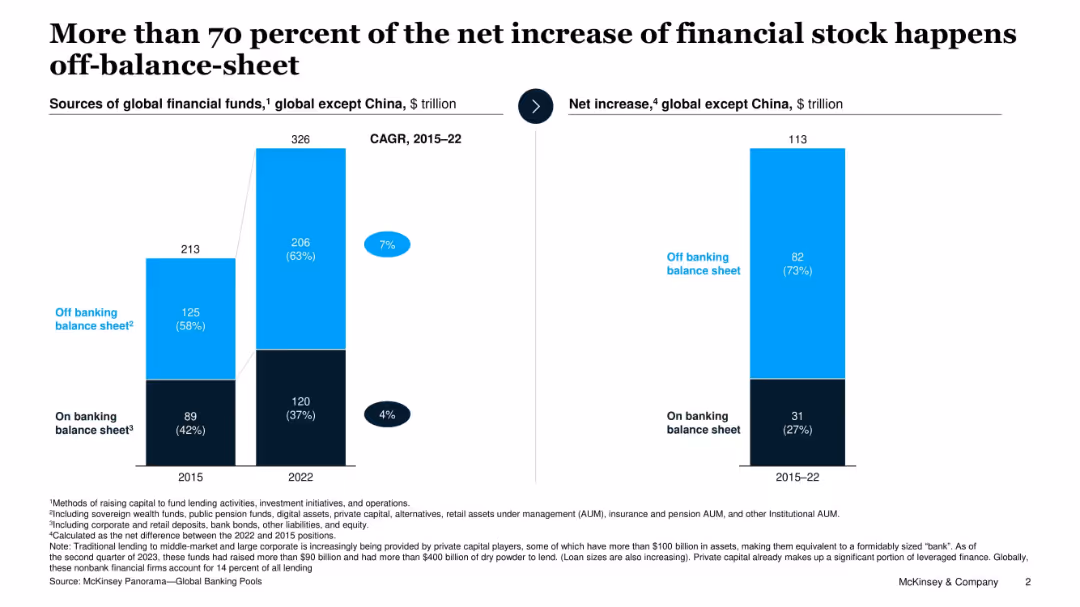
Two bar charts: left showing global financial stock by source, right showing net increase 2015–22; color-coded for on/off balance sheet.
Corporate Finance and Valuation
Financial Services
This slide presents the dominance of off-balance-sheet sources in global financial stock growth from 2015 to 2022. It highlights the increasing role of private capital and institutional AUM in financial flows, making up over 70% of the net increase in financial stock.
financial stock, off-balance-sheet, global finance, AUM, banking, capital sources, 2022
false
Corporate Finance and Valuation
Financial Services
Single Chart
McKinsey
Add to my slides
Remove from favorites
Column charts comparing financial ratios and targets over time. Simple and clean layout.
Financial Performance
Energy & Utilities
Analyzes the financial strength of the company, highlighting debt management and financial targets.
financial, strength, debt, targets, management
false
Financial Performance
Energy & Utilities
Mixed Chart
Barclays
Add to my slides
Remove from favorites
Includes a list on the left detailing financial metrics and two column charts on the right visualizing 'Total Assets' and 'Total Equity' over time. The slide uses contrasting colors for easy differentiation between liquid and total assets.
Financial Performance
Financial Services
Exhibits the company’s financial robustness by showcasing key figures such as total assets and equity. The visual data emphasizes liquidity and growth, presenting a snapshot of the company’s financial health and stability without long-term debt.
Financial Strength, Total Assets, Total Equity, Liquidity, Growth, Stability
false
Financial Performance
Financial Services
Multiple Chart
Goldman Sachs
Add to my slides
Remove from favorites
A line chart displays systemic stress indicators for the US, Euro Area, and UK, with a commentary section on the right. The y-axis represents stress levels, and the x-axis shows years.
Risk Assessment and Management
Financial Services
The slide reviews systemic financial stress in major economies, noting reduced stress levels since March 2023 peak and discussing potential financial pressures going into 2024.
Financial stress, economic downturn, systemic stress, financial indicators, market trends
false
Risk Assessment and Management
Financial Services
Mixed Chart
Accenture
Add to my slides
Remove from favorites
This slide is divided into two halves with large icons—a human figure and a monitor. There are percentages next to each visual, with a clear title above and a background that provides contrast for readability.
Market Analysis and Trends
Financial Services
This slide reflects the consensus between employees and HR leaders on the negative impact of financial stress on workplace performance, suggesting a focus on well-being in HR policies. It's likely to be used for presentations discussing the intersection of personal finance and workplace efficiency.
financial stress, productivity, HR leaders, employees, workplace
false
Market Analysis and Trends
Financial Services
Boxed
Goldman Sachs
Add to my slides
Remove from favorites
The slide features a line chart showing the Composite Indicator of Systemic Stress Index from 2019 to 2023 for the UK, Euro area, and US.
Risk Assessment and Management
Financial Services
The slide assesses the levels of systemic financial stress in major economies post recent bank failures, noting stress trends and future expectations.
financial stress, systemic indicators, UK, Euro area, US, risk management
false
Risk Assessment and Management
Financial Services
Mixed Chart
Accenture
Add to my slides
Remove from favorites
Features comparative tables and column charts detailing yearly financial results and divisional revenues, using a clear, effective layout with contrasting colors.
Financial Performance
Financial Services
Summarizes the fiscal year 2023 financial highlights and divisional revenue contributions, offering a yearly comparison.
financial summary, annual report, revenue distribution, FY 2023, financial metrics
false
Financial Performance
Financial Services
Mixed Chart
Deutsche Bank
Add to my slides
Remove from favorites
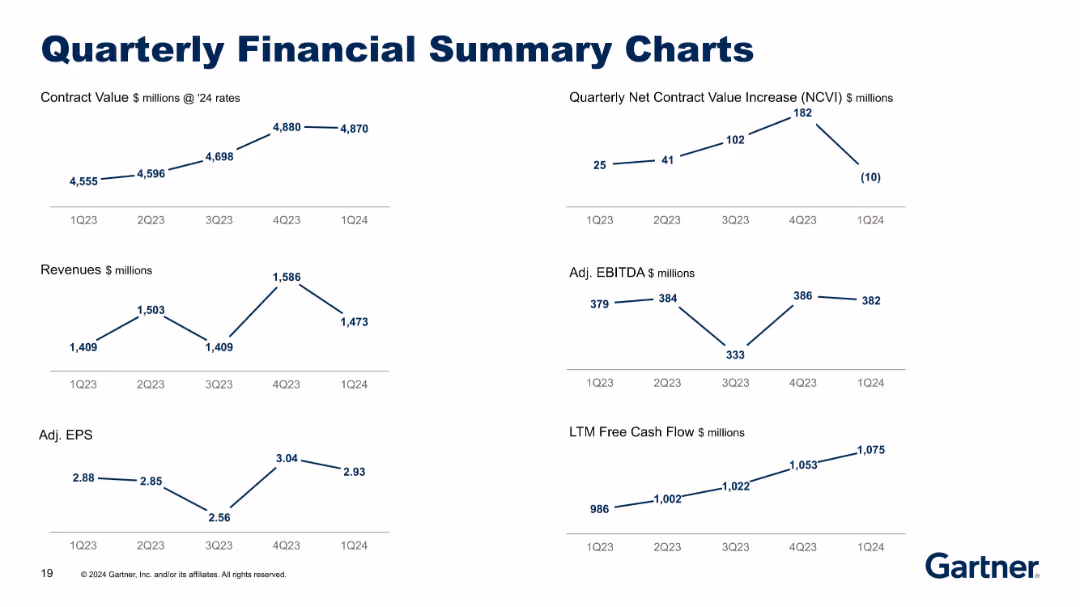
Duplicate of slide 18641 but with slight visual formatting changes; layout and content otherwise identical.
Financial Performance
Technology & Software
Reiterates financial KPIs from Q1 2023 to Q1 2024, including revenue, contract value, NCVI, EBITDA, EPS, and cash flow. Offers a visual trend summary of quarterly financial evolution using consistent formatting across metrics.
financial summary, contract value, EBITDA, EPS, revenue, quarterly
false
Financial Performance
Technology & Software
Multiple Chart
Gartner
Add to my slides
Remove from favorites
Features a series of block graphs outlining key financial targets over time.
Strategic Planning
Financial Services
Sets specific financial targets for the next three years, including RoTE, income, and loan loss rates.
financial, targets, 2026, planning, RoTE
false
Strategic Planning
Financial Services
Table
Barclays
Add to my slides
Remove from favorites
The slide lists financial targets for 2022 to 2025, including organic growth, operating margin, free cash flow, and a detailed cash allocation plan.
Strategic Planning
Financial Services
The slide outlines financial targets and cash allocation plans for 2022-2025, focusing on acquisitions, CAPEX, dividends, and share buybacks.
Financial targets, cash allocation, strategic planning, growth, profitability
false
Strategic Planning
Financial Services
Mixed Chart
IPSOS
Add to my slides
Remove from favorites
Composed of a series of performance metric tables, the slide compares targets with actual results for different financial indicators over three years, using checkmarks and crosses to show if targets were met.
Financial Performance
Financial Services
The slide evaluates JPMorgan Chase's achievement against its long-term financial targets, useful for performance assessment and management discussions.
financial targets, performance assessment, JPMorgan Chase, long-term growth, revenue, profit margin, return on equity.
false
Financial Performance
Financial Services
Table
JP Morgan
Add to my slides
Remove from favorites
Three rectangular blocks compare ROE/ROTE, Efficiency Ratio, and CET1 Ratio as medium-term financial targets, set against a blue background.
Strategic Planning
Financial Services
This slide communicates the company's financial targets, underscoring its commitment to driving value through business growth. It outlines objectives for return on equity, cost efficiency, and capital adequacy, reflecting a strategic approach for generating higher returns over the long-term.
Financial Targets, ROE, Efficiency, CET1 Ratio, Value, Growth, Strategic Planning
false
Strategic Planning
Financial Services
Boxed
Goldman Sachs
Add to my slides
Remove from favorites
Previous
Next
You don't have any favorites yet.
Please wait loading your favorites slides...
Create a FREE account to continue browsing
Receive Instant Access to 1,000+ slides from companies like McKinsey, Google, and Goldman Sachs
First Name
Last Name
Email
Password
I agree to all
Terms & Privacy Policy
Thank you! Your submission has been received!
Oops! Something went wrong while submitting the form.
Have an account?
Sign in
Upgrade to PRO to Save slides
Advanced Search and Filters
Access to 15,000+ slides
Access to Category Pages
Save/Bookmark Slides
PowerPoint Template Library
Pick a Plan
MONTHLY
$12/month
Billed every month, Cancel anytime.
YEARLY
$9/year
Billed $108 annually, Cancel anytime.
Checkout for $12/month
Checkout for $108/yr
Secured by Stripe | AES-256 bit encryption