My Account
My Slides
Search by Category
Companies
Slide Type
Use Case
Industry
Pricing
Templates
View All Templates
Download Template Slides
✦ AI
AI Prompt Library
AI Search
Feedback
Login
Logout
Get Started
Browse all Slides
Browse all Slides
Create a FREE Account
Instant access to 1,000+ real slides from top companies like McKinsey, BCG, Goldman Sachs, Google and many more!
First Name
Last Name
Email
Password
I agree to all
Terms & Privacy Policy
Thank you! Your submission has been received!
Oops! Something went wrong while submitting the form.
Have an account?
Sign in
Saved Slides
Total No. of slides saved
0
↻ Refresh
✖ Clear all
Three-column layout with text boxes detailing topline, source of funds, and usage of funds. Includes color-coded bar charts and callout boxes for financial targets.
Strategic Planning
Financial Services
Outlines financial targets for 2025, including revenue goals, operating margin, and funding sources. Also covers projected cash flow and fund allocation for acquisitions and CAPEX.
financial targets, strategy, revenue, funding, acquisitions
false
Strategic Planning
Financial Services
Multiple Chart
IPSOS
Add to my slides
Remove from favorites
Simple icon-based design illustrating key findings related to transparency, strategy, and material handling in SEM-10 listed companies.
Financial Performance
Financial Services
Discusses transparency and strategy insights within SEM-10 entities, pointing out areas of limited disclosure and strategic oversight. Useful for financial strategy meetings and transparency workshops.
financial, transparency, strategy, SEM-10
false
Financial Performance
Financial Services
Pillar
PwC/Strategy&
Add to my slides
Remove from favorites
Contains bullet points and a multicolored circular graphic. Design is clean and focused, using a blue and gray color scheme.
Financial Performance
Financial Services
Covers mid-quarter and full-year financial updates for 2022, focusing on loan growth, expenses, and credit metrics. Useful in financial updates to stakeholders or quarterly earnings presentations.
financial update, loan growth, credit metrics, economic outlook
false
Financial Performance
Financial Services
Header Vertical
Barclays
Add to my slides
Remove from favorites
Features bar graphs comparing the cost and value of nbn™ plans, with visuals illustrating user benefits, clear labeling, and explanatory text.
Financial Performance
Telecommunications
Demonstrates the financial value derived by users from the nbn™ network, detailing consumer surplus and its economic significance.
Financial Value, nbn, Consumer Surplus, Economic Impact, Telecommunications
false
Financial Performance
Telecommunications
Agenda
Accenture
Add to my slides
Remove from favorites
Features a bar chart and a column chart with time frames for financial value delivery and expectations for delivery speed. The design incorporates a blue-purple gradient and numerical annotations for quick reference.
Strategic Planning
Professional Services
Offers a forecast of the financial value expected from reinvention strategies and their delivery timelines, comparing reinventors to transformers and optimizers. It's beneficial for financial planning and strategy sessions aimed at forecasting and comparing transformation paces.
Financial Value, Reinvention Strategies, Forecasting, Delivery Timelines, Comparative Analysis, Strategy Pacing, Transformation Approaches, Value Realization
false
Strategic Planning
Professional Services
Multiple Chart
Accenture
Add to my slides
Remove from favorites
The slide features a title, two complex column charts comparing quarterly financial results, and a detailed text section highlighting key points in bullet format.
Financial Performance
Financial Services
This slide presents a comparative financial analysis of consumer and wealth management revenues over different quarters. It is used to highlight year-over-year growth and other financial metrics like net revenues and credit loss provisions.
Financial, Wealth Management, Quarterly Analysis, Growth, Net Revenue, Credit Loss, Management Fees, Consumer Banking, Revenue Highlights
false
Financial Performance
Financial Services
Multiple Chart
Goldman Sachs
Add to my slides
Remove from favorites
This slide presents a pie chart alongside a graph showing a positive trend over three years. There's also a circular diagram with various percentages, all surrounding the central theme of financial wellness. The layout is neat, with clear demarcation of the visual elements.
Market Analysis and Trends
Financial Services
Revealing the increase in HR leaders offering financial wellness benefits, this slide could be used to discuss the evolving role of employee benefits in job satisfaction and recruitment strategies in the financial industry.
financial wellness, HR leaders, employee benefits, job satisfaction
false
Market Analysis and Trends
Financial Services
Multiple Chart
Goldman Sachs
Add to my slides
Remove from favorites
Bar chart showing the most disliked aspects of vehicle financing, using different shades of green. The layout is straightforward and highlights key dislikes.
Risk Assessment and Management
Transportation & Logistics
This slide addresses the challenges and frustrations consumers face with vehicle financing, particularly the dislike for waiting for approval and completing paper-based forms, providing insights into improving customer experiences.
Financing challenges, consumer dissatisfaction, process improvement, vehicle loans
false
Risk Assessment and Management
Transportation & Logistics
Single Chart
Deloitte
Add to my slides
Remove from favorites
This slide includes bar charts showing IG convert issuance over time and the growth of global private debt institutional funds.
Financial Performance
Financial Services
The slide discusses the trend of firms turning to alternative financing methods such as convertible debt and private credit in response to higher interest rates. It highlights the increasing attractiveness and flexibility of these options. The slide can be used for financial strategy and performance analysis discussions.
financing, convertible debt, private credit, interest rates, alternative financing
false
Financial Performance
Financial Services
Multiple Chart
JP Morgan
Add to my slides
Remove from favorites
Features column chart comparing financing revenue growth over years with a clear visual hierarchy.
Financial Performance
Financial Services
Highlights Goldman Sachs' strategic progress in global banking and markets, with a focus on equities and FICC financing growth and client engagement.
Financing, growth, strategy, Goldman Sachs
false
Financial Performance
Financial Services
Mixed Chart
Goldman Sachs
Add to my slides
Remove from favorites
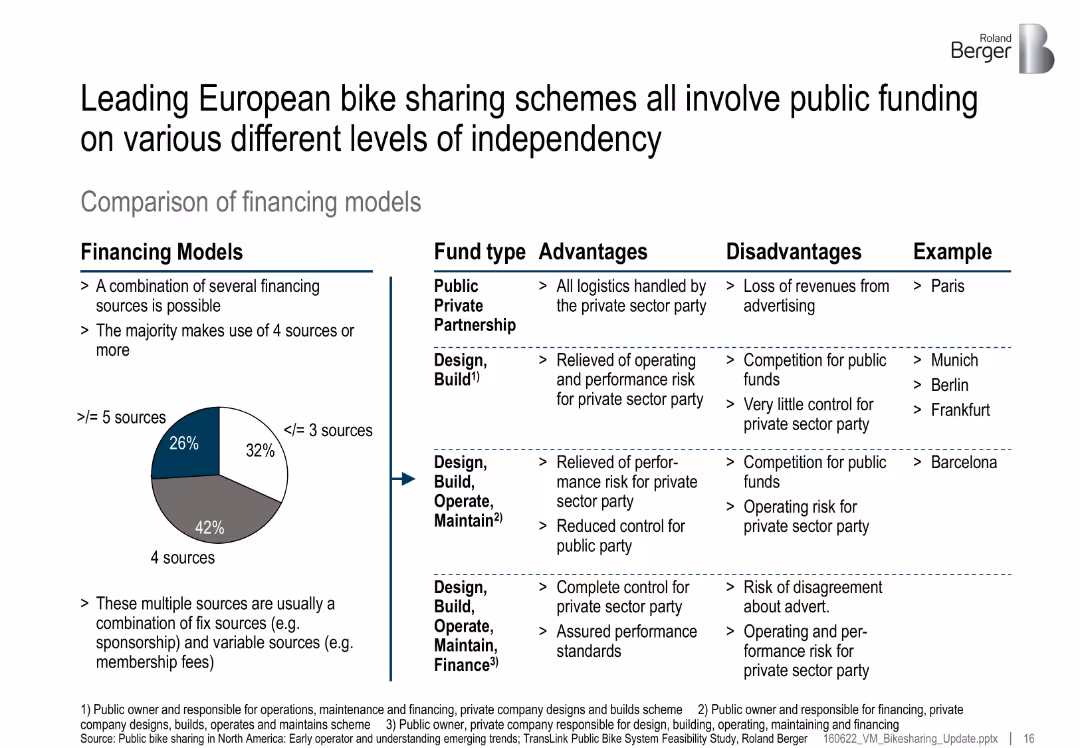
Split layout: left pie chart of financing model distribution, right table comparing fund types; advantages, disadvantages, and examples listed
Investment Analysis
Transportation & Logistics
The slide categorizes various financing models used in European bike-sharing schemes, showing a mix of public-private partnerships and government-led models. Each model is evaluated for pros and cons with city examples.
financing models, bike sharing, PPP, public funds, investment, Europe, urban mobility
false
Investment Analysis
Transportation & Logistics
Mixed Chart
Roland Berger
Add to my slides
Remove from favorites
This slide contains column charts showing preferred types of non-cash discounts, such as financing options and deferred payments, across different countries (US, UK, Germany, France, Italy, China, Japan).
Market Analysis and Trends
Transportation & Logistics
Explores consumer preferences for non-cash discount types in vehicle purchases, providing a comparative analysis across multiple countries.
financing options, deferred payments, column chart, automotive, international comparison
false
Market Analysis and Trends
Transportation & Logistics
Multiple Chart
McKinsey
Add to my slides
Remove from favorites
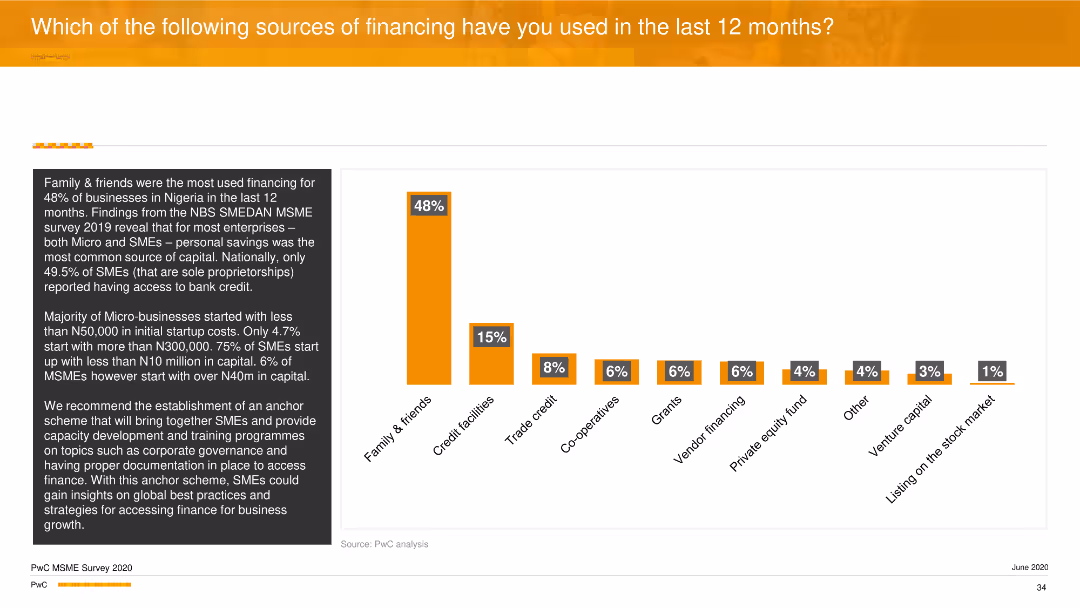
A vertical column chart shows various sources of financing, with family & friends being the most used. A detailed description of the financing landscape is on the left side.
Investment Analysis
Financial Services
The slide analyzes different sources of financing for businesses over the last year, with family and friends as the primary source, followed by credit facilities. It emphasizes the need for improved access to bank credit for SMEs.
Financing, Sources, SMEs, Investment, PwC
false
Investment Analysis
Financial Services
Mixed Chart
PwC/Strategy&
Add to my slides
Remove from favorites
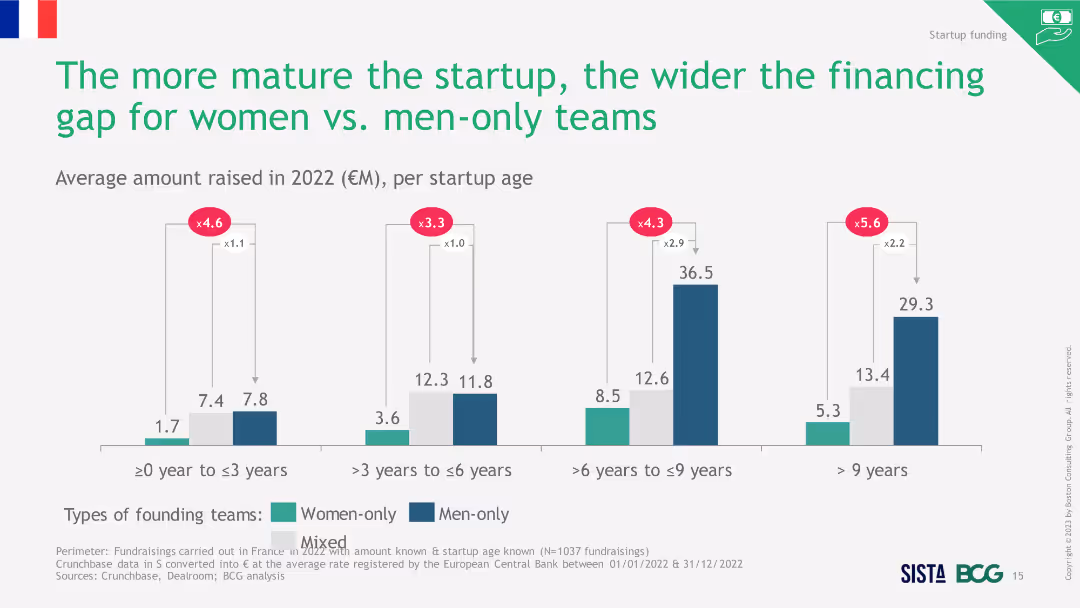
Column chart illustrating the average amount raised in 2022 per startup age. The chart compares women-only, men-only, and mixed teams, showing significant disparities as startups mature.
Market Analysis and Trends
Financial Services
This slide examines the financing gap between women-only and men-only teams as startups mature. It presents the average amounts raised by startups in different age brackets and highlights the growing disparity.
Financing, Startup, Age, Women, Men
false
Market Analysis and Trends
Financial Services
Single Chart
BCG
Add to my slides
Remove from favorites
A bar chart displaying preferred loan and lease durations for vehicle financing, in shades of blue. Well-organized and easy to interpret.
Financial Performance
Transportation & Logistics
This slide details consumer preferences for the duration of vehicle financing terms, emphasizing a trend towards longer terms for loans and leases to manage monthly payments effectively.
Financing terms, consumer preferences, loan duration, lease duration, financial planning
false
Financial Performance
Transportation & Logistics
Single Chart
Deloitte
Add to my slides
Remove from favorites
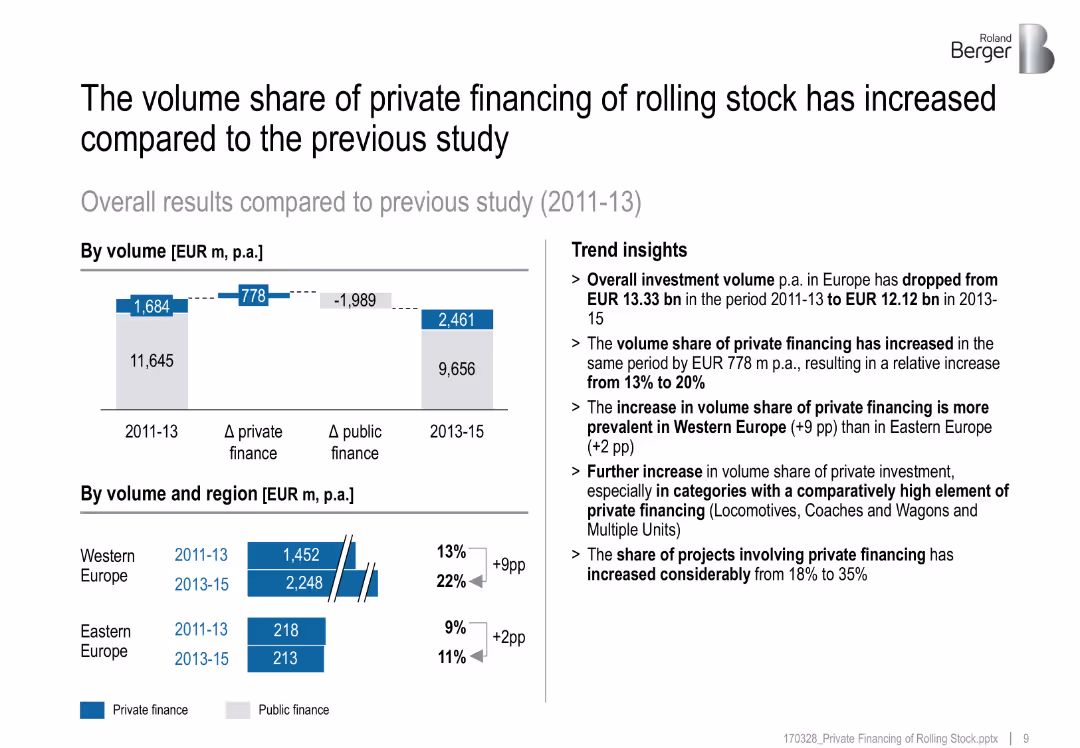
Comparative column chart and bar chart with percentage changes; trend summary on right
Investment Analysis
Transportation & Logistics
Shows how private financing has grown in share and volume from 2011–13 to 2013–15, with regional and segment-level breakdowns and implications for rolling stock procurement.
financing trends, investment share, rail infrastructure, regional split, procurement
false
Investment Analysis
Transportation & Logistics
Multiple Chart
Roland Berger
Add to my slides
Remove from favorites
The slide includes a column chart showing credit volume share and various client needs categories like investment, lifestyle, and entrepreneurial growth. Bullet points detail specific financing options like Lombard lending and export finance.
Client Case Studies
Financial Services
The slide addresses how Credit Suisse meets client financing needs through diverse options, including Lombard lending, real estate, and export finance. It emphasizes the growth in investment and asset allocation, while highlighting shifts in lifestyle and entrepreneurial financing.
financing, wealth management, Lombard lending, real estate, export finance
false
Client Case Studies
Financial Services
Single Chart
Credit Suisse
Add to my slides
Remove from favorites
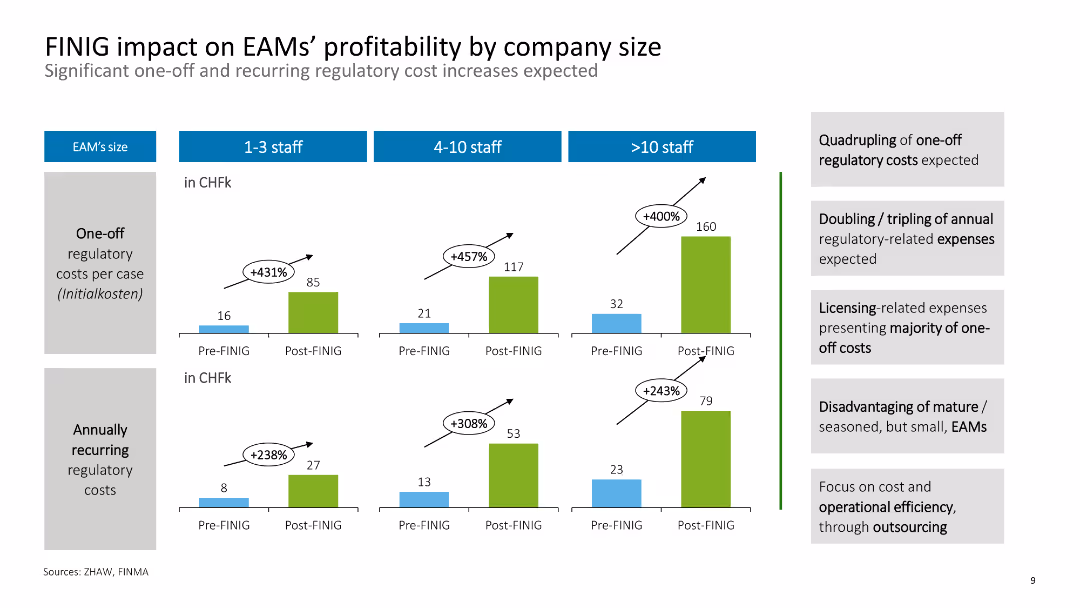
The slide has a comparative bar chart illustrating the cost impacts of FINIG on EAMs by company size.
Financial Performance
Financial Services
It highlights the expected increase in one-off and recurring regulatory costs for External Asset Managers (EAMs) of different sizes due to FINIG.
FINIG, costs, EAMs, profitability, regulatory
false
Financial Performance
Financial Services
Multiple Chart
Deloitte
Add to my slides
Remove from favorites
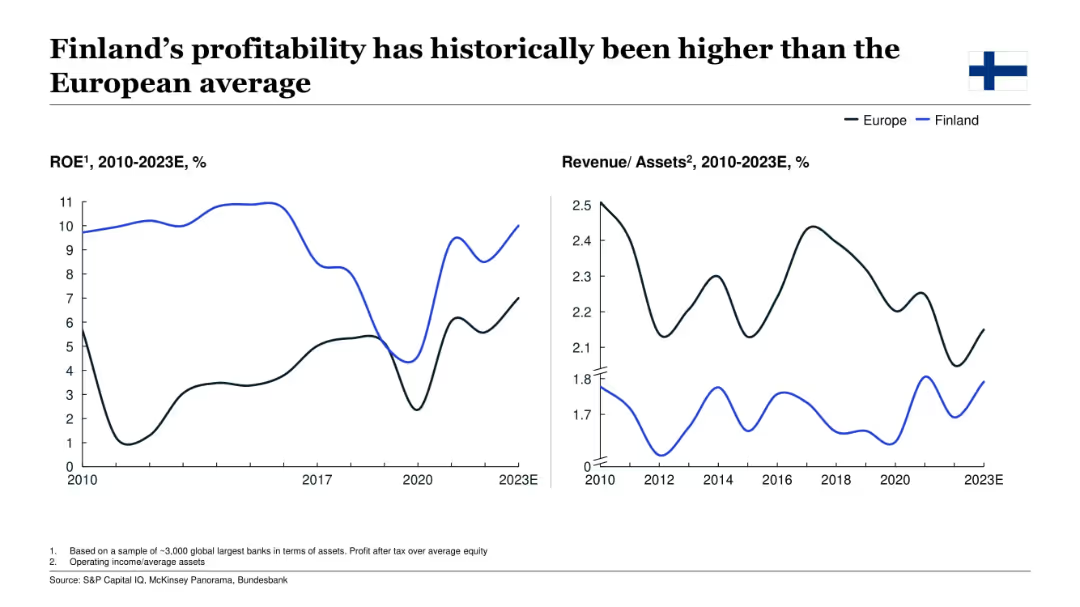
Dual line charts showing Finland’s ROE and revenue/assets from 2010–2023E, compared to the European average.
Financial Performance
Financial Services
This slide focuses on Finland’s bank performance, showing historically higher ROE versus the European average, though revenue/assets are lower. It underscores sustained profitability and offers insight into the structural dynamics of Finnish banking institutions.
Finland, profitability, ROE, revenue/assets, European banks, finance, historical trend
false
Financial Performance
Financial Services
Multiple Chart
McKinsey
Add to my slides
Remove from favorites
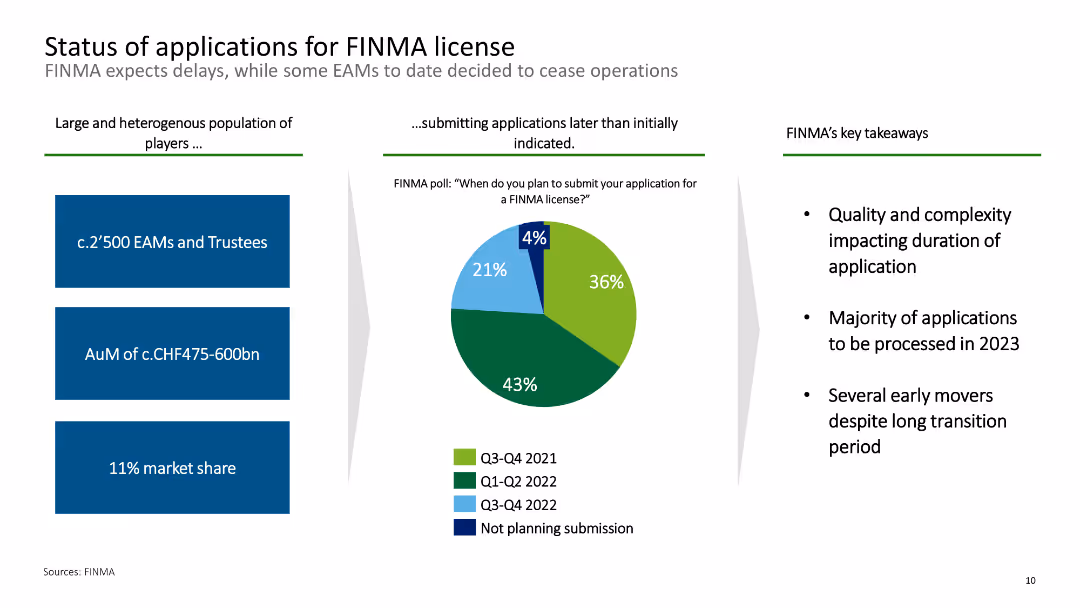
This slide features a pie chart and text boxes summarizing the application status for FINMA licenses among EAMs.
Regulatory and Compliance
Financial Services
It outlines the status of applications for FINMA licenses, indicating delays and key takeaways such as the quality and complexity impacting application duration.
FINMA, license, applications, EAMs, status
false
Regulatory and Compliance
Financial Services
Mixed Chart
Deloitte
Add to my slides
Remove from favorites
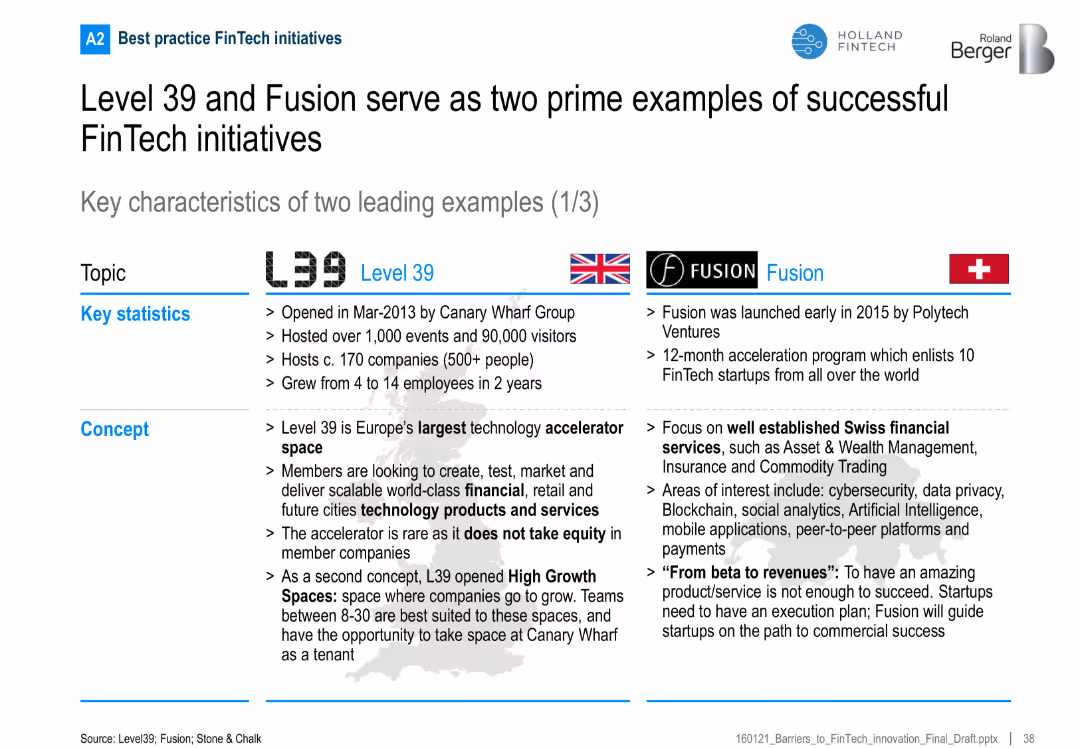
Two-column comparison of Level 39 and Fusion including key statistics and program concepts
Competitive Landscape
Financial Services
This slide compares London’s Level 39 and Geneva’s Fusion FinTech hubs in terms of their scale, focus areas, structure, and success frameworks, offering models for FinTech ecosystem development.
FinTech, accelerator, Level 39, Fusion, Switzerland, London, startups
false
Competitive Landscape
Financial Services
Table
Roland Berger
Add to my slides
Remove from favorites
The slide has a bar chart showing the progression of current and future FinTech users, including lapsed users and anticipated future users.
Market Analysis and Trends
Financial Services
The slide forecasts that FinTech adoption will surpass 50%, showing a detailed breakdown of user categories and predicting significant future growth.
FinTech, adoption, forecast, user categories, future
false
Market Analysis and Trends
Financial Services
Mixed Chart
EY
Add to my slides
Remove from favorites
Single-column layout with a bar chart showing fintech adoption rates across 20 markets. Uses flags and horizontal bars to represent adoption percentages for each country.
Market Analysis and Trends
Financial Services
Shows the progress of fintech adoption globally, highlighting the percentage of adoption in various countries, categorized by early adopters, early majority, and late majority.
fintech, adoption, global, markets, progress
false
Market Analysis and Trends
Financial Services
Single Chart
EY
Add to my slides
Remove from favorites
The slide includes a column chart comparing 2017 use and future use projections for different FinTech categories.
Strategic Planning
Financial Services
The slide predicts growth in smaller FinTech categories like financial planning and borrowing, suggesting that these areas will drive future growth.
FinTech, adoption, growth, categories, future use
false
Strategic Planning
Financial Services
Single Chart
EY
Add to my slides
Remove from favorites
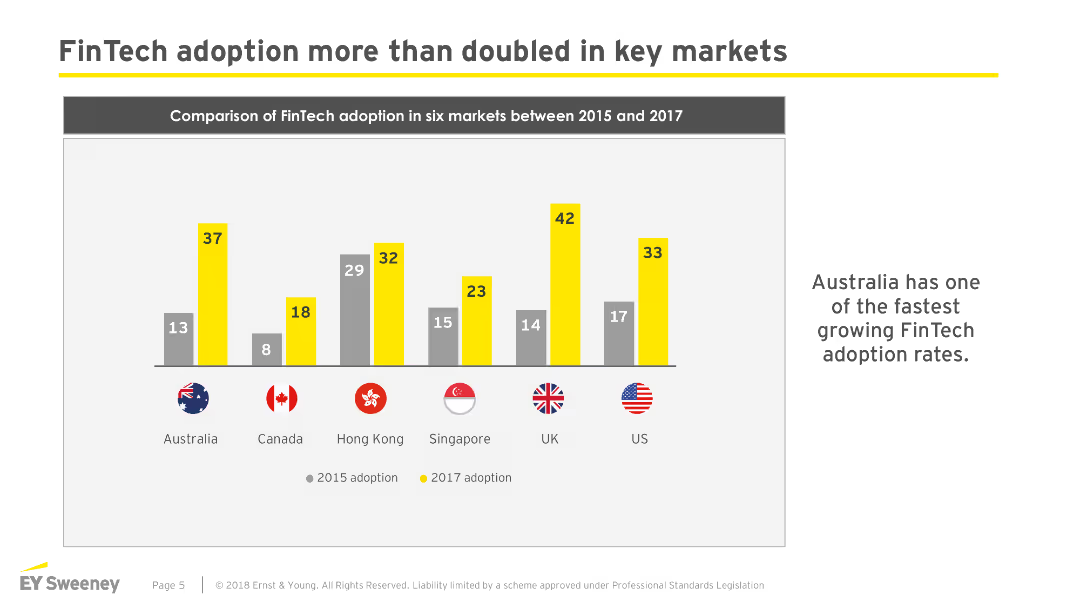
The slide features a column chart comparing FinTech adoption in six markets (Australia, Canada, Hong Kong, Singapore, UK, US) between 2015 and 2017.
Market Analysis and Trends
Financial Services
The slide shows that FinTech adoption has significantly increased in key markets from 2015 to 2017, highlighting Australia's notable growth rate.
FinTech, adoption, markets, comparison, growth
false
Market Analysis and Trends
Financial Services
Single Chart
EY
Add to my slides
Remove from favorites
The slide features a multi-country comparison of FinTech adoption rates in 2015, 2017, and future projections using a column chart.
Market Analysis and Trends
Financial Services
The slide presents a global comparison of FinTech adoption, showing past, current, and future projected usage, indicating overall growth in various markets.
FinTech, adoption, momentum, global, projections
false
Market Analysis and Trends
Financial Services
Single Chart
EY
Add to my slides
Remove from favorites
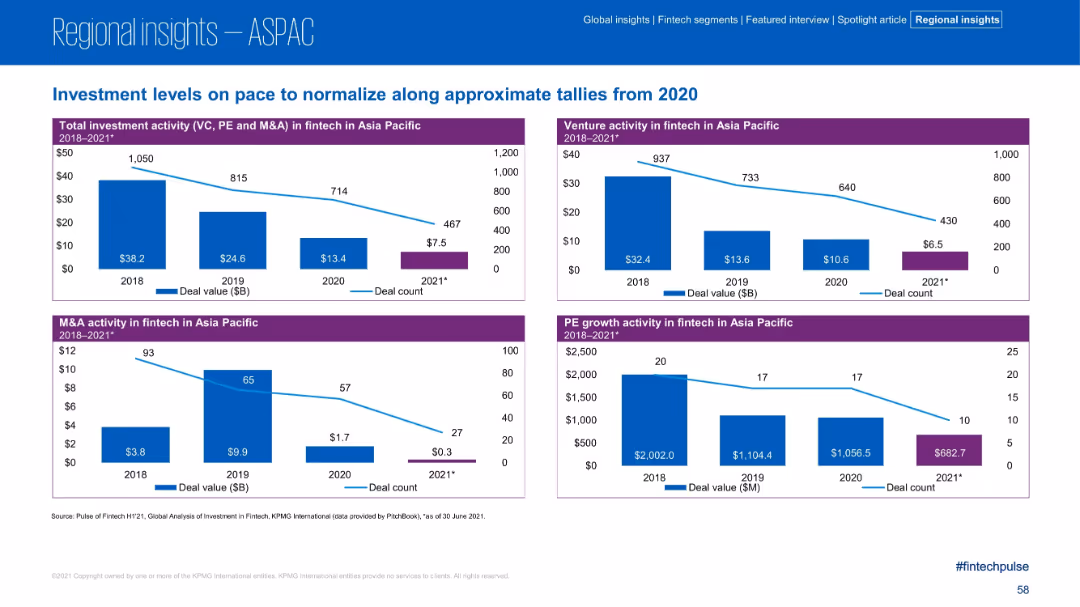
Four-panel bar and line charts comparing deal value and count for VC, PE, and M&A from 2018–2021 in ASPAC.
Market Analysis and Trends
Financial Services
This slide illustrates the decline in fintech investment activity across the Asia Pacific region from 2018 to 2021. Each panel focuses on a different segment—venture, M&A, and PE—with deal value and count both trending downward across the board.
Fintech, Asia Pacific, Investment, Deal Flow, M&A, PE, VC, Trends
false
Market Analysis and Trends
Financial Services
Multiple Chart
KPMG
Add to my slides
Remove from favorites
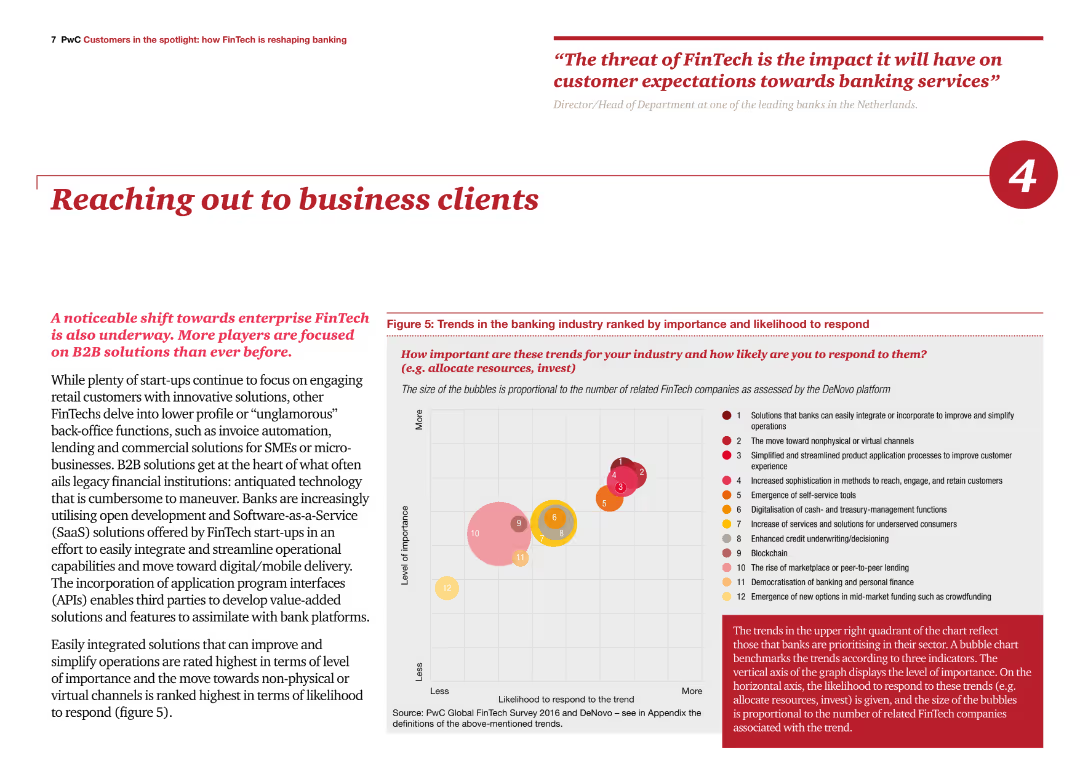
The slide includes a bubble chart ranking trends in the banking industry by importance and likelihood to respond. Text on the left discusses the focus on B2B solutions and their impact on business clients.
Sales and Business Development
Financial Services
The slide highlights the importance of B2B solutions in the FinTech industry, ranking various trends and emphasizing the need for banks to adopt these solutions to improve operations and client engagement.
FinTech, B2B solutions, trends, business clients, engagement
false
Sales and Business Development
Financial Services
Mixed Chart
PwC/Strategy&
Add to my slides
Remove from favorites
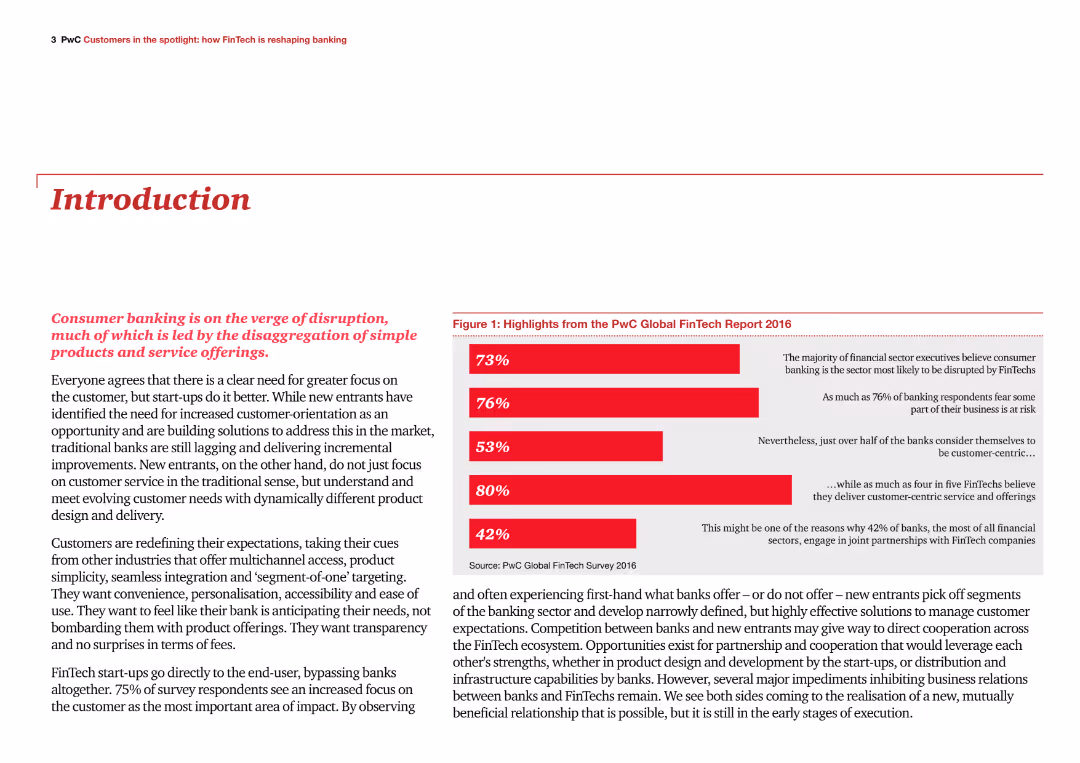
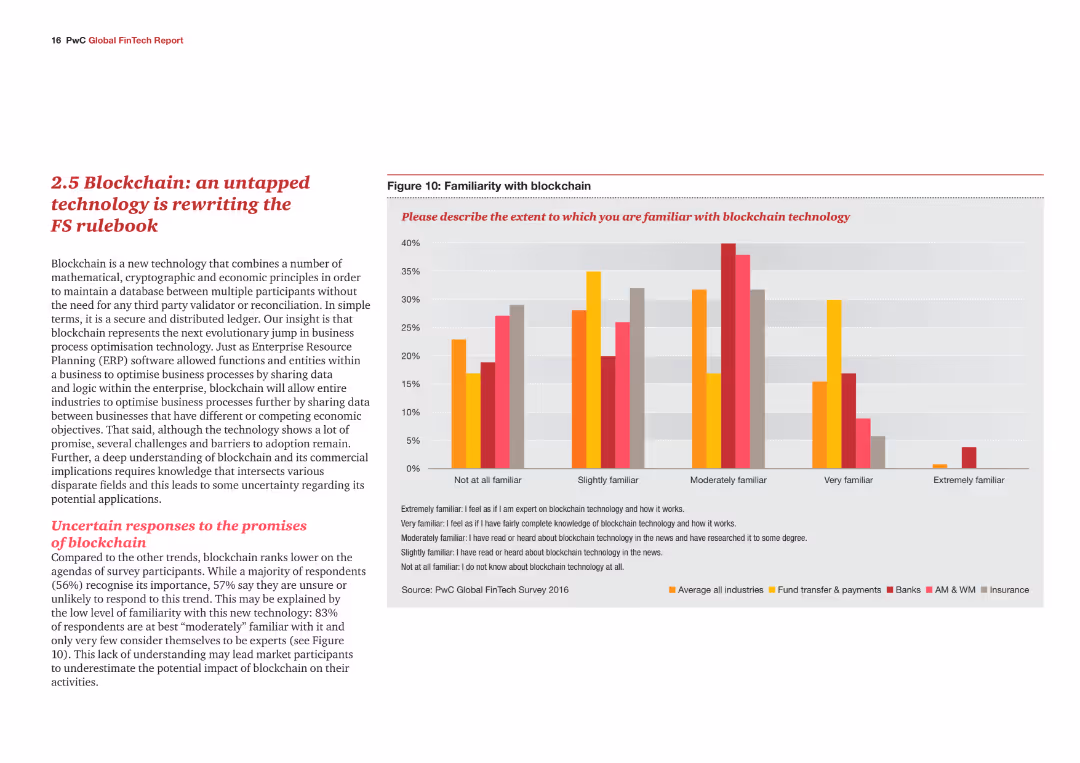
The slide has a title at the top, a paragraph of text, and a column chart on the right summarizing key highlights from the PwC Global FinTech Report 2016. The chart bars are in red, indicating different percentages.
Industry Overview
Financial Services
The slide introduces the report on how FinTech is reshaping banking, highlighting the disruptive impact on consumer banking and the importance of customer-centric approaches in the industry.
FinTech, banking, disruption, customer-centric, highlights
false
Industry Overview
Financial Services
Mixed Chart
PwC/Strategy&
Add to my slides
Remove from favorites
The slide features two sets of bar charts comparing awareness and preference for traditional financial services in 2015 and 2017 across six markets.
Market Analysis and Trends
Financial Services
The slide illustrates the decline in barriers to FinTech adoption, such as lack of awareness and preference for traditional services, from 2015 to 2017 in various markets.
FinTech, barriers, adoption, awareness, traditional services
false
Market Analysis and Trends
Financial Services
Single Chart
EY
Add to my slides
Remove from favorites
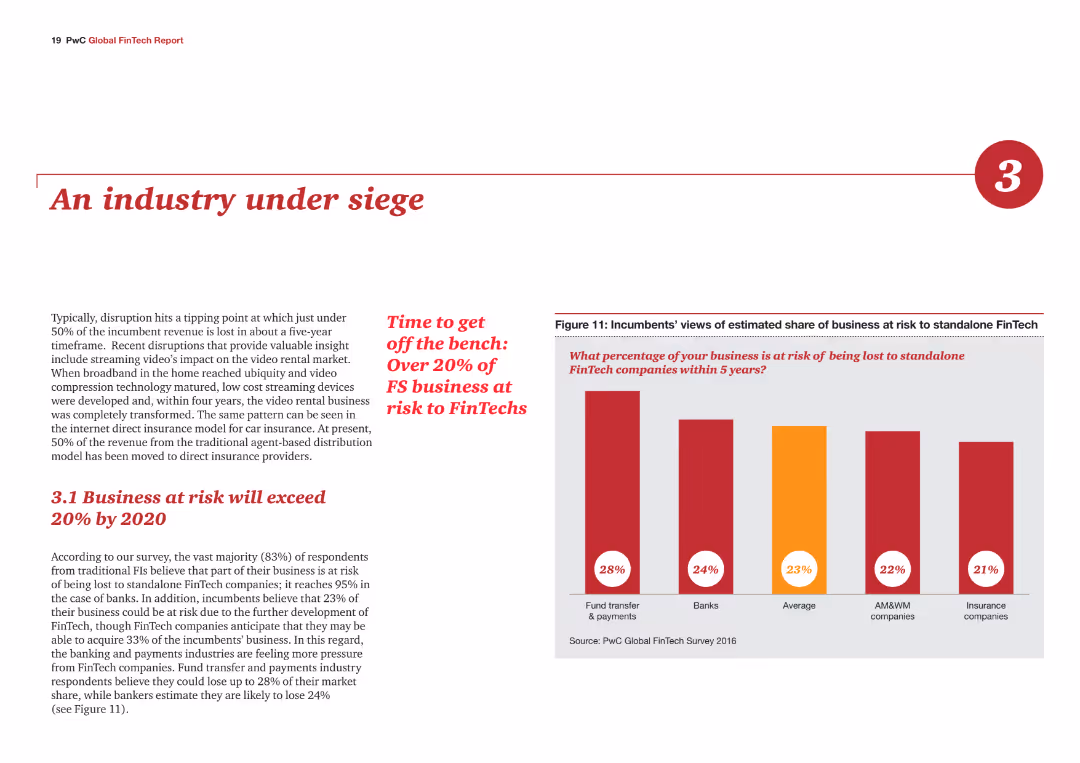
The slide includes a column chart and text. The chart shows the estimated share of business at risk to FinTech companies.
Risk Assessment and Management
Financial Services
The slide discusses the risk posed by FinTech companies to traditional financial services businesses.
FinTech, business risk, financial services, market share, disruption
false
Risk Assessment and Management
Financial Services
Mixed Chart
PwC/Strategy&
Add to my slides
Remove from favorites
Contains icons and statistics related to Fintech, Buy Now Pay Later, and the Rental industry, with projected market values and growth rates.
Market Analysis and Trends
Financial Services
Discusses Experian's growth opportunities in various emerging sectors like Fintech and Buy Now Pay Later, highlighting the potential for innovation and market expansion.
Fintech, Buy Now Pay Later, market growth, innovation, Experian
false
Market Analysis and Trends
Financial Services
Header Vertical
Barclays
Add to my slides
Remove from favorites
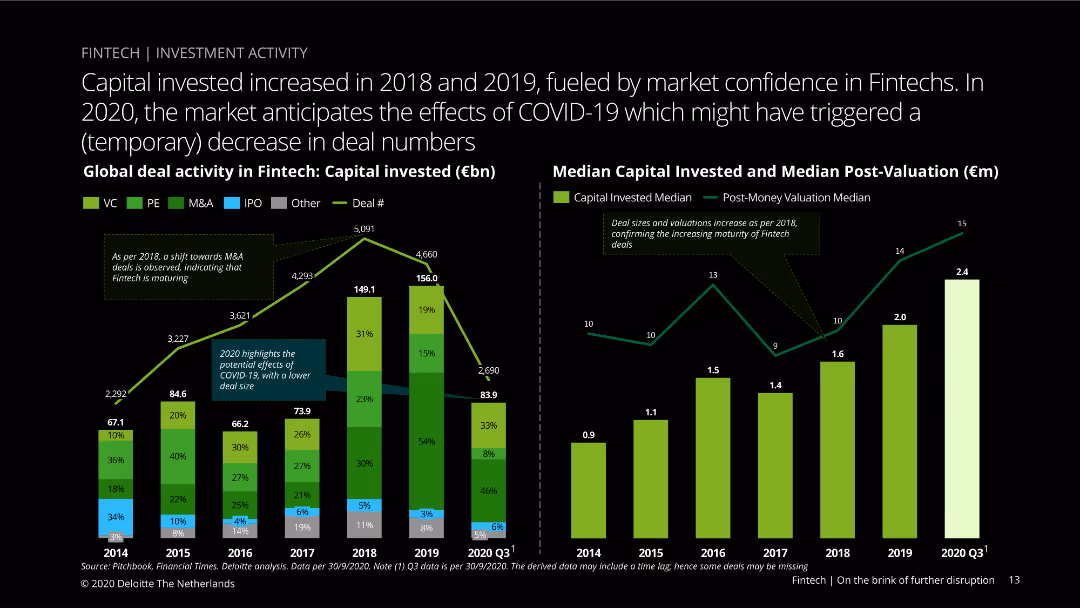
Dual-column charts showing global deal activity in fintech, with capital invested and median capital invested/post-valuation from 2014 to 2020 Q3. Various colors indicate deal types.
Investment Analysis
Financial Services
Analyzes global deal activity in fintech, highlighting increased investments in 2018-2019, and the potential decrease in 2020 due to COVID-19, with a breakdown by deal types.
fintech, capital investment, market confidence, COVID-19, deal activity, valuation, global analysis, venture capital, private equity, M&A
false
Investment Analysis
Financial Services
Multiple Chart
Deloitte
Add to my slides
Remove from favorites
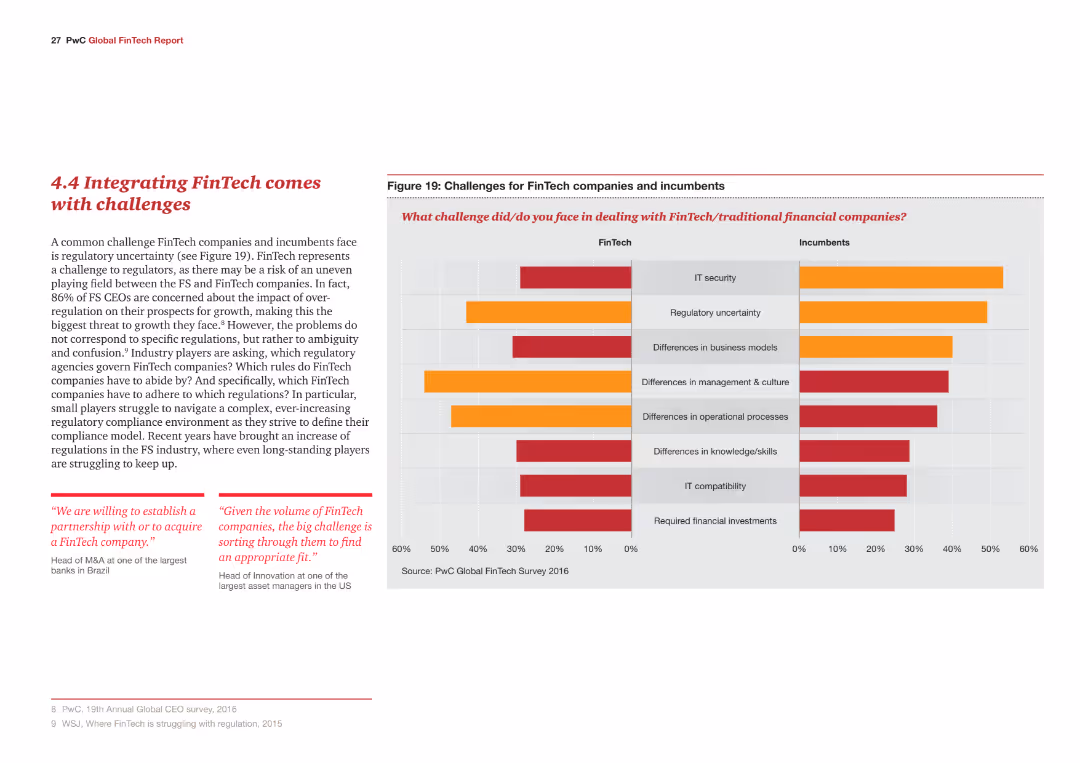
The slide contains a column chart comparing challenges faced by FinTech companies and incumbents, with challenges like IT security and regulatory uncertainty highlighted in different colors.
Risk Assessment and Management
Financial Services
The slide addresses challenges in integrating FinTech, such as regulatory uncertainty and differences in business models, and highlights the primary concerns of FS CEOs regarding over-regulation.
FinTech, challenges, regulatory, IT security, business models
false
Risk Assessment and Management
Financial Services
Multiple Chart
PwC/Strategy&
Add to my slides
Remove from favorites
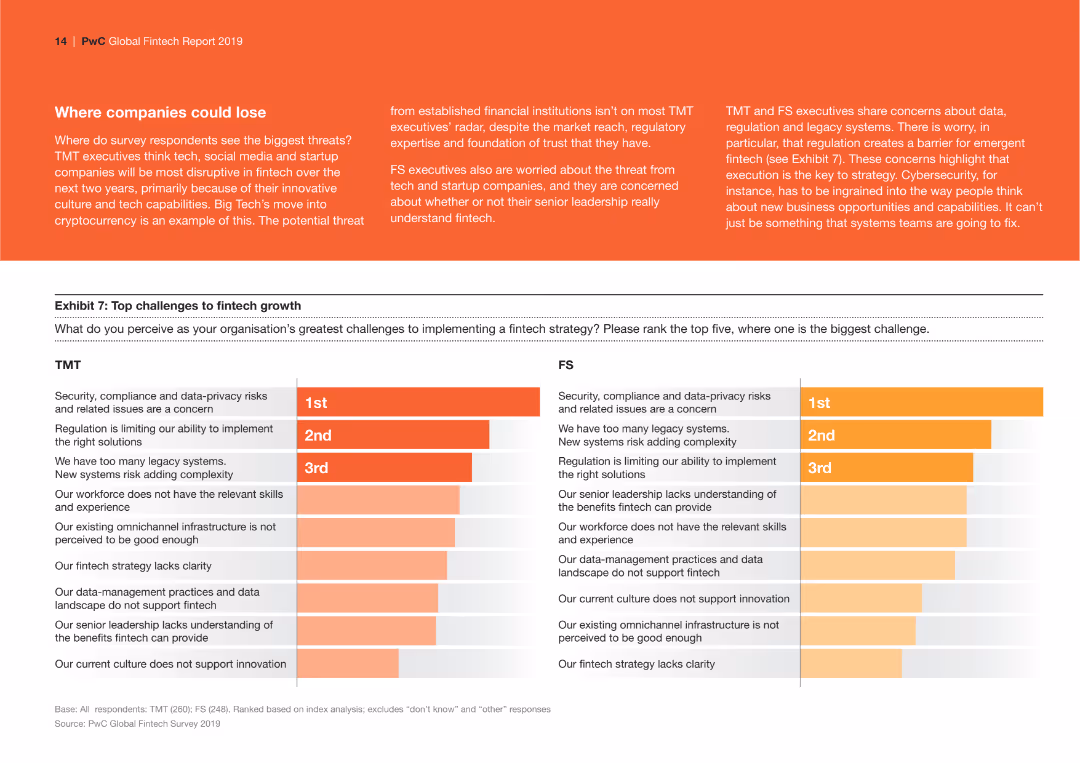
The slide has a bar chart comparing the top challenges to fintech growth for TMT and FS organizations. The color scheme includes shades of orange and gray.
Risk Assessment and Management
Financial Services
Identifies and ranks the greatest challenges to implementing a fintech strategy, comparing security, compliance, data privacy risks, legacy systems, and regulation issues between TMT and FS sectors.
fintech, challenges, TMT, FS, strategy
false
Risk Assessment and Management
Financial Services
Multiple Chart
PwC/Strategy&
Add to my slides
Remove from favorites
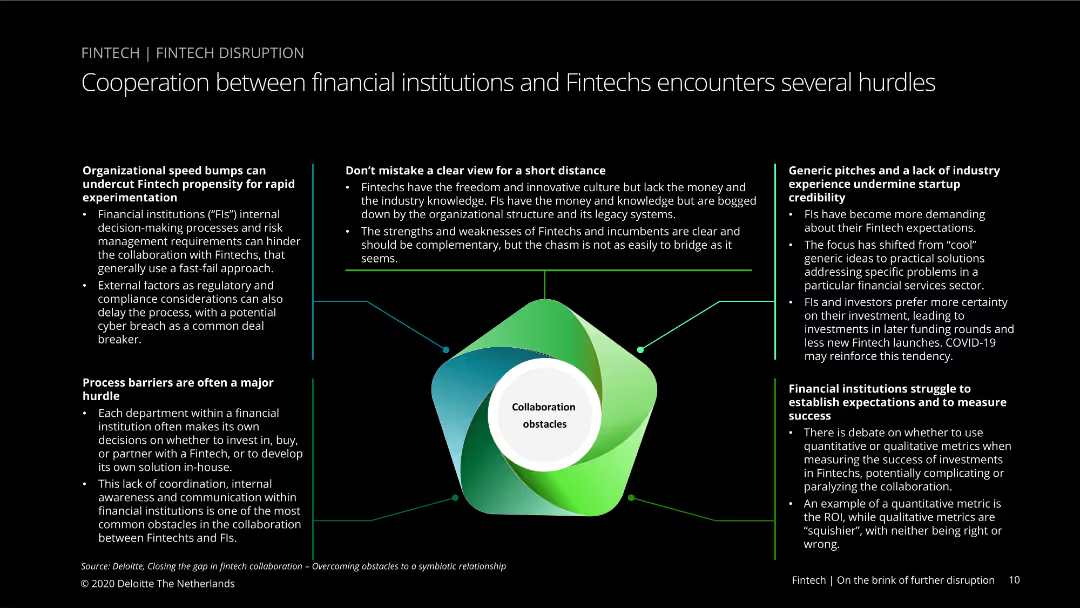
Text-heavy slide with a central image of a diagram showing collaboration obstacles, surrounded by text boxes detailing specific hurdles in financial institutions and fintech cooperation.
Risk Assessment and Management
Financial Services
Details various obstacles to collaboration between financial institutions and fintechs, including speed bumps, process barriers, and differing expectations and experiences.
fintech, cooperation, obstacles, financial institutions, process barriers, expectations, industry experience, collaboration, hurdles, risk management
false
Risk Assessment and Management
Financial Services
Diagram
Deloitte
Add to my slides
Remove from favorites
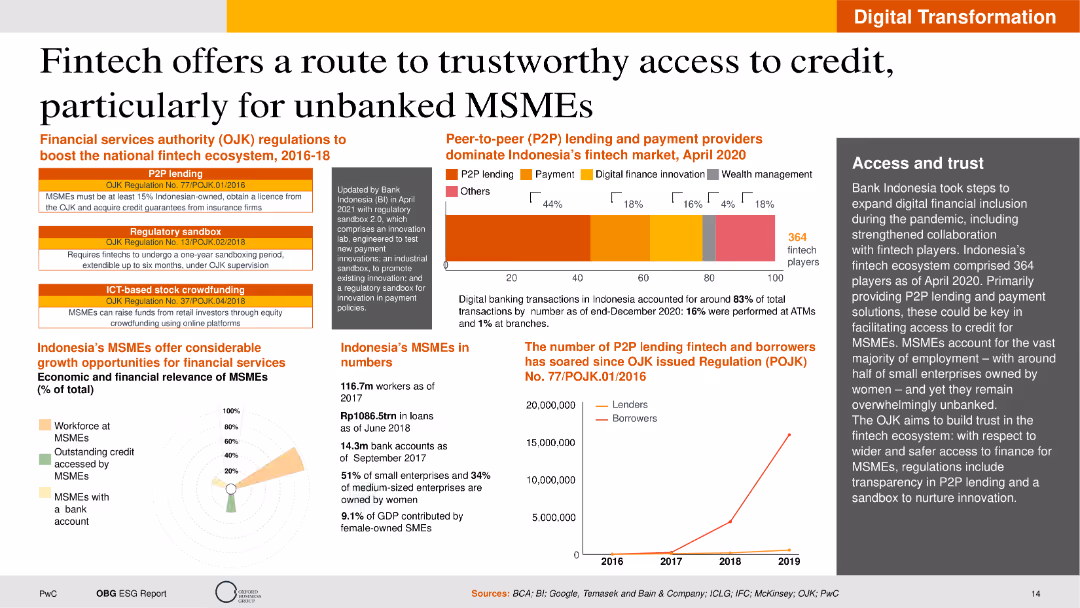
The slide includes text sections on fintech regulations, a bar chart on fintech market share, and statistical data on MSMEs. The layout is detailed but organized to separate different data points clearly.
Technology and Digital Transformation
Financial Services
This slide explores the role of fintech in providing access to credit for MSMEs in Indonesia. It covers regulatory frameworks, market share of fintech services, and the economic impact of fintech on small and medium enterprises.
Fintech, Credit, MSMEs, Regulations, Indonesia
false
Technology and Digital Transformation
Financial Services
Multiple Chart
PwC/Strategy&
Add to my slides
Remove from favorites
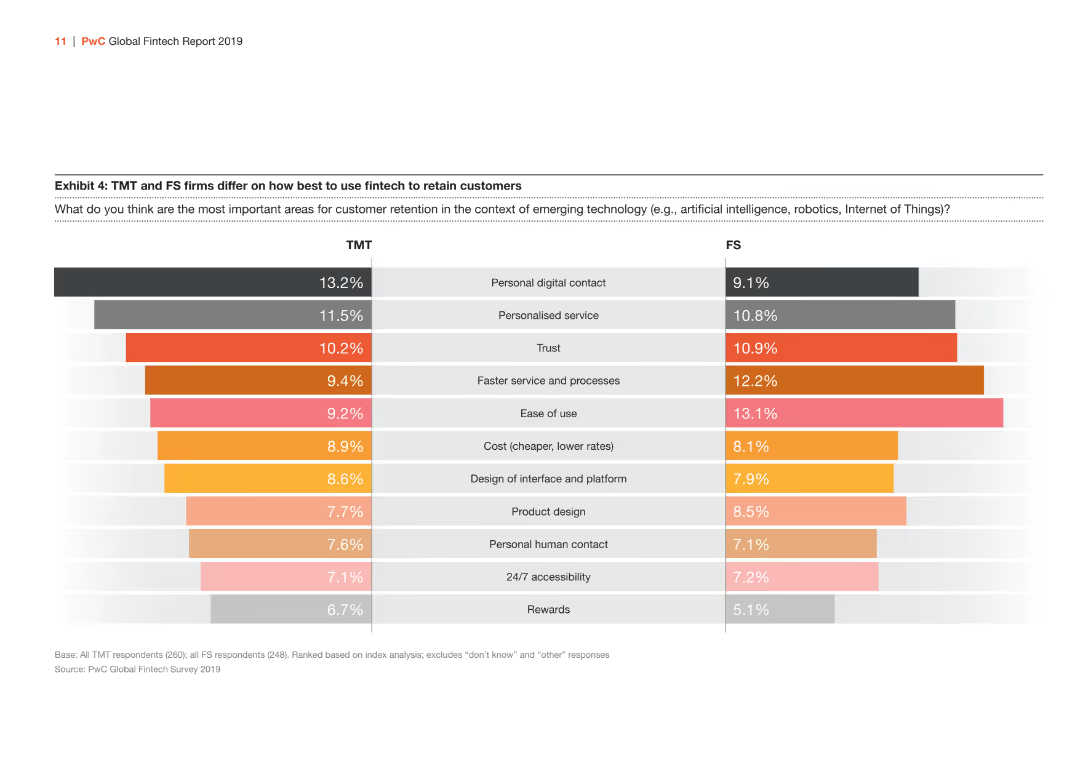
The slide features a bar chart comparing TMT and FS firms on important areas for customer retention through fintech. The bars are orange, red, and gray.
Market Analysis and Trends
Financial Services
Comparison of TMT and FS firms on the importance of various factors like personal digital contact, personalized service, and trust in retaining customers through fintech.
fintech, customer retention, TMT, FS, comparison
false
Market Analysis and Trends
Financial Services
Multiple Chart
PwC/Strategy&
Add to my slides
Remove from favorites
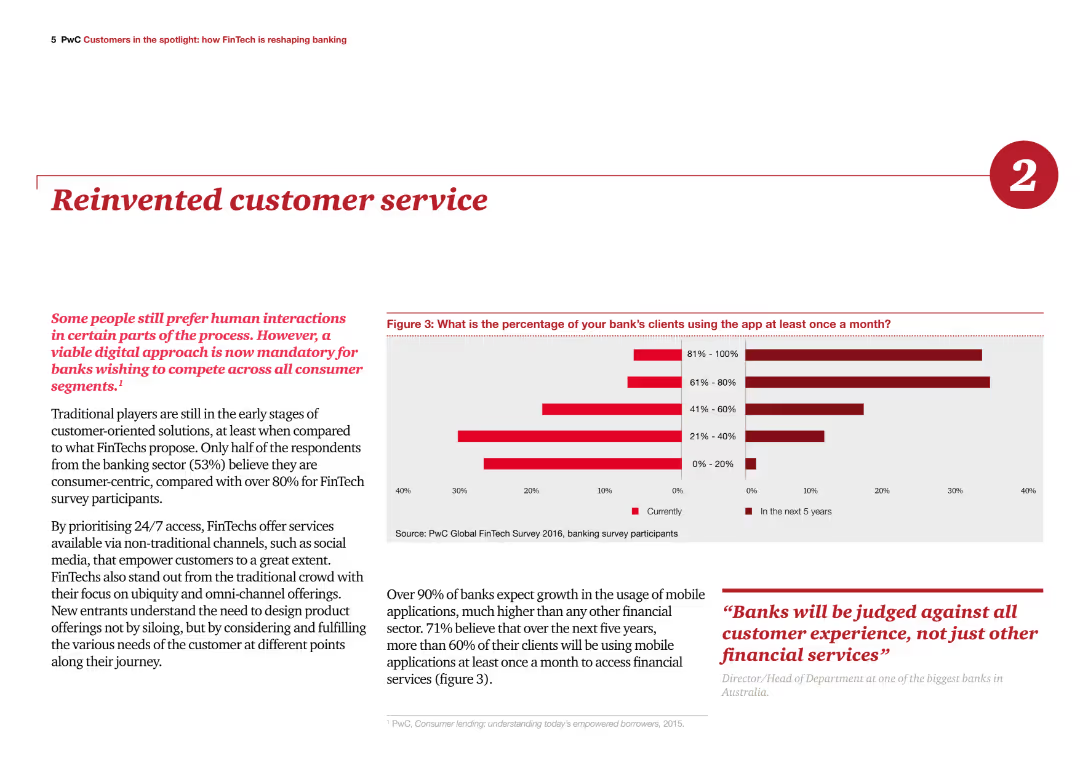
The slide includes a column chart showing the percentage of clients using banking apps, with a focus on digital approaches for customer service. Text on the left explains the necessity of digital solutions for banks.
Customer and Market Segmentation
Financial Services
The slide discusses the shift towards digital customer service in banking, highlighting survey results on app usage and stressing the need for banks to compete with FinTech in customer service innovation.
FinTech, customer service, digital, banking apps, innovation
false
Customer and Market Segmentation
Financial Services
Multiple Chart
PwC/Strategy&
Add to my slides
Remove from favorites
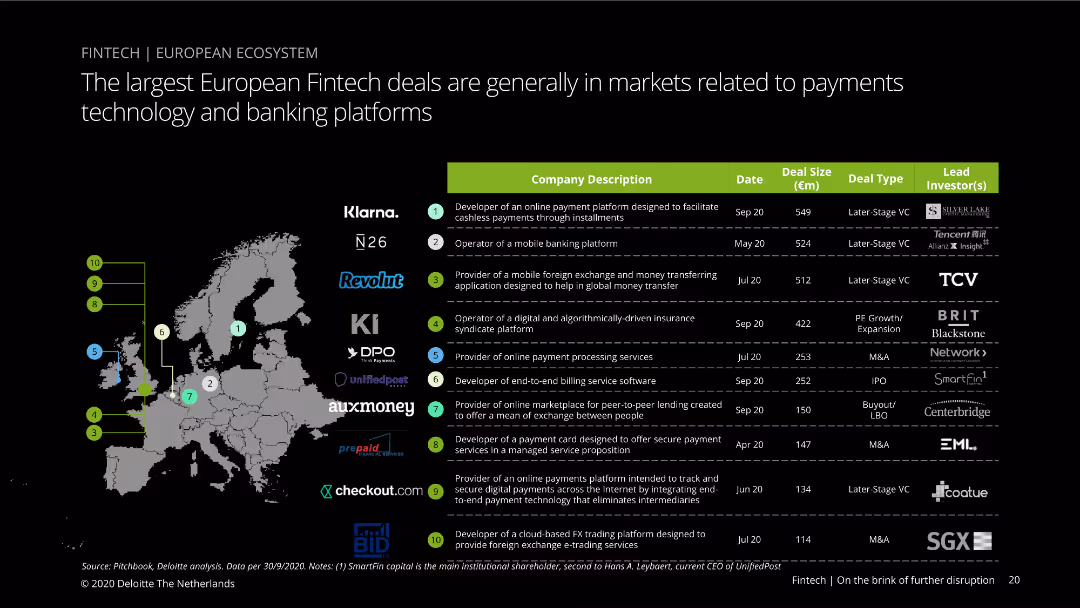
The slide features a map of Europe with markers indicating the location of fintech companies involved in significant deals. A table lists company names, descriptions, deal sizes, dates, and lead investors. Visual complexity is moderate to advanced.
Market Analysis and Trends
Financial Services
The slide presents the top fintech deals in Europe, highlighting key players, deal sizes, and leading investors. It's useful for analyzing trends in fintech investment and identifying major market players.
Fintech, deals, Europe, investors, companies, trends, market
false
Market Analysis and Trends
Financial Services
Table
Deloitte
Add to my slides
Remove from favorites
The slide contains two column charts. The left chart compares digital financial service usage between FinTech users and non-users. The right chart shows adoption by age bracket.
Customer and Market Segmentation
Financial Services
The slide analyzes preferences for digital financial solutions among FinTech users compared to non-users, and details FinTech adoption rates across different age groups.
FinTech, digital solutions, user preferences, age demographics, adoption
false
Customer and Market Segmentation
Financial Services
Multiple Chart
EY
Add to my slides
Remove from favorites
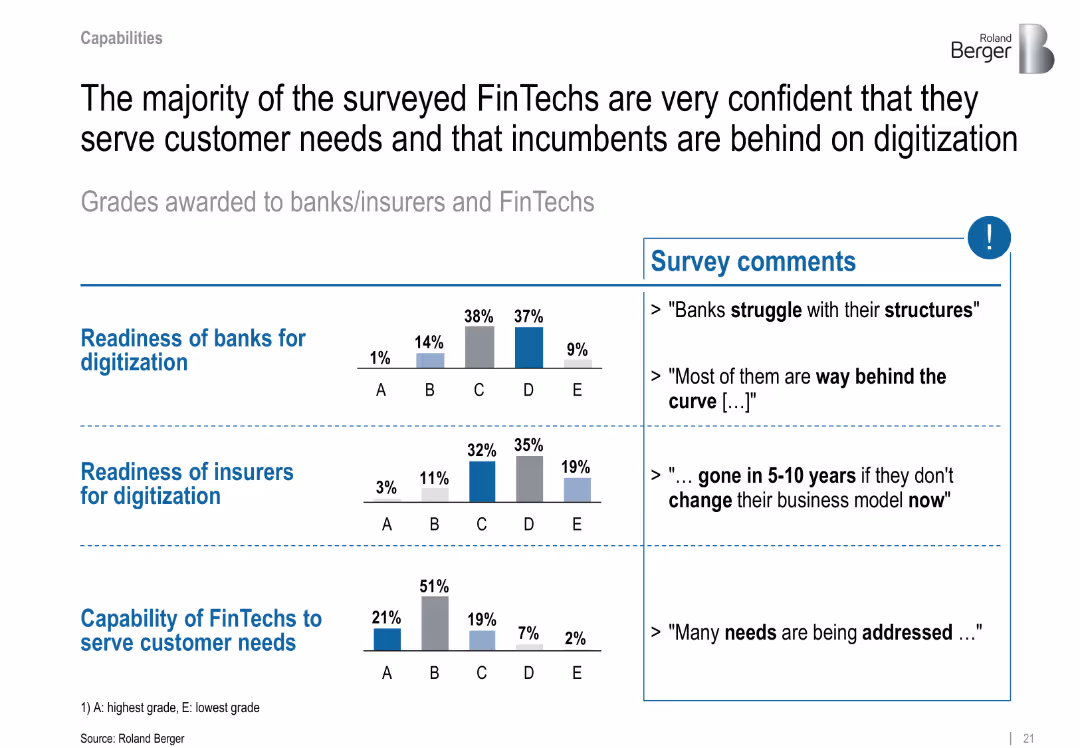
Two-column layout with text summary on the left and survey comments on the right; bar graphs show grading distributions; minimalistic style with blue highlight
Performance Metrics and KPIs
Financial Services
This slide shows FinTechs’ confidence in their customer-serving capabilities compared to banks and insurers, who are viewed as lagging in digitization. Survey comments emphasize institutional sluggishness and structural inefficiencies among incumbents.
FinTech, digitization, survey, customer needs, banks, insurers, grading, readiness, structural issues
false
Performance Metrics and KPIs
Financial Services
Mixed Chart
Roland Berger
Add to my slides
Remove from favorites
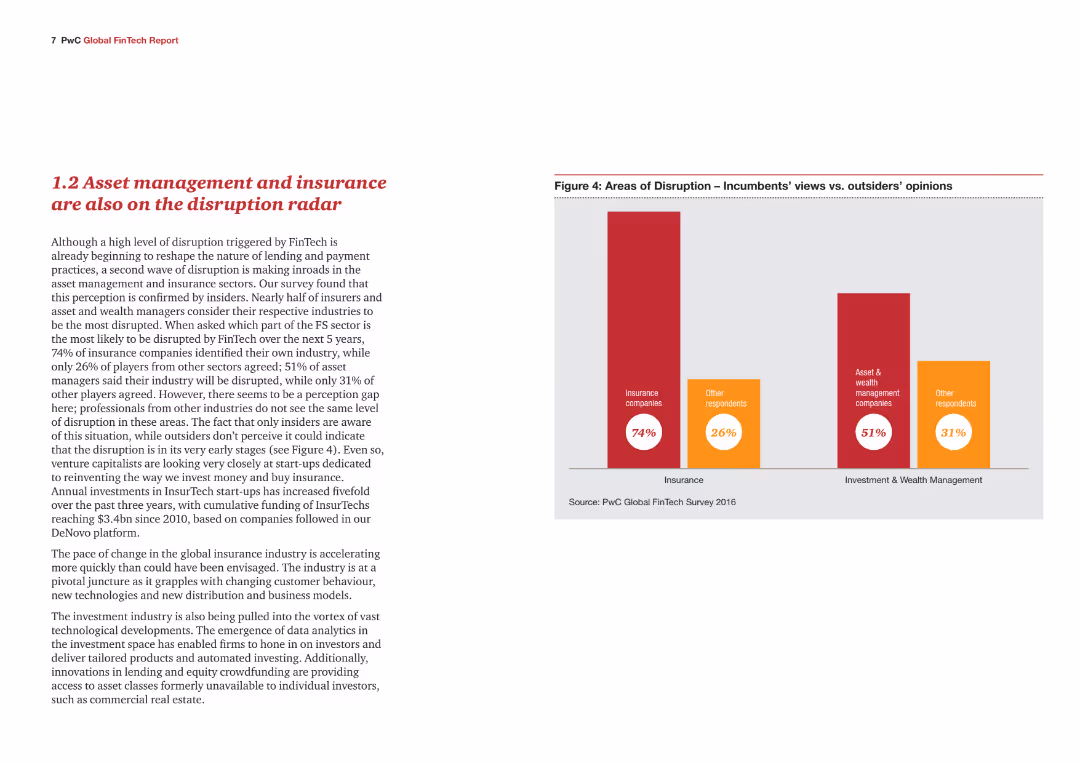
A content slide with text and a bar chart illustrating the survey results indicating high levels of expected disruption in asset management and insurance sectors. It shows the percentage of respondents from different sectors who anticipate significant disruption.
Market Analysis and Trends
Financial Services
This slide explores the anticipated disruption in the asset management and insurance sectors due to FinTech. It presents survey findings to show how these industries are expected to change, highlighting differing perceptions between industry insiders and other respondents.
FinTech, disruption, asset management, insurance, survey results, industry impact, bar chart
false
Market Analysis and Trends
Financial Services
Mixed Chart
PwC/Strategy&
Add to my slides
Remove from favorites
The slide has a split layout with the left side listing new players in payments, lending, and wealth management along with their logos. The right side shows four short text blocks with key strategic insights. There's also a small section on the bottom left with icons representing new technological developments.
Market Analysis and Trends
Financial Services
This slide compares traditional banking with emerging fintech disruptors, focusing on payments, lending, and wealth management. It presents key challenges like unbundling by new players and lower costs. It's used to analyze shifts in the financial industry and strategize on value propositions.
Fintech, Disruption, Banking, Payments, Lending, Wealth Management, Big Data, Blockchain, Cloud, AI
false
Market Analysis and Trends
Financial Services
Boxed
Morgan Stanley
Add to my slides
Remove from favorites
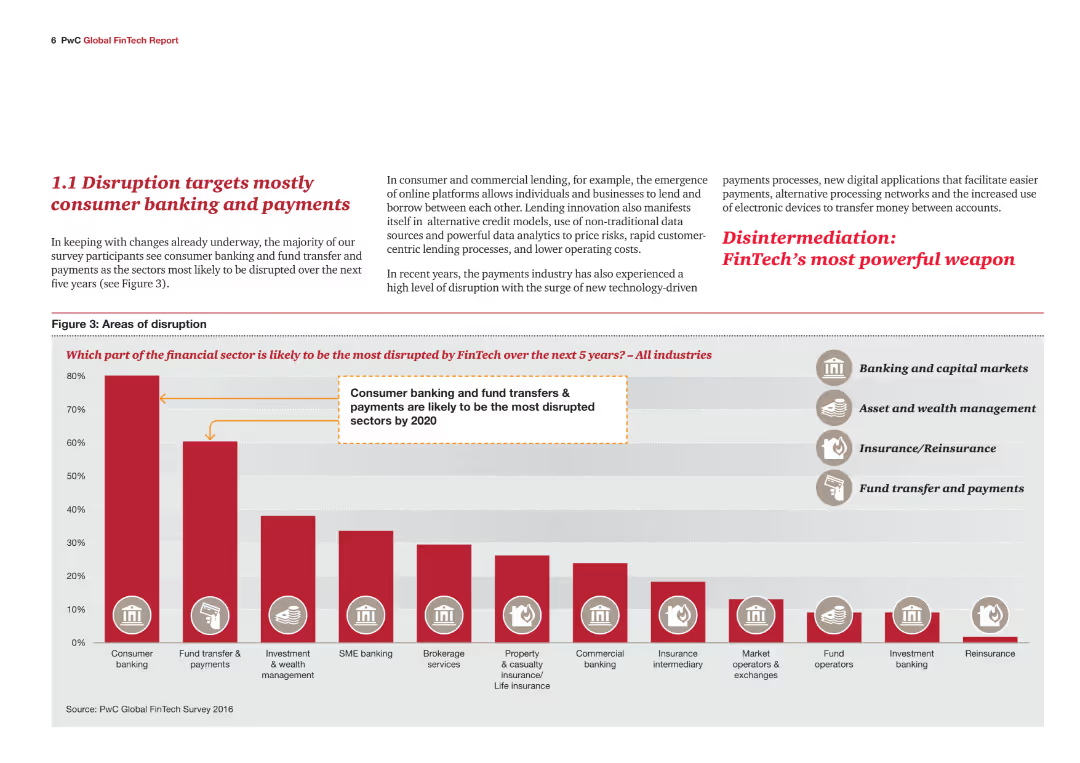
A content slide with text explaining the survey results showing that consumer banking and payments are the most likely sectors to be disrupted by FinTech. Includes a bar chart depicting the percentage of disruption expected in various financial sectors.
Market Analysis and Trends
Financial Services
This slide discusses the areas of the financial sector most likely to be disrupted by FinTech over the next five years, focusing on consumer banking and payments. It uses survey data to highlight trends and predict areas of significant technological impact.
FinTech, disruption, consumer banking, payments, survey results, financial sectors, bar chart
false
Market Analysis and Trends
Financial Services
Mixed Chart
PwC/Strategy&
Add to my slides
Remove from favorites
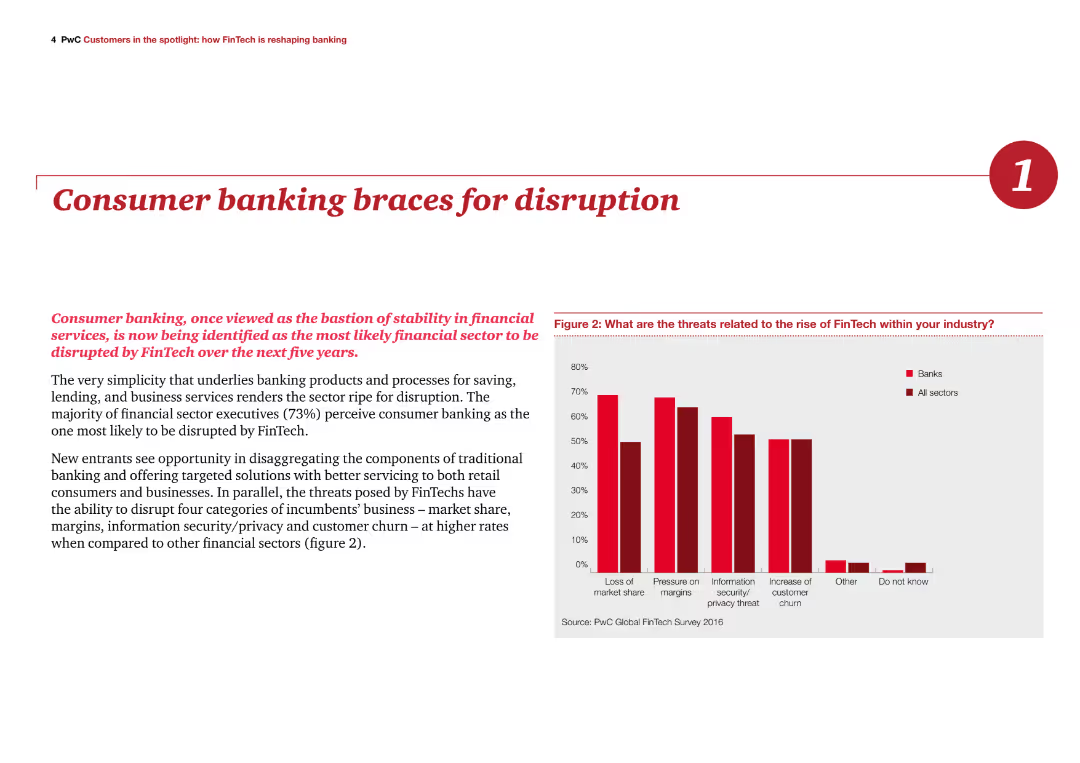
The slide features a column chart on the right illustrating threats posed by FinTech within the banking industry. The text discusses the disruption in consumer banking caused by FinTech advancements.
Market Analysis and Trends
Financial Services
The slide analyzes the threats and opportunities presented by FinTech in the consumer banking sector, emphasizing the potential for disruption and the need for banks to adapt to these changes.
FinTech, disruption, consumer banking, threats, opportunities
false
Market Analysis and Trends
Financial Services
Mixed Chart
PwC/Strategy&
Add to my slides
Remove from favorites
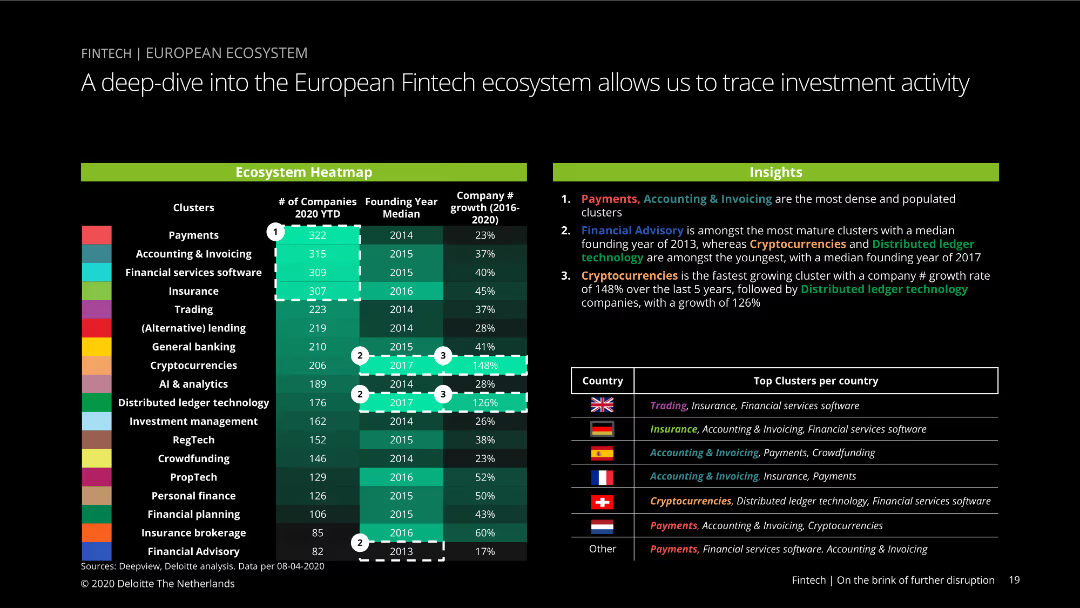
Heatmap chart showing the number of fintech companies by cluster, founding year, and growth rate from 2016 to 2020, with country flags indicating top clusters by country.
Market Analysis and Trends
Financial Services
Deep dive into the European fintech ecosystem, showing investment activity, growth rates, and the most populous clusters, with insights into sector trends and regional leaders.
fintech, ecosystem, Europe, investment, clusters, growth rate, founding year, top clusters, sector trends, regional leaders
false
Market Analysis and Trends
Financial Services
Header Horizontal
Deloitte
Add to my slides
Remove from favorites
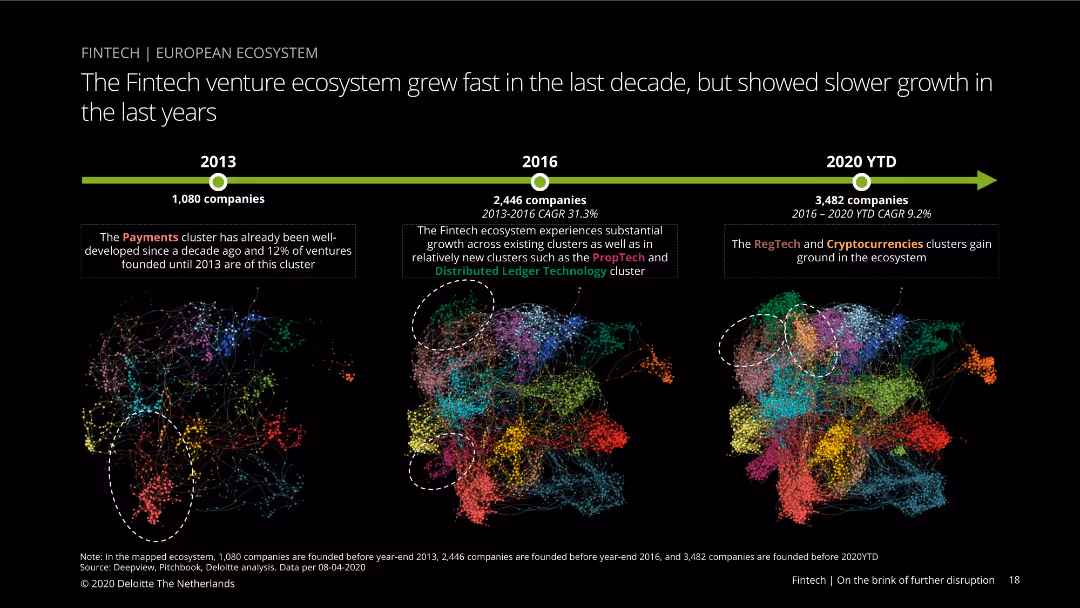
Diagram slide with three visual maps showing the growth of the fintech venture ecosystem in Europe from 2013 to 2020, with clusters representing different fintech sectors.
Market Analysis and Trends
Financial Services
Tracks the growth of the fintech venture ecosystem in Europe over the past decade, highlighting the increase in ventures and the recent slowdown, with sector-specific growth analysis.
fintech, ecosystem, Europe, venture growth, clusters, 2013-2020, market analysis, sector growth, RegTech, cryptocurrencies
false
Market Analysis and Trends
Financial Services
Linear Flow
Deloitte
Add to my slides
Remove from favorites
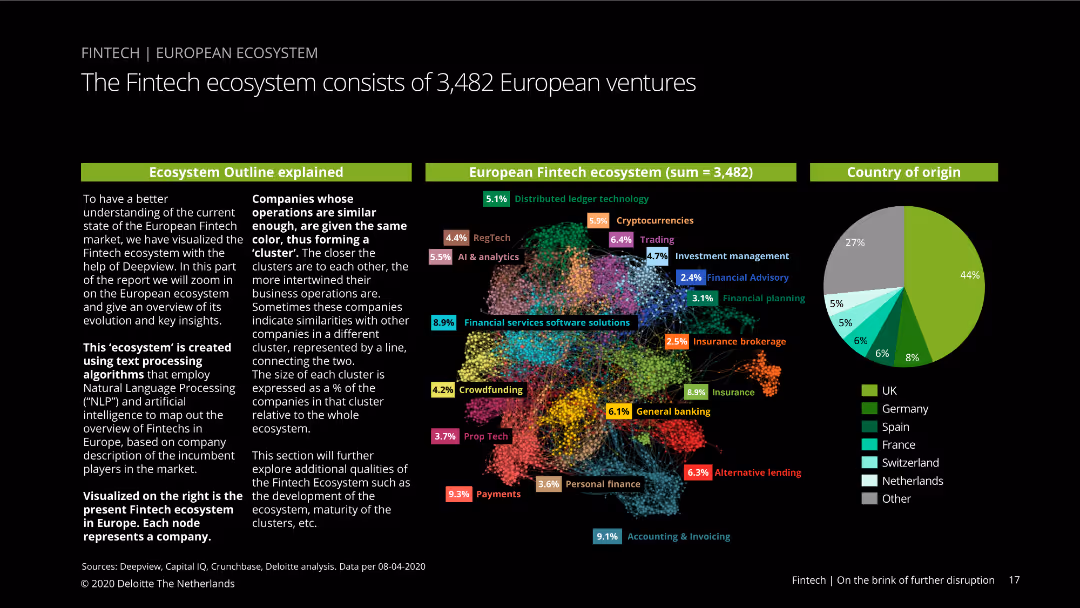
Visual ecosystem map showing clusters of European fintech companies, with a pie chart indicating country origins. Nodes are color-coded by business operations similarity.
Market Analysis and Trends
Financial Services
Provides an overview of the European fintech ecosystem, including the number of ventures, business operation clusters, and country origins, with insights into market trends and growth.
fintech, ecosystem, Europe, ventures, clusters, business operations, country origin, market trends, Deepview, Capital IQ
false
Market Analysis and Trends
Financial Services
Mixed Chart
Deloitte
Add to my slides
Remove from favorites
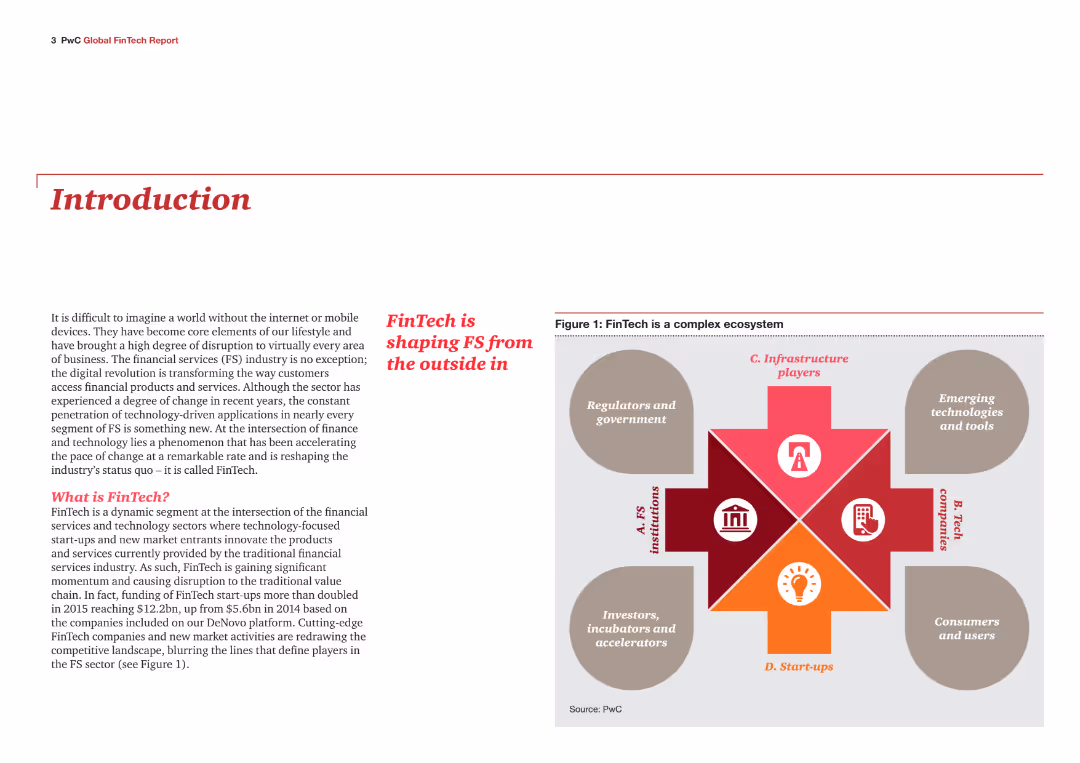
Introduction slide with text explaining the FinTech industry's impact on financial services. Includes an infographic showing the FinTech ecosystem, consisting of FS institutions, tech companies, start-ups, regulators, and government.
Industry Overview
Financial Services
This slide introduces the report on the FinTech industry's influence on financial services. It defines FinTech and highlights its role in transforming the industry through digital applications and technology-driven innovations, setting the stage for detailed analysis in the report.
FinTech, financial services, introduction, industry impact, digital transformation, ecosystem
false
Industry Overview
Financial Services
Diagram
PwC/Strategy&
Add to my slides
Remove from favorites
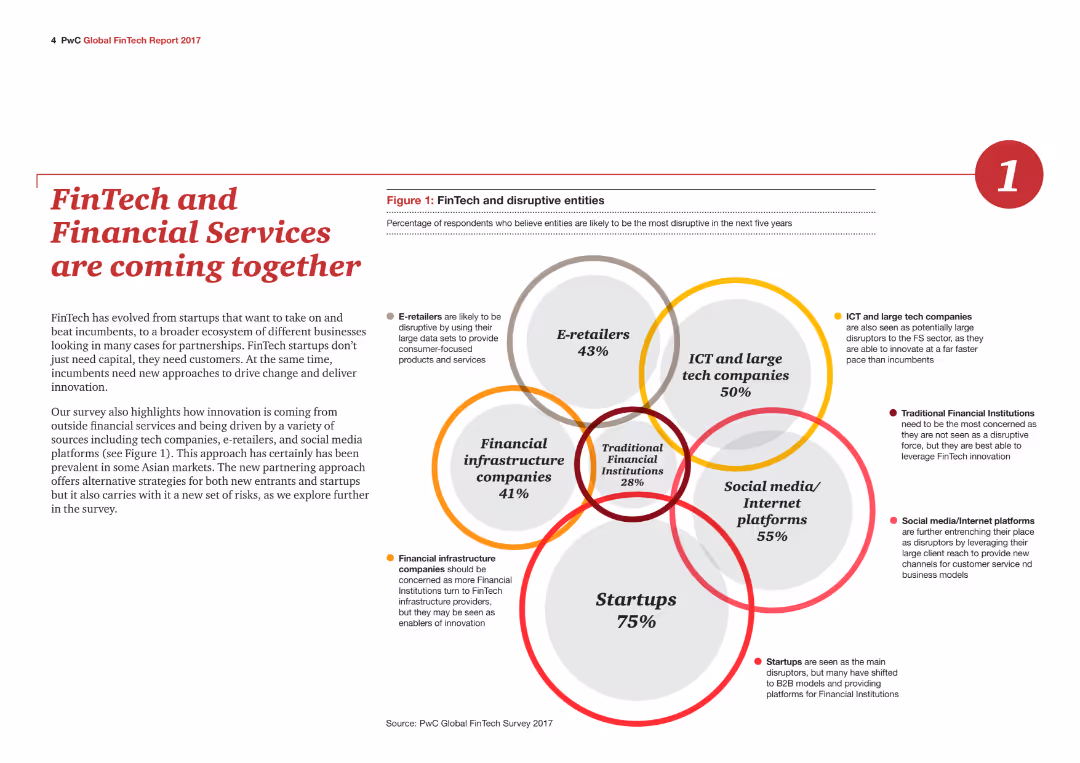
A Venn diagram illustrating the convergence of different business sectors with FinTech, including e-retailers, ICT, financial infrastructure, social media, and startups.
Technology and Digital Transformation
Financial Services
The slide explains how FinTech is integrating with other sectors, driven by technological innovation and partnerships, as detailed in a Venn diagram.
FinTech, Financial Services, Technology, Innovation, Integration, Partnerships, E-retailers, ICT, Infrastructure, Startups
false
Technology and Digital Transformation
Financial Services
Mixed Chart
PwC/Strategy&
Add to my slides
Remove from favorites
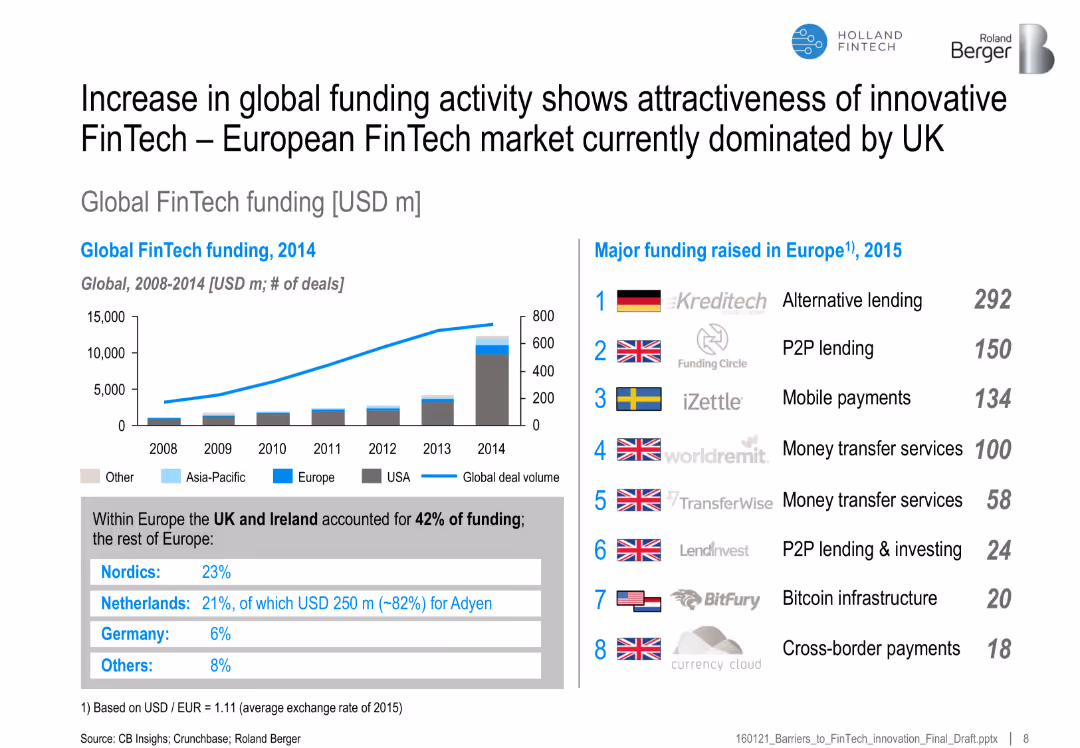
Line and bar chart of global FinTech funding by region (2008–2014); list of top funded firms in Europe in 2015 on right
Investment Analysis
Financial Services
Highlights the surge in FinTech funding globally and identifies the UK and Nordics as dominant regions in Europe. Lists top funded companies and their sectors.
FinTech funding, Europe, startups, investment, UK, Adyen, Kreditech, deal volume, financial technology
false
Investment Analysis
Financial Services
Mixed Chart
Roland Berger
Add to my slides
Remove from favorites
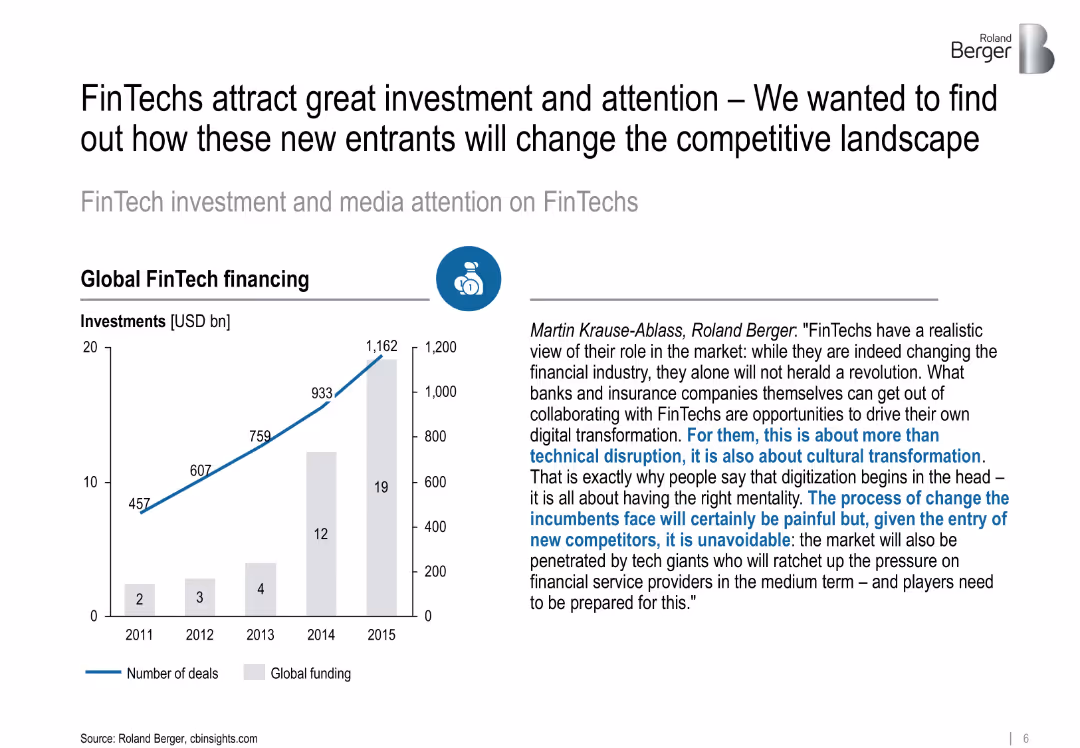
Left: bar and line chart showing FinTech funding growth (2011–2015); Right: expert quote in paragraph format
Investment Analysis
Financial Services
Demonstrates significant growth in global FinTech investments and underlines their role in digital and cultural transformation in financial services, supported by expert commentary.
FinTech funding, investments, digital transformation, cultural change, competitive landscape
false
Investment Analysis
Financial Services
Mixed Chart
Roland Berger
Add to my slides
Remove from favorites
The slide is moderately complex with a mix of textual content and images. The left side details the acquisition of a fintech company, while the right side shows a flow diagram of the healthcare provider revenue cycle management value chain. The focal point of the fintech acquisition is highlighted, and the company's healthcare vertical is briefly overviewed. The design is clean and organized, utilizing the brand's color palette.
Strategic Planning
Financial Services
This slide communicates the strategic acquisition of a fintech company to enhance payment reconciliation services for healthcare providers. It depicts how this acquisition aligns with the company’s digital strategy and treasury management services, offering a glance at the broader strategic growth within the healthcare vertical.
Fintech, Healthcare, Strategic Acquisition, Revenue Cycle Management, Digital Payments, Managed Services, Growth Strategy, Treasury Management
false
Strategic Planning
Financial Services
Header Horizontal
Morgan Stanley
Add to my slides
Remove from favorites
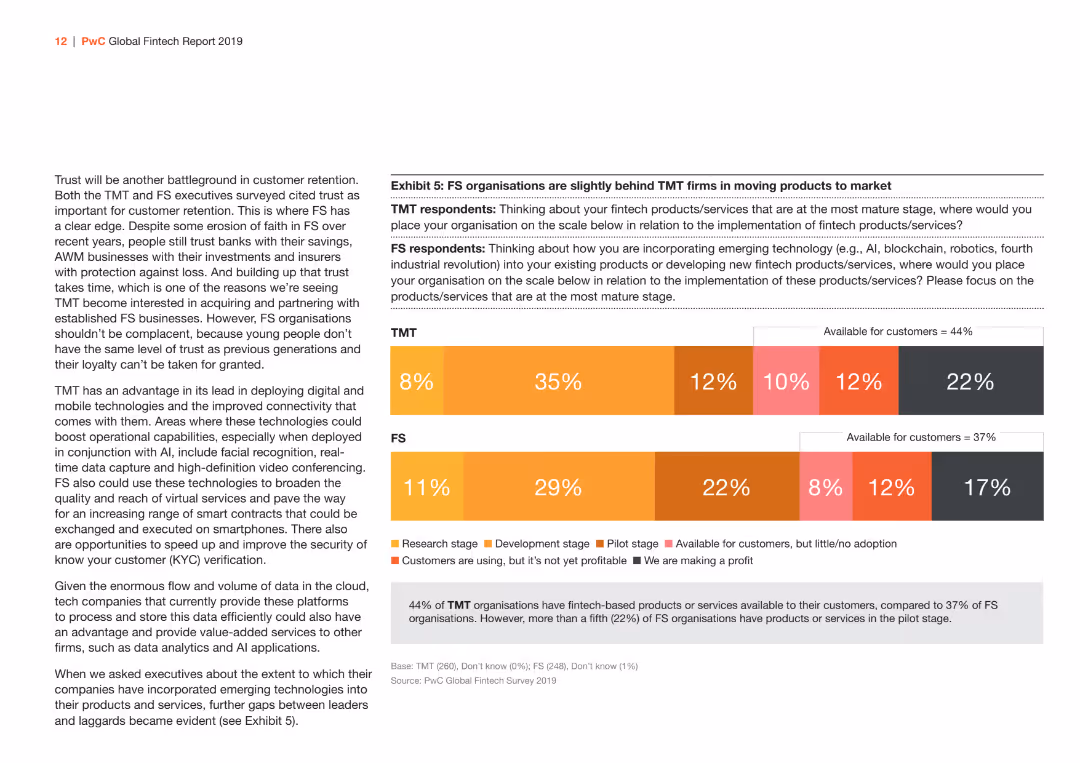
This slide has a bar chart comparing the implementation stages of fintech products/services between TMT and FS sectors. The bars are in shades of orange and gray.
Market Analysis and Trends
Financial Services
Illustrates the differences between TMT and FS sectors in the implementation stages of fintech products/services, showing the proportion of firms at each stage from research to profitability.
fintech, implementation, TMT, FS, products/services
false
Market Analysis and Trends
Financial Services
Mixed Chart
PwC/Strategy&
Add to my slides
Remove from favorites
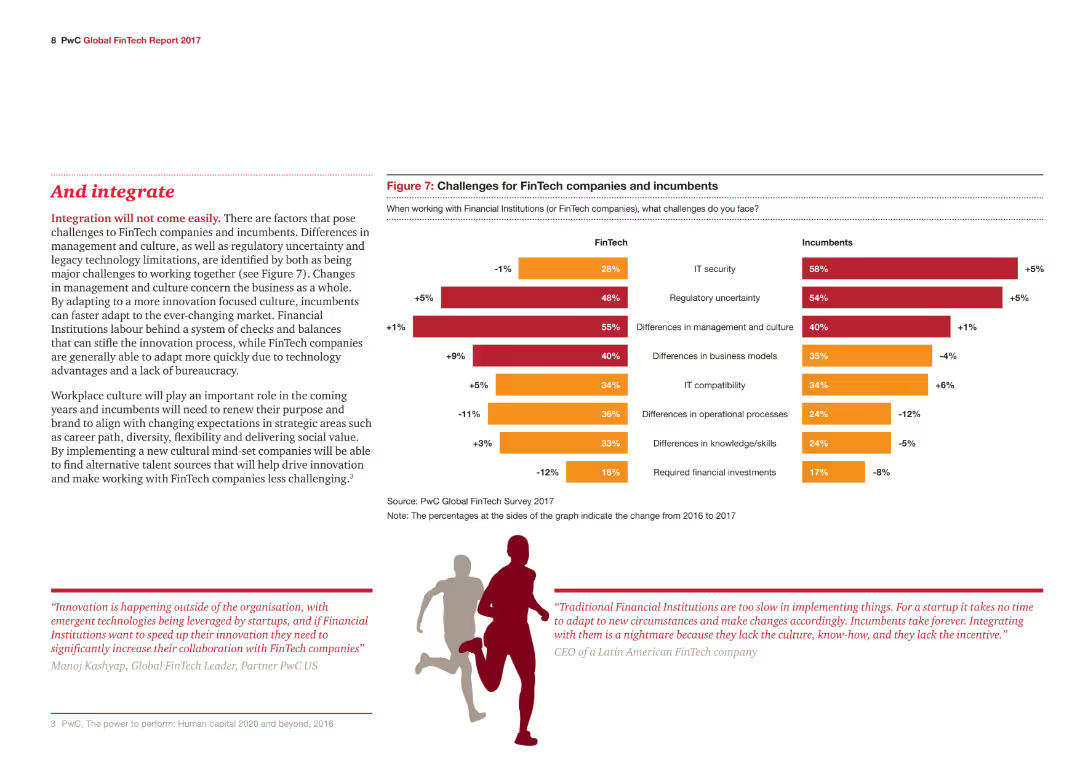
The slide features a column chart comparing the challenges faced by FinTech companies and incumbents, with color-coded bars indicating different percentages for various challenges.
Risk Assessment and Management
Financial Services
The slide discusses the challenges FinTech companies and incumbents face, such as IT security, regulatory uncertainty, and differences in management and culture.
FinTech, Incumbents, IT security, Management, Culture
false
Risk Assessment and Management
Financial Services
Multiple Chart
PwC/Strategy&
Add to my slides
Remove from favorites
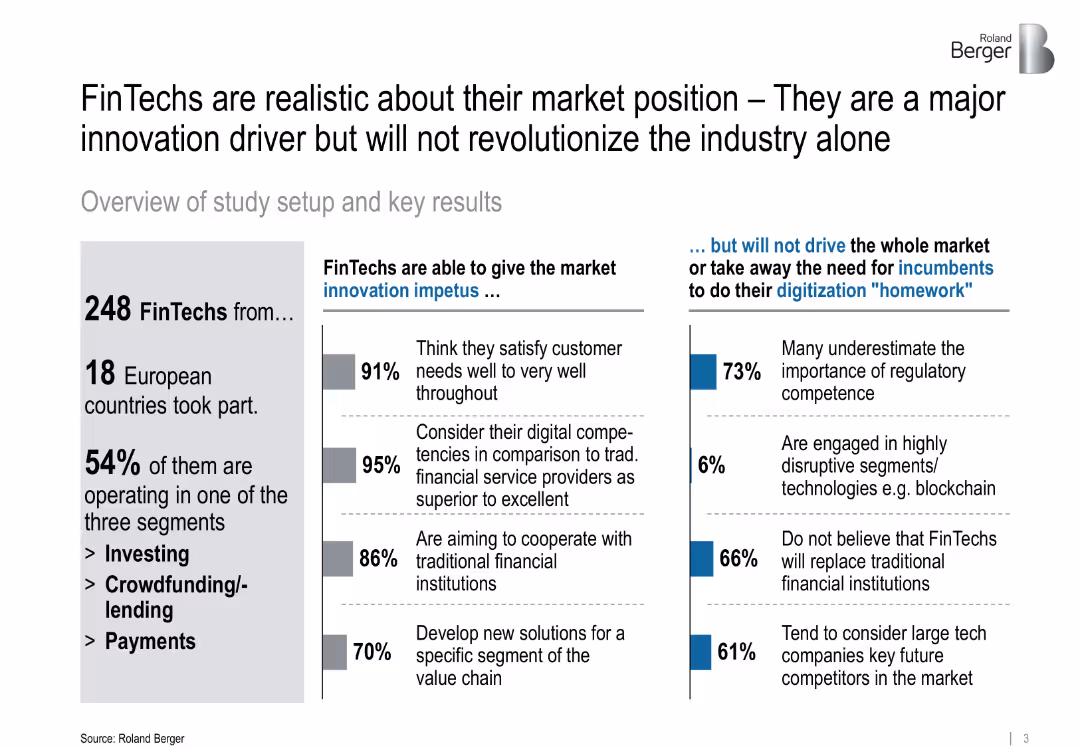
Split-panel layout with statistics, bullet points, and colored bars; simple visual style with balanced white space
Market Analysis and Trends
Financial Services
Highlights the realistic self-assessment of FinTechs in Europe, noting that while they are innovation drivers, they are not expected to revolutionize the market alone. The slide shares percentages on customer satisfaction, cooperation with traditional banks, and regulatory gaps.
FinTech, innovation, regulation, digitalization, cooperation, market drivers, blockchain, technology
false
Market Analysis and Trends
Financial Services
Mixed Chart
Roland Berger
Add to my slides
Remove from favorites
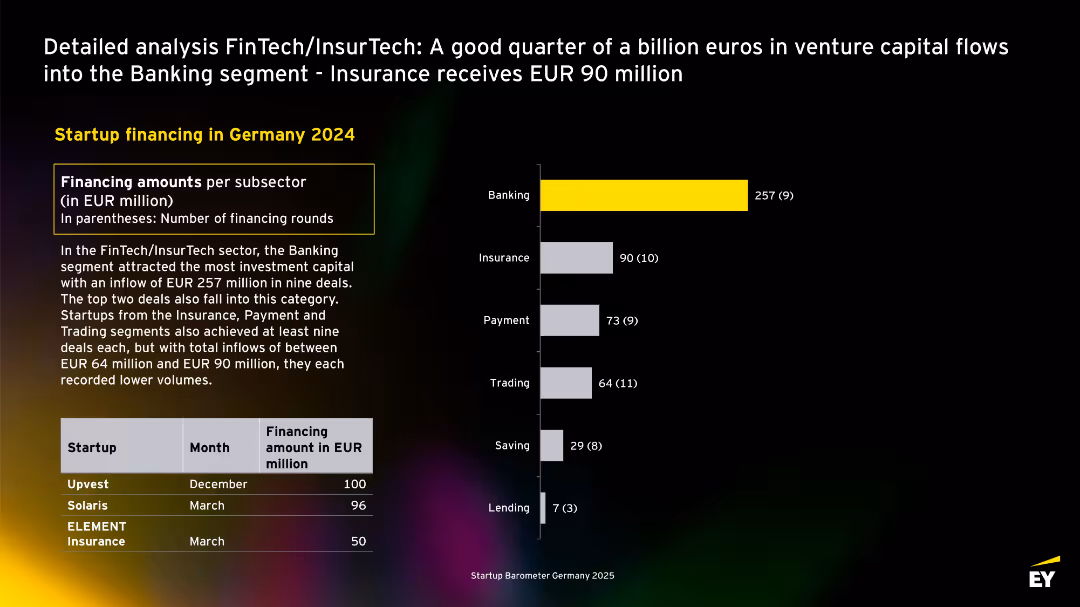
Horizontal bar chart with Banking in yellow; textual explanation and top-funded startup table at bottom-left.
Investment Analysis
Financial Services
In 2024, EUR 257M went to the Banking segment in FinTech/InsurTech, followed by Insurance (EUR 90M) and Payment (EUR 73M). Startups like Upvest and Solaris lead the funding chart.
FinTech, InsurTech, banking, insurance, startups, funding, Germany, 2024, capital
false
Investment Analysis
Financial Services
Mixed Chart
EY
Add to my slides
Remove from favorites
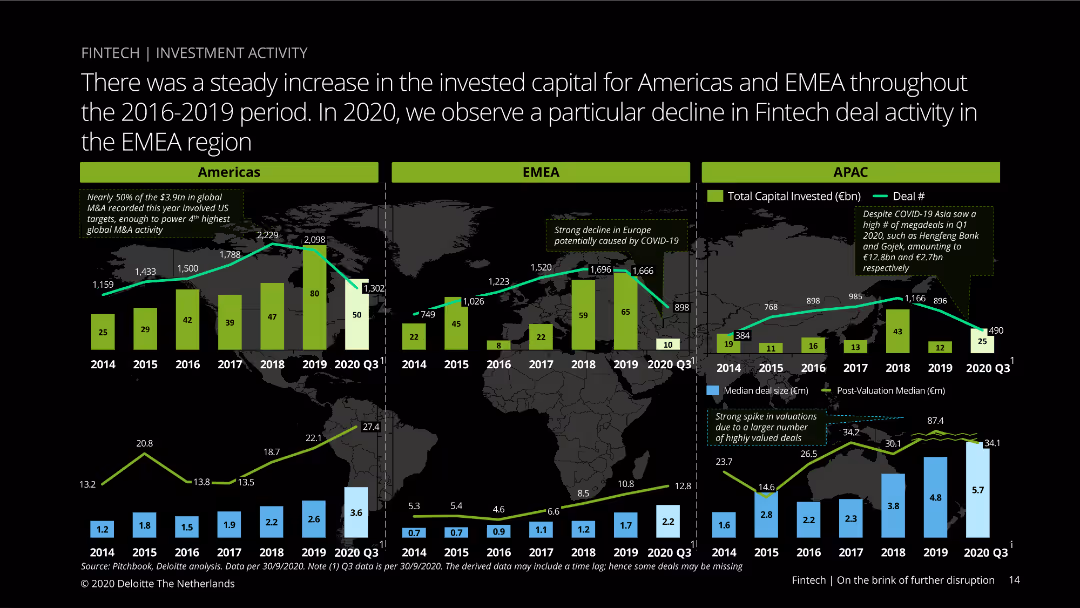
Multi-column charts showing fintech investment trends across Americas, EMEA, and APAC regions from 2014 to 2020 Q3, with maps indicating regional investment distribution.
Market Analysis and Trends
Financial Services
Reviews fintech investment trends across different regions, noting steady increases in the Americas and EMEA up to 2019, followed by a decline in EMEA in 2020 due to COVID-19.
fintech, investment, Americas, EMEA, APAC, regional trends, deal activity, COVID-19 impact, capital, analysis
false
Market Analysis and Trends
Financial Services
Multiple Chart
Deloitte
Add to my slides
Remove from favorites
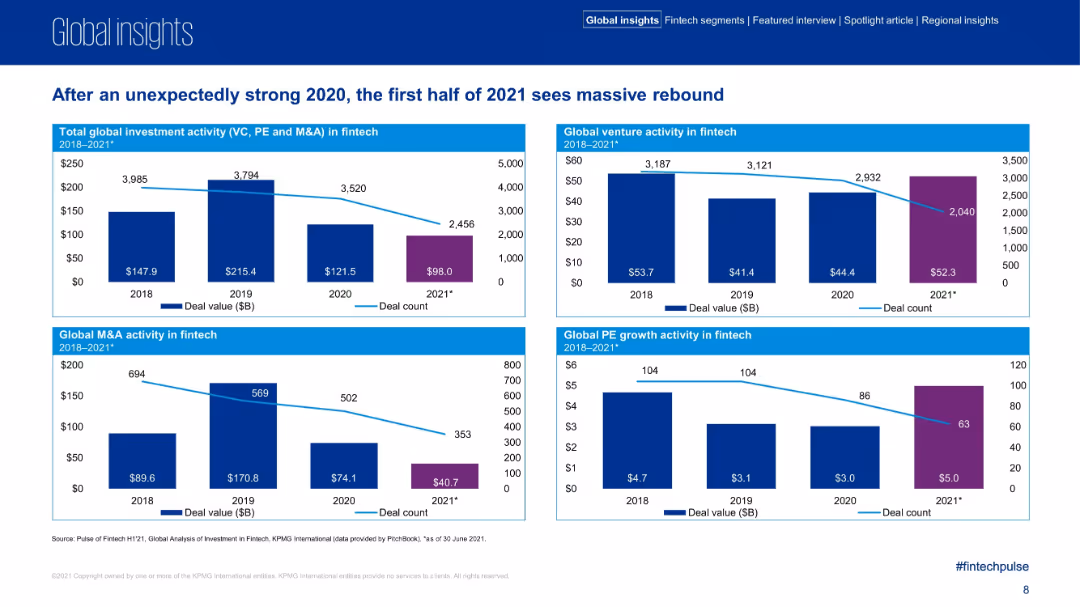
Four-pane chart layout showing deal value and count from 2018 to 2021 across VC, PE, M&A, and overall fintech.
Market Analysis and Trends
Financial Services
This slide analyzes global fintech investment activity from 2018 to 2021 across several categories. It notes fluctuations in deal value and count, showing a rebound in early 2021 and breaking down activities by investment type (VC, M&A, PE).
fintech investment, VC, PE, M&A, deal value, deal count, trends, 2021 rebound
false
Market Analysis and Trends
Financial Services
Multiple Chart
KPMG
Add to my slides
Remove from favorites
Contains a column chart and a line graph depicting the amount of investment in USD million and number of deals across various sectors including FinTech, Real Estate, etc
Market Analysis and Trends
Financial Services
Analyzes sector-wise venture capital investment and deals in 2019, emphasizing FinTech's significant share of the market
FinTech, investment, VC, sectors, 2019
false
Market Analysis and Trends
Financial Services
Single Chart
McKinsey
Add to my slides
Remove from favorites
This slide has bar graphs comparing the fintech lending market size in tier 2 and tier 3 cities with textual annotations for clarity.
Market Analysis and Trends
Financial Services
It assesses the growth of consumer lending within the digital space, informative for financial services and market trend analysis.
Fintech, lending, market growth, digital space, consumer behavior, tier 2, tier 3, market analysis
false
Market Analysis and Trends
Financial Services
Mixed Chart
Kearney
Add to my slides
Remove from favorites
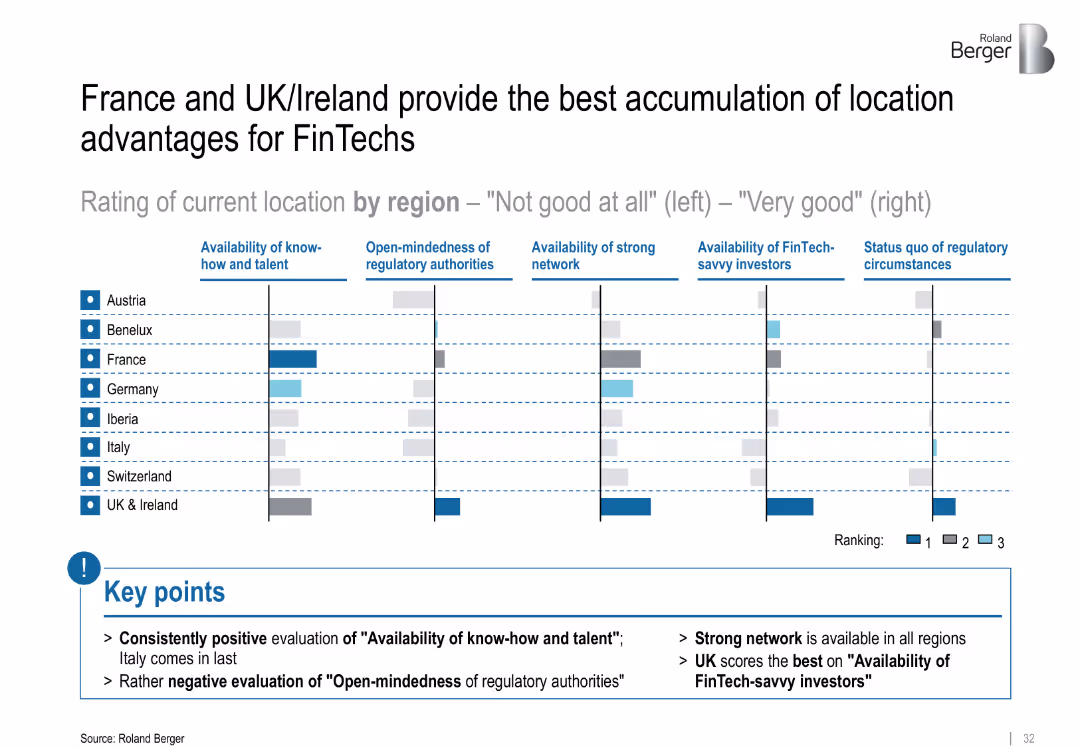
Comparative bar matrix showing location ratings across European regions; color-coded rankings (1–3); summary points highlighted below
Market Analysis and Trends
Financial Services
The slide benchmarks European regions based on FinTech-relevant criteria like talent, regulatory openness, and investor access. UK & Ireland and France rank highest across most factors. Italy scores poorly, particularly on regulatory openness.
FinTech, location analysis, regulatory openness, talent, investors, regional comparison, network
false
Market Analysis and Trends
Financial Services
Mixed Chart
Roland Berger
Add to my slides
Remove from favorites
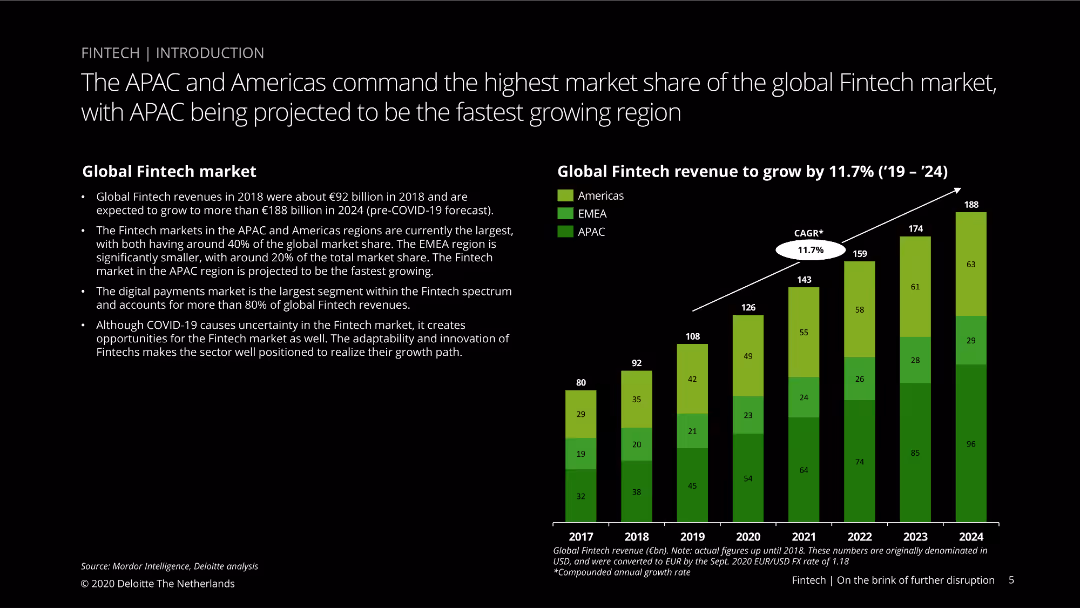
This slide features a column chart showing global fintech revenue growth from 2017 to 2024, segmented by region (Americas, EMEA, APAC), with green, yellow, and blue colors.
Market Analysis and Trends
Financial Services
Discusses the global fintech market size and growth projections, highlighting the dominance of the APAC and Americas regions and the impact of COVID-19 on fintech growth opportunities.
Fintech, market share, APAC, Americas, EMEA, growth, COVID-19, projections, digital payments, innovation
false
Market Analysis and Trends
Financial Services
Mixed Chart
Deloitte
Add to my slides
Remove from favorites
This slide has a clear white background with two pie charts in contrasting colors, blue for fintech and green for metaverse. It includes percentage texts and icons representing various technologies. A small image of a woman using headphones and a laptop is in the top right corner.
Market Analysis and Trends
Technology & Software
It compares the adoption rates of various fintech and metaverse technologies in Southeast Asia, indicating the maturity level in the region.
fintech, metaverse, Southeast Asia, adoption rates, e-Wallets, Cryptocurrencies, AR, VR
false
Market Analysis and Trends
Technology & Software
Multiple Chart
Bain
Add to my slides
Remove from favorites
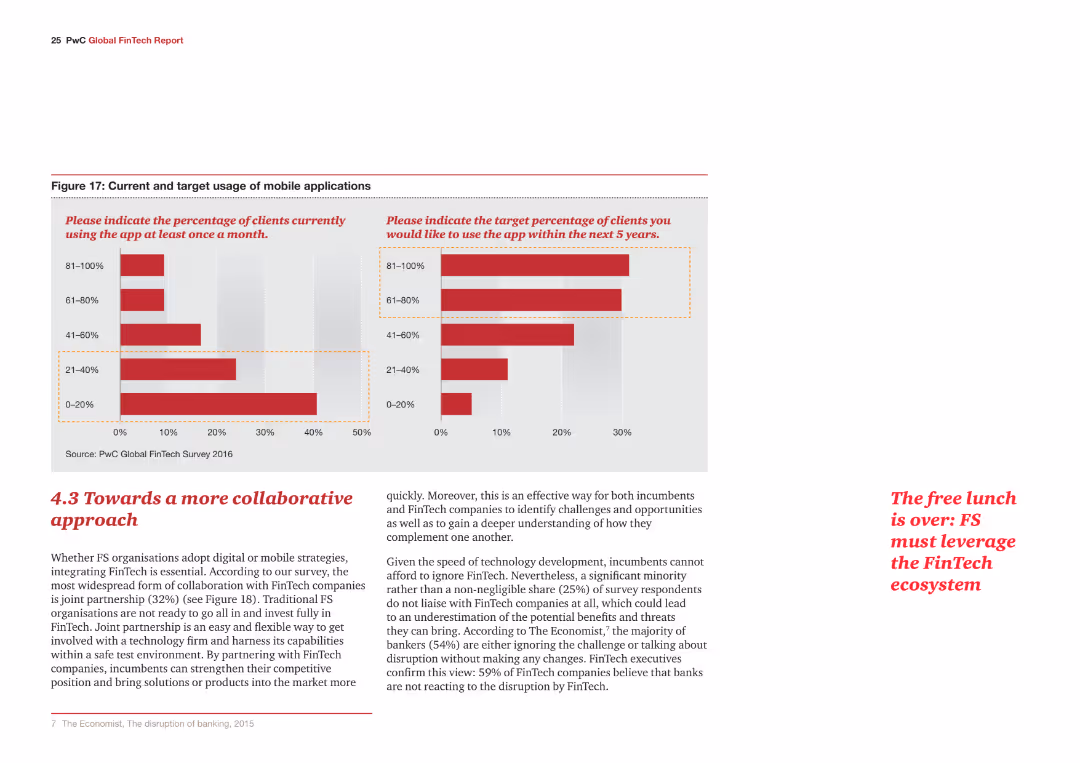
The slide includes two column charts comparing current and target usage of mobile applications, with red bars indicating usage percentages. Below the charts, a paragraph of text discusses the approach towards collaboration in FinTech.
Strategic Planning
Financial Services
The slide presents data on current and target usage of mobile applications and discusses the necessity for a collaborative approach in integrating FinTech for traditional financial service organizations.
FinTech, mobile applications, collaboration, strategy, integration
false
Strategic Planning
Financial Services
Multiple Chart
PwC/Strategy&
Add to my slides
Remove from favorites
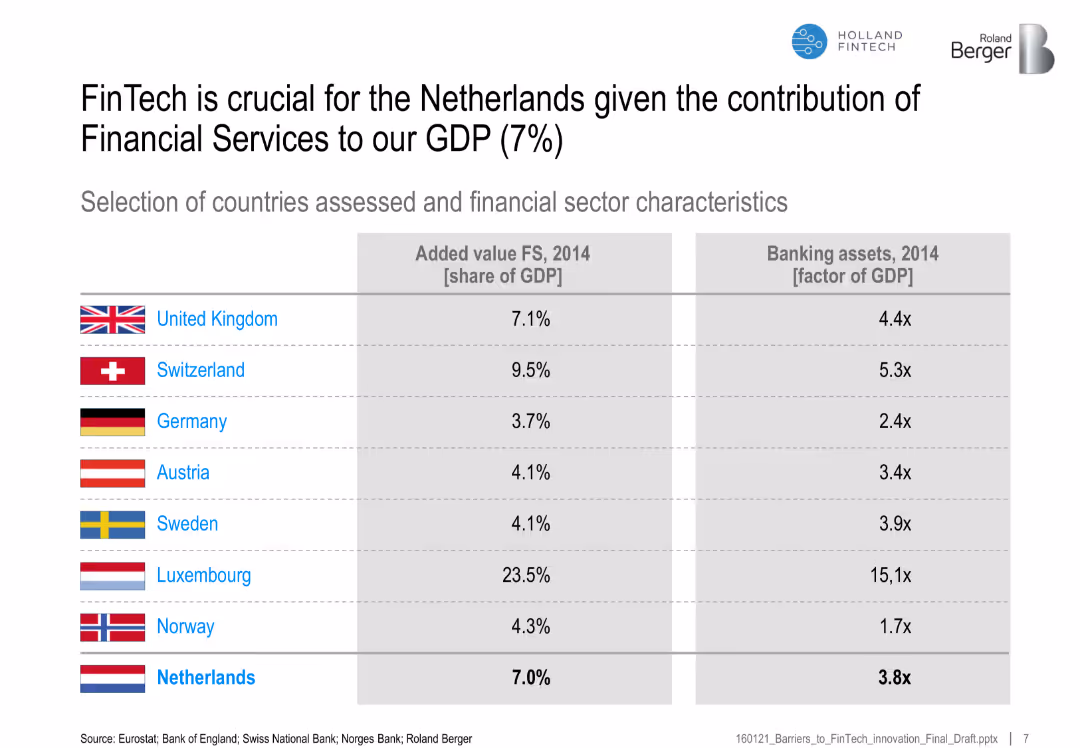
Table comparing countries by financial services' GDP share and banking assets as GDP multiple
Financial Performance
Financial Services
This slide shows the significance of financial services in different countries' GDPs, emphasizing the importance of FinTech for the Netherlands given its 7% GDP share from FS.
FinTech, Netherlands, GDP share, financial services, banking assets, country comparison
false
Financial Performance
Financial Services
Table
Roland Berger
Add to my slides
Remove from favorites
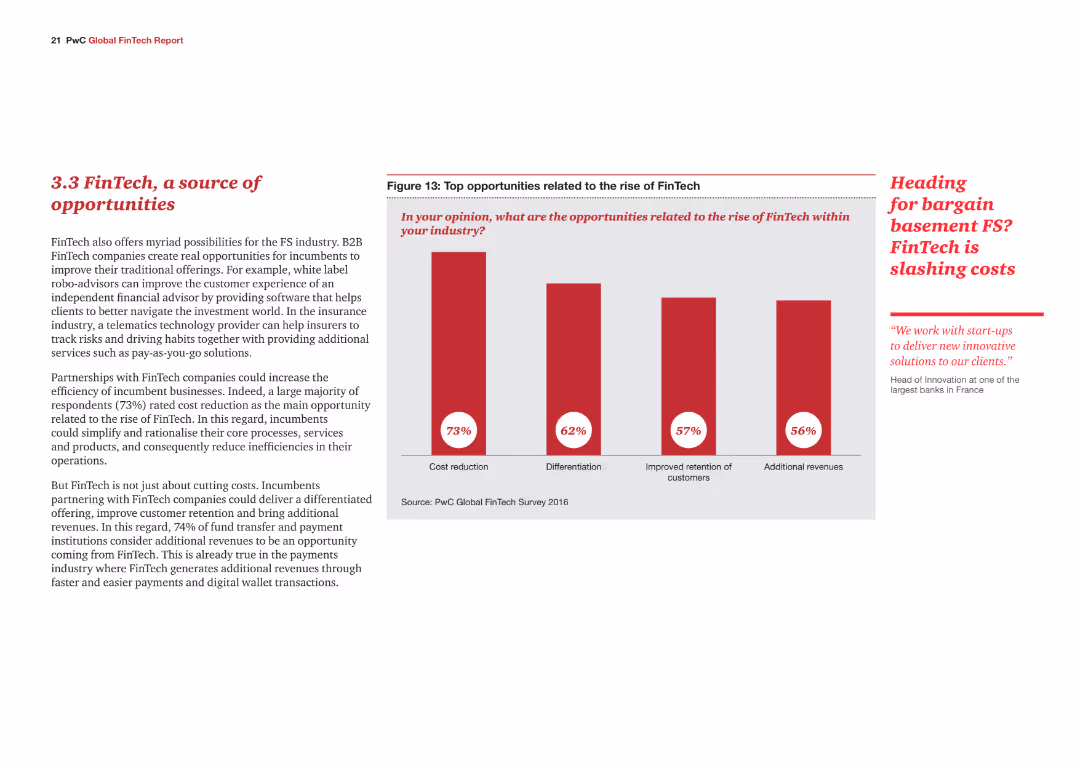
The slide contains a column chart and text. The chart outlines top opportunities related to the rise of FinTech.
Market Analysis and Trends
Financial Services
The slide highlights opportunities that FinTech presents to incumbents, such as cost reduction and improved customer retention.
FinTech, opportunities, cost reduction, customer retention, financial services
false
Market Analysis and Trends
Financial Services
Mixed Chart
PwC/Strategy&
Add to my slides
Remove from favorites
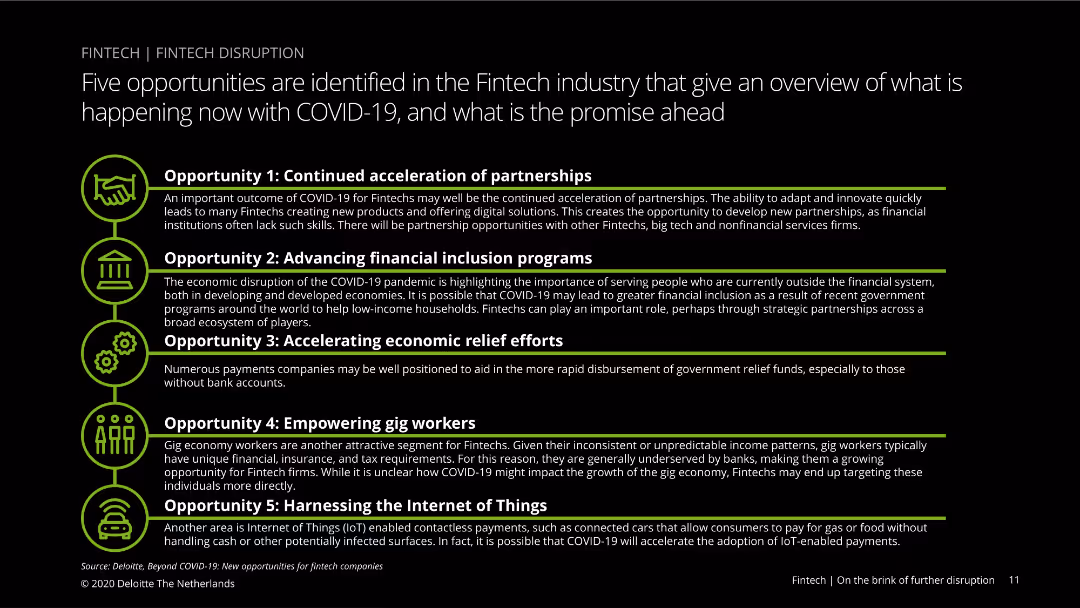
Features five opportunities for fintechs during COVID-19, each with an icon and brief text description. Opportunities include partnerships, financial inclusion, economic relief, etc.
Strategic Planning
Financial Services
Identifies and explains five key opportunities for fintech companies during the COVID-19 pandemic, such as partnerships, advancing financial inclusion, and leveraging the Internet of Things.
fintech, opportunities, COVID-19, partnerships, financial inclusion, economic relief, gig workers, IoT, strategic planning, innovation
false
Strategic Planning
Financial Services
Vertical Flow
Deloitte
Add to my slides
Remove from favorites
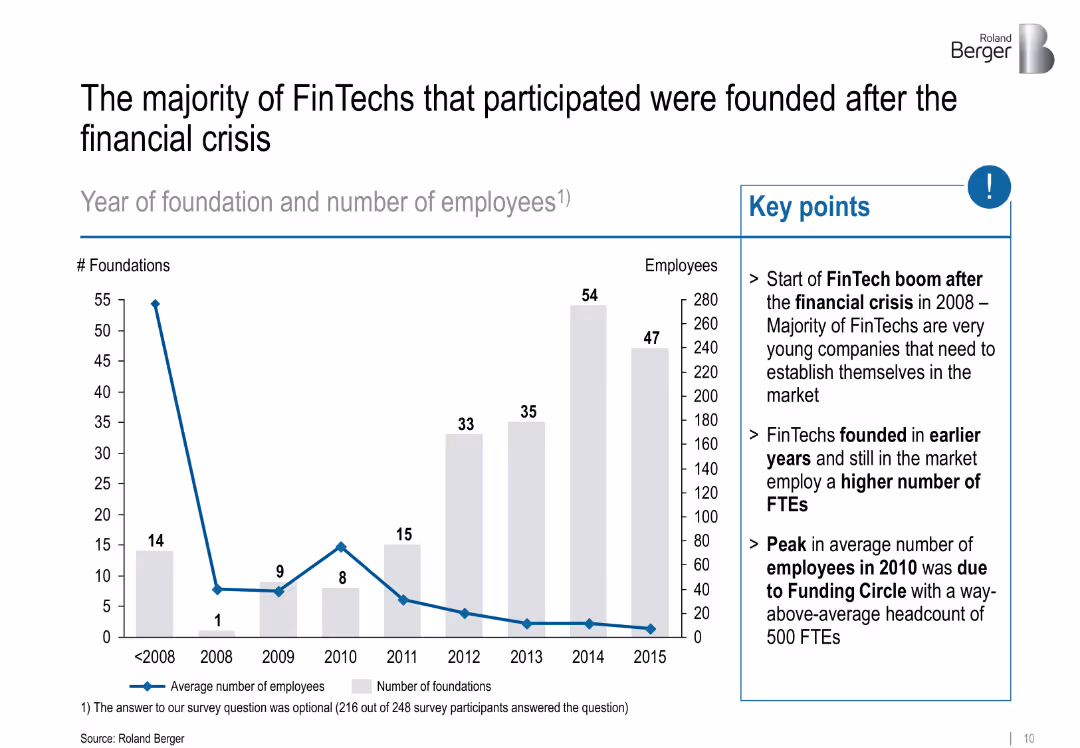
Left: bar chart showing foundations/year; Right: key insights in bullet form; uses grey and blue for emphasis
Industry Overview
Financial Services
Tracks the foundation years of FinTech companies, revealing a boom post-2008 financial crisis. Notes that older firms have more employees and highlights a peak due to a major player.
FinTech origins, post-crisis, startup growth, employment, Funding Circle
false
Industry Overview
Financial Services
Mixed Chart
Roland Berger
Add to my slides
Remove from favorites
The slide covers competition and advantages of Australia in FinTech through infographics and charts showing international competitiveness and revenue growth percentages.
Strategic Planning
Financial Services
The slide discusses the optimistic outlook for Australian FinTech, highlighting competitive advantages and significant revenue growth, alongside a comparison of local and international competition.
FinTech, outlook, optimism, competition, revenue growth, Australia
false
Strategic Planning
Financial Services
Mixed Chart
EY
Add to my slides
Remove from favorites
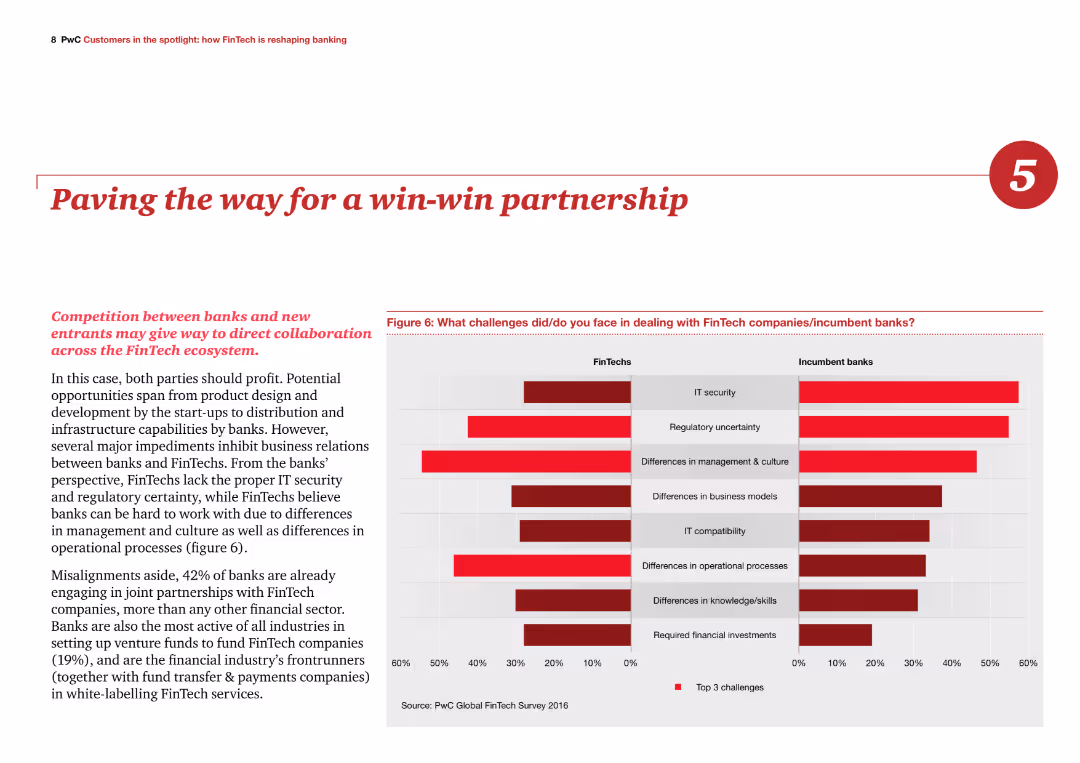
The slide features a column chart comparing challenges faced in dealing with FinTech companies versus incumbent banks. The text discusses the potential for collaborative partnerships between banks and FinTech.
Strategic Planning
Financial Services
The slide emphasizes the potential benefits of partnerships between banks and FinTech companies, addressing challenges such as IT security and regulatory uncertainty to achieve a mutually beneficial outcome.
FinTech, partnerships, collaboration, IT security, regulatory
false
Strategic Planning
Financial Services
Multiple Chart
PwC/Strategy&
Add to my slides
Remove from favorites
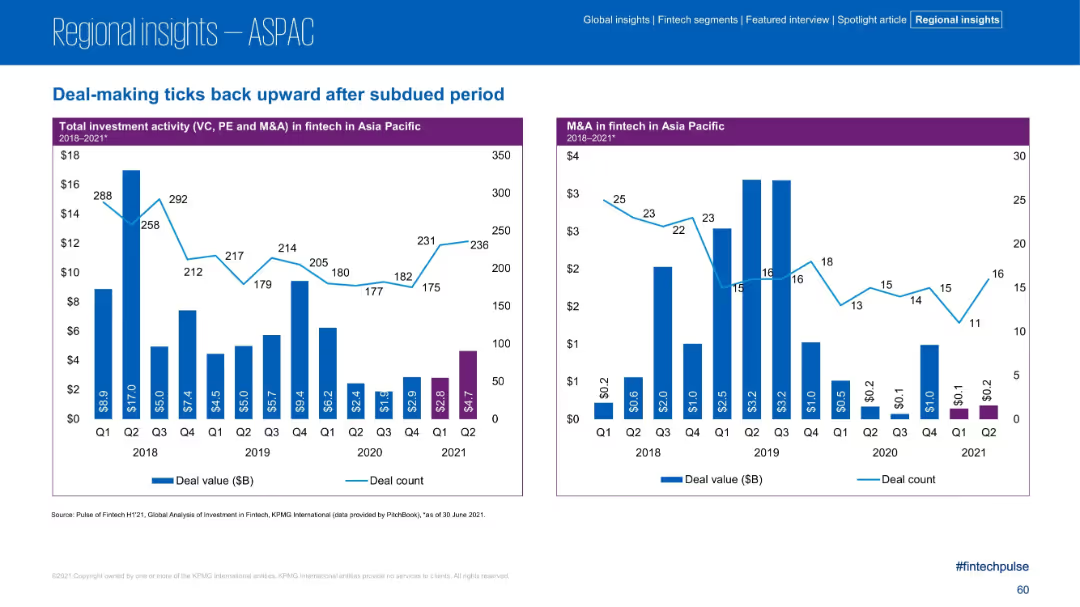
Two bar charts tracking quarterly investment and M&A in fintech across ASPAC from 2018–2021.
Market Analysis and Trends
Financial Services
This slide tracks quarterly fintech deal values and counts in ASPAC, indicating a slight recovery in Q2 2021 following a sustained dip. M&A values remained low but deal counts began to rise again.
Fintech, Quarterly Deals, M&A, VC, Recovery, ASPAC
false
Market Analysis and Trends
Financial Services
Multiple Chart
KPMG
Add to my slides
Remove from favorites
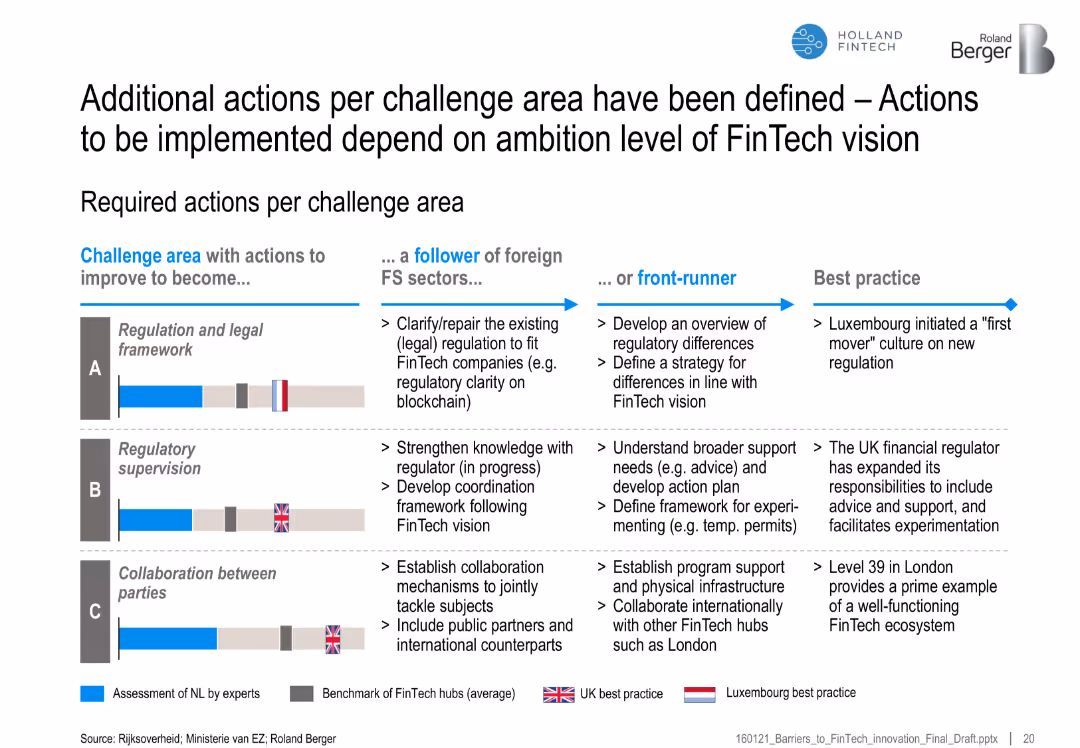
Table matching challenge areas (A–C) with actions to improve (follower vs. front-runner), including best practices
Regulatory and Compliance
Financial Services
Suggests specific regulatory and collaboration improvements for the Netherlands to follow FinTech leaders like UK and Luxembourg, depending on ambition level.
FinTech regulation, legal framework, best practices, UK, Luxembourg, collaboration, strategic actions
false
Regulatory and Compliance
Financial Services
Mixed Chart
Roland Berger
Add to my slides
Remove from favorites
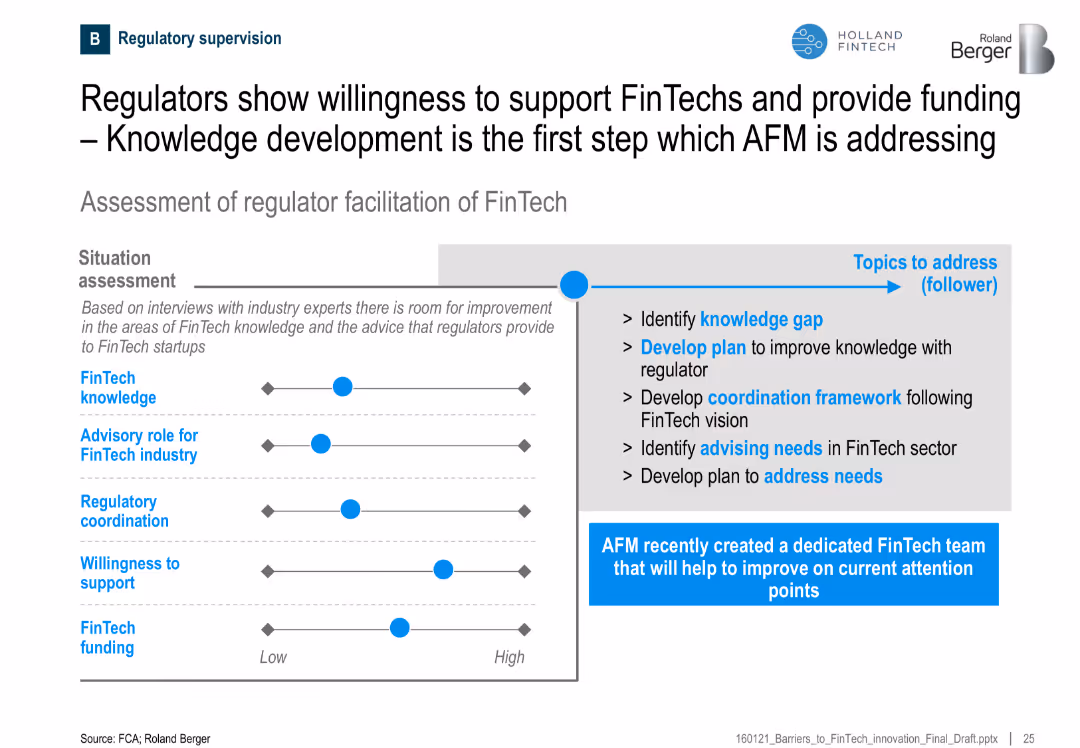
Horizontal layout with a slider-style assessment of regulatory aspects on the left and action points on the right
Regulatory and Compliance
Financial Services
This slide assesses the current state of regulator support for FinTechs and suggests areas of improvement, including knowledge development, coordination, and advisory roles. A dedicated FinTech team by AFM is highlighted.
FinTech, regulators, knowledge, support, coordination, advisory, funding, AFM
false
Regulatory and Compliance
Financial Services
Mixed Chart
Roland Berger
Add to my slides
Remove from favorites
The slide contains multiple infographics and charts showing data on business locations, employee numbers, company age, types of FinTech, and end customers.
Industry Overview
Financial Services
The slide provides an overview of the FinTech sector in 2017, covering aspects such as business demographics, key competitors, types of FinTech, and target customers.
FinTech, sector profile, business demographics, competitors, customers
false
Industry Overview
Financial Services
Multiple Chart
EY
Add to my slides
Remove from favorites
The slide compares FinTech category adoption rates in 2015 and 2017, featuring two sets of icon-based lists for different years, connected by an arrow.
Market Analysis and Trends
Financial Services
The slide highlights the shift in FinTech adoption from 2015 to 2017, showing increased adoption rates in categories like money transfer and insurance.
FinTech, services, players, adoption, trends
false
Market Analysis and Trends
Financial Services
Table
EY
Add to my slides
Remove from favorites
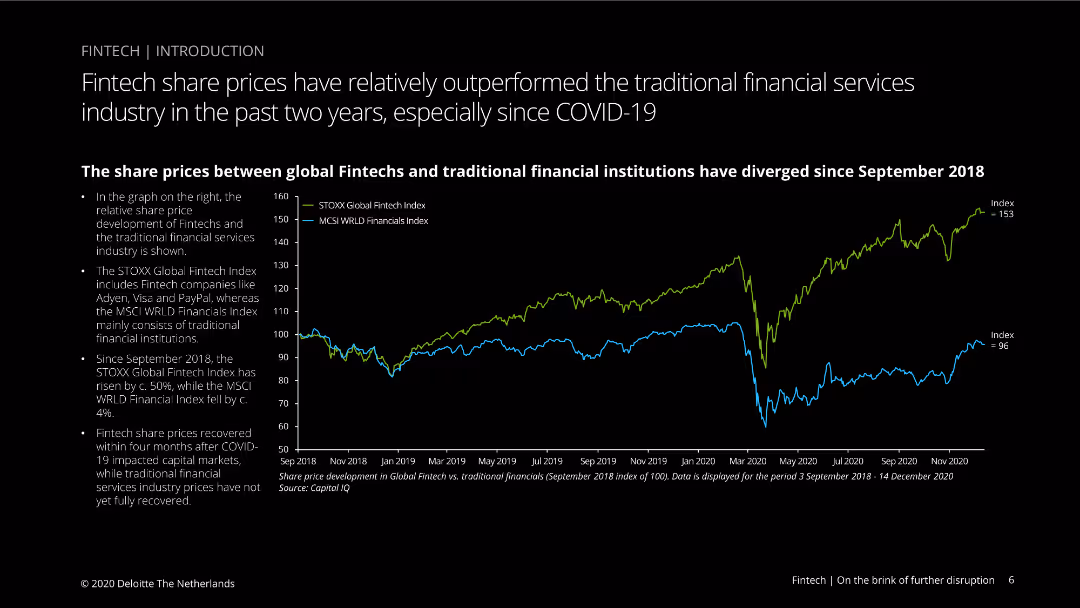
Line chart comparing share price development of global fintechs and traditional financial institutions from September 2018 to December 2020, with blue and green lines.
Financial Performance
Financial Services
Compares share price performance between fintech companies and traditional financial institutions, noting fintech outperformance and recovery after COVID-19 market impacts.
fintech, share prices, traditional finance, COVID-19, performance, STOXX Global, MSCI World, stock market, comparison, recovery
false
Financial Performance
Financial Services
Mixed Chart
Deloitte
Add to my slides
Remove from favorites
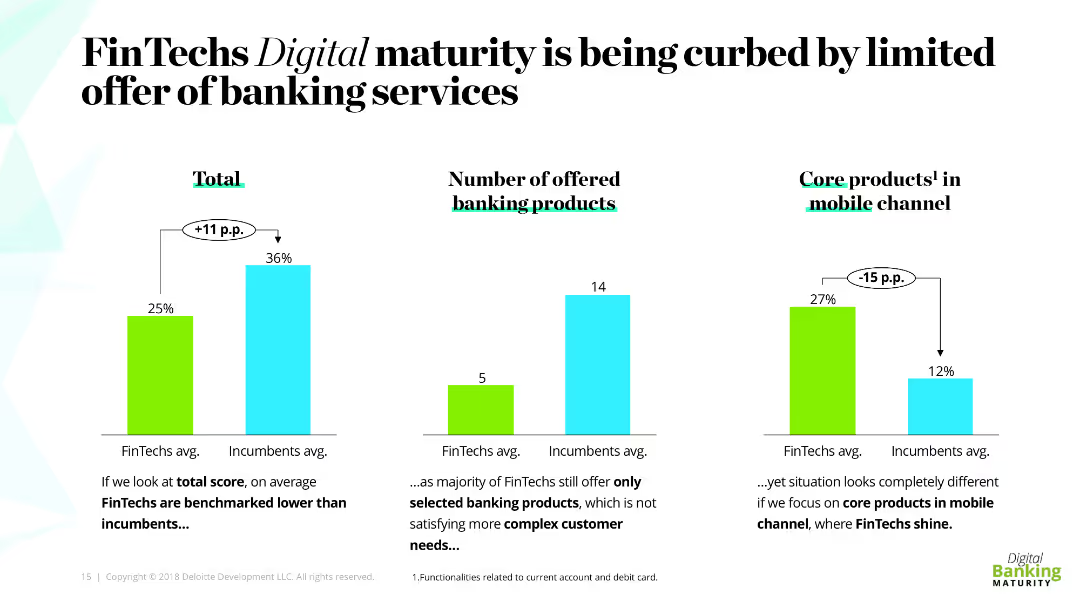
The slide includes three column charts comparing FinTechs and incumbents on total score, number of banking products offered, and core products in the mobile channel. Each chart is accompanied by a brief explanation of the data presented.
Market Analysis and Trends
Financial Services
The slide analyzes the limitations in FinTechs' digital maturity due to a limited range of banking services. It compares FinTechs and incumbents in terms of overall scores, number of banking products offered, and performance in mobile channel services.
FinTechs, incumbents, banking services, digital maturity, comparison
false
Market Analysis and Trends
Financial Services
Multiple Chart
Deloitte
Add to my slides
Remove from favorites
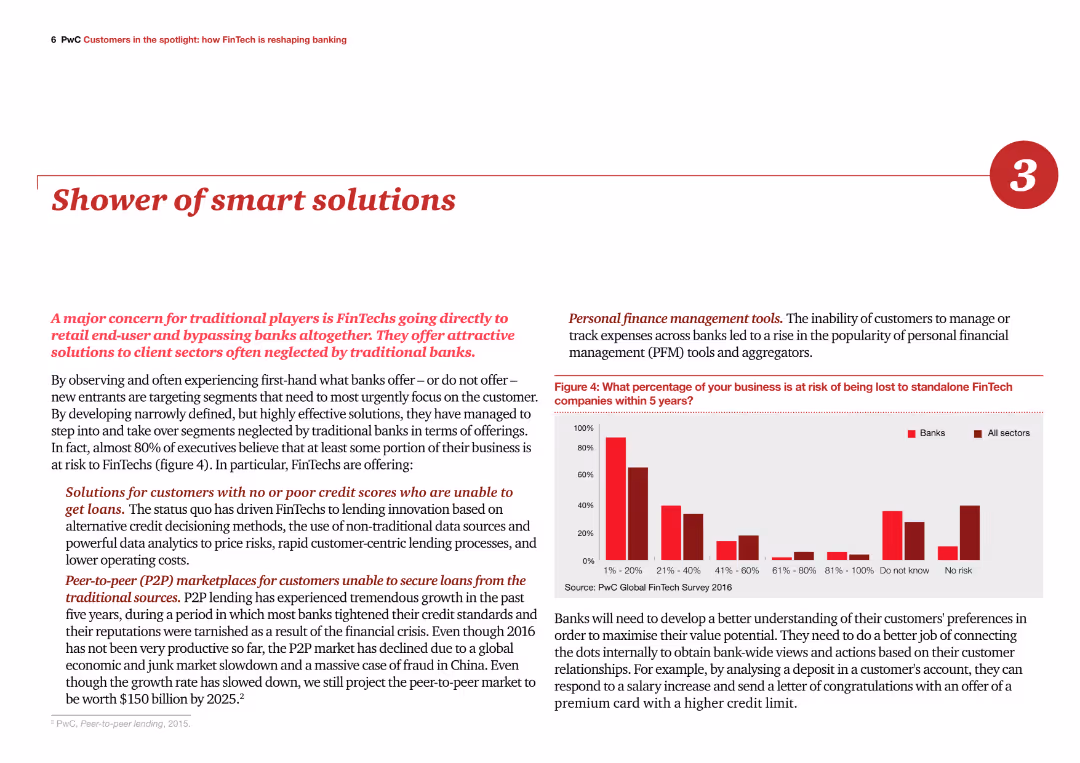
The slide features a column chart on the right showing the risk of losing business to FinTech companies. Text on the left highlights various smart solutions offered by FinTech, including personal finance tools and P2P lending.
Product and Service Analysis
Financial Services
The slide outlines the innovative solutions provided by FinTech to meet customer needs, emphasizing the risk traditional banks face if they do not adopt similar technologies and approaches.
FinTech, smart solutions, personal finance, P2P lending, risk
false
Product and Service Analysis
Financial Services
Mixed Chart
PwC/Strategy&
Add to my slides
Remove from favorites
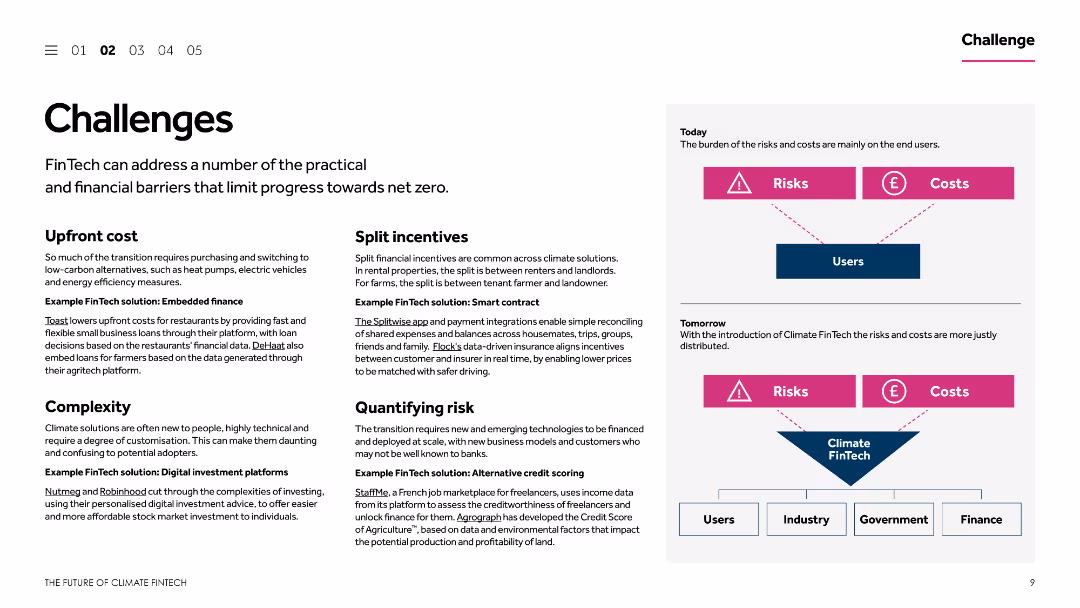
The slide is divided into multiple sections, each addressing different challenges and corresponding FinTech solutions. It includes textual descriptions and simple diagrams to explain concepts like upfront costs, split incentives, and quantifying risk.
Operational Efficiency
Financial Services
This slide outlines various challenges that limit progress towards net zero in the context of FinTech. It provides examples of FinTech solutions to address issues like upfront costs, split incentives, complexity, and risk quantification, aiming to enhance operational efficiency.
FinTech solutions, net zero, upfront costs, split incentives, risk quantification
false
Operational Efficiency
Financial Services
Diagram
Barclays
Add to my slides
Remove from favorites
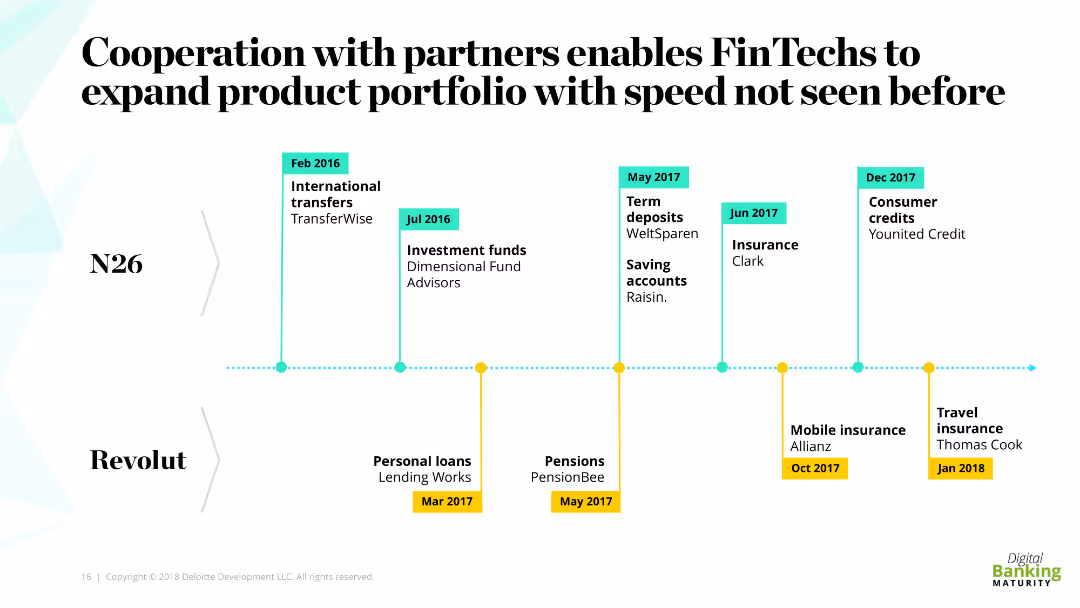
The slide features a timeline detailing the partnership expansions of N26 and Revolut with various services and products. The timeline includes specific months and years along with the names of partner companies and the types of products introduced.
Strategic Planning
Financial Services
This slide illustrates how FinTechs like N26 and Revolut have expanded their product portfolios through partnerships, showcasing the rapid development and launch of various financial products and services over time.
FinTechs, partnerships, product expansion, timeline, speed
false
Strategic Planning
Financial Services
Linear Flow
Deloitte
Add to my slides
Remove from favorites
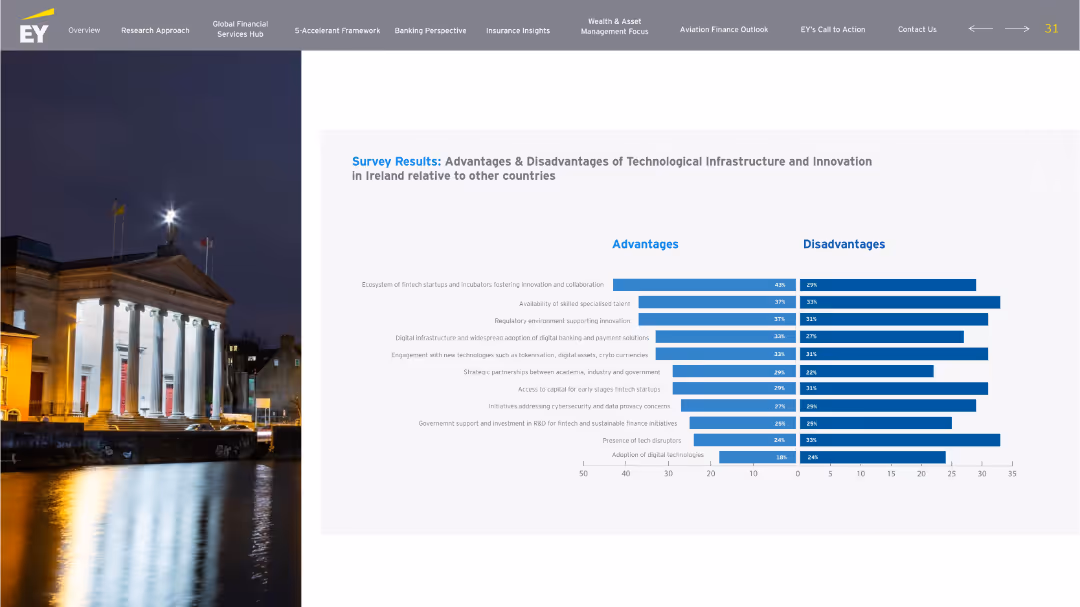
Bar chart-centric layout showing detailed survey results. Left-aligned night city image, with centered horizontal bar charts displaying advantages and disadvantages. All elements tightly structured.
Technology and Digital Transformation
Technology & Software
Focuses on detailed survey results about tech infrastructure and innovation. Highlights the fintech ecosystem, talent availability, and regulatory support as strengths, while digital adoption and security/privacy are concerns. This supports the strategic emphasis on innovation as an FS accelerator.
fintech, startups, digital, innovation, R&D, cybersecurity
false
Technology and Digital Transformation
Technology & Software
Single Chart
EY
Add to my slides
Remove from favorites
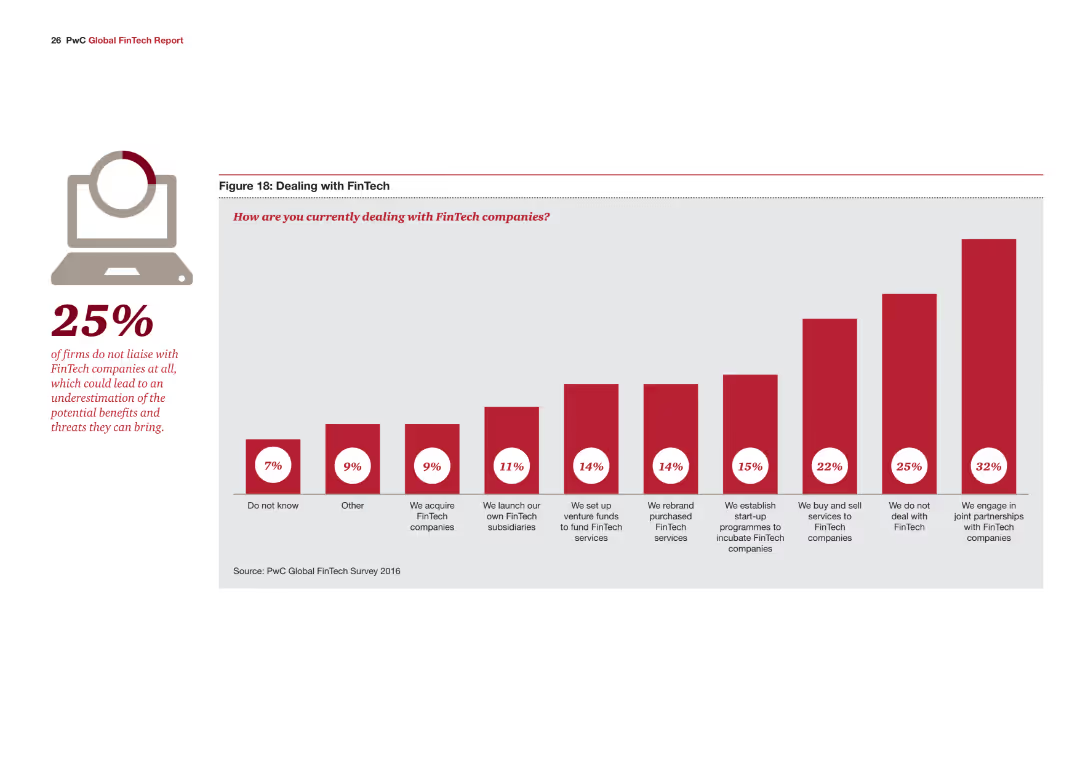
The slide features a single column chart detailing how companies are dealing with FinTech, with various strategies indicated by red bars. A large percentage (25%) is highlighted on the left side.
Risk Assessment and Management
Financial Services
The slide discusses different strategies companies are adopting to engage with FinTech, such as acquiring FinTech companies, setting up venture funds, or not dealing with FinTech at all.
FinTech, strategies, engagement, venture funds, risk management
false
Risk Assessment and Management
Financial Services
Mixed Chart
PwC/Strategy&
Add to my slides
Remove from favorites
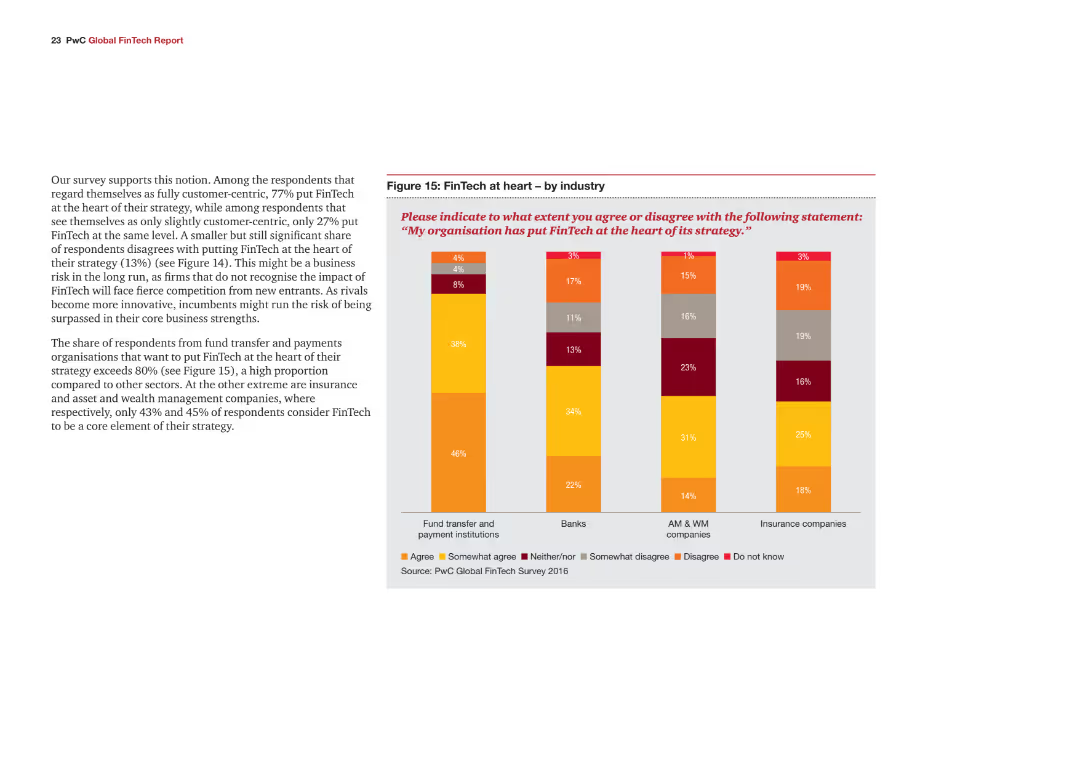
The slide features a bar chart and text. The chart shows the extent to which various industries have put FinTech at the heart of their strategy.
Strategic Planning
Financial Services
The slide highlights the importance of FinTech across different industries and how it is integrated into their strategies.
FinTech, strategy, financial services, industry comparison, technology
false
Strategic Planning
Financial Services
Mixed Chart
PwC/Strategy&
Add to my slides
Remove from favorites
The slide features a pie chart and text. The chart shows the extent to which organizations have put FinTech at the heart of their strategy.
Strategic Planning
Financial Services
The slide emphasizes the importance of integrating FinTech into the core strategy of financial institutions.
FinTech, strategy, financial services, integration, technology
false
Strategic Planning
Financial Services
Mixed Chart
PwC/Strategy&
Add to my slides
Remove from favorites
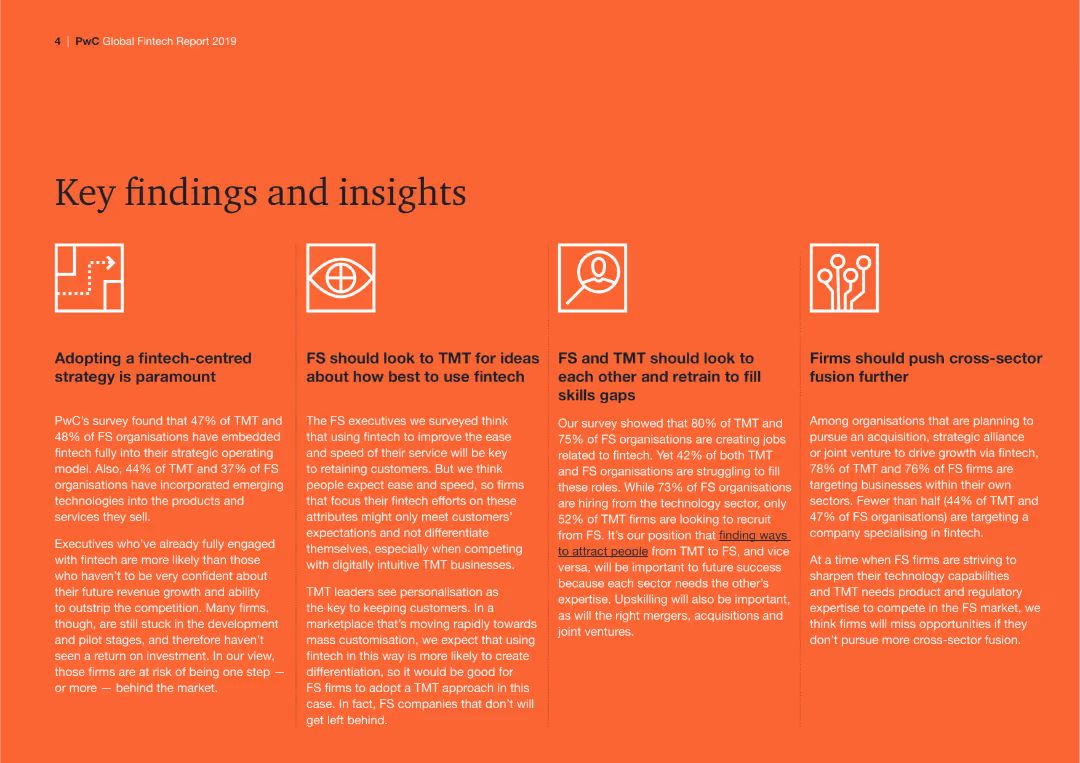
The slide uses a three-column layout with text blocks and small icons at the top of each column. The background is orange with white text.
Strategic Planning
Financial Services
Key insights and strategic recommendations from the PwC Global Fintech Report 2019, focusing on fintech strategies and cross-sector fusion for growth.
fintech, strategy, insights, fintech adoption, TMT
false
Strategic Planning
Financial Services
Pillar
PwC/Strategy&
Add to my slides
Remove from favorites
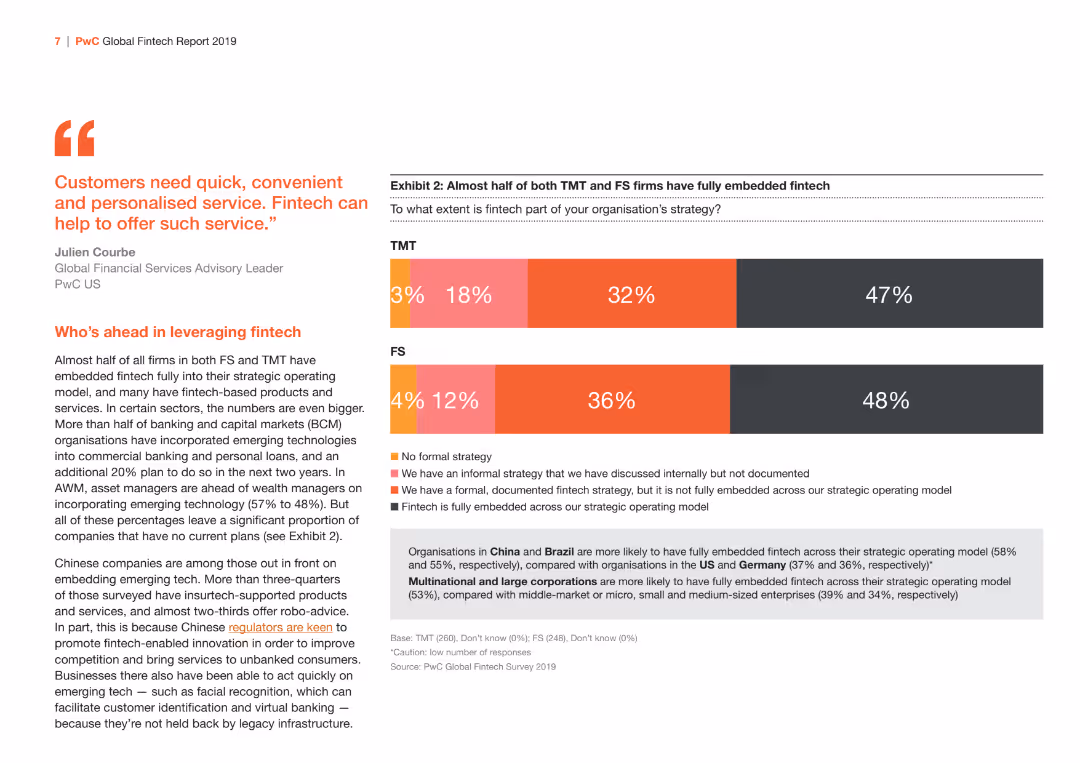
This slide contains a bar chart showing the extent of fintech strategy adoption between TMT and FS sectors. The color scheme is orange and red.
Market Analysis and Trends
Financial Services
Analyzes the level of fintech strategy adoption in TMT and FS sectors, highlighting the differences in embedding fintech within strategic operating models.
fintech, strategy, TMT, FS, adoption
false
Market Analysis and Trends
Financial Services
Mixed Chart
PwC/Strategy&
Add to my slides
Remove from favorites
The slide is divided into sections covering talent, environment, demand, capital, and policy, with various charts and bullet points explaining each driver of success.
Strategic Planning
Financial Services
The slide identifies key drivers for FinTech success, such as talent availability, supportive environment, growing demand, access to capital, and favorable policy measures.
FinTech, success drivers, talent, environment, demand, capital, policy
false
Strategic Planning
Financial Services
Multiple Chart
EY
Add to my slides
Remove from favorites
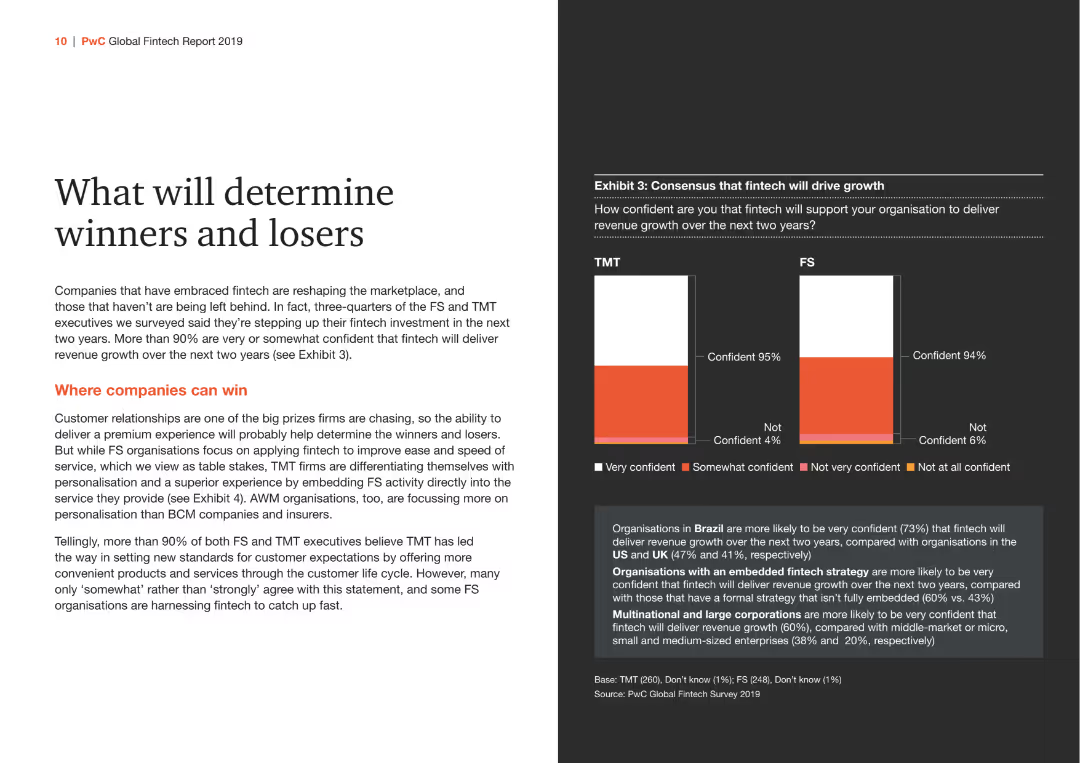
The slide has two columns: one with text and one with a column chart. The background is black and white, with highlights in orange.
Risk Assessment and Management
Financial Services
Discusses factors that will determine success or failure in the fintech sector, emphasizing customer relationships, premium service delivery, and confidence levels in fintech-driven growth.
fintech, success, failure, customer relationships, growth
false
Risk Assessment and Management
Financial Services
Mixed Chart
PwC/Strategy&
Add to my slides
Remove from favorites
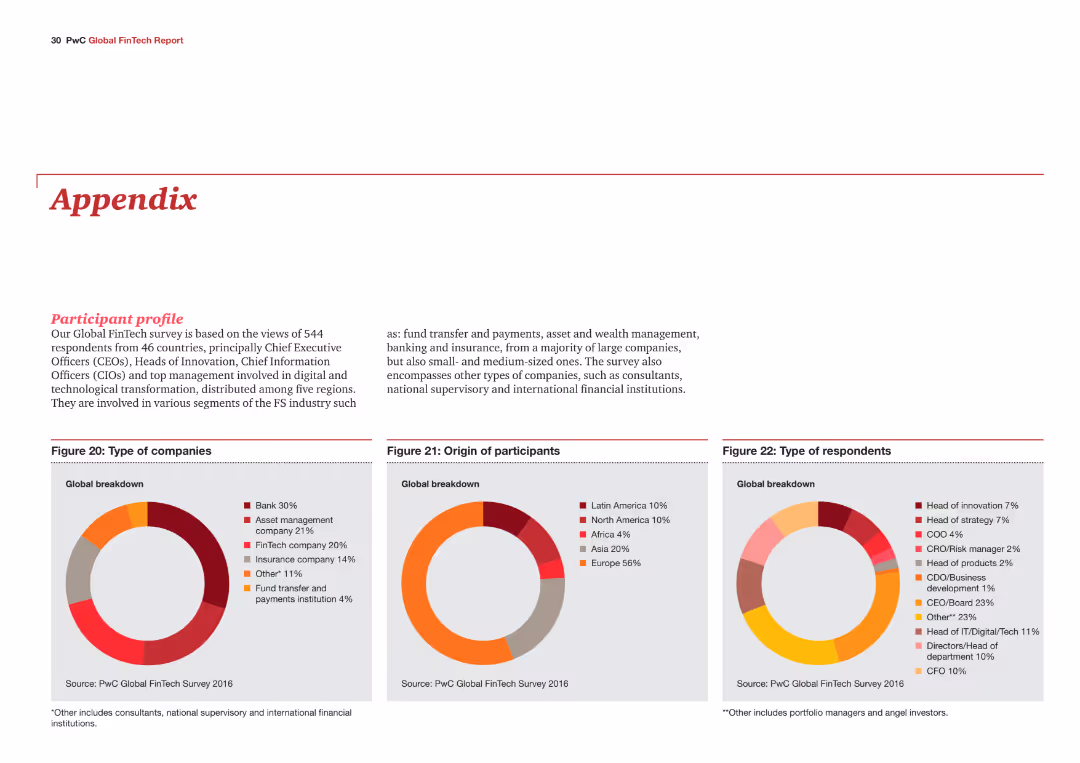
The slide includes three pie charts showing the types of companies, origin of participants, and types of respondents in the Global FinTech Survey. The charts are color-coded and labeled for clarity.
Market Analysis and Trends
Financial Services
The slide provides an overview of the participant profile in the Global FinTech Survey, detailing the types of companies involved, their geographical origin, and the roles of respondents.
FinTech, survey, participants, company types, roles
false
Market Analysis and Trends
Financial Services
Multiple Chart
PwC/Strategy&
Add to my slides
Remove from favorites
Moderate visual complexity with a mix of text, numerical data, and an engaging photo.
Market Analysis and Trends
Financial Services
Highlights Southeast Asia's lead in adopting future tech and fintech, and how investments are trending upwards, which serves as a guide for investment decisions.
fintech, technology, investment, Southeast Asia, growth
false
Market Analysis and Trends
Financial Services
Multiple Chart
Bain
Add to my slides
Remove from favorites
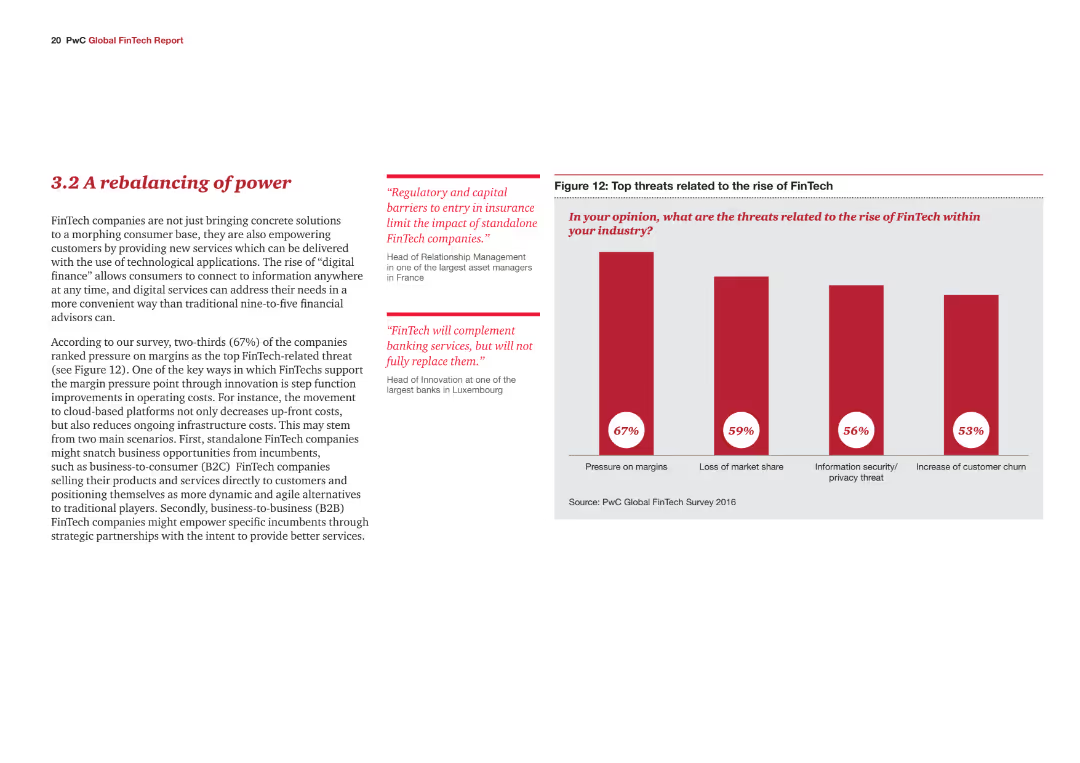
The slide features a column chart and text. The chart highlights top threats related to the rise of FinTech.
Competitive Landscape
Financial Services
The slide analyzes how FinTech is reshaping the financial services industry by presenting threats like margin pressure.
FinTech, threats, financial services, competitive landscape, market share
false
Competitive Landscape
Financial Services
Mixed Chart
PwC/Strategy&
Add to my slides
Remove from favorites
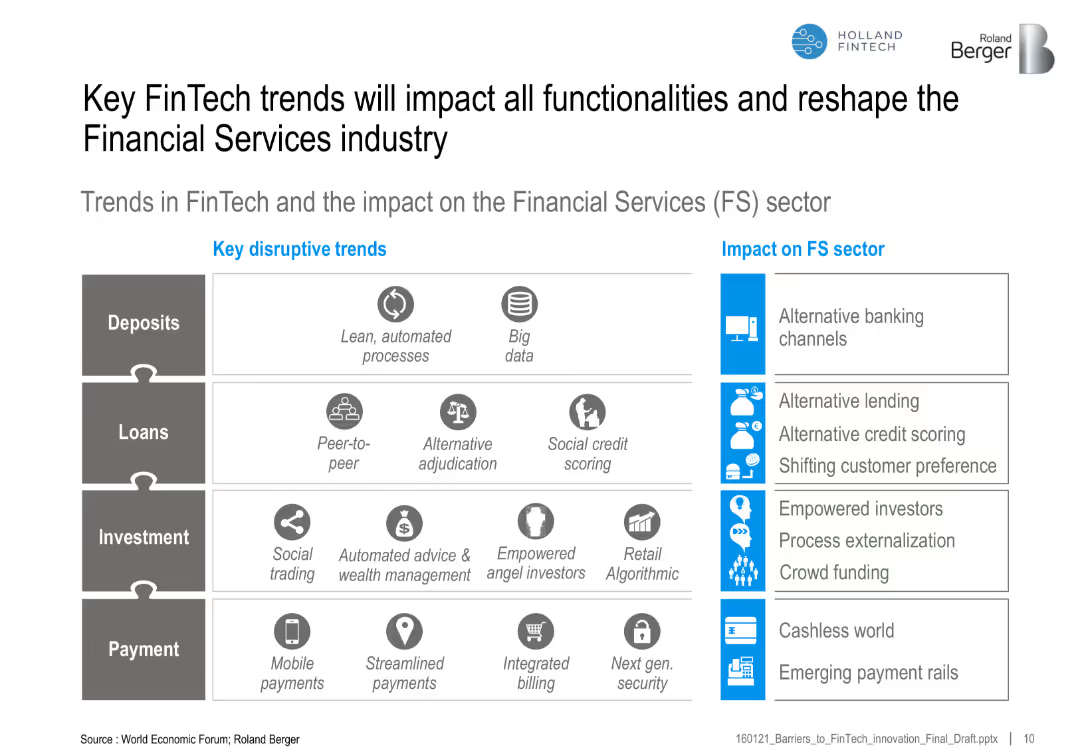
Matrix connecting disruptive trends across FS areas (deposits, loans, investment, payment) with impact categories
Technology and Digital Transformation
Financial Services
This slide maps disruptive FinTech trends to impacts on financial services, such as alternative lending, mobile payments, and automated wealth management, showing how FS is being reshaped.
FinTech trends, disruption, financial services, automation, digital payments, lending, investment, banking
false
Technology and Digital Transformation
Financial Services
Table
Roland Berger
Add to my slides
Remove from favorites
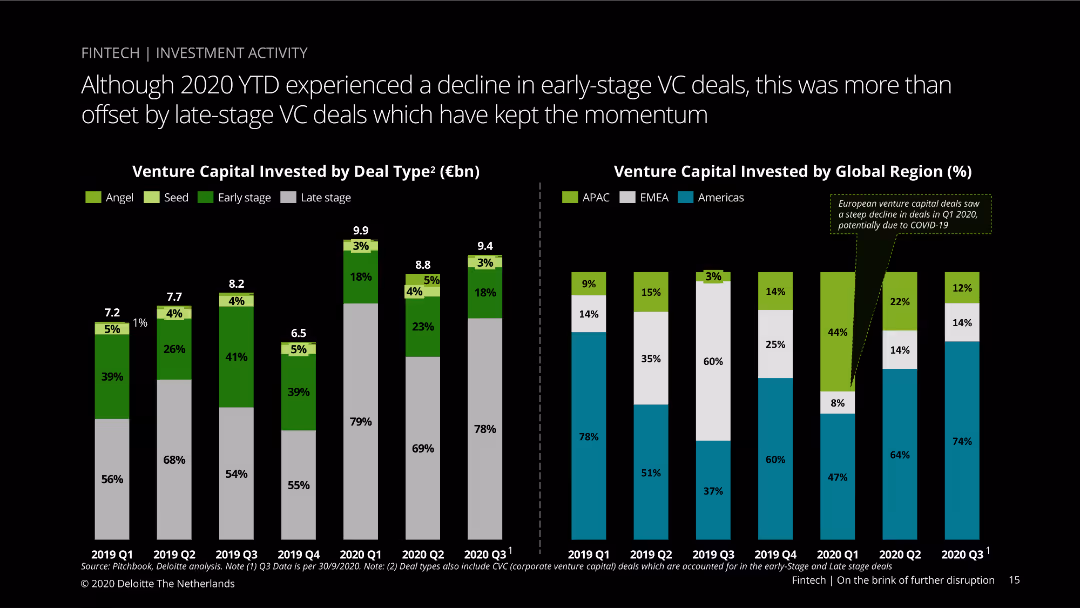
Dual-column charts showing venture capital investment by deal type and by global region from Q4 2019 to Q3 2020, with breakdowns by early-stage and late-stage deals.
Investment Analysis
Financial Services
Evaluates venture capital investment trends in fintech, highlighting a decline in early-stage deals in 2020 offset by an increase in late-stage deals, with a regional investment breakdown.
fintech, venture capital, early-stage, late-stage, investment trends, regional analysis, COVID-19, deal types, VC, financial services
false
Investment Analysis
Financial Services
Multiple Chart
Deloitte
Add to my slides
Remove from favorites
The slide compares fintech and web3 adoption rates across regions using graphical icons and percentages. The design is moderate with a mix of text and visual data representation.
Competitive Landscape
Financial Services
This slide presents a comparative study of fintech and web3 adoption in Southeast Asia against other regions. It's suitable for discussions on competitive advantage and regional market dynamics in technology sectors.
fintech, web3, adoption, Southeast Asia, comparison, competitive, market dynamics, technology sectors
false
Competitive Landscape
Financial Services
Boxed
Bain
Add to my slides
Remove from favorites
This slide includes a timeline with data points, icons, and a future projection path. It is moderately complex with graphical elements to represent time-specific projections.
Market Analysis and Trends
Financial Services
The slide analyzes Southeast Asia's position in fintech and web3 adoption, suggesting a trajectory of growth and dominance over other markets. It could be instrumental in strategic planning or investment analysis concerning these technologies.
fintech, web3, Southeast Asia, market analysis, trends, growth, adoption, strategic planning, investment
false
Market Analysis and Trends
Financial Services
Linear Flow
Bain
Add to my slides
Remove from favorites
The slide is divided into three sections with bar charts and lists that provide statistical data on firm culture, its importance, and reasons for employee departure. The design is clean with a consistent blue color scheme.
Human Resources and Talent Management
Professional Services
Presenting statistical evidence of firm culture’s value to employees, this slide is likely part of a human resources presentation aimed at highlighting the significance of culture in job satisfaction and retention.
firm culture, importance, statistics, employee satisfaction, retention, human resources, job, satisfaction, reasons
false
Human Resources and Talent Management
Professional Services
Table
Kearney
Add to my slides
Remove from favorites
A column chart with five vertical bars indicating percentages of firm growth rates. The bars are in orange, and the text description on the right side.
Financial Performance
Professional Services
The slide shows the distribution of firm growth rates over the last three years, highlighting the percentage of firms growing over 20%, less than 20%, not applicable, no growth, and those shrinking.
firm growth, percentages, distribution, column chart, professional services
false
Financial Performance
Professional Services
Mixed Chart
PwC/Strategy&
Add to my slides
Remove from favorites
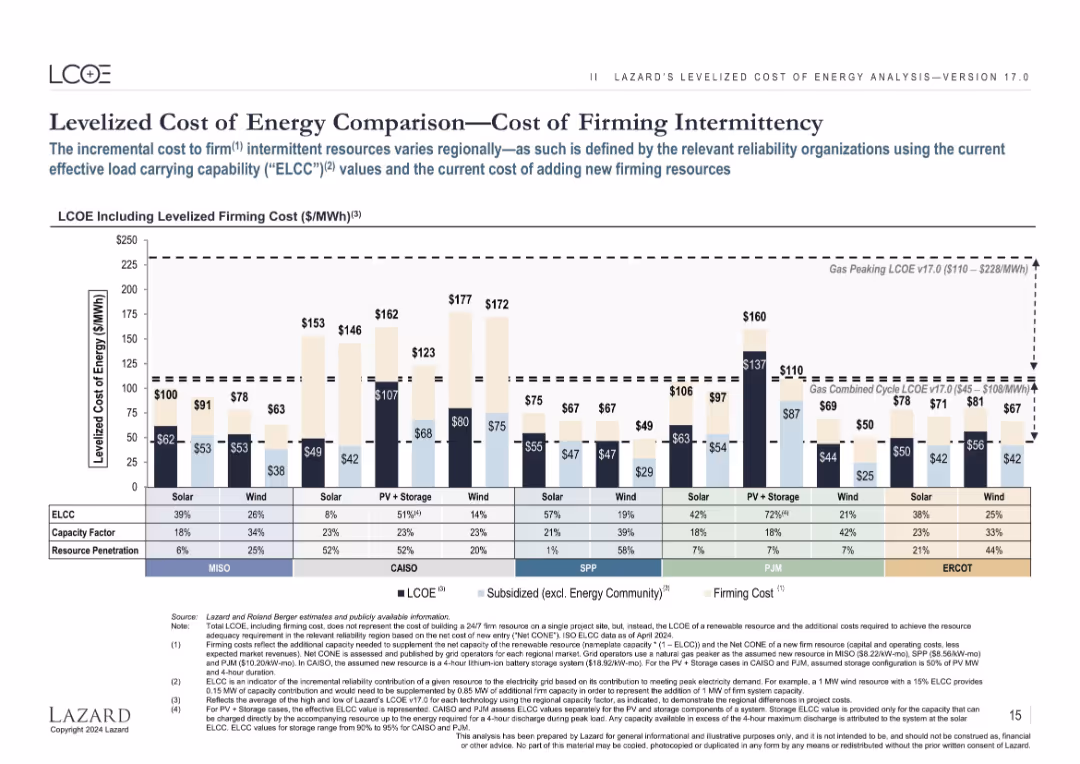
Clustered bar chart showing LCOE including cost to firm intermittency; multiple regional datasets (MISO, CAISO, etc.) are included.
Risk Assessment and Management
Energy & Utilities
Analyzes additional costs for renewable energy to provide reliable capacity (firming), using ELCC and capacity factor data across multiple grid regions, which impact the total economic feasibility of intermittent sources.
firming, intermittency, ELCC, capacity factor, reliability, renewables, solar, wind
false
Risk Assessment and Management
Energy & Utilities
Single Chart
Roland Berger
Add to my slides
Remove from favorites
Previous
Next
You don't have any favorites yet.
Please wait loading your favorites slides...
Create a FREE account to continue browsing
Receive Instant Access to 1,000+ slides from companies like McKinsey, Google, and Goldman Sachs
First Name
Last Name
Email
Password
I agree to all
Terms & Privacy Policy
Thank you! Your submission has been received!
Oops! Something went wrong while submitting the form.
Have an account?
Sign in
Upgrade to PRO to Save slides
Advanced Search and Filters
Access to 15,000+ slides
Access to Category Pages
Save/Bookmark Slides
PowerPoint Template Library
Pick a Plan
MONTHLY
$12/month
Billed every month, Cancel anytime.
YEARLY
$9/year
Billed $108 annually, Cancel anytime.
Checkout for $12/month
Checkout for $108/yr
Secured by Stripe | AES-256 bit encryption