My Account
My Slides
Search by Category
Companies
Slide Type
Use Case
Industry
Pricing
Templates
View All Templates
Download Template Slides
✦ AI
AI Prompt Library
AI Search
Feedback
Login
Logout
Get Started
Browse all Slides
Browse all Slides
Create a FREE Account
Instant access to 1,000+ real slides from top companies like McKinsey, BCG, Goldman Sachs, Google and many more!
First Name
Last Name
Email
Password
I agree to all
Terms & Privacy Policy
Thank you! Your submission has been received!
Oops! Something went wrong while submitting the form.
Have an account?
Sign in
Saved Slides
Total No. of slides saved
0
↻ Refresh
✖ Clear all
A simple blue title slide with the date and categories of banking services offered by JPMorgan Chase, aimed at introducing the firm's structure and offerings.
Industry Overview
Financial Services
Serving as an introduction, this slide provides a firm overview for JPMorgan Chase, setting the stage for a presentation on corporate and investment banking services.
firm overview, JPMorgan Chase, banking, investment, asset management, commercial, introduction, corporate services
false
Industry Overview
Financial Services
Title
JP Morgan
Add to my slides
Remove from favorites
Involves a collection of column charts, tables, and textual analysis with a consistent color scheme. The layout is systematic and packed with data.
Risk Assessment and Management
Financial Services
Discusses the supervision of firmwide assets, their classes, and distribution, which is pertinent for risk management and strategic planning.
Firmwide, Assets, Supervision, Risk, Management, Strategic, Planning, Asset Class, Distribution, Classes
false
Risk Assessment and Management
Financial Services
Multiple Chart
Goldman Sachs
Add to my slides
Remove from favorites
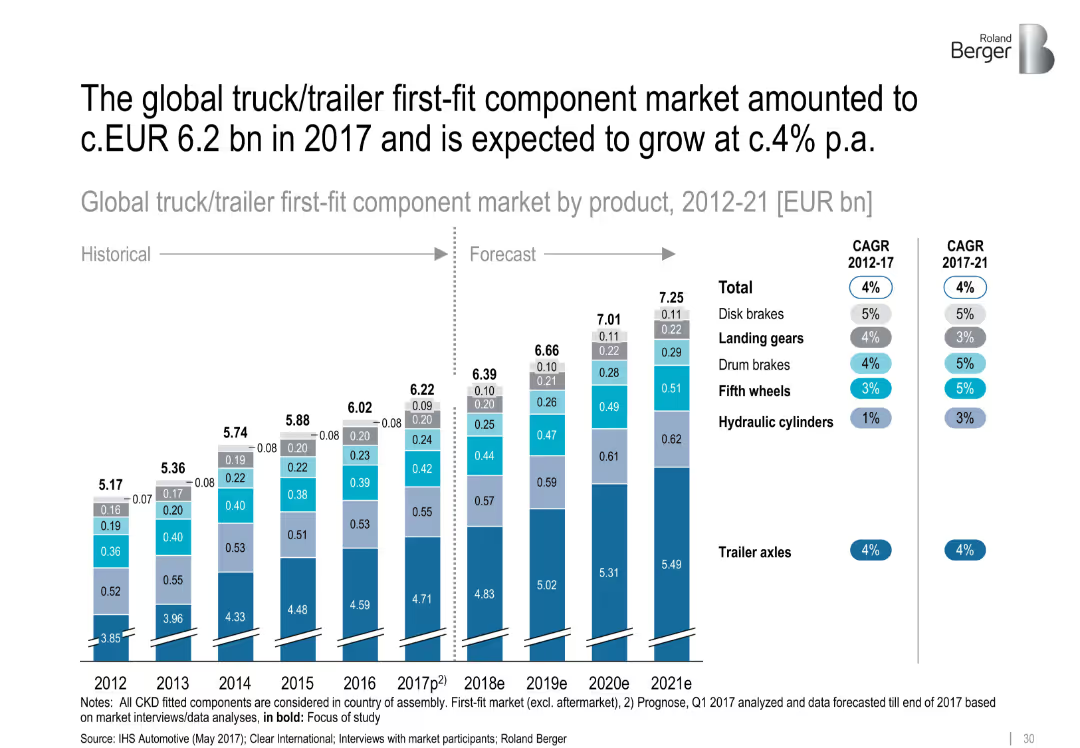
Stacked bar chart showing component market by product (2012–2021), forecasted growth
Investment Analysis
Industrial & Manufacturing
This chart tracks the growth of the truck/trailer first-fit component market across key parts like trailer axles, brakes, and wheels. Forecasts show steady expansion, driven primarily by trailer axles and drums.
first-fit market, trailer axles, component growth, EUR billion, brakes, wheels
false
Investment Analysis
Industrial & Manufacturing
Single Chart
Roland Berger
Add to my slides
Remove from favorites
Features a series of column charts in varying shades of green, showing the utilization of first party data across maturity stages. The layout is effective in conveying comparative data.
Market Analysis and Trends
Media & Entertainment
Highlights the importance of leveraging first party data in marketing campaigns across different maturity stages. This slide is useful for analyzing data utilization trends and planning data-driven marketing strategies.
first party data, marketing campaigns, data utilization, maturity stages, data-driven marketing, column chart, comparative analysis, trend analysis
false
Market Analysis and Trends
Media & Entertainment
Single Chart
BCG
Add to my slides
Remove from favorites
A balance of text and graphics, showing the bank's strengths and how it aligns with J.P.Morgan's strategies, accompanied by a pie chart.
Mergers and Acquisitions
Financial Services
Slide compares the business models of First Republic Bank and J.P.Morgan, focusing on client service, credit performance, and strategic alignment. Suitable for M&A context or business model comparison.
First Republic Bank, client service, credit performance, strategic alignment, loan portfolio, high-growth markets, talent acquisition
false
Mergers and Acquisitions
Financial Services
Mixed Chart
JP Morgan
Add to my slides
Remove from favorites
Line chart displaying the incidence of first-time home buyers from Fall 2015 to Fall 2020, showing fluctuations over the years.
Market Analysis and Trends
Real Estate & Construction
This slide tracks the percentage of first-time home buyers over several years, indicating changes in market entry rates among new buyers.
first-time buyers, incidence, trends, Fall 2015-2020, market entry, home buying
false
Market Analysis and Trends
Real Estate & Construction
Single Chart
IPSOS
Add to my slides
Remove from favorites
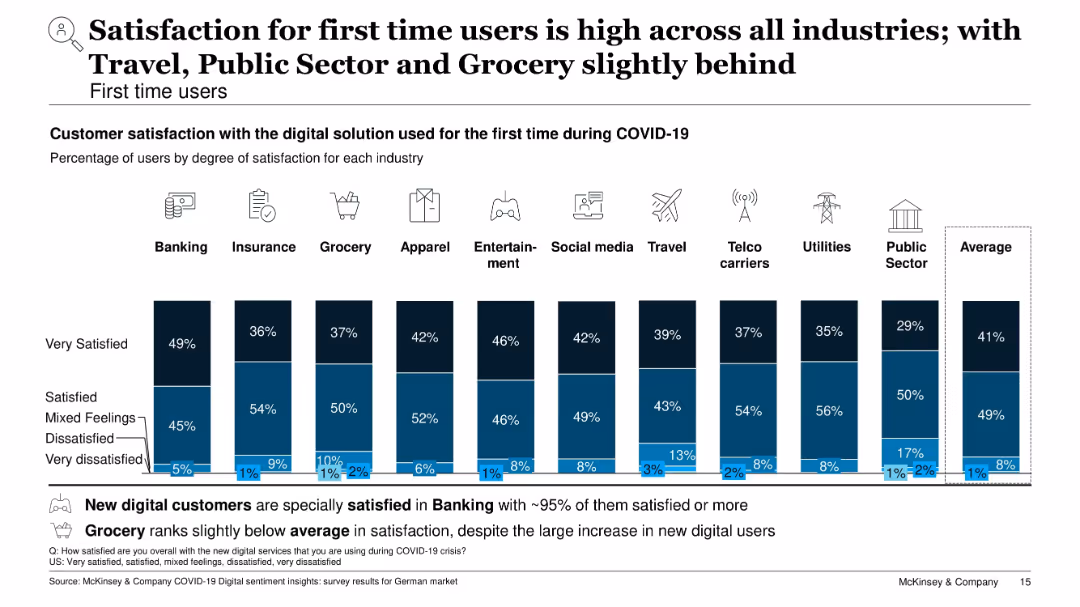
Vertical stacked bar chart showing degrees of satisfaction for first-time users by industry; blue color scheme
Customer and Market Segmentation
Technology & Software
This slide focuses on customer satisfaction among first-time digital users. Banking shows the highest satisfaction (~95%), while Travel, Grocery, and Public Sector lag slightly. Most users report being satisfied or very satisfied, with only a small percentage expressing dissatisfaction.
first-time users, satisfaction, customer experience, digital onboarding, banking, travel, public sector, survey
false
Customer and Market Segmentation
Technology & Software
Single Chart
McKinsey
Add to my slides
Remove from favorites
Donut chart on the left and bullet points on the right; clear blue/grey segmentation with percentages labeled.
Market Analysis and Trends
Hospitality & Tourism
The slide highlights that 31% of international attendees visited Texas for the first time, while 49% had visited 2–5 times. It analyzes attendee familiarity with the host city, based on data from a follow-up survey.
first-time visitors, Texas, international attendees, tourism analysis, event impact, familiarity, repeat visits, attendee survey
false
Market Analysis and Trends
Hospitality & Tourism
Mixed Chart
Nielsen
Add to my slides
Remove from favorites
Column chart detailing the proportion of fiscal variance attributed to different factors like disasters and engineering, with a deep dive expected on these issues. The layout is clean with a distinct color coding.
Regulatory and Compliance
Government & Public Sector
Examines the causes of fiscal variance in NCDOT's budget, focusing on disasters and management issues. Useful for detailed fiscal analysis and strategy discussions in government finance.
fiscal analysis, disasters, engineering, management, government
false
Regulatory and Compliance
Government & Public Sector
Mixed Chart
McKinsey
Add to my slides
Remove from favorites
Features a comparative column chart of revenue and expenditure for Namibia from 2022/23 to 2024/25. Each year is represented with dual bars for revenue and expenses, colored distinctly in red and grey, alongside deficit annotations. The design is straightforward with clear labels.
Financial Performance
Government & Public Sector
Analyzes the balance between revenue and expenditures in Namibia's budget, highlighting fiscal challenges and planning for deficit management. Useful for governmental financial strategy and public administration.
Fiscal Balance, Revenue, Expenditure, Namibia, Government Finance
false
Financial Performance
Government & Public Sector
Single Chart
PwC/Strategy&
Add to my slides
Remove from favorites
Includes two vertical column charts and one line chart depicting budget deficit and public debt trends. The slide is color-coordinated with a clear division between the charts.
Strategic Planning
Government & Public Sector
Focuses on the fiscal consolidation efforts showing trends in budget deficit and public debt over several years. Ideal for strategic discussions on fiscal policy and debt management in governmental contexts.
Fiscal, Budget, Debt, Trends, Government
false
Strategic Planning
Government & Public Sector
Multiple Chart
PwC/Strategy&
Add to my slides
Remove from favorites
A column chart showing Namibia's total revenue versus expenditure over three fiscal years, depicting a budget deficit in each year as represented by different shades of red in the lower section of the bars.
Financial Performance
Government & Public Sector
Examines Namibia's fiscal performance over three years, highlighting the ongoing budget deficits. This visual comparison is crucial for discussions on governmental budget management and fiscal policy.
fiscal, budget, Namibia, government finance
false
Financial Performance
Government & Public Sector
Multiple Chart
PwC/Strategy&
Add to my slides
Remove from favorites
The slide uses a stark background image of a tree under a starry sky with a circular diagram overlaid, illustrating fiscal challenges faced by the government. The design is simple yet impactful, with contrasting blue and white colors.
Risk Assessment and Management
Government & Public Sector
Provides an overview of the fiscal challenges faced by the government, such as budget deficit, public debt, and fiscal weakness, arranged in a circular flow diagram. It is useful for understanding the complexities and risks associated with government financial management.
fiscal challenges, government, budget deficit, public debt, risk management
false
Risk Assessment and Management
Government & Public Sector
Diagram
PwC/Strategy&
Add to my slides
Remove from favorites
This slide presents a column chart detailing expenditure trends over a decade and a dotted line illustrating expenditure as a percentage of GDP, along with a sidebar on wage containment measures.
Regulatory and Compliance
Government & Public Sector
Discusses strategic measures to manage and consolidate government expenditure, including wage bill controls.
Fiscal consolidation, expenditure trends, wage control, budget
false
Regulatory and Compliance
Government & Public Sector
Mixed Chart
PwC/Strategy&
Add to my slides
Remove from favorites
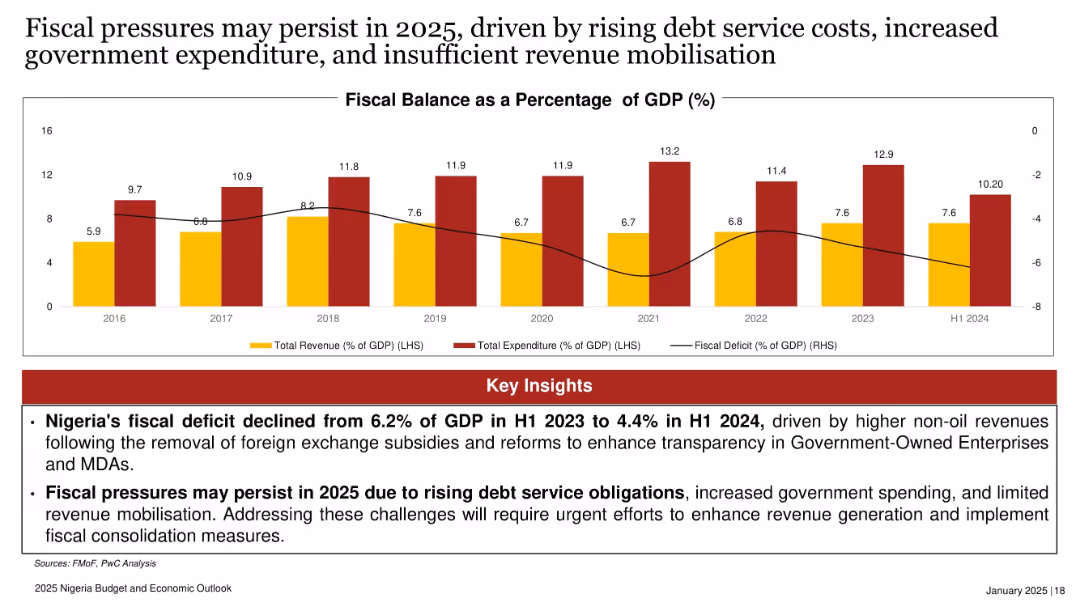
Bar and line combination chart tracking revenue, expenditure, and fiscal deficit as a % of GDP from 2016 to H1 2024.
Corporate Finance and Valuation
Government & Public Sector
Despite a reduction in the fiscal deficit from 6.2% to 4.4% of GDP in H1 2024, fiscal pressures are expected to continue in 2025 due to rising debt service, high spending, and limited revenue generation. Reforms are needed to stabilize public finances.
fiscal deficit, revenue, expenditure, GDP, Nigeria, debt service, fiscal reform
false
Corporate Finance and Valuation
Government & Public Sector
Mixed Chart
PwC/Strategy&
Add to my slides
Remove from favorites
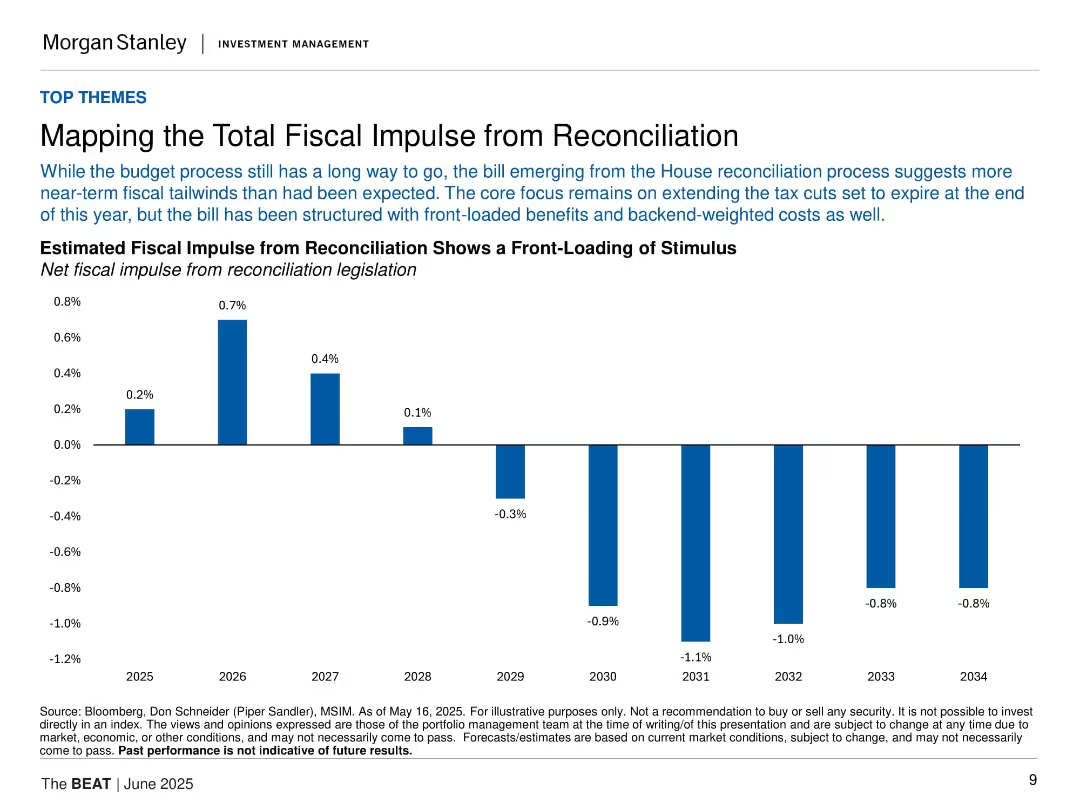
Bar chart showing net fiscal impulse from 2025 to 2034; structured in a clean layout with text above the graph.
Market Analysis and Trends
Financial Services
This slide outlines the projected fiscal impact of House reconciliation legislation, highlighting a front-loading of stimulus in the early years followed by fiscal tightening. A bar chart displays the impulse by year from 2025–2034.
fiscal impulse, reconciliation, budget, stimulus, taxes, 2025–2034, macroeconomics, House bill, Morgan Stanley, projections
false
Market Analysis and Trends
Financial Services
Single Chart
Morgan Stanley
Add to my slides
Remove from favorites
Featuring bar graphs showing NCDOT's operational spend variance by division for multiple fiscal years, highlighting areas of overspending and underspending relative to budget allocations.
Regulatory and Compliance
Government & Public Sector
Reviews NCDOT's fiscal management by division, showing how different divisions have managed their budgets over several years, focusing on trends in spending variance and their implications for financial oversight.
fiscal management, NCDOT, budget variance, operational spending, fiscal oversight
false
Regulatory and Compliance
Government & Public Sector
Multiple Chart
McKinsey
Add to my slides
Remove from favorites
Line graph showing the yearly variance of NCDOT's cash balance from forecasts, marking a shift in FY19 with a detailed analysis of trends over time.
Regulatory and Compliance
Government & Public Sector
Analyzes the shift in cash balance variance for NCDOT in FY19, highlighting issues in fiscal management. Useful for government finance and policy analysis.
fiscal management, variance, government, NCDOT, trends
false
Regulatory and Compliance
Government & Public Sector
Single Chart
McKinsey
Add to my slides
Remove from favorites
Contains a line chart and an area chart illustrating fiscal revenue and expenditure, and the pace of central and local government bond issuance over time.
Regulatory and Compliance
Government & Public Sector
Analyzes China's fiscal policy with data on revenue, expenditure, and bond issuance, providing insights into government financial strategies and public sector funding.
Fiscal policy, China, Government, Revenue, Expenditure, Bonds, Public sector, Financial analysis, Economic data
false
Regulatory and Compliance
Government & Public Sector
Multiple Chart
JP Morgan
Add to my slides
Remove from favorites
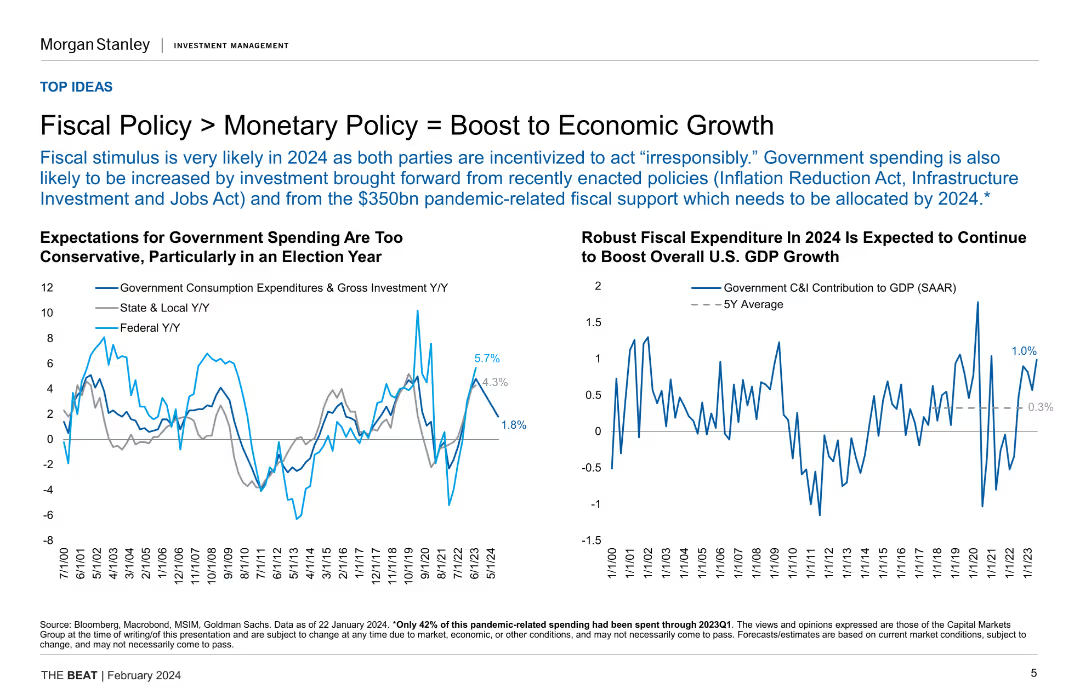
Two line charts displaying government spending expectations and fiscal expenditure projections for 2024, highlighting conservative estimates and robust growth.
Strategic Planning
Financial Services
The slide discusses how fiscal policy is expected to boost economic growth in 2024, comparing it with monetary policy and projecting government spending and its impact on GDP growth.
fiscal policy, monetary policy, economic growth, government spending, GDP
false
Strategic Planning
Financial Services
Multiple Chart
Morgan Stanley
Add to my slides
Remove from favorites
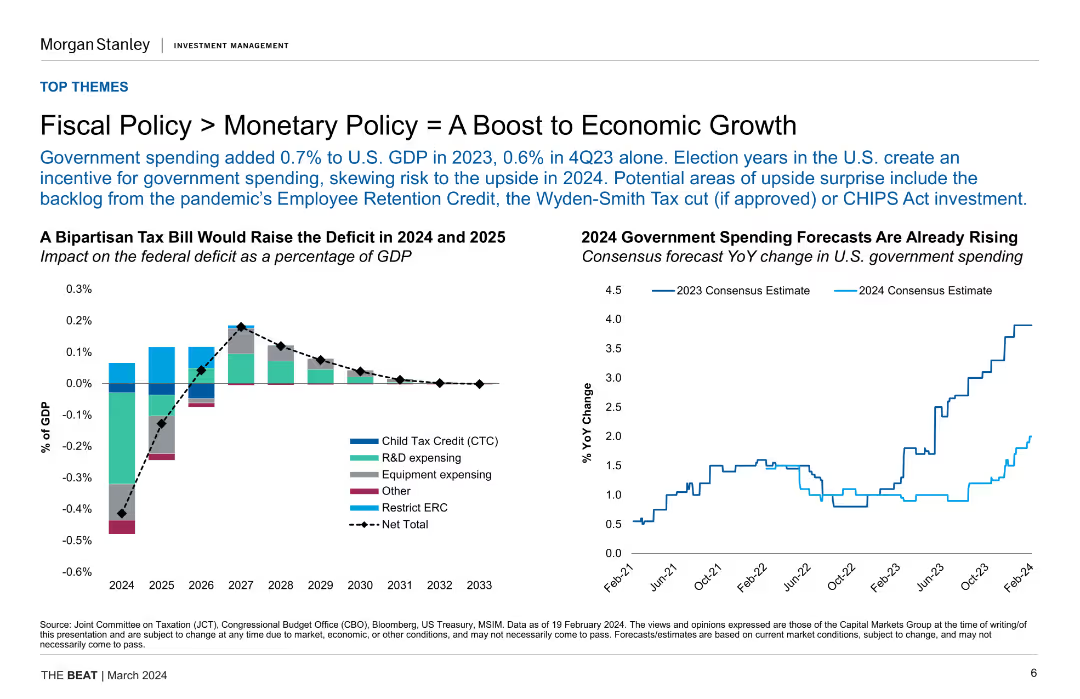
Contains a combination of bar and line charts showing government spending forecasts, tax bill impacts on GDP deficit, and spending changes over time. Features various policy elements and their projected impacts.
Market Analysis and Trends
Financial Services
Analyzes the impact of fiscal policy compared to monetary policy on economic growth, emphasizing government spending and tax legislation. Useful for understanding policy effects on GDP and economic forecasts.
fiscal policy, monetary policy, economic growth, government spending, GDP, tax legislation
false
Market Analysis and Trends
Financial Services
Multiple Chart
Morgan Stanley
Add to my slides
Remove from favorites
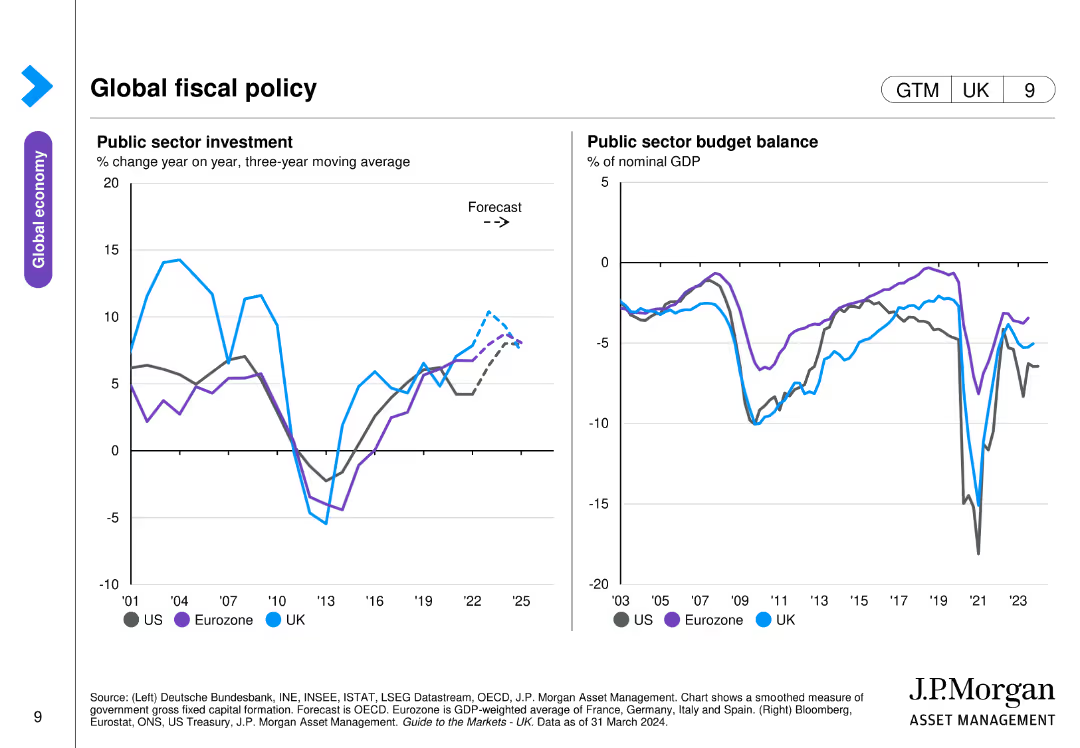
The slide features two line charts, one showing public sector investment as a percentage of GDP and another depicting public sector budget balance for the US, Eurozone, and UK.
Strategic Planning
Government & Public Sector
This slide provides an overview of public sector investment and budget balance trends, essential for analyzing fiscal policy and its economic impacts.
Fiscal policy, public investment, budget balance, GDP, government finance
false
Strategic Planning
Government & Public Sector
Multiple Chart
JP Morgan
Add to my slides
Remove from favorites
Features a column chart showing projections for revenue and expenditure over three fiscal years, using a red and blue color scheme for visual distinction.
Financial Performance
Government & Public Sector
This slide forecasts Namibia's government revenue versus expenditure, providing a visual comparison that highlights fiscal balance or imbalances.
fiscal projections, government budget, Namibia, revenue, expenditure, fiscal balance
false
Financial Performance
Government & Public Sector
Multiple Chart
PwC/Strategy&
Add to my slides
Remove from favorites
A minimalistic design with the title text prominently displayed against a light blue geometric background.
Investment Analysis
Financial Services
This slide presents the fiscal year and quarter, highlighting its purpose as an investor presentation. It is used to set the context for the financial information that will follow.
Fiscal, Quarter, Investor, Presentation, Financial
false
Investment Analysis
Financial Services
Title
Booz Allen Hamilton
Add to my slides
Remove from favorites
Contains a scatter plot mapping financial stimulus against economic impact for various countries, with a focus box highlighting countries with early and sufficient support.
Financial Performance
Financial Services
Evaluates the effectiveness of fiscal responses across different countries during the pandemic, highlighting the correlation between early fiscal support and economic resilience.
fiscal response, pandemic, economic impact, stimulus, countries
false
Financial Performance
Financial Services
Single Chart
BCG
Add to my slides
Remove from favorites
Features a column charts displaying the change in fitness activities before, during, and after COVID-19 lockdowns.
Market Analysis and Trends
Healthcare & Pharmaceuticals
Analyzes trends in fitness behavior changes over the course of the pandemic, illustrating consumer adoption of hybrid routines involving digital and traditional fitness methods.
Fitness, Hybrid, COVID-19, Trends, Bar Charts, Consumer Behavior, Health, Digital
false
Market Analysis and Trends
Healthcare & Pharmaceuticals
Multiple Chart
McKinsey
Add to my slides
Remove from favorites
Slide with a comparison chart showing the purchase decisions in the fitness industry related to initial consideration, active evaluation, and loyalty. It compares fitness with other industries like airlines, hotels, and streaming entertainment.
Competitive Landscape
Healthcare & Pharmaceuticals
Highlights the importance of brand consideration and loyalty in the fitness industry, showing how fitness ranks among other industries in consumer purchase decisions. Useful for strategic planning in marketing and customer loyalty enhancement within the fitness sector.
Fitness industry, consumer loyalty, purchase decisions, competitive analysis, brand strategy
false
Competitive Landscape
Healthcare & Pharmaceuticals
Mixed Chart
McKinsey
Add to my slides
Remove from favorites
Slide contains multiple bar charts comparing the usage rates of different fitness products and services between 2020 and 2022. It includes sections for 'Outside of home', 'At-home', and 'Digital', highlighting increases in participation and projected future spending.
Market Analysis and Trends
Healthcare & Pharmaceuticals
Focuses on the growth of fitness participation across various categories with a particular boost in at-home and digital fitness due to health consciousness. The slide provides detailed insights into consumer behavior changes over time and anticipated future spending. Could be useful in analyzing market shifts in the fitness industry.
Fitness trends, consumer behavior, digital fitness, market growth, spending forecast
false
Market Analysis and Trends
Healthcare & Pharmaceuticals
Mixed Chart
McKinsey
Add to my slides
Remove from favorites
This slide includes a line graph illustrating the percentage of fixed debt over time, alongside a stacked column chart detailing debt maturity and composition for upcoming years. The chart uses shades of blue, yellow, and green, with a red line graph.
Corporate Finance and Valuation
Financial Services
The slide details the composition and maturity of fixed debt, with an emphasis on no debt maturity until 4Q 2024. It could be utilized in presentations to financial analysts or investors looking at debt management strategies, interest rate impacts on corporate finance, and long-term financial planning.
fixed debt, maturity, hedged rate, financial planning, corporate finance
false
Corporate Finance and Valuation
Financial Services
Single Chart
Morgan Stanley
Add to my slides
Remove from favorites
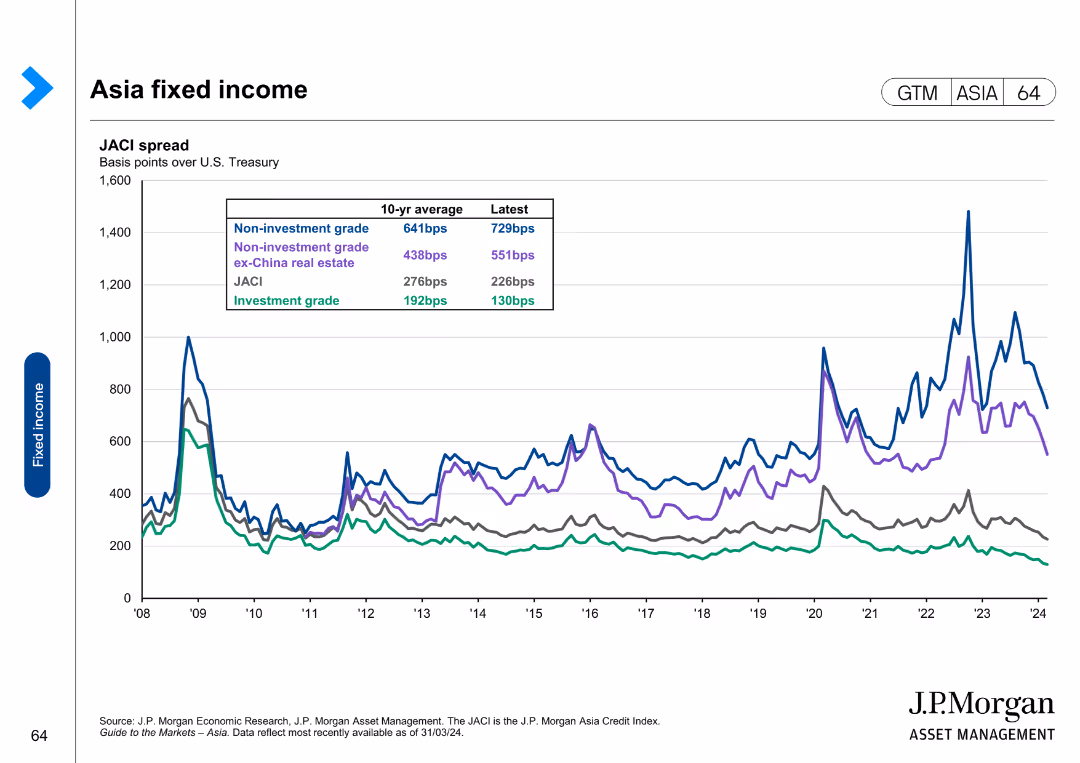
The slide includes a line chart with multiple series representing different categories of fixed income spreads in Asia.
Market Analysis and Trends
Financial Services
The slide examines fixed income spreads in Asia, differentiating between investment grade, non-investment grade, and specific sectors like ex-China real estate.
fixed income, Asia, investment grade, non-investment grade, financial analysis
false
Market Analysis and Trends
Financial Services
Single Chart
JP Morgan
Add to my slides
Remove from favorites
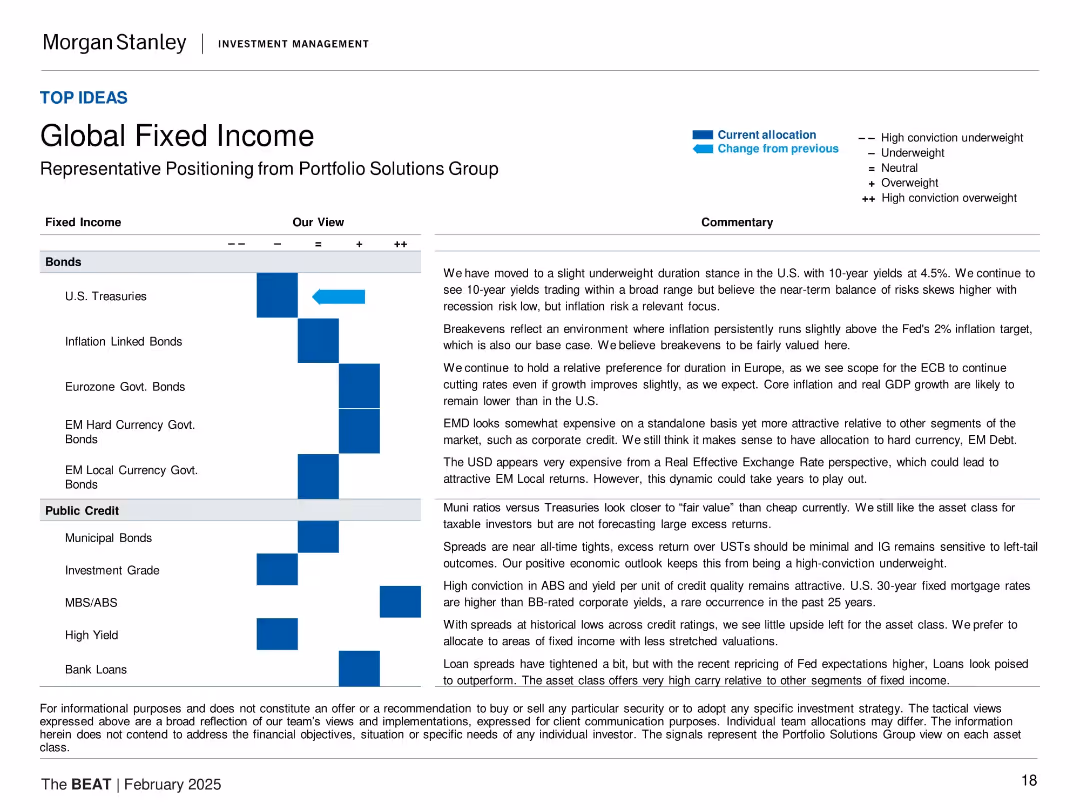
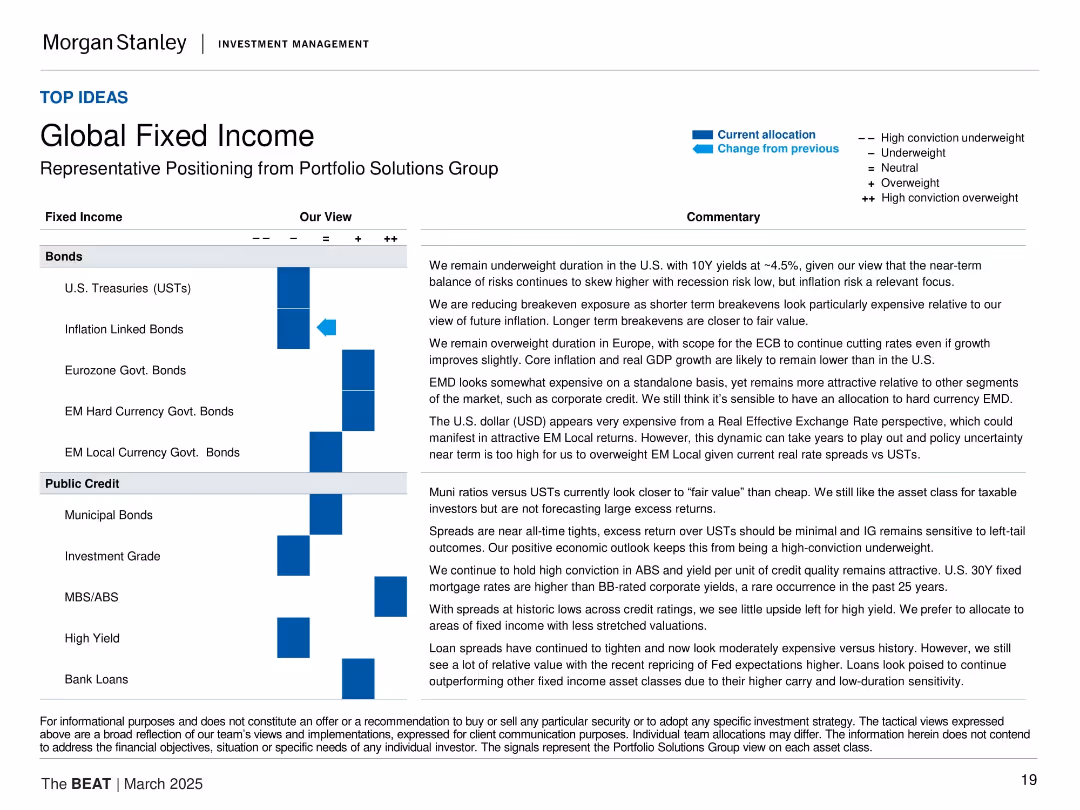
Matrix layout with categories under "Fixed Income", sentiment arrows, and detailed commentary
Investment Analysis
Financial Services
Provides a breakdown of Morgan Stanley's positioning on global fixed income instruments, including U.S. Treasuries, inflation-linked bonds, and credit instruments. The commentary supports slight underweighting in U.S. duration while favoring Eurozone bonds and select public credit categories.
fixed income, bonds, credit, interest rates, U.S. Treasuries, EM debt, yield, monetary policy
false
Investment Analysis
Financial Services
Table
Morgan Stanley
Add to my slides
Remove from favorites
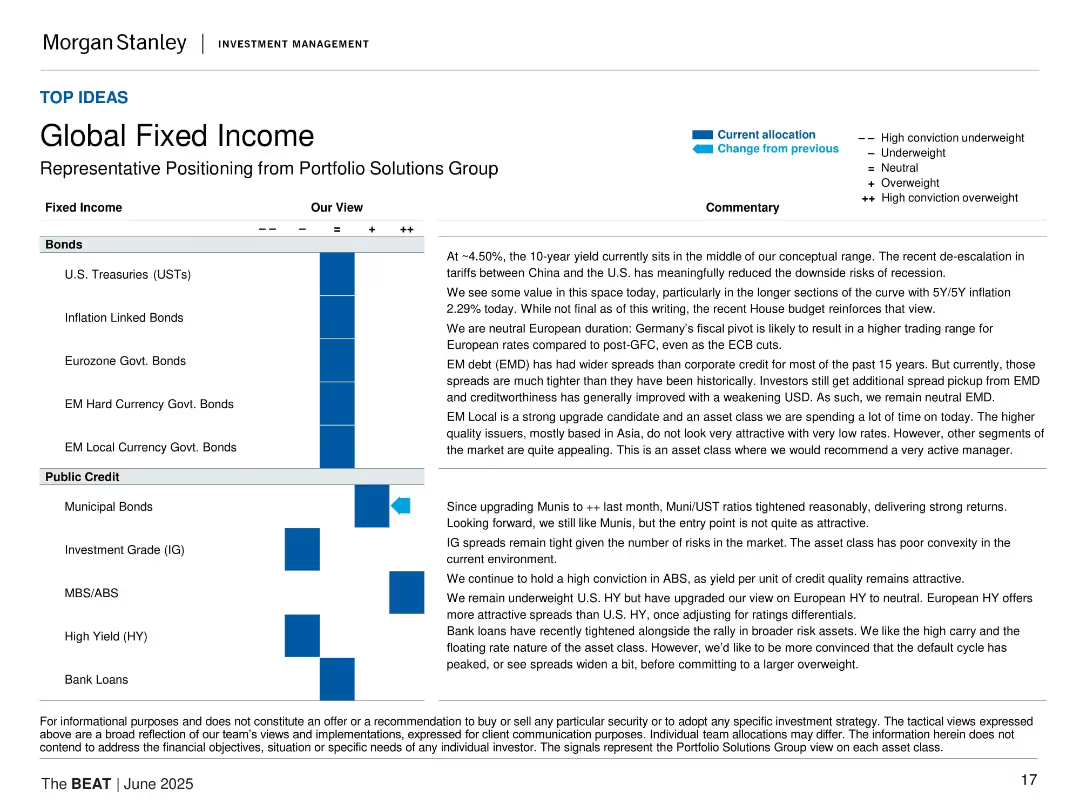
Allocation matrix for various fixed income categories; commentary on macroeconomic impacts; formal tabular style.
Strategic Planning
Financial Services
The slide outlines fixed income positioning, including U.S. Treasuries, inflation-linked bonds, EM debt, and municipals. The group explains views on interest rate sensitivity, credit risk, and hedging opportunities.
fixed income, bonds, credit, USTs, EM debt, inflation, interest rates, allocation, Morgan Stanley, investment strategy
false
Strategic Planning
Financial Services
Table
Morgan Stanley
Add to my slides
Remove from favorites
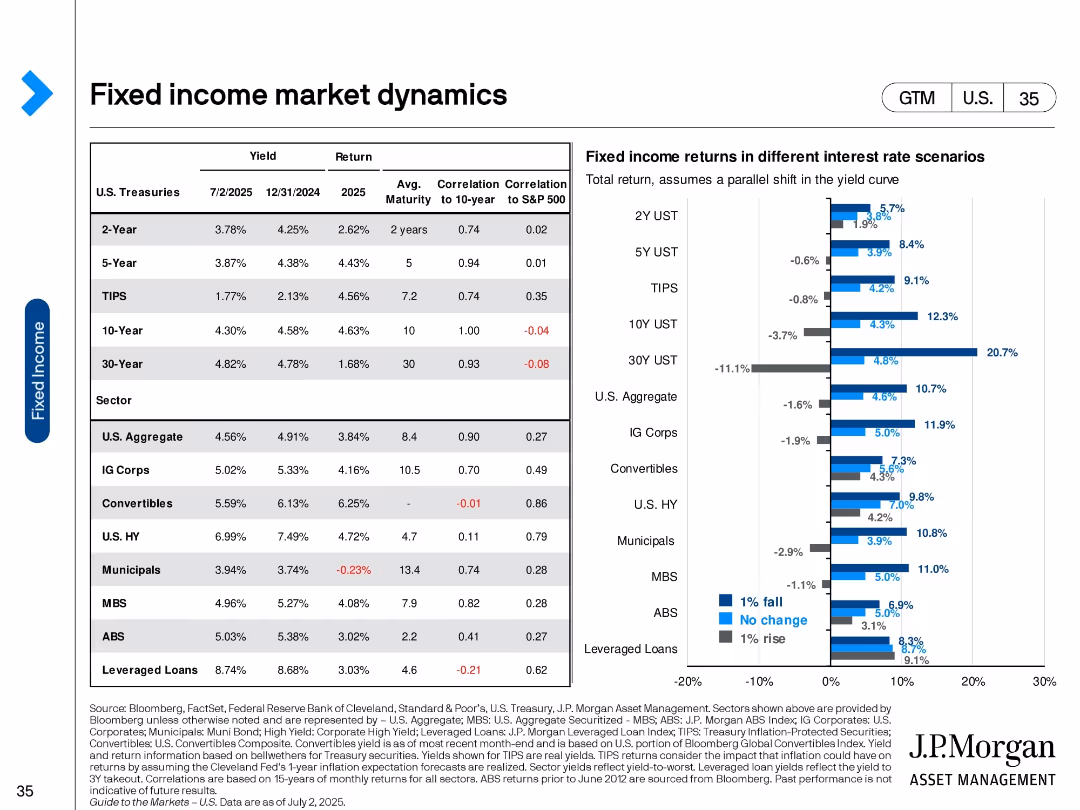
Two sections: a data table with yields, returns, and correlations across bond types; and a horizontal bar chart showing returns in various rate shifts.
Investment Analysis
Financial Services
This slide analyzes fixed income returns by sector, comparing yields and historical correlations, and simulates performance under different interest rate scenarios. It aids in identifying rate-sensitive and resilient bond categories.
fixed income, bonds, interest rates, returns, investment, yield curve, risk analysis
false
Investment Analysis
Financial Services
Mixed Chart
JP Morgan
Add to my slides
Remove from favorites
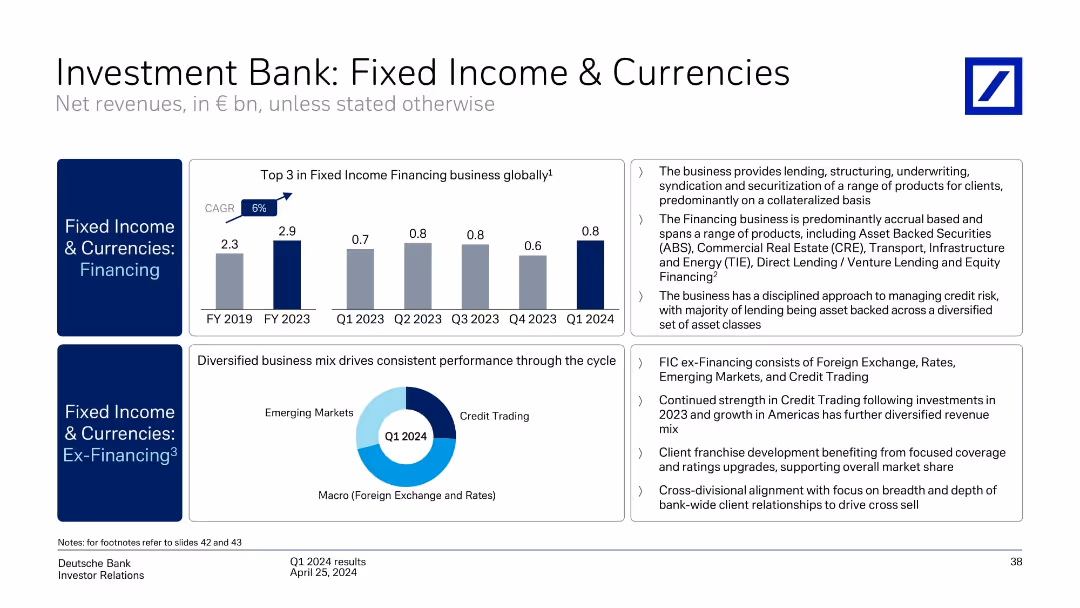
Split layout with two blue sidebar sections, bar chart on top left, donut chart on bottom center, text boxes on the right side.
Performance Metrics and KPIs
Financial Services
The slide presents financial performance for Deutsche Bank’s Fixed Income & Currencies division, showing growth in financing revenue (CAGR 6%) and diversified revenue in ex-Financing segments. Text explains business structure and strategic priorities.
Fixed Income, Currencies, Credit Trading, Revenue, Q1 2024, KPIs, Financing, Performance, Macro, Risk Management
false
Performance Metrics and KPIs
Financial Services
Multiple Chart
Deutsche Bank
Add to my slides
Remove from favorites
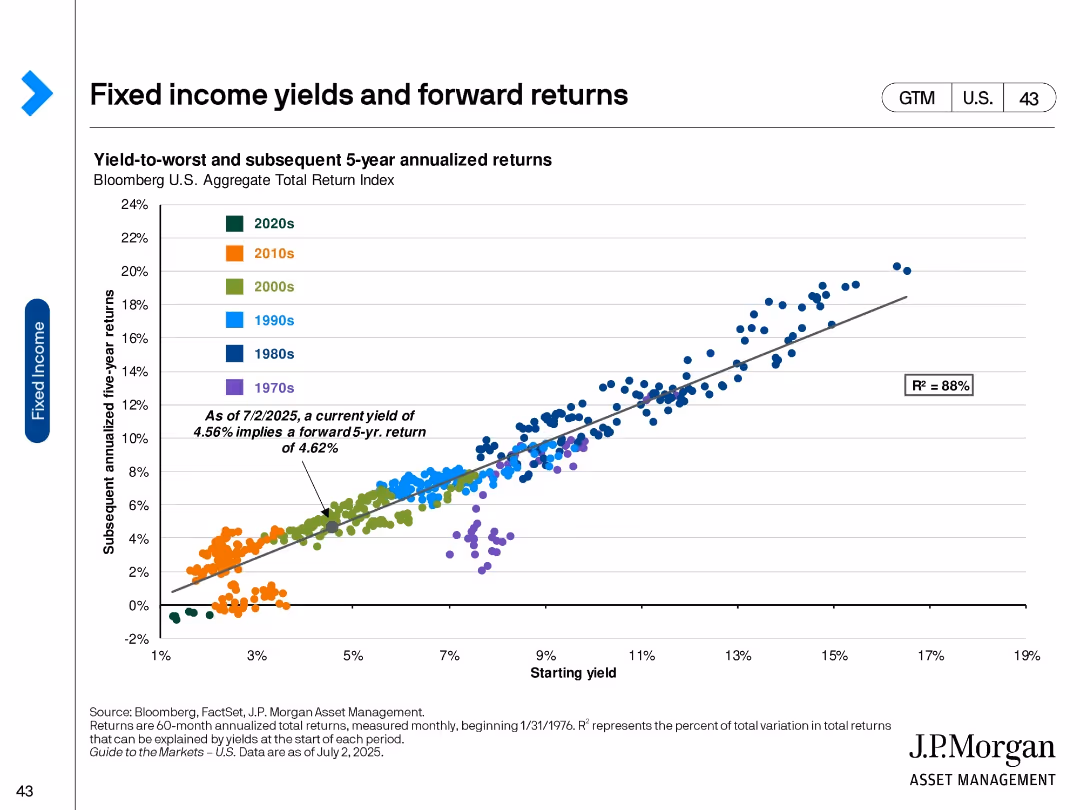
Scatter plot of starting yield vs. 5-year forward returns with color-coded historical data points.
Investment Analysis
Financial Services
Demonstrates the strong relationship between starting fixed income yields and forward 5-year returns using historical data. Shows that higher starting yields tend to correlate with better future performance, supported by R² of 88%.
Fixed income, forward return, yield curve, total return, investment forecast, bond analysis, historical data
false
Investment Analysis
Financial Services
Single Chart
JP Morgan
Add to my slides
Remove from favorites
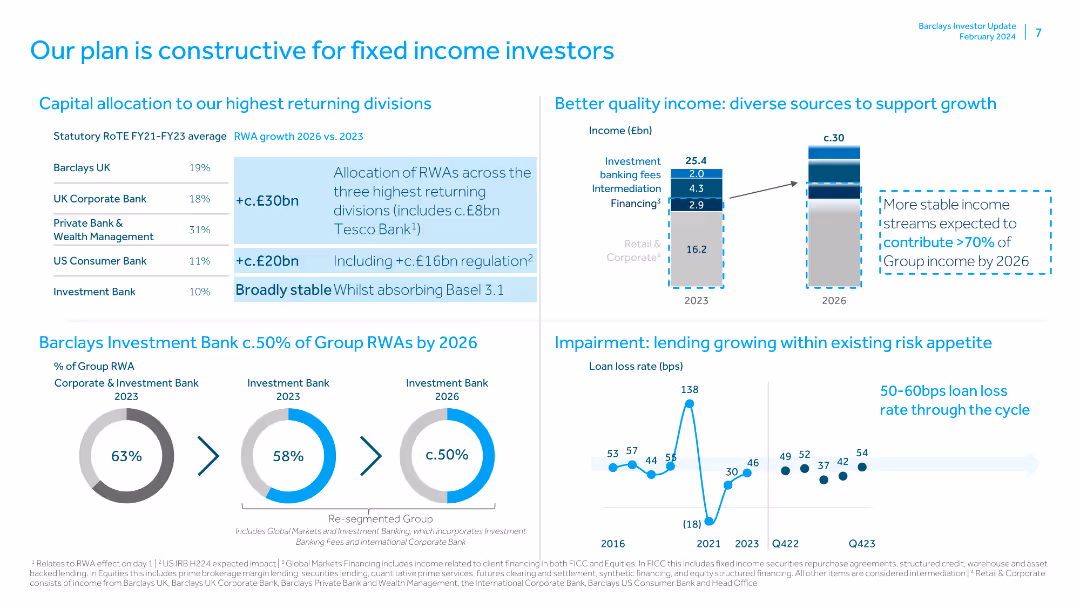
The slide includes a table of capital allocation by divisions, a bar chart of income sources, pie charts of group RWAs, and a line chart of loan loss rates, with text highlights.
Investment Analysis
Financial Services
The slide presents a plan for fixed income investors, focusing on capital allocation, quality income sources, and lending within risk appetite, supported by detailed data and projections.
Fixed Income, Investors, Capital, Allocation, Income, Risk
false
Investment Analysis
Financial Services
Multiple Chart
Barclays
Add to my slides
Remove from favorites
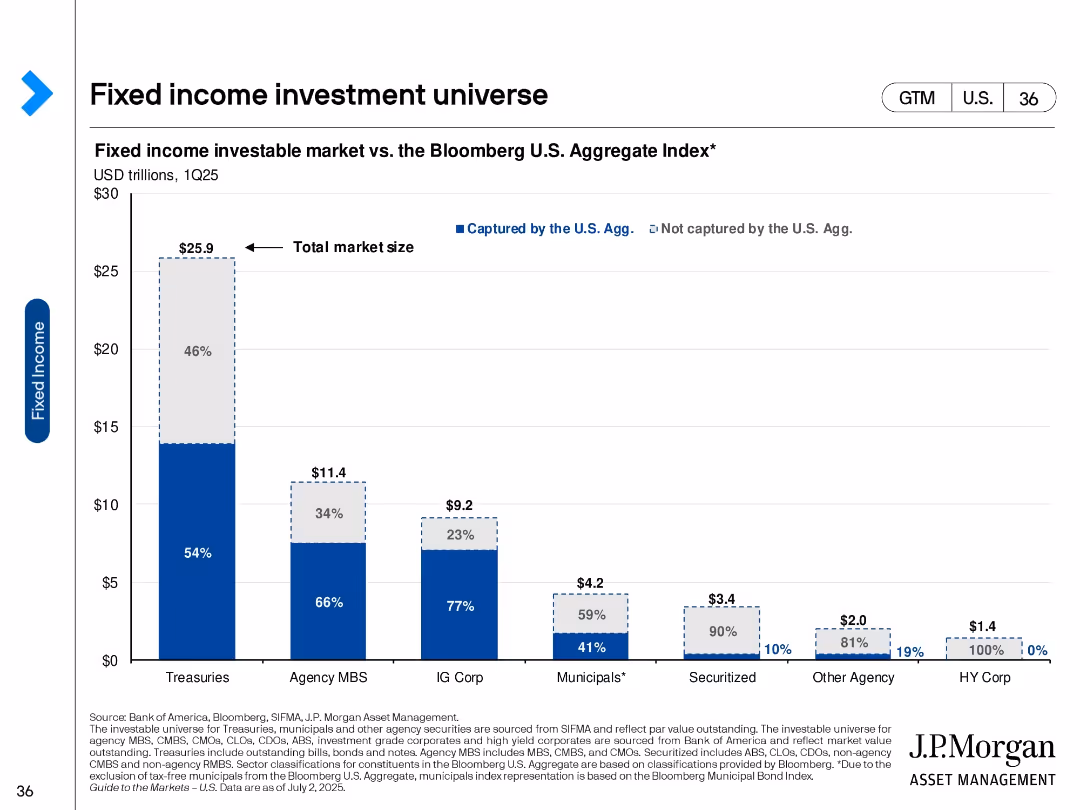
Bar chart showing total investable market size by fixed income asset class, split into portions captured by the Bloomberg U.S. Aggregate Index.
Product and Service Analysis
Financial Services
This slide breaks down the U.S. fixed income market into asset classes such as Treasuries, MBS, IG corporates, and others. It compares the total market to what’s captured by the Bloomberg Aggregate Index, highlighting investment gaps.
fixed income, market size, Bloomberg Agg, Treasuries, MBS, investment universe
false
Product and Service Analysis
Financial Services
Single Chart
JP Morgan
Add to my slides
Remove from favorites
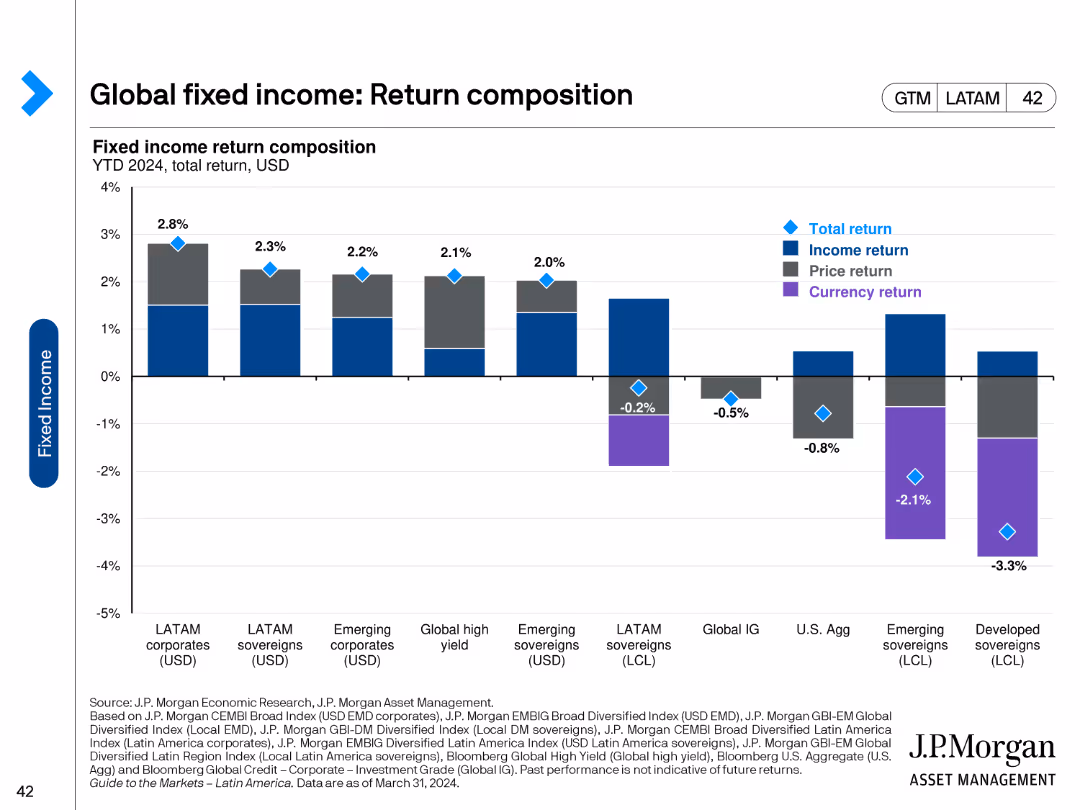
This slide includes a stacked bar chart showing fixed income return composition, breaking down total, income, price, and currency returns for various categories like LATAM and developed sovereigns.
Financial Performance
Financial Services
The slide presents the return composition of global fixed income investments, detailing income, price, and currency returns across different regions and categories, useful for financial performance analysis.
fixed income, return composition, income return, price return, currency return, LATAM, developed sovereigns, financial analysis
false
Financial Performance
Financial Services
Single Chart
JP Morgan
Add to my slides
Remove from favorites
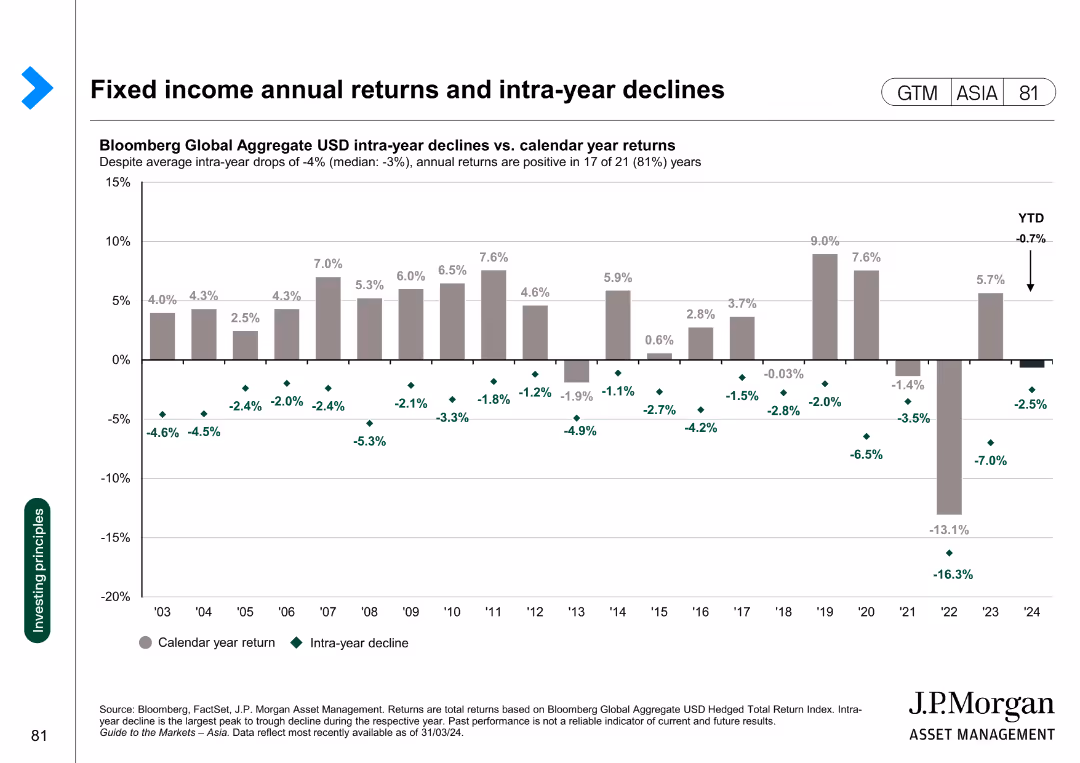
Column chart illustrating the Bloomberg Global Aggregate USD intra-year declines versus calendar year returns from 2003 to 2024.
Financial Performance
Financial Services
This slide examines the annual returns and intra-year declines of the Bloomberg Global Aggregate USD Index, providing insights into the performance of fixed income investments.
fixed income, returns, declines, Bloomberg, performance
false
Financial Performance
Financial Services
Single Chart
JP Morgan
Add to my slides
Remove from favorites
Similar layout to Slide 16853, with focus solely on fixed income. Includes categories like U.S. Treasuries, Eurozone Bonds, and various credits. Commentary details relative valuations and macro trends affecting positions.
Investment Analysis
Financial Services
This slide presents Morgan Stanley’s fixed income positioning across sovereign and credit markets. It shows overweight in EM local currency bonds and Eurozone bonds, with underweight in U.S. Treasuries. Commentary reflects inflation, rate differentials, and geopolitical risk considerations.
fixed income, sovereign bonds, credit, Treasuries, emerging markets, inflation, Eurozone, valuations, investment positioning
false
Investment Analysis
Financial Services
Table
Morgan Stanley
Add to my slides
Remove from favorites
This slide features a column chart with color-coded columns indicating different levels of spread for various bond types. Below the chart, there is a data table with spread details.
Market Analysis and Trends
Financial Services
The slide presents a detailed spread analysis for fixed income securities, providing a comparative perspective across different bond categories and dates.
fixed income, spread analysis, bonds, column chart, data table, market, financial, investment
false
Market Analysis and Trends
Financial Services
Single Chart
Morgan Stanley
Add to my slides
Remove from favorites
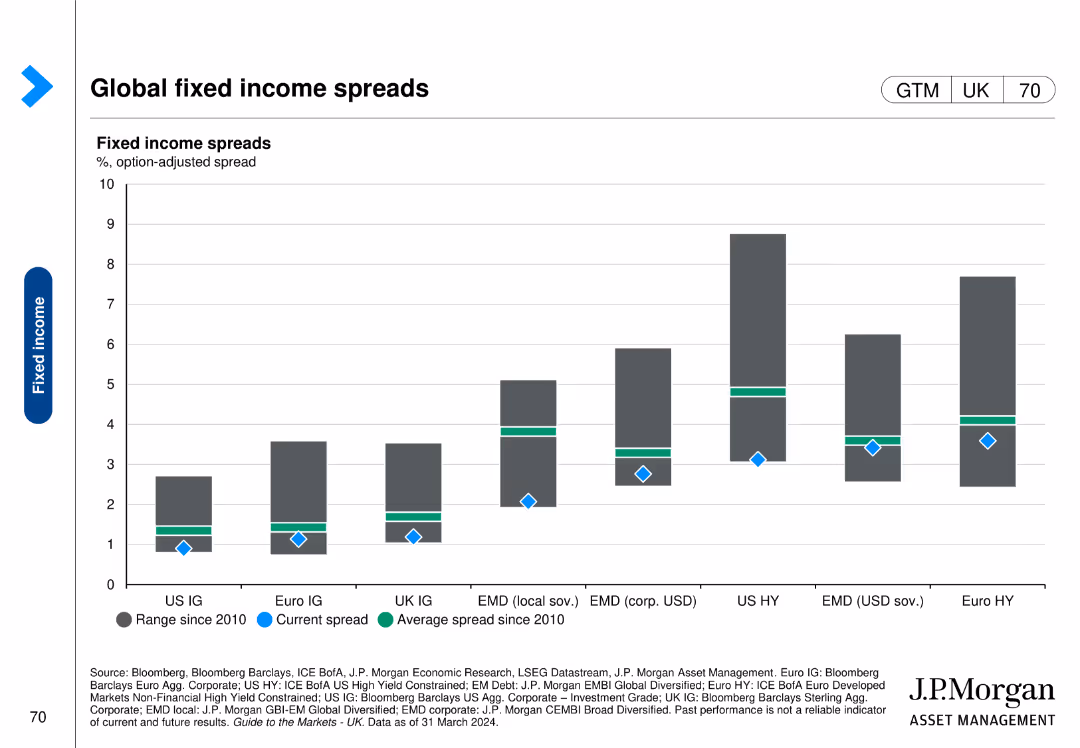
This slide features a column chart comparing fixed income spreads across various regions and asset classes, with current spread, average spread, and range since 2010 indicators.
Market Analysis and Trends
Financial Services
The slide provides an overview of global fixed income spreads, illustrating the differences and trends in spreads across regions and asset classes since 2010.
fixed income, spreads, global, regions, trends
false
Market Analysis and Trends
Financial Services
Single Chart
JP Morgan
Add to my slides
Remove from favorites
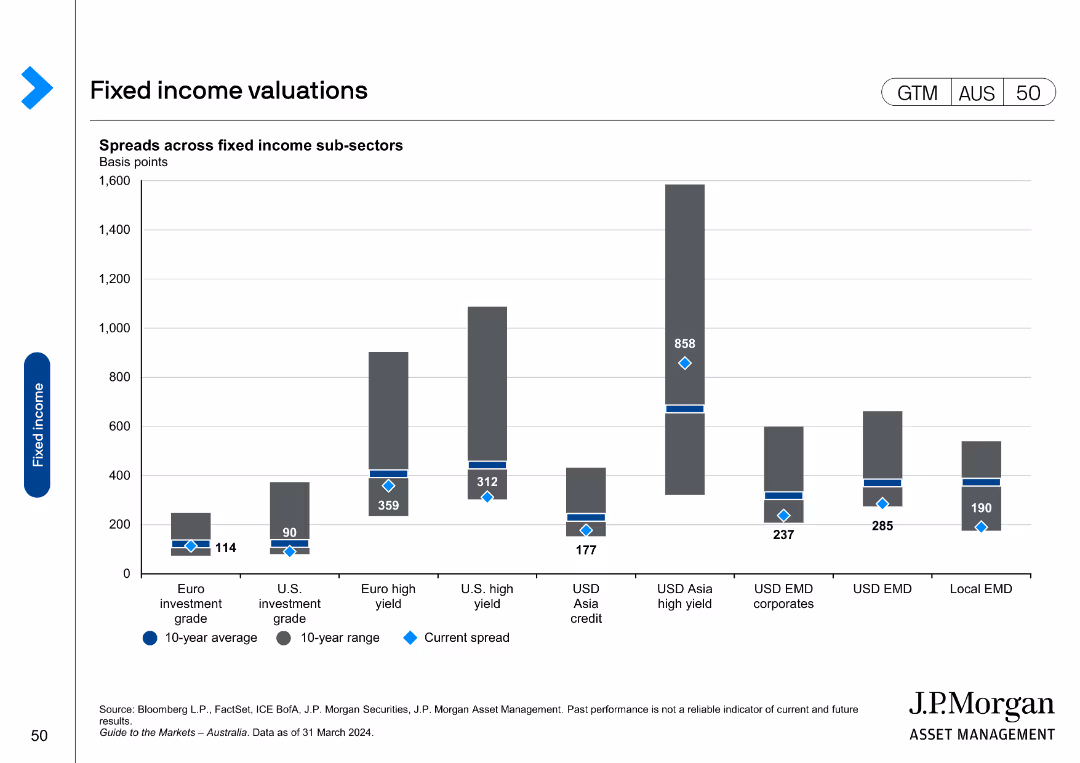
Column chart showing spread across various fixed income sub-sectors.
Market Analysis and Trends
Financial Services
Analyzes the spread across different fixed income sub-sectors, comparing current spreads to 10-year averages and ranges.
fixed income, valuations, spread, sub-sectors, analysis
false
Market Analysis and Trends
Financial Services
Single Chart
JP Morgan
Add to my slides
Remove from favorites
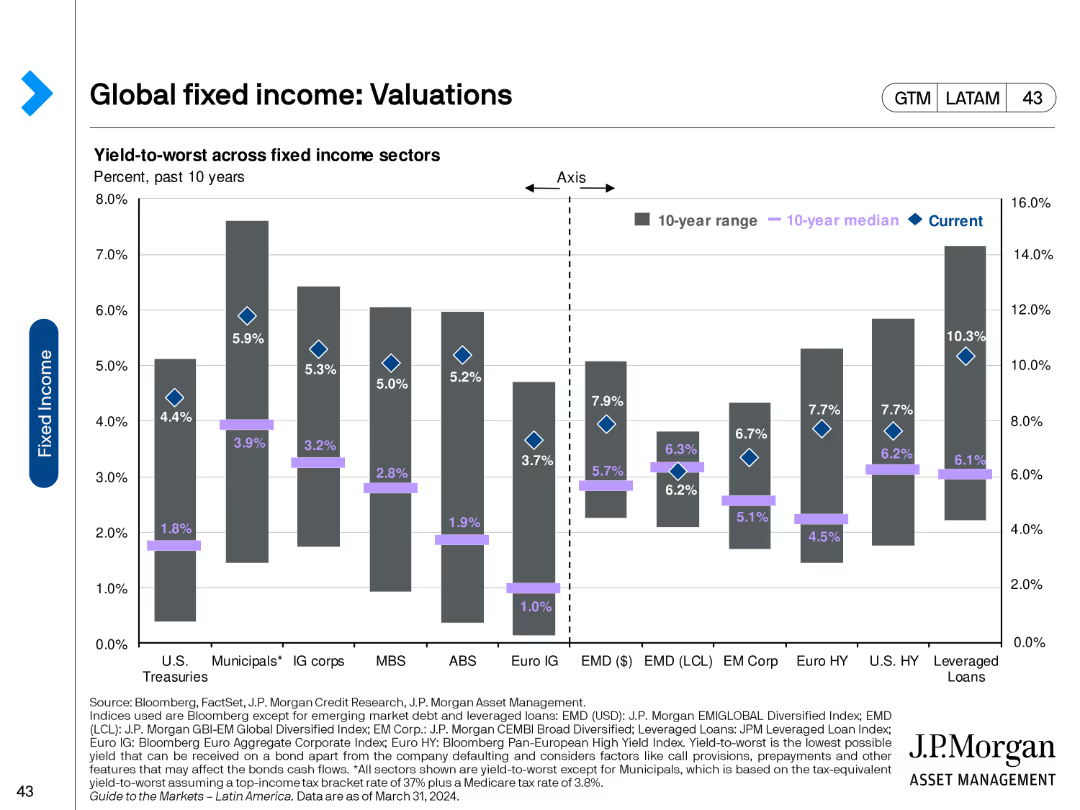
This slide includes a column chart showing yield-to-worst across different fixed income sectors, comparing current yields to 10-year median and range.
Financial Performance
Financial Services
The slide evaluates fixed income sector valuations by comparing current yields to historical medians and ranges, providing insights into investment opportunities and market conditions.
fixed income, valuations, yield-to-worst, historical yields, investment opportunities, market conditions, financial analysis
false
Financial Performance
Financial Services
Single Chart
JP Morgan
Add to my slides
Remove from favorites
Column chart showing nominal yields for different bond categories and their duration.
Market Analysis and Trends
Financial Services
Highlights nominal yields across different fixed income categories, comparing durations and maximum yields over the past 10 years.
fixed income, yields, bonds, duration, nominal
false
Market Analysis and Trends
Financial Services
Multiple Chart
JP Morgan
Add to my slides
Remove from favorites
This slide features a column chart showing fixed income yields across various types of bonds, including developed market government bonds, investment-grade bonds, and others.
Investment Analysis
Financial Services
The slide presents an analysis of fixed income yields, comparing different bond types and their return correlations, useful for investment strategies.
fixed income, yields, bonds, investment-grade, high yield, emerging markets, correlation
false
Investment Analysis
Financial Services
Multiple Chart
JP Morgan
Add to my slides
Remove from favorites
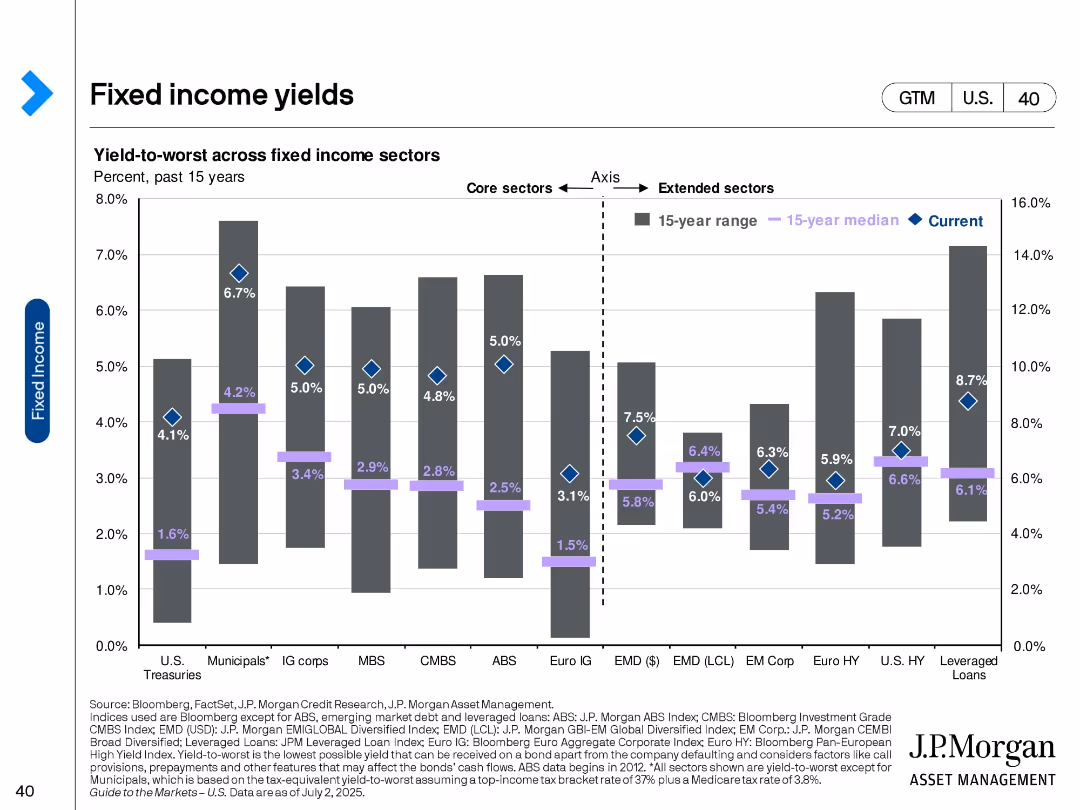
Bar chart with diamond markers comparing current, 15-year median, and range of yields across fixed income sectors.
Investment Analysis
Financial Services
This slide presents yield-to-worst data across core and extended fixed income sectors, showing how current yields compare to historical norms. It highlights opportunities in areas like leveraged loans and high-yield bonds.
Fixed income, yields, investment returns, sector analysis, bonds, interest rates, historical comparison, risk-return, income strategy
false
Investment Analysis
Financial Services
Single Chart
JP Morgan
Add to my slides
Remove from favorites
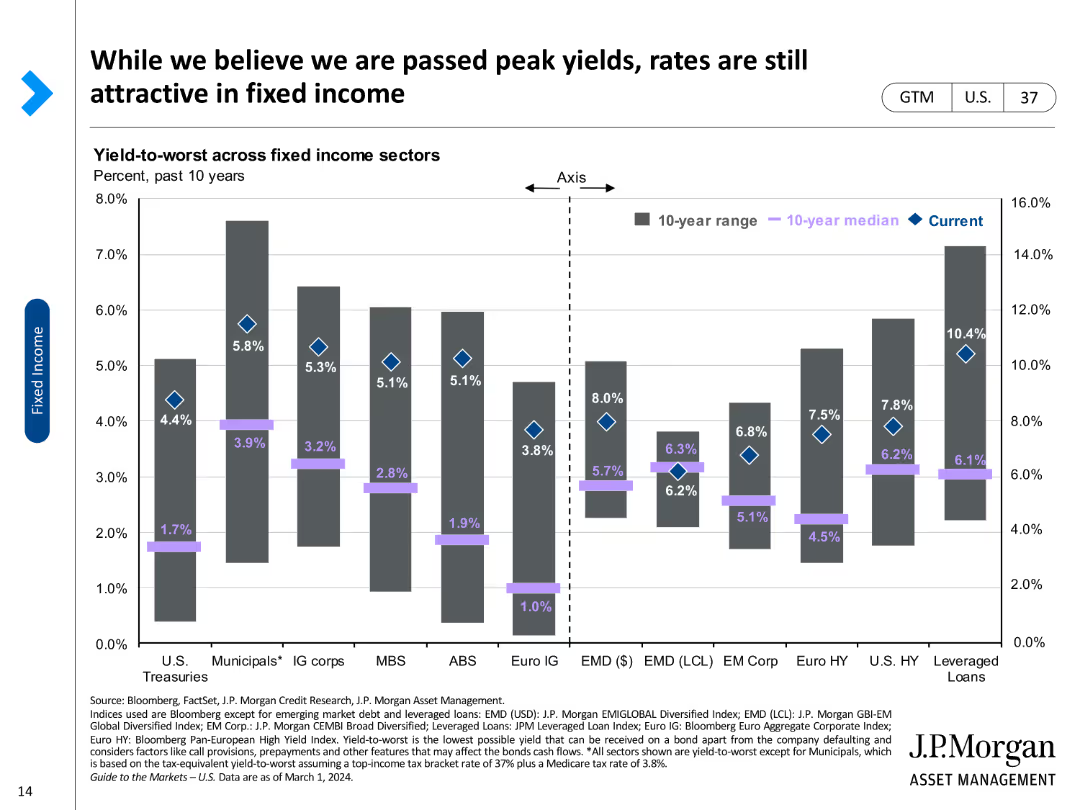
A column chart comparing yield-to-worst across various fixed income sectors, marked with current rates and historical medians.
Investment Analysis
Financial Services
Reviews yield-to-worst metrics across different fixed income sectors, highlighting investment attractiveness in the current market.
Fixed income, yield-to-worst, investment, bonds, sectors, median, current rates, attractiveness, analysis
false
Investment Analysis
Financial Services
Single Chart
JP Morgan
Add to my slides
Remove from favorites
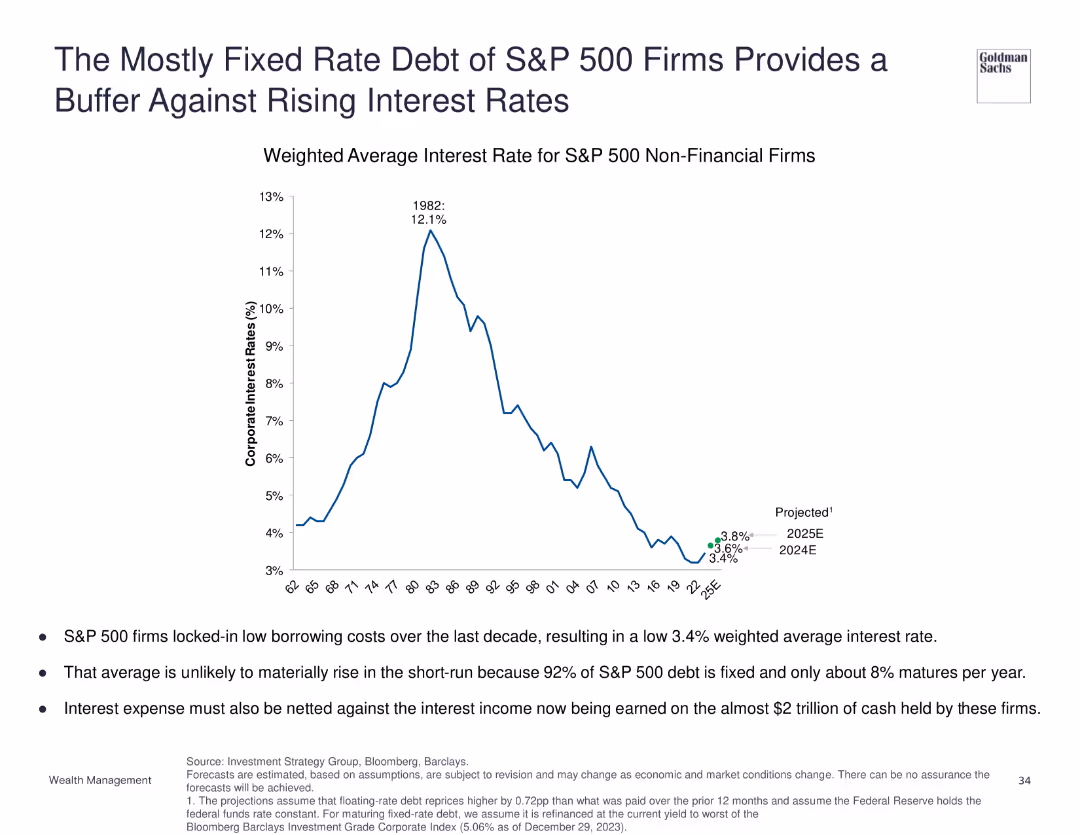
Line chart depicting the weighted average interest rate for S&P 500 non-financial firms from 1968 to projected rates in 2025.
Financial Performance
Financial Services
Discusses how the mostly fixed-rate debt of S&P 500 firms buffers against rising interest rates, with the weighted average interest rate expected to remain low in the short run.
fixed rate debt, interest rates, S&P 500, financial buffer
false
Financial Performance
Financial Services
Mixed Chart
Goldman Sachs
Add to my slides
Remove from favorites
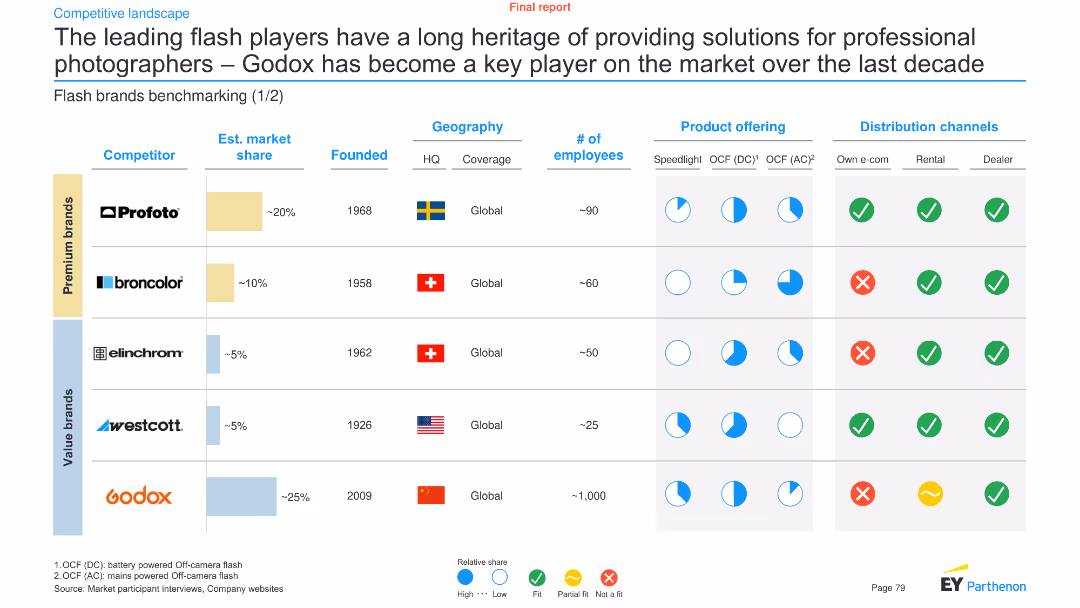
The slide uses a comparative chart layout to benchmark various flash brands based on market share, founding year, product offering, and distribution channels.
Competitive Landscape
Media & Entertainment
It benchmarks the leading flash brands like Profoto, Broncolor, Elinchrom, Westcott, and Godox in terms of market share, geographic coverage, and product offerings.
Flash brands, benchmarking, market share, professional photographers, Godox, Profoto, comparison, media, entertainment, analysis
false
Competitive Landscape
Media & Entertainment
Mixed Chart
EY
Add to my slides
Remove from favorites
A series of horizontal bar charts comparing the economic activity levels during the Flatten phase against the lockdown duration across multiple countries.
Strategic Planning
Financial Services
Quantifies the economic downturn during the Flatten phase of COVID-19 across various countries, correlating lockdown duration with economic activity levels.
Flatten phase, economic downturn, COVID-19, lockdown duration, economic activity, cross-country analysis, economic analysis
false
Strategic Planning
Financial Services
Single Chart
BCG
Add to my slides
Remove from favorites
Column charts displaying changes in fleet size, age, and lease terms over seven years.
Investment Analysis
Transportation & Logistics
Evaluates growth and operational metrics of Aircastle’s fleet, including investments and age of aircraft.
fleet, growth, investment, aircraft, age, lease terms, operational metrics
false
Investment Analysis
Transportation & Logistics
Multiple Chart
Deutsche Bank
Add to my slides
Remove from favorites
Slide uses images and a circular diagram to explain the fleet composition strategy, comparing major and minor bulk vessels.
Strategic Planning
Transportation & Logistics
Describes the strategic approach of a shipping company in managing its fleet composition to optimize operational efficiency and market responsiveness.
fleet management, shipping, strategic planning, market adaptation
false
Strategic Planning
Transportation & Logistics
Header Horizontal
Deutsche Bank
Add to my slides
Remove from favorites
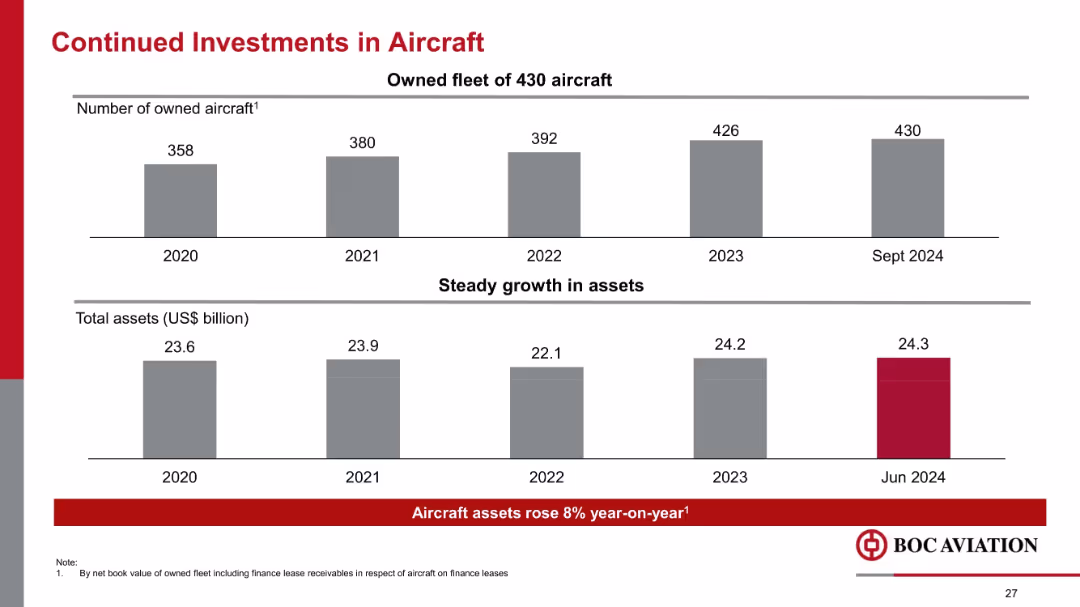
Two horizontal bar charts; one for aircraft count and one for asset value; timeline view; red and grey styling
Strategic Planning
Financial Services
Shows consistent growth in the aircraft fleet (from 358 in 2020 to 430 in 2024) and asset base (up to US$24.3B in 2024). Underlines long-term asset expansion strategy amid market recovery.
fleet size, aircraft assets, investments, asset growth, aviation, long-term strategy, planning
false
Strategic Planning
Financial Services
Mixed Chart
Goldman Sachs
Add to my slides
Remove from favorites
The slide is divided into two sections: text on the left and a bar chart on the right. The chart compares the percentage of millennials and Gen Zs valuing certain employee characteristics, with separate bars for each group. The slide has a white background with green accent bars.
Industry Overview
Technology & Software
The slide discusses the importance of flexibility and adaptability in the workplace, especially for millennials and Gen Z. It presents findings from the Deloitte Global Resilience Report, showing that these groups value flexibility/adaptability, creativity, and being technologically savvy the most in the success of businesses. A column chart visualizes these values, differentiating the perceptions between millennials and Gen Z.
Flexibility, Adaptability, Millennials, Gen Z, Deloitte, Resilience Report, Employee Characteristics, Business Success, Column Chart
false
Industry Overview
Technology & Software
Mixed Chart
Deloitte
Add to my slides
Remove from favorites
Displays a smiling woman at a desk, with a large '4' and text, set against abstract teal circles on a white background.
Technology and Digital Transformation
Professional Services
The slide emphasizes the importance of work flexibility for women and how it influences their career decisions.
flexibility, career choices, women in workforce, workplace adaptation, work-life balance, professional development
false
Technology and Digital Transformation
Professional Services
Single Chart
Deloitte
Add to my slides
Remove from favorites
Comprising a mix of text and graphical elements, this slide utilizes horizontal bar charts to depict statistical data on reasons for employment changes, with clearly delineated sections and color-coding for easy comprehension.
Market Analysis and Trends
Professional Services
This slide provides a detailed analysis of the factors leading to women quitting jobs, emphasizing the lack of flexibility in working hours. It's suitable for analyzing workforce trends and informing policies on work flexibility.
flexibility, employment, women, quitting, data
false
Market Analysis and Trends
Professional Services
Multiple Chart
Deloitte
Add to my slides
Remove from favorites
Left side features a data matrix table comparing European countries; right side includes a quote and brief commentary. Clear, color-coded scale.
Regulatory and Compliance
Government & Public Sector
Assesses market readiness for energy flexibility across European countries. Parameters include market access, sociopolitical support, and tech potential. Norway and Denmark lead, Poland scores lowest.
flexibility ratings, energy transition, Europe, readiness, regulations, EV infrastructure, market access
false
Regulatory and Compliance
Government & Public Sector
Mixed Chart
EY
Add to my slides
Remove from favorites
The slide presents bar graphs comparing the employment duration expectations of women with varying degrees of work flexibility. The color-coded design aids in distinguishing between the groups.
Performance Metrics and KPIs
Professional Services
Highlighting how work flexibility correlates with longer employment duration, this slide is vital for presentations on staff retention strategies and the importance of flexible working conditions.
flexibility, retention, employment, women
false
Performance Metrics and KPIs
Professional Services
Multiple Chart
Deloitte
Add to my slides
Remove from favorites
Combination of text and pie charts detailing women's dissatisfaction with work flexibility options and their perceived career impacts. Image of a professional woman on the left adds a visual context to the discussion.
Human Resources and Talent Management
Professional Services
The slide discusses why flexibility programs are not meeting the needs of women, highlighting statistics on dissatisfaction and negative career impacts for women taking advantage of flexible work options.
flexibility, women, career, dissatisfaction, work
false
Human Resources and Talent Management
Professional Services
Multiple Chart
PwC/Strategy&
Add to my slides
Remove from favorites
The slide includes two donut charts and text blocks. The left side displays the importance of flexibility in work location, and the right side shows flexibility in work hours.
Human Resources and Talent Management
Professional Services
Highlights the importance of flexibility in work location and hours for employees, based on survey results. Includes key statistics.
flexibility, work location, work hours, survey, employee preferences
false
Human Resources and Talent Management
Professional Services
Multiple Chart
EY
Add to my slides
Remove from favorites
The visual complexity is moderate with pie charts displaying survey data on the attractiveness of flexible international assignment packages. The slide uses a consistent color scheme to highlight percentages and maintains a clean and organized layout.
Human Resources and Talent Management
Professional Services
Addressing the appeal of flexible international assignments, the slide shows the importance of mobility package options in attracting female talent. It stresses that organizations must tailor these packages to various needs, emphasizing repatriation concerns and preferences for assignment duration and benefits.
Flexible assignments, Talent attraction, Repatriation, Mobility benefits
false
Human Resources and Talent Management
Professional Services
Multiple Chart
PwC/Strategy&
Add to my slides
Remove from favorites
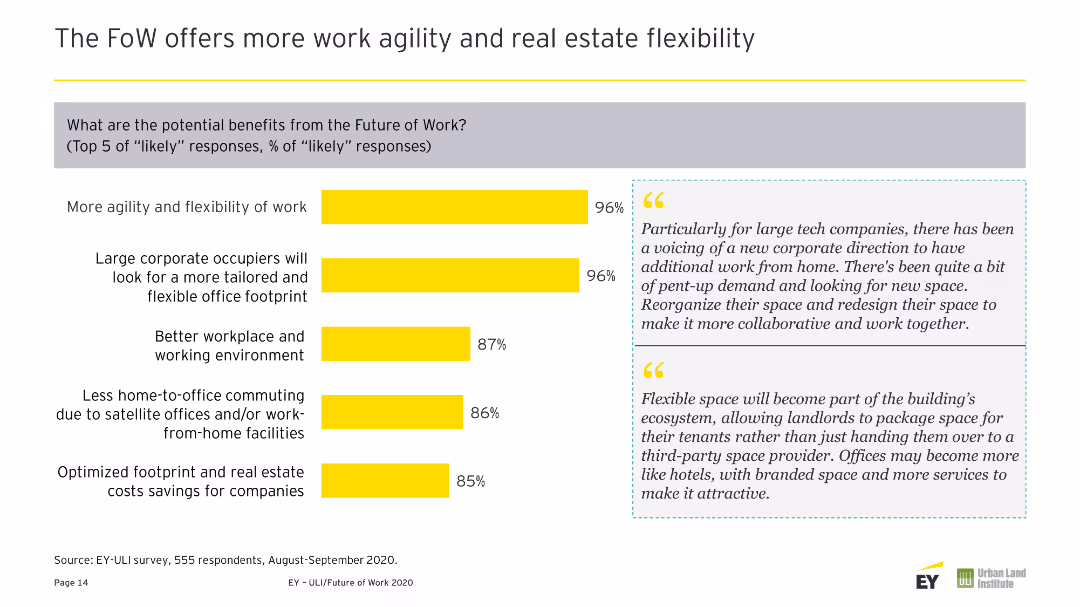
Column chart showing changes in office occupier demand, with two text quotes on the right. Yellow and gray colors dominate the slide design.
Strategic Planning
Real Estate & Construction
Discusses anticipated changes in office lease contracts, emphasizing the shift towards flexible leases and coworking spaces.
Flexible, Lease, Contracts, Corporate, Office, Real Estate, Coworking, Trends, Normal, Occupier
false
Strategic Planning
Real Estate & Construction
Mixed Chart
EY
Add to my slides
Remove from favorites
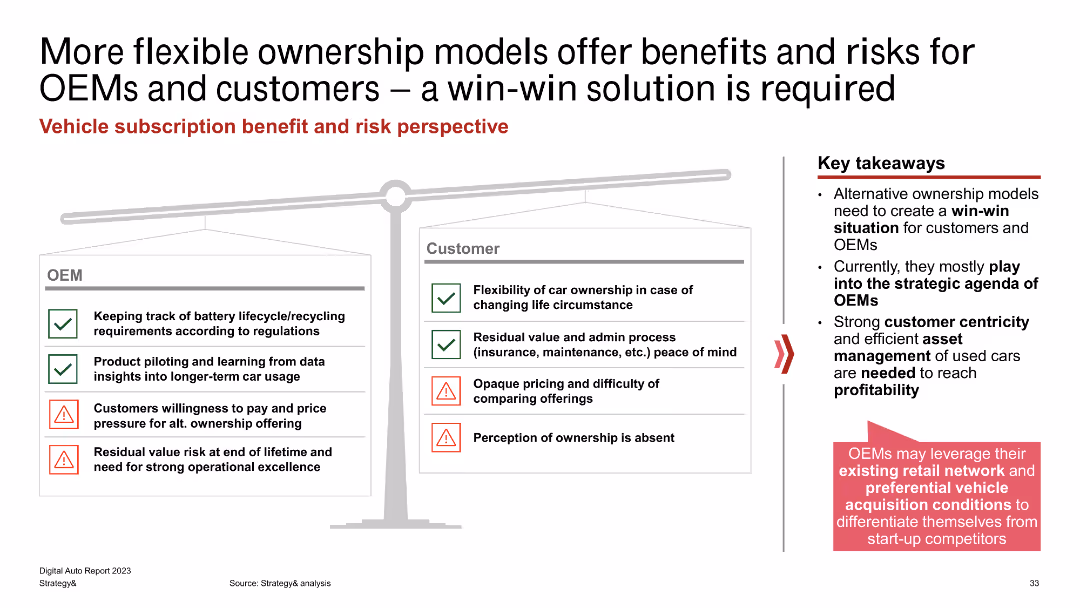
A balanced scale infographic comparing benefits and risks of flexible ownership models for OEMs and customers, with key takeaways.
Risk Assessment and Management
Transportation & Logistics
Analyzes the benefits and risks of flexible vehicle ownership models, presenting insights for OEMs and customers, and suggesting strategic actions for maximizing value.
flexible ownership, benefits, risks, OEMs, customers
false
Risk Assessment and Management
Transportation & Logistics
Table
PwC/Strategy&
Add to my slides
Remove from favorites
A slide featuring pie charts that correlate company size with preferred work environment options. It uses a simple color code to differentiate between the types of work environments.
Performance Metrics and KPIs
Professional Services
This slide is likely used in HR and management presentations to discuss how flexible work arrangements can maximize employee performance across different company sizes.
Flexible Work, Employee Performance, Company Size, Work Environment, HR Management
false
Performance Metrics and KPIs
Professional Services
Multiple Chart
EY
Add to my slides
Remove from favorites
Bar charts compare expectations and realities of office work, accompanied by text outlining best practices for flexible work arrangements, using a clean layout with a blue and teal color scheme.
Human Resources and Talent Management
Professional Services
Analyzes employee preferences for work flexibility, offering best practices for managing such arrangements, relevant to HR policy making and organizational development.
flexible work, employee preference, best practices, HR policy, organizational development, startups, work arrangements
false
Human Resources and Talent Management
Professional Services
Multiple Chart
Kearney
Add to my slides
Remove from favorites
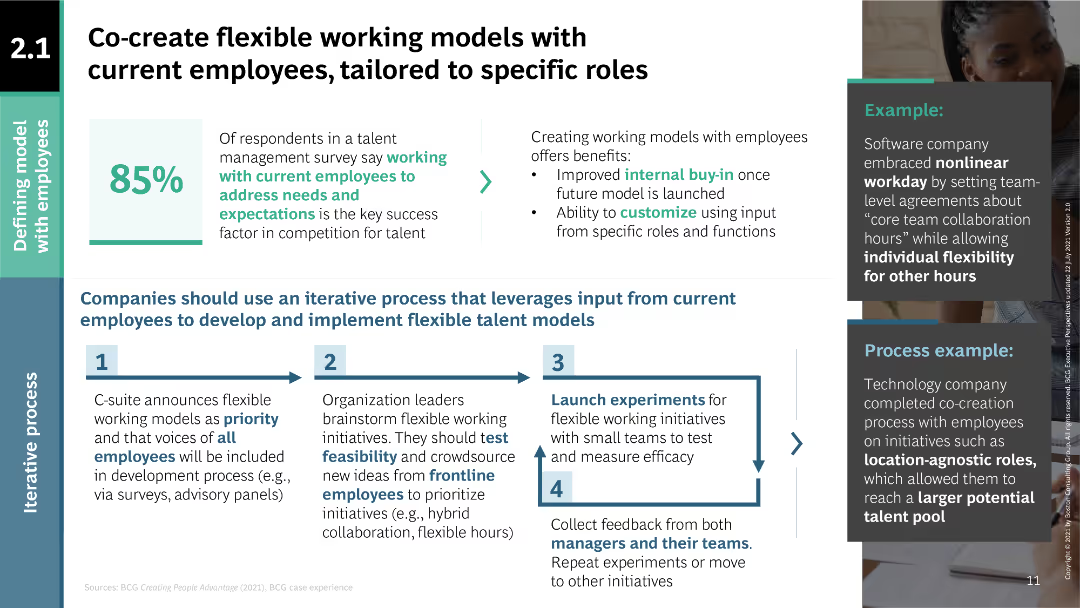
Process flow diagram for creating flexible working models; text explaining benefits and steps for implementation.
Human Resources and Talent Management
Professional Services
Outlines a process for developing flexible working models by involving current employees, highlighting benefits like internal buy-in and role-specific customization.
flexible working models, employee involvement, role-specific, internal buy-in, customization, iterative process, talent management
false
Human Resources and Talent Management
Professional Services
Linear Flow
BCG
Add to my slides
Remove from favorites
Horizontal bar chart displaying the adoption rates of various flexible working arrangements.
Strategic Planning
Professional Services
Analyzes the prevalence of flexible working arrangements, useful in discussions on modernizing workplace policies.
flexible working, workplace, policies, adoption rates, analysis
false
Strategic Planning
Professional Services
Single Chart
PwC/Strategy&
Add to my slides
Remove from favorites
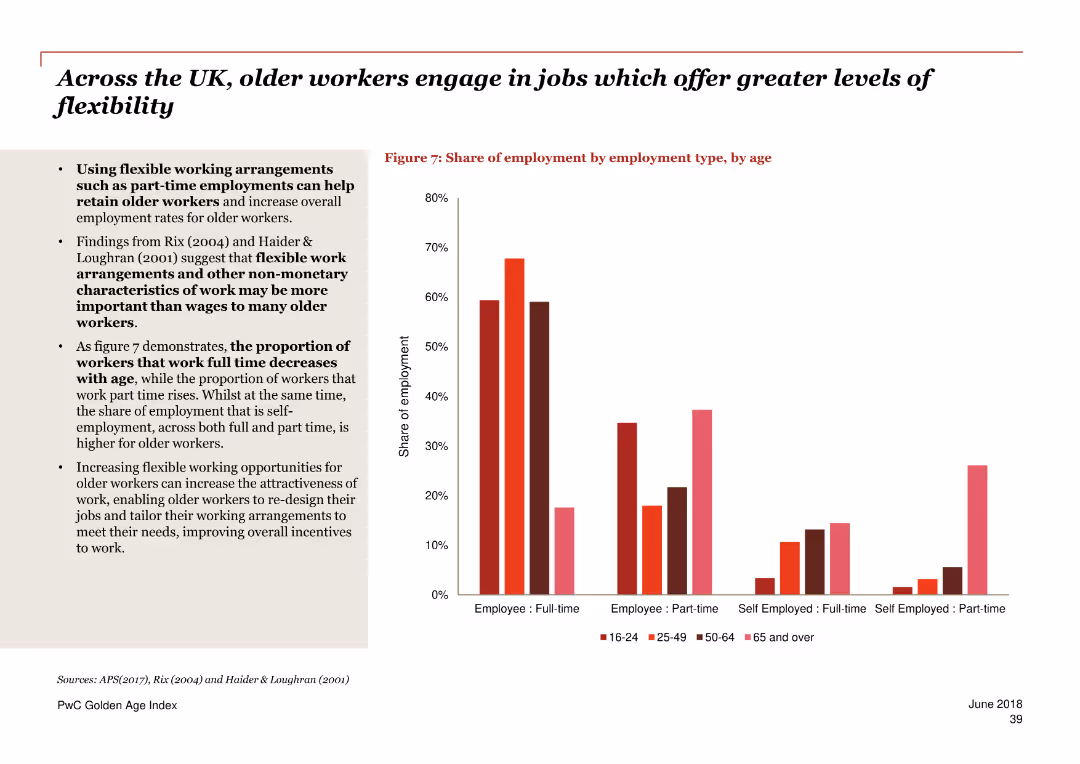
The slide includes a bar chart depicting the share of employment by type and age group. It also contains text discussing the importance of flexible working arrangements for retaining older workers and increasing their employment rates.
Human Resources and Talent Management
Government & Public Sector
The slide discusses how flexible work arrangements can help retain older workers and increase their employment rates. It highlights the shift towards part-time and self-employment as workers age, emphasizing the benefits of flexible working options.
flexible work, older workers, employment types, part-time, self-employment, retention, UK, work arrangements
false
Human Resources and Talent Management
Government & Public Sector
Mixed Chart
PwC/Strategy&
Add to my slides
Remove from favorites
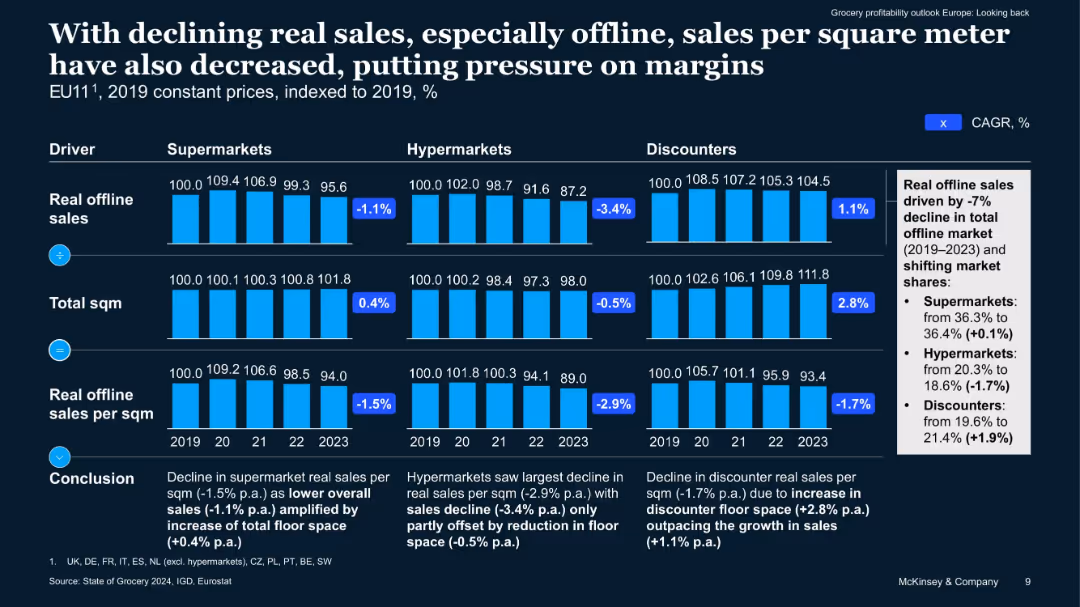
Bar charts broken into three retailer types (supermarkets, hypermarkets, discounters) over five years. Focuses on real sales, floor space, and sales per sqm. Summary box at right side.
Performance Metrics and KPIs
Retail & E-commerce
Shows how decreasing real sales and changing floor space affect sales per square meter in EU11. Highlights that hypermarkets suffer most from space inefficiency, while discounters benefit from expansion. Quantifies CAGR changes and shifts in market share.
floor space, margins, sales per sqm, retail types, EU trends
false
Performance Metrics and KPIs
Retail & E-commerce
Multiple Chart
McKinsey
Add to my slides
Remove from favorites
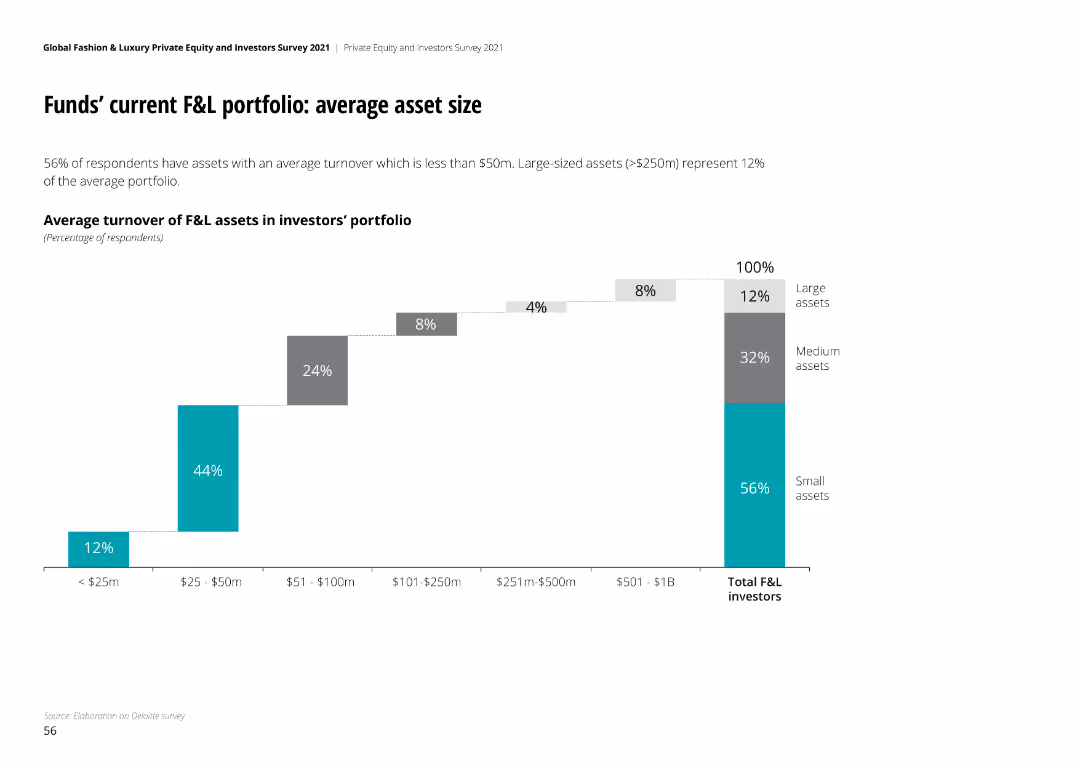
The slide contains a column chart showing the average turnover of F&L assets in investors' portfolios, categorized by asset size.
Market Analysis and Trends
Financial Services
This slide analyzes the average asset size within current F&L portfolios, detailing the distribution of asset turnovers across various size categories.
F&L, portfolio, asset size, turnover, analysis
false
Market Analysis and Trends
Financial Services
Single Chart
Deloitte
Add to my slides
Remove from favorites
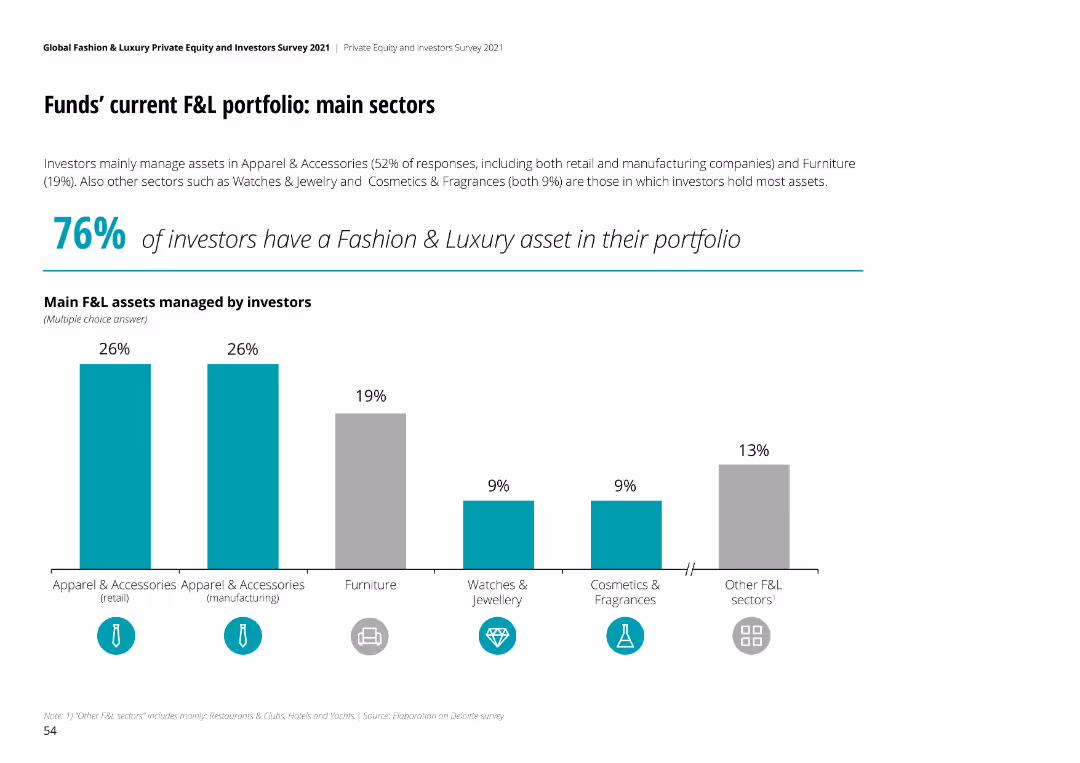
The slide contains a column chart showing the main sectors of F&L assets managed by investors, along with a key finding highlight.
Market Analysis and Trends
Financial Services
This slide presents the main sectors of current F&L portfolios managed by investors, indicating the proportion of assets in various sectors.
F&L, portfolio, sectors, investors, analysis
false
Market Analysis and Trends
Financial Services
Mixed Chart
Deloitte
Add to my slides
Remove from favorites
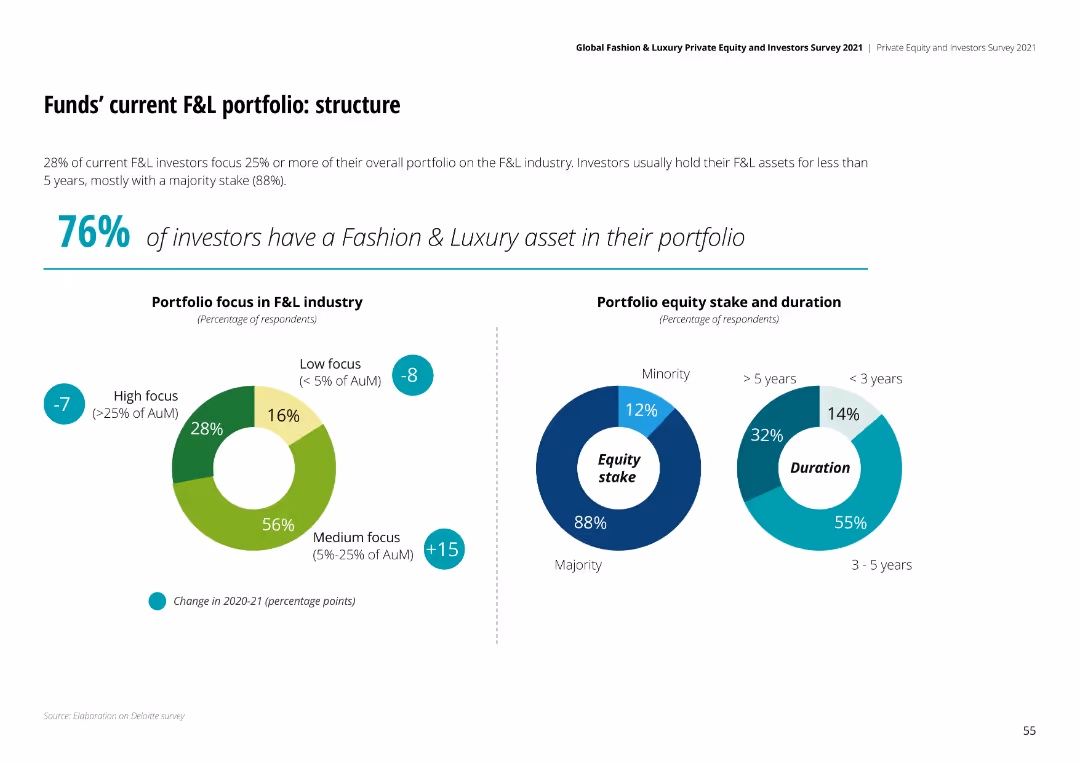
The slide includes pie charts and column charts showing the focus, equity stake, and duration of F&L portfolios, with key findings highlighted.
Strategic Planning
Financial Services
This slide discusses the structure of F&L portfolios, focusing on portfolio concentration, equity stake, and asset holding duration.
F&L, portfolio, structure, equity stake, duration
false
Strategic Planning
Financial Services
Multiple Chart
Deloitte
Add to my slides
Remove from favorites
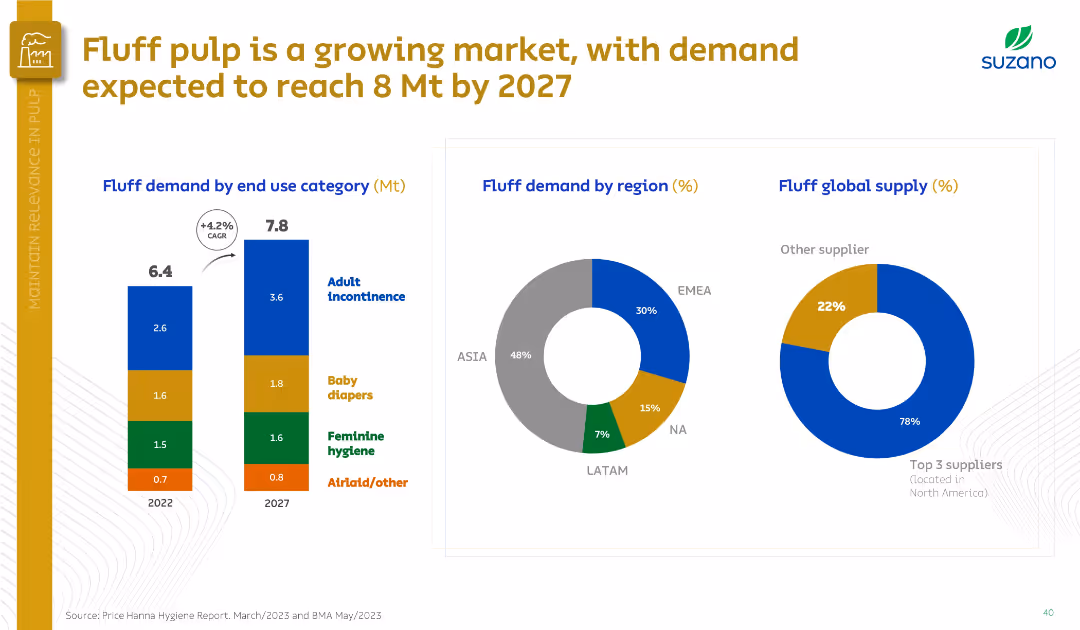
Three sections: bar chart (demand by category), donut charts (regional demand, global supply).
Market Analysis and Trends
Consumer Goods
The slide outlines the projected growth in fluff pulp demand to 7.8 Mt by 2027, with major end uses including adult incontinence, baby diapers, and feminine hygiene. It also provides a regional demand breakdown and highlights supplier concentration.
fluff pulp, hygiene products, demand growth, regional demand, suppliers
false
Market Analysis and Trends
Consumer Goods
Multiple Chart
Goldman Sachs
Add to my slides
Remove from favorites
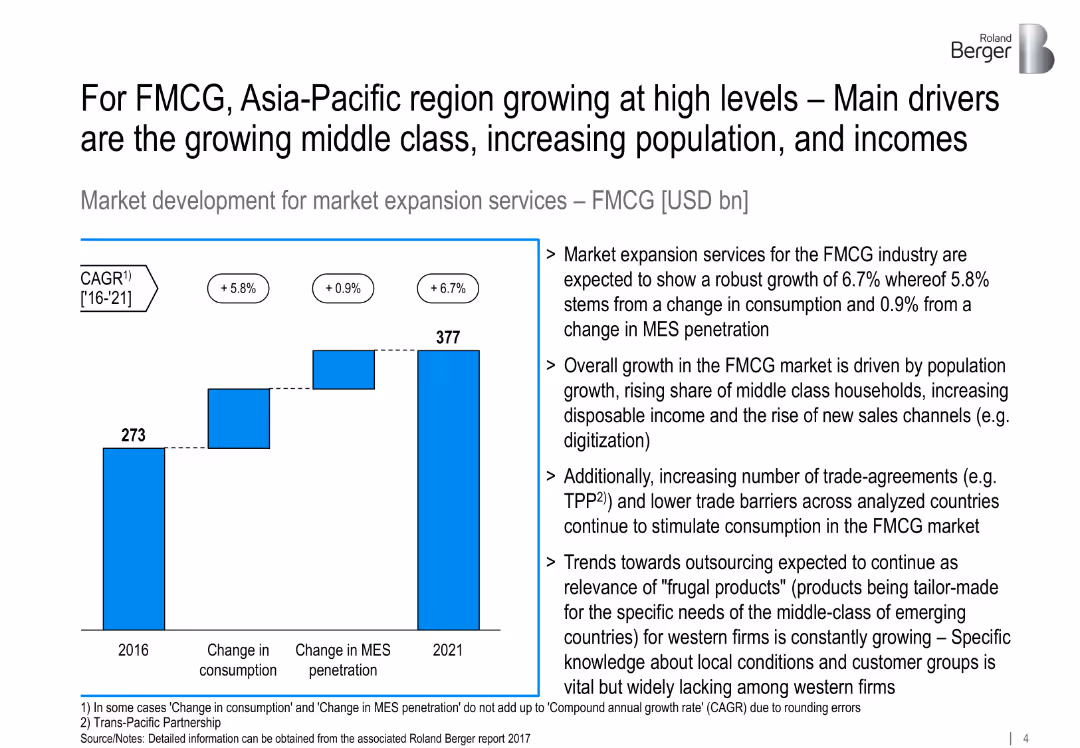
FMCG-specific MES growth bar chart and detailed bullet explanation.
Market Analysis and Trends
Consumer Goods
Explains FMCG MES market growth of 6.7% CAGR driven by middle-class expansion, new channels, and increased consumption in Asia-Pacific region.
FMCG, Asia-Pacific, MES, middle class, market expansion, consumption
false
Market Analysis and Trends
Consumer Goods
Mixed Chart
Roland Berger
Add to my slides
Remove from favorites
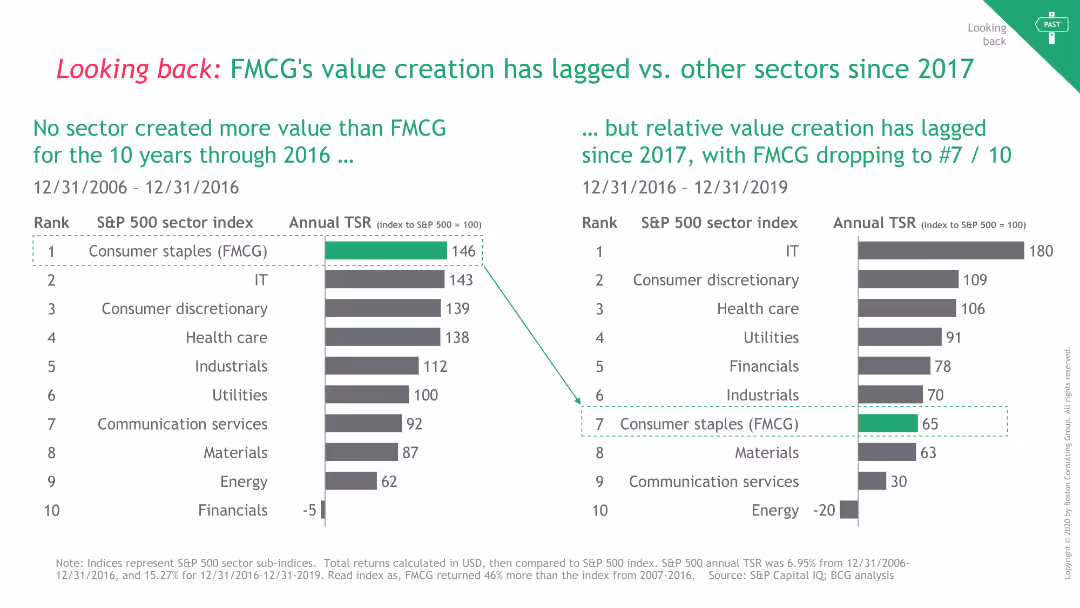
The slide uses two comparative column charts to show TSR rankings over two different periods. It has a clean design with green highlights.
Financial Performance
Consumer Goods
It compares the total shareholder return (TSR) of FMCG against other sectors from 2006-2016 and 2016-2019, showing FMCG's declining performance.
FMCG, Value Creation, TSR, Comparison, Sectors
false
Financial Performance
Consumer Goods
Multiple Chart
BCG
Add to my slides
Remove from favorites
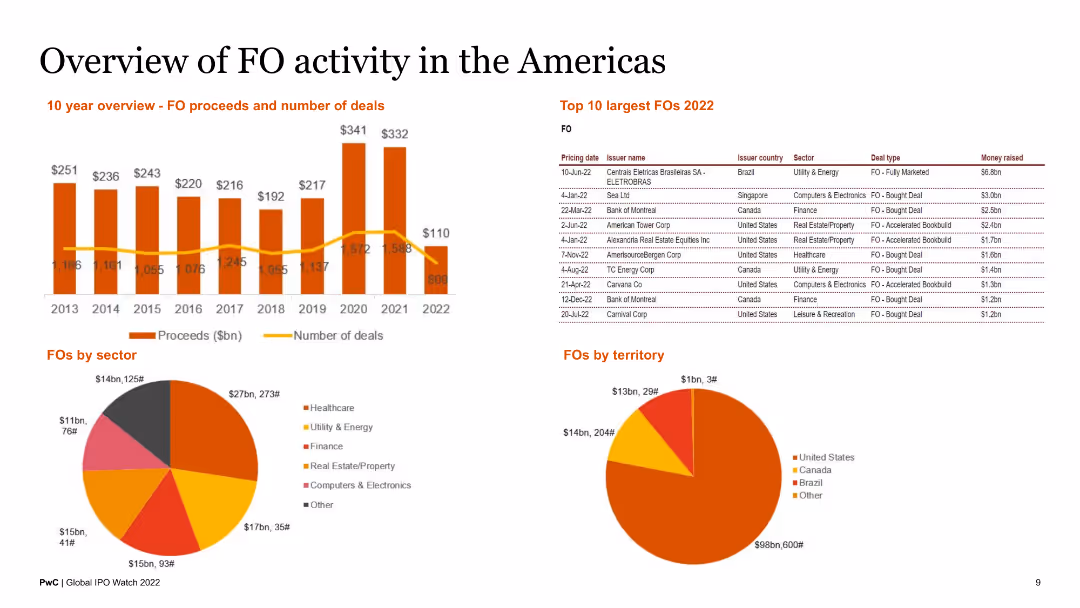
The slide features a 10-year overview of FO proceeds and number of deals, a table of top 10 largest FOs in 2022, and pie charts of FOs by sector and territory. It is visually dense, with detailed data and brief text summaries.
Market Analysis and Trends
Financial Services
This slide reviews FO activities in the Americas, presenting historical data, largest deals, and sectoral and territorial distributions. It is targeted at financial analysts and investors.
FO activity, Americas, top FOs, sector analysis, territorial overview
false
Market Analysis and Trends
Financial Services
Multiple Chart
PwC/Strategy&
Add to my slides
Remove from favorites
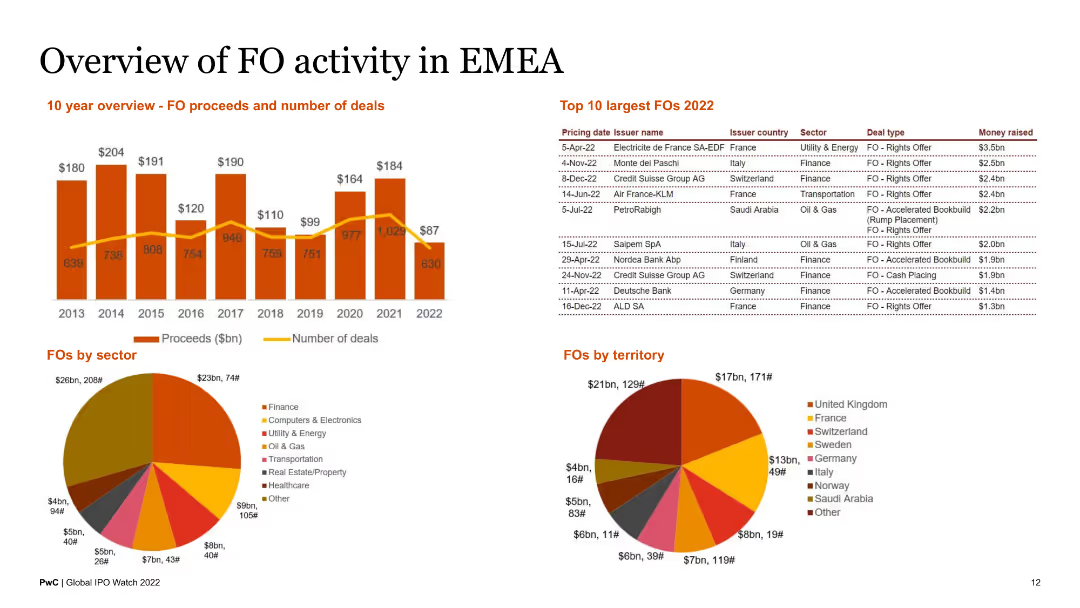
This slide features a 10-year overview of FO proceeds and number of deals, a table of top 10 largest FOs in 2022, and pie charts of FOs by sector and territory. The layout combines detailed data presentation with brief text summaries.
Market Analysis and Trends
Financial Services
The slide reviews FO activities in the EMEA region, presenting historical data, largest deals, and sectoral and territorial distributions. It is intended for financial analysts and investors focused on the EMEA market.
FO activity, EMEA, top FOs, sector analysis, territorial overview
false
Market Analysis and Trends
Financial Services
Multiple Chart
PwC/Strategy&
Add to my slides
Remove from favorites
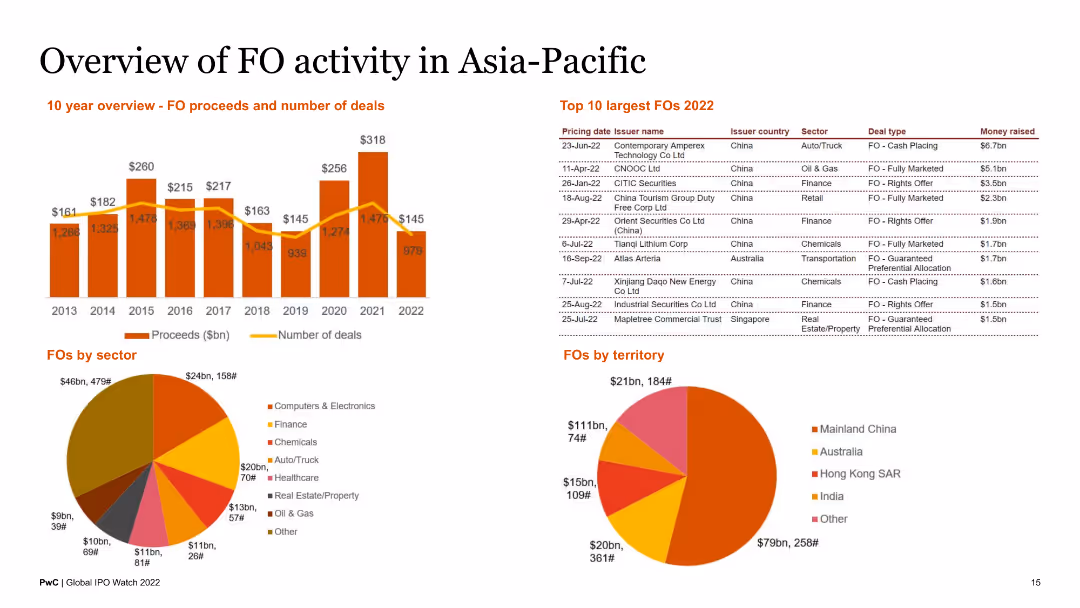
This slide includes a column chart showing FO proceeds and number of deals over 10 years, a pie chart for FOs by sector, another pie chart for FOs by territory, and a table listing the top 10 largest FOs in 2022.
Market Analysis and Trends
Financial Services
The slide presents an overview of Follow-On (FO) activities in the Asia-Pacific region, including proceeds, number of deals, sector distribution, and geographical distribution, along with top FO deals in 2022.
FO, Asia-Pacific, proceeds, deals, sector, territory, top 10, financial, market
false
Market Analysis and Trends
Financial Services
Multiple Chart
PwC/Strategy&
Add to my slides
Remove from favorites
Two vertical stacked bar charts side by side; left shows fund counts, right shows fund dollar amounts.
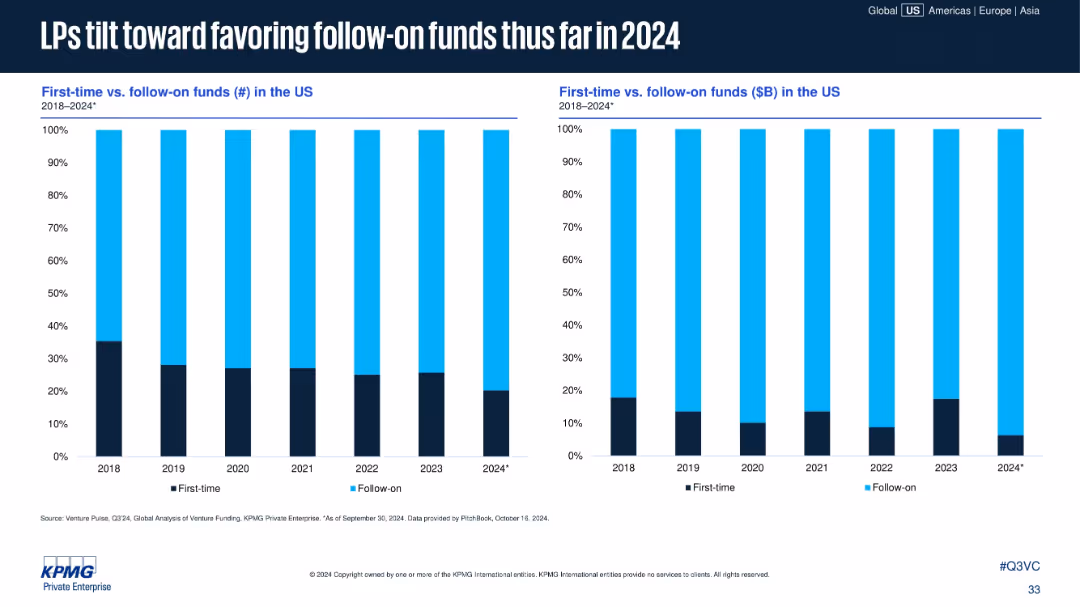
Investment Analysis
Financial Services
This slide illustrates the comparative share of first-time vs. follow-on venture funds in the U.S. from 2018 to 2024. It highlights a growing preference among LPs for follow-on funds, both in number and capital invested, signaling reduced risk appetite.
follow-on funds, first-time funds, LPs, VC, 2024, trends, US, fund count, capital allocation, investor preference
false
Investment Analysis
Financial Services
Multiple Chart
KPMG
Add to my slides
Remove from favorites
The slide is divided into two sections. On the left, a pie chart displays FY16 sales by segment in food industry, using colors like blue, yellow, and gray. On the right, a collection of brand logos under the header "Enviable brand portfolio", showcasing major brands in a grid layout.
Market Analysis and Trends
Agriculture & Food Production
The slide highlights Tyson's market positioning with a diversified portfolio in the food industry. It shows sales distribution across different meat types and prepared foods, alongside a visual array of brand logos, underscoring the company’s broad market coverage and brand strength.
Food, Agriculture, Brands, Sales, Market, Tyson
false
Market Analysis and Trends
Agriculture & Food Production
Mixed Chart
Barclays
Add to my slides
Remove from favorites
Pie chart of internet-using buyers and bar graphs for non-buyers and occasional shoppers' purchase triggers.
Market Analysis and Trends
Consumer Goods
Delves into food and grocery shopping habits, pinpointing convenience as a major factor for frequent online shoppers.
Food and Grocery, Shopping Habits, Online Shopping, Convenience, Purchase Triggers
false
Market Analysis and Trends
Consumer Goods
Mixed Chart
BCG
Add to my slides
Remove from favorites
Uses the same Ipsos layout; countries listed alongside horizontal bar chart; color-coded by response type.
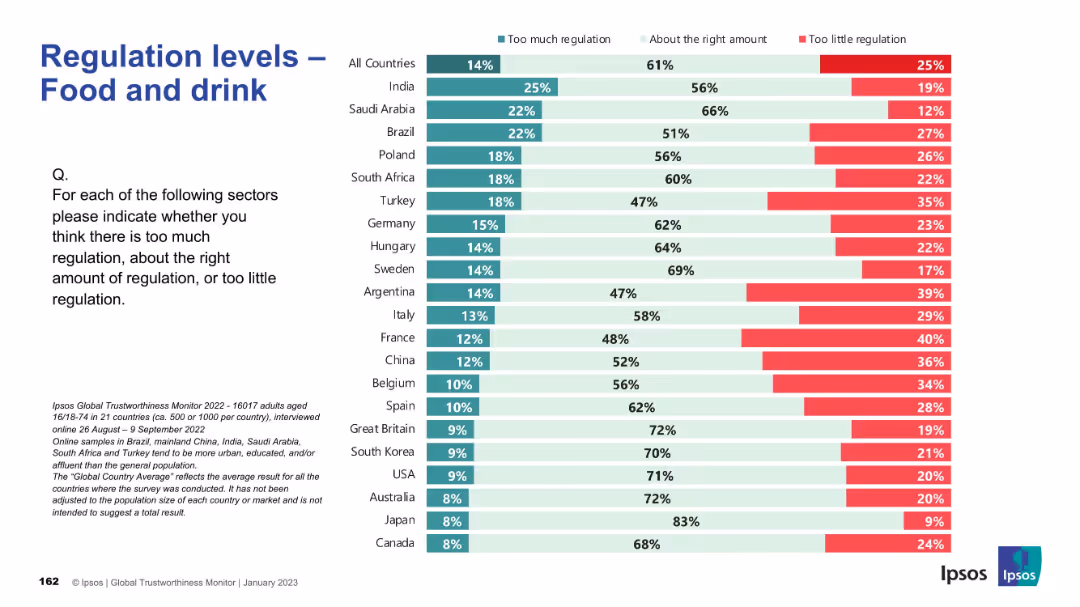
Regulatory and Compliance
Agriculture & Food Production
The slide explores perceptions of regulation in the food and drink sector. Responses are mostly favorable toward current regulation, but countries such as France, China, and Argentina show more concern about lax regulation. Japan and Canada see the existing framework as appropriate.
food, beverage, agriculture, regulation, policy, Ipsos, public opinion, governance, international survey, consumer safety
false
Regulatory and Compliance
Agriculture & Food Production
Mixed Chart
IPSOS
Add to my slides
Remove from favorites
Bar chart by country; shows trust in food and drink sector; green/red color-coded bars.
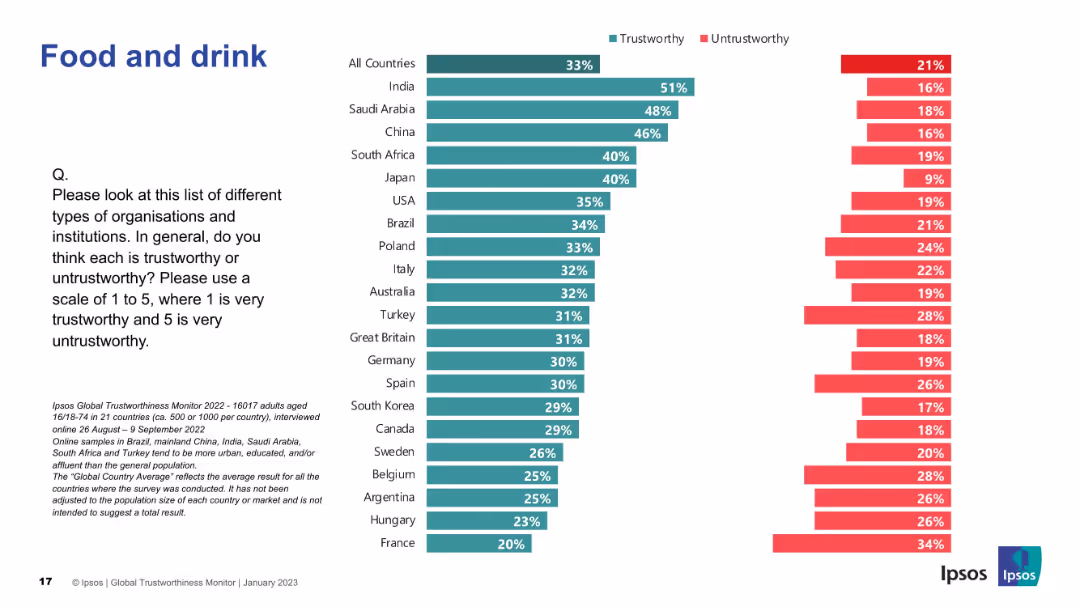
Market Analysis and Trends
Agriculture & Food Production
This slide presents global views on trust in food and drink companies. India, Saudi Arabia, and China are rated highest in trustworthiness.
food, beverage, trust, global Ipsos survey, perception, countries, trustworthy, public opinion, ranking
false
Market Analysis and Trends
Agriculture & Food Production
Mixed Chart
IPSOS
Add to my slides
Remove from favorites
This slide features a line graph displaying global per capita food consumption with a forecast till 2030. It's accompanied by text boxes highlighting key investment opportunities.
Market Analysis and Trends
Agriculture & Food Production
It outlines the relationship between population growth and agricultural technology improvements, proposing investment opportunities.
food consumption, population growth, agriculture, technology, investment opportunities
false
Market Analysis and Trends
Agriculture & Food Production
Single Chart
EY
Add to my slides
Remove from favorites
Two sections, each with column charts comparing consumer sentiment before, during, after COVID-19. Titled 'Initial surge in cooked Food Deliveries' and 'Thin line between cooked foods and groceries'. Descriptive text on the right side of the slide.
Market Analysis and Trends
Technology & Software
Examines shifts in consumer behavior regarding food delivery services during COVID-19, highlighting the initial surge and subsequent diversification in services. Valuable for e-commerce and food industry analysis regarding consumer trends and market changes.
Food delivery, Consumer behavior, COVID-19, Service diversification, E-commerce
false
Market Analysis and Trends
Technology & Software
Mixed Chart
Bain
Add to my slides
Remove from favorites
Slide with a casual image on the left and a focused, bulleted list on the right, detailing factors that can convert detractors into promoters in the food delivery industry, providing a balance of visual appeal and informative content.
Customer and Market Segmentation
Retail & E-commerce
Offers strategic insights into consumer preferences in food delivery, highlighting key factors that affect customer satisfaction and loyalty, and suggesting ways to improve service quality to increase promoter numbers.
food delivery, customer satisfaction, service improvement, detractors, promoters, Net Promoter Score, loyalty strategies
false
Customer and Market Segmentation
Retail & E-commerce
Agenda
Bain
Add to my slides
Remove from favorites
This slide consists of six line graphs, each for a different country, showing search volume trends for food delivery services over time, indexed to 2017 levels. The graphs are accompanied by annotations indicating the fold increase in search interest. The layout is clean, with each graph neatly separated and clearly labeled.
Market Analysis and Trends
Hospitality & Tourism
The slide details the enduring high interest in food delivery services post-COVID, as demonstrated by search volume data from Google Trends. Each country's graph underscores the sustained increase in consumer interest, with annotations providing a quick reference to the scale of change compared to 2017 levels.
food delivery, search trends, COVID-19 impact, consumer interest, Southeast Asia, Google Trends, index comparison, market analysis
false
Market Analysis and Trends
Hospitality & Tourism
Multiple Chart
Bain
Add to my slides
Remove from favorites
Includes a title, two large column charts, and detailed bullet points explaining the data. The slide's design is straightforward, focusing on presenting comparative data effectively.
Operational Efficiency
Technology & Software
Analyzes the contrasting growth of food delivery against the contraction in transport and discusses the future of commute patterns and food delivery services, with an emphasis on pivoting towards profitability. Suitable for operational and risk assessment.
Food delivery, transport, growth analysis, commute patterns, profitability
false
Operational Efficiency
Technology & Software
Mixed Chart
Bain
Add to my slides
Remove from favorites
Features a blue column chart indicating the percentage of users increasing food delivery frequency, with additional insights in text format.
Market Analysis and Trends
Retail & E-commerce
Analyzes the food delivery sector, showing the surge in user frequency and the competitive landscape. This slide is essential for businesses operating in or entering the food delivery market, providing data to strategize on customer retention and market entry.
Food Delivery, User Growth, Market
false
Market Analysis and Trends
Retail & E-commerce
Mixed Chart
Bain
Add to my slides
Remove from favorites
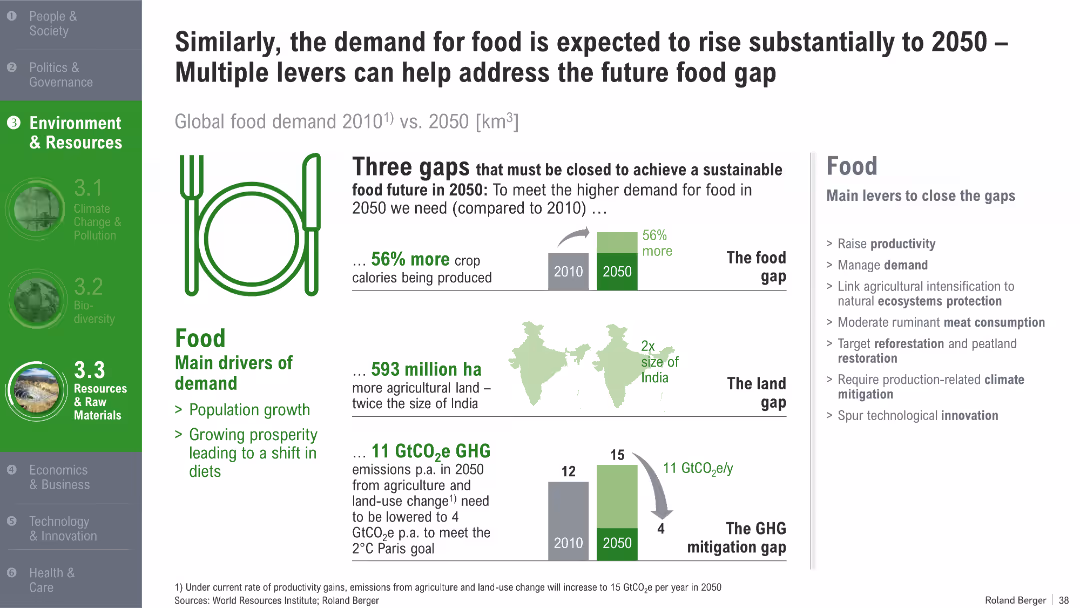
Illustrated diagrams of food, land, and GHG gaps with bars, maps, and infographics; levers listed in sidebar
Strategic Planning
Agriculture & Food Production
The slide details three critical gaps in food, land, and emissions that must be addressed by 2050 to meet rising global food demand. It proposes various mitigation levers such as productivity improvements, dietary shifts, and technological innovation.
food demand, land use, GHG emissions, 2050, food gap, sustainable agriculture, mitigation
false
Strategic Planning
Agriculture & Food Production
Mixed Chart
Roland Berger
Add to my slides
Remove from favorites
The slide features a series of bar charts comparing the importance and maturity levels of companies in the food ecosystem across various revenue bands. The color palette is blue, with clear labels and a clean layout, facilitating easy interpretation of data.
Customer and Market Segmentation
Agriculture & Food Production
This slide assesses the maturity levels of companies in the food ecosystem, segmented by revenue size, from less than 50M € to over 5B €. It discusses how these companies view their maturity in achieving future food targets, useful for market analysis or business strategy sessions.
food ecosystem, maturity assessment, revenue segmentation, companies, market analysis, business strategy, food sector
false
Customer and Market Segmentation
Agriculture & Food Production
Mixed Chart
Deloitte
Add to my slides
Remove from favorites
Slide with multiple horizontal bar charts in teal, illustrating the relative importance of various stakeholders in the food ecosystem.
Customer and Market Segmentation
Agriculture & Food Production
Evaluates how companies perceive the importance of various stakeholders in advancing the food ecosystem agenda, useful for strategic decisions in food sustainability practices.
Food Ecosystem, Stakeholders, Importance, Strategic Decisions, Sustainability
false
Customer and Market Segmentation
Agriculture & Food Production
Mixed Chart
Deloitte
Add to my slides
Remove from favorites
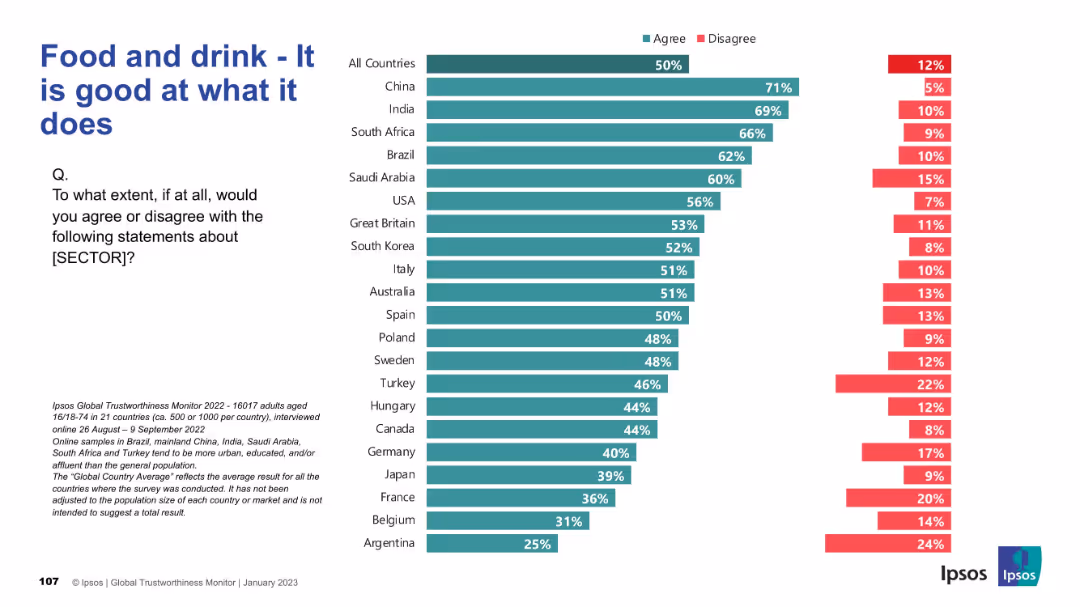
Similar bar chart design but covering the food and drink sector. Rankings by country on competence perception.
Product and Service Analysis
Consumer Goods
Surveys consumer confidence in the competence of the food and drink sector. China, India, and Brazil show high agreement that this sector performs well. Trust in product quality is central to the insights provided.
food industry, competence, trust, consumer perception, Ipsos, services
false
Product and Service Analysis
Consumer Goods
Mixed Chart
IPSOS
Add to my slides
Remove from favorites
The slide uses multiple small images and graphics to discuss trends in food production and its environmental impacts, including charts on GHG emissions.
Market Analysis and Trends
Agriculture & Food Production
Explores significant trends in the food industry, focusing on environmental impacts and market changes, emphasizing the need for sustainable practices.
food industry, environmental impact, market trends, sustainability, GHG emissions
false
Market Analysis and Trends
Agriculture & Food Production
Boxed
Deutsche Bank
Add to my slides
Remove from favorites
Features three circular icons representing the food industry, consumers, and government, each linked to a key focus area. The design is clean with a blue color scheme.
Strategic Planning
Environmental Services & Sustainability
Discusses the need for a radical transformation in the food system, emphasizing the roles of various stakeholders including the food industry, consumers, and government in achieving sustainable practices.
food industry, sustainability, stakeholders, transformation
false
Strategic Planning
Environmental Services & Sustainability
Pillar
Deloitte
Add to my slides
Remove from favorites
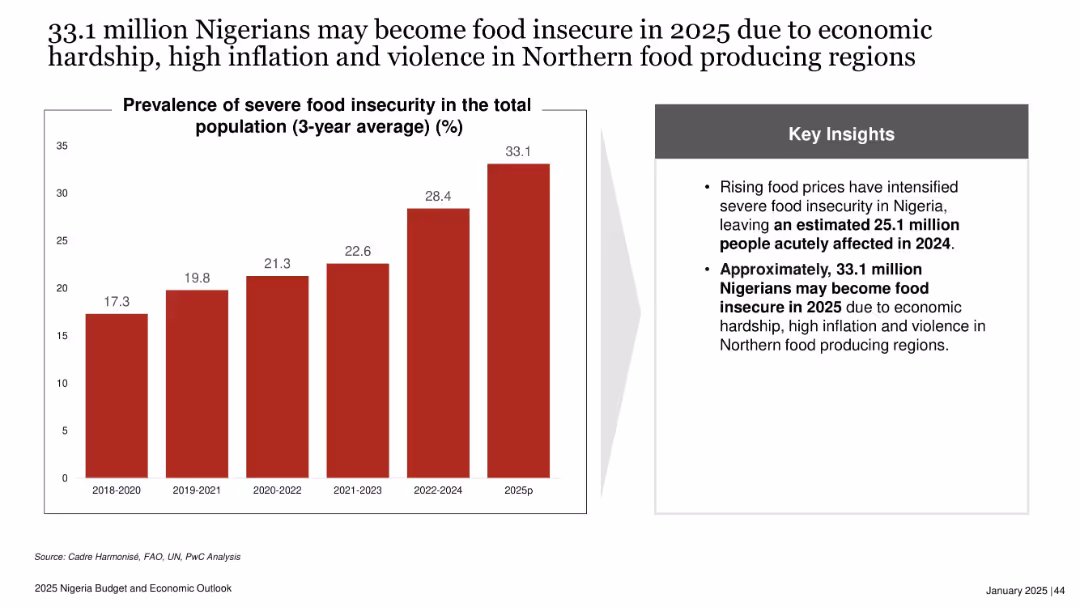
Bar chart on the left showing percentages of severe food insecurity from 2018–2025p; key insights box on the right in grey with bulleted insights. Clean and minimal layout.
Risk Assessment and Management
Government & Public Sector
The slide highlights the rising threat of food insecurity in Nigeria, projecting that 33.1 million people may be food insecure in 2025 due to economic and social challenges. It shows a steady rise in severe food insecurity and emphasizes the urgent need for intervention.
food insecurity, inflation, Nigeria, violence, Northern regions, economic hardship, 2025 projection, rising trend, humanitarian crisis
false
Risk Assessment and Management
Government & Public Sector
Mixed Chart
PwC/Strategy&
Add to my slides
Remove from favorites
This slide shows the distribution of food loss across different stages of the agricultural value chain in Nigeria, using column charts to highlight the significant economic impact of these losses.
Strategic Planning
Agriculture & Food Production
The slide details the economic toll of food loss in Nigeria, mapping the journey of food from production to retail and illustrating how losses at each stage contribute to a substantial reduction in GDP. It emphasizes the need for strategic interventions in the agricultural sector.
Food Loss, GDP, Agriculture, Nigeria, Economic Impact
false
Strategic Planning
Agriculture & Food Production
Mixed Chart
BCG
Add to my slides
Remove from favorites
The slide uses stacked column charts to compare the losses of perishable versus non-perishable foods in Nigeria, highlighting the disproportionately high losses of perishable foods.
Strategic Planning
Agriculture & Food Production
This slide analyzes food loss in Nigeria, emphasizing the greater vulnerability of perishable goods due to inadequate cold storage facilities. It suggests potential areas for infrastructural improvements to reduce these losses significantly.
Food Loss, Perishable Goods, Nigeria, Storage, Analysis
false
Strategic Planning
Agriculture & Food Production
Multiple Chart
BCG
Add to my slides
Remove from favorites
Previous
Next
You don't have any favorites yet.
Please wait loading your favorites slides...
Create a FREE account to continue browsing
Receive Instant Access to 1,000+ slides from companies like McKinsey, Google, and Goldman Sachs
First Name
Last Name
Email
Password
I agree to all
Terms & Privacy Policy
Thank you! Your submission has been received!
Oops! Something went wrong while submitting the form.
Have an account?
Sign in
Upgrade to PRO to Save slides
Advanced Search and Filters
Access to 15,000+ slides
Access to Category Pages
Save/Bookmark Slides
PowerPoint Template Library
Pick a Plan
MONTHLY
$12/month
Billed every month, Cancel anytime.
YEARLY
$9/year
Billed $108 annually, Cancel anytime.
Checkout for $12/month
Checkout for $108/yr
Secured by Stripe | AES-256 bit encryption