My Account
My Slides
Search by Category
Companies
Slide Type
Use Case
Industry
Pricing
Templates
View All Templates
Download Template Slides
✦ AI
AI Prompt Library
AI Search
Feedback
Login
Logout
Get Started
Browse all Slides
Browse all Slides
Create a FREE Account
Instant access to 1,000+ real slides from top companies like McKinsey, BCG, Goldman Sachs, Google and many more!
First Name
Last Name
Email
Password
I agree to all
Terms & Privacy Policy
Thank you! Your submission has been received!
Oops! Something went wrong while submitting the form.
Have an account?
Sign in
Saved Slides
Total No. of slides saved
0
↻ Refresh
✖ Clear all
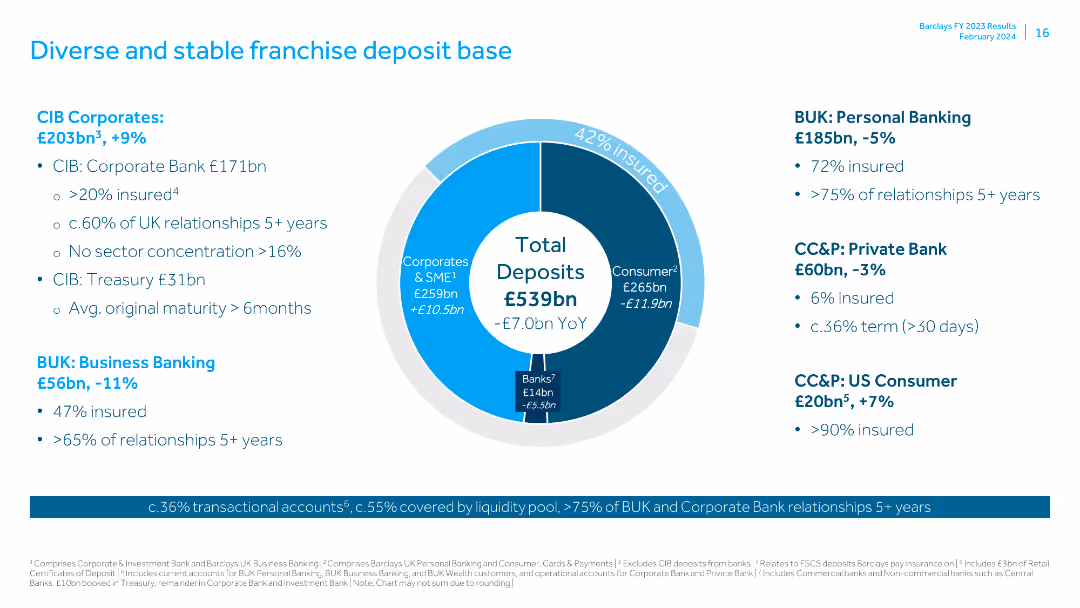
Contains a pie chart showing the composition of total deposits and text blocks for various deposit categories like CIB Corporates, BUK, and US Consumer.
Market Analysis and Trends
Financial Services
Provides an overview of the deposit base, detailing the composition and stability of various deposit categories across different banking segments.
franchise deposit, total deposits, CIB Corporates, BUK, US Consumer, market analysis, insured deposits, banking relationships, maturity, trends
false
Market Analysis and Trends
Financial Services
Mixed Chart
Barclays
Add to my slides
Remove from favorites
This slide features a central circular diagram with arrows and key components labeled around it. The diagram is flanked by two columns of textual content with highlighted subheaders.
Strategic Planning
Financial Services
A slide focused on the growth of a financial franchise supported by risk and resource management, illustrated by a central cycle diagram and flanking text explaining strategic elements.
franchise growth, risk management, resource management, strategy, Goldman Sachs, operational oversight, continuous improvement, culture, leverage, deposits
false
Strategic Planning
Financial Services
Linear Flow
Goldman Sachs
Add to my slides
Remove from favorites
Slide includes text content, a pie chart, and a circular diagram indicating rankings and statistics related to financial services, emphasizing the brand's market positioning.
Strategic Planning
Financial Services
Highlights the company's market positioning, strategic advantages, and customer engagement within the financial services sector. Useful in strategic planning and competitive analysis.
franchise value, market positioning, consumer banking, wealth management, customer engagement, strategic planning, competitive analysis
false
Strategic Planning
Financial Services
Single Chart
JP Morgan
Add to my slides
Remove from favorites
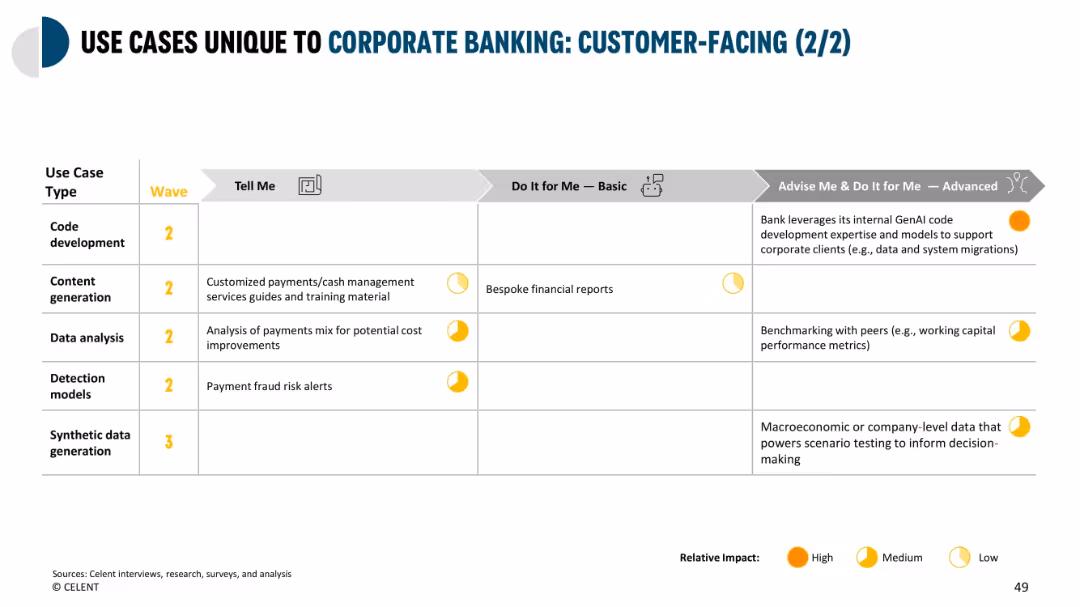
Continuation of the previous matrix; use cases mapped to impact levels across 5 AI use types; clear three-column structure
Product and Service Analysis
Financial Services
Explores AI-powered customer-facing tools in areas such as code development, content creation, fraud detection, data analysis, and macroeconomic scenario testing through synthetic data.
fraud alerts, data analysis, AI automation, GenAI, scenario modeling
false
Product and Service Analysis
Financial Services
Single Chart
Oliver Wyman
Add to my slides
Remove from favorites
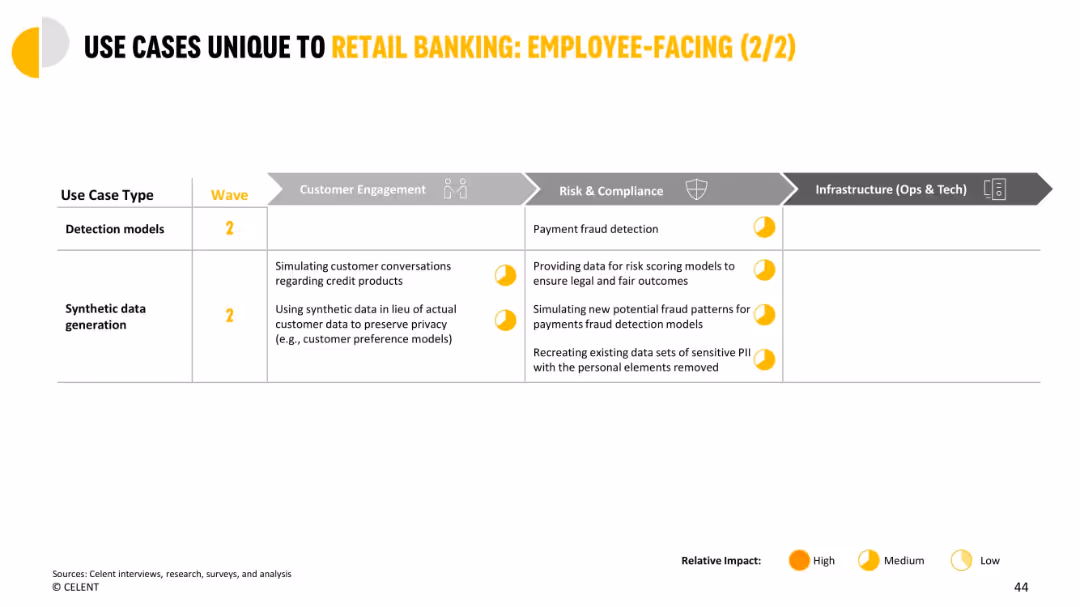
Table format highlighting use cases in detection and synthetic data across departments, with impact markers.
Risk Assessment and Management
Financial Services
Details how GenAI can enhance fraud detection and privacy protection through synthetic data. Covers the impact on customer engagement and compliance through better modeling and anonymized data use.
fraud detection, synthetic data, privacy, risk scoring, financial services, compliance
false
Risk Assessment and Management
Financial Services
Single Chart
Oliver Wyman
Add to my slides
Remove from favorites
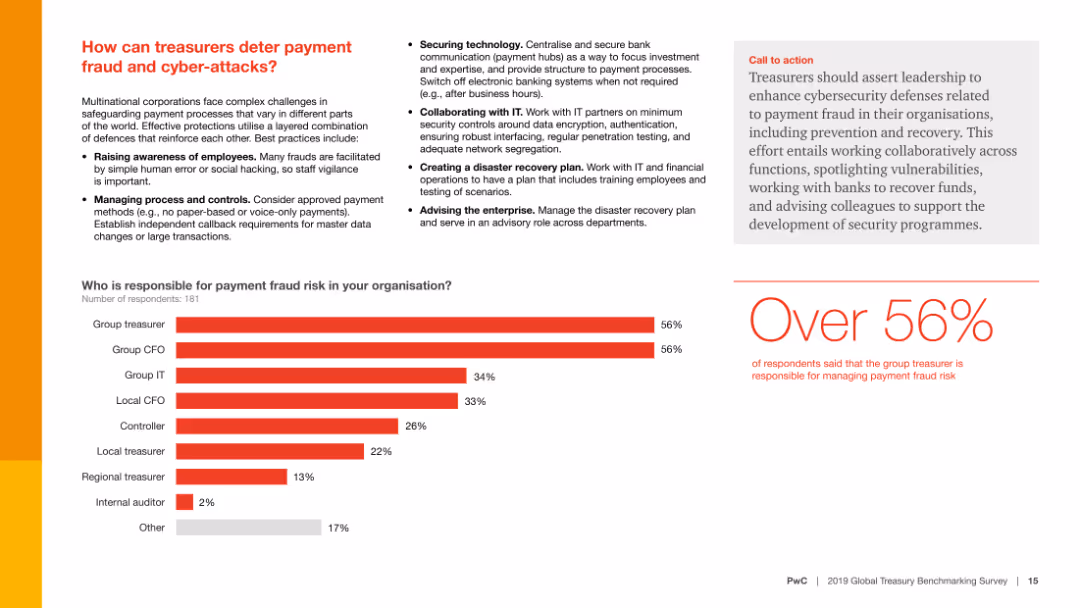
Contains text, a column chart, and a call-to-action section. The column chart shows who is responsible for managing payment fraud risk.
Risk Assessment and Management
Financial Services
This slide presents strategies for preventing payment fraud and cyber-attacks and identifies who within an organization is responsible for managing these risks.
Fraud prevention, cyber-attacks, risk management, survey, responsibility
false
Risk Assessment and Management
Financial Services
Mixed Chart
PwC/Strategy&
Add to my slides
Remove from favorites
A straightforward layout with three distinct sections, each with its own icon and corresponding data points, summarizing investments in cybersecurity and fraud prevention.
Operational Efficiency
Financial Services
Shows JPMorgan Chase & Co.'s investment in fraud prevention and the positive impact, likely for reassuring stakeholders about security measures.
fraud prevention, cybersecurity, JPMorgan, investment, client protection, detection
false
Operational Efficiency
Financial Services
Pillar
JP Morgan
Add to my slides
Remove from favorites
Slide with number 2, a bar graph showing fraudulent activity levels by country, an inset explaining the fraud index, and summary text highlighting key points.
Risk Assessment and Management
Professional Services
It addresses the issue of online fraud in SEA, quantifying the risk in different countries with a focus on Indonesia, Malaysia, and the Philippines. This data can guide risk management and trust-building strategies for businesses operating online in the region.
fraudulent activity, SEA, risk management, online fraud, Indonesia, Malaysia, Philippines
false
Risk Assessment and Management
Professional Services
Single Chart
Bain
Add to my slides
Remove from favorites
Depicts a series of blue column charts showing annual free cash flow over time, annotated with percentages and monetary goals.
Financial Performance
Consumer Goods
Illustrates the company's ability to generate substantial free cash flow, emphasizing improvements and future goals in financial management.
free cash flow, financial growth, goals, annual, cash management
false
Financial Performance
Consumer Goods
Single Chart
Barclays
Add to my slides
Remove from favorites
Column charts show historical free cash flow alongside annotations on financial strategies.
Financial Performance
Transportation & Logistics
Evaluates the company's financial resilience, focusing on adjusted free cash flow and liquidity over recent years.
free cash flow, financial resilience, cost management, liquidity, capital efficiency
false
Financial Performance
Transportation & Logistics
Mixed Chart
Deutsche Bank
Add to my slides
Remove from favorites
Includes a bar graph depicting changes in human freedom scores, alongside detailed text explanations and a shaded world map, highlighting regions and relevant statistical data.
Market Analysis and Trends
Government & Public Sector
Analyzes trends in global human freedom over a decade, discussing implications for future shifts in political and civil rights, providing a basis for discussions on policy and societal change.
freedom, global trends, policy, civil rights, political rights, data, future, analysis, implications
false
Market Analysis and Trends
Government & Public Sector
Mixed Chart
Roland Berger
Add to my slides
Remove from favorites
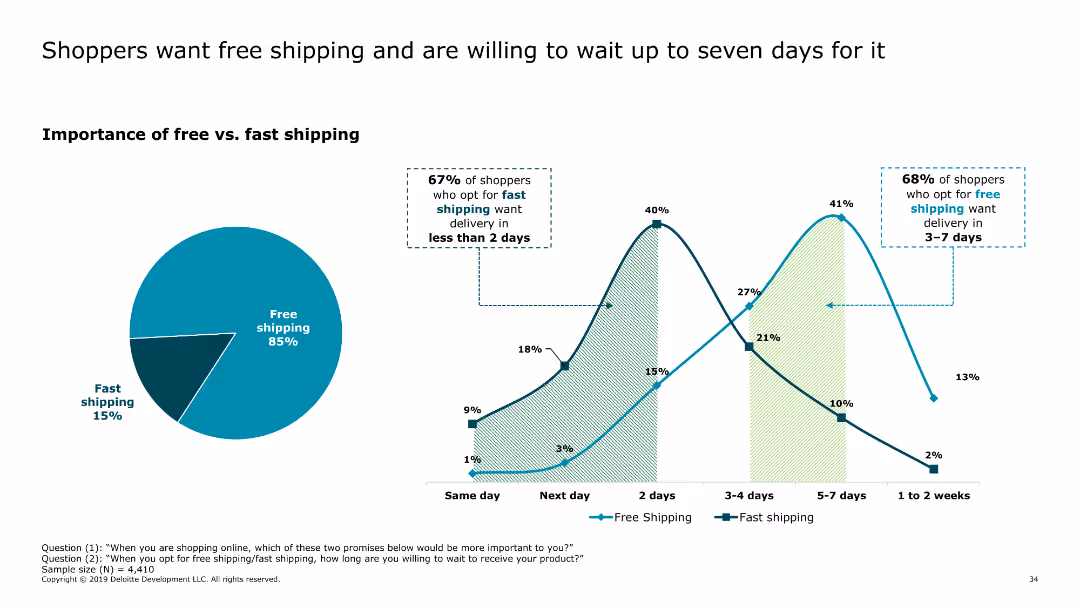
This slide includes a pie chart showing the importance of free versus fast shipping, along with a line chart illustrating delivery time preferences for free and fast shipping options.
Market Analysis and Trends
Retail & E-commerce
The slide highlights consumer preferences for free shipping over fast shipping, with many shoppers willing to wait up to seven days for free delivery. It provides insights into delivery expectations and preferences.
free shipping, delivery preferences, consumer behavior, online shopping, shipping options
false
Market Analysis and Trends
Retail & E-commerce
Multiple Chart
Deloitte
Add to my slides
Remove from favorites
A world map highlights various major free trade areas and their GDP, enhanced with additional data on populations and economic details. The map is annotated for clarity.
Strategic Planning
Financial Services
Explains the significance of free trade agreements worldwide, showing major economic zones and their economic outputs. Ideal for use in strategic business planning and understanding global trade agreements.
free trade, agreements, GDP, global, trade
false
Strategic Planning
Financial Services
Mixed Chart
Roland Berger
Add to my slides
Remove from favorites
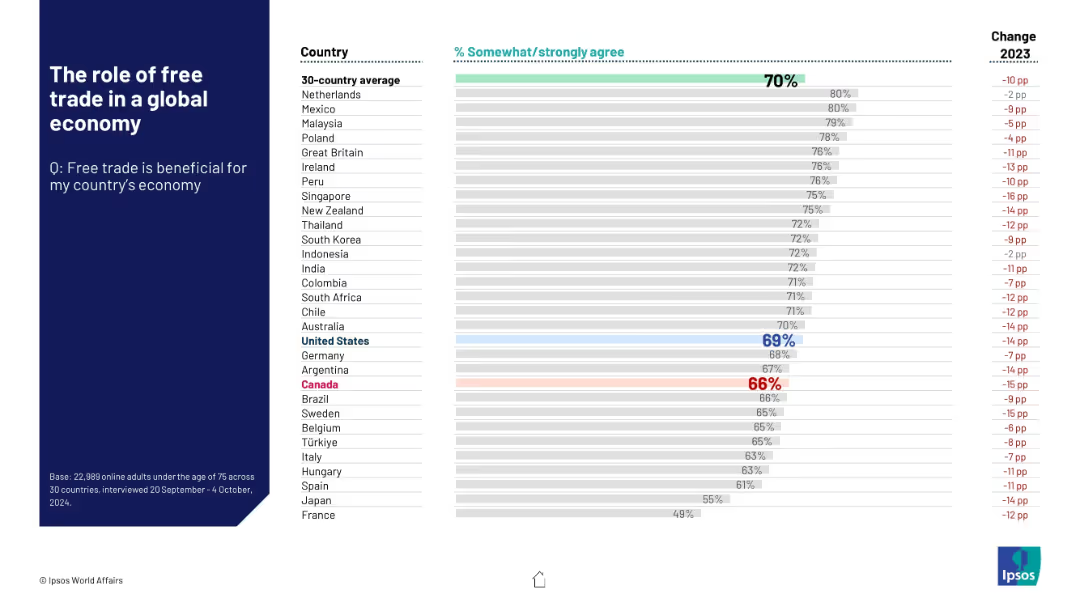
Horizontal bar chart showing country-level agreement on the benefits of free trade, with percent change from 2023.
Market Analysis and Trends
Government & Public Sector
This slide shows that while a global average of 70% supports free trade, support has declined in many countries since 2023. Countries are ordered by level of agreement, with the U.S. and Canada highlighted.
free trade, economy, global trade, policy, international relations
false
Market Analysis and Trends
Government & Public Sector
Mixed Chart
IPSOS
Add to my slides
Remove from favorites
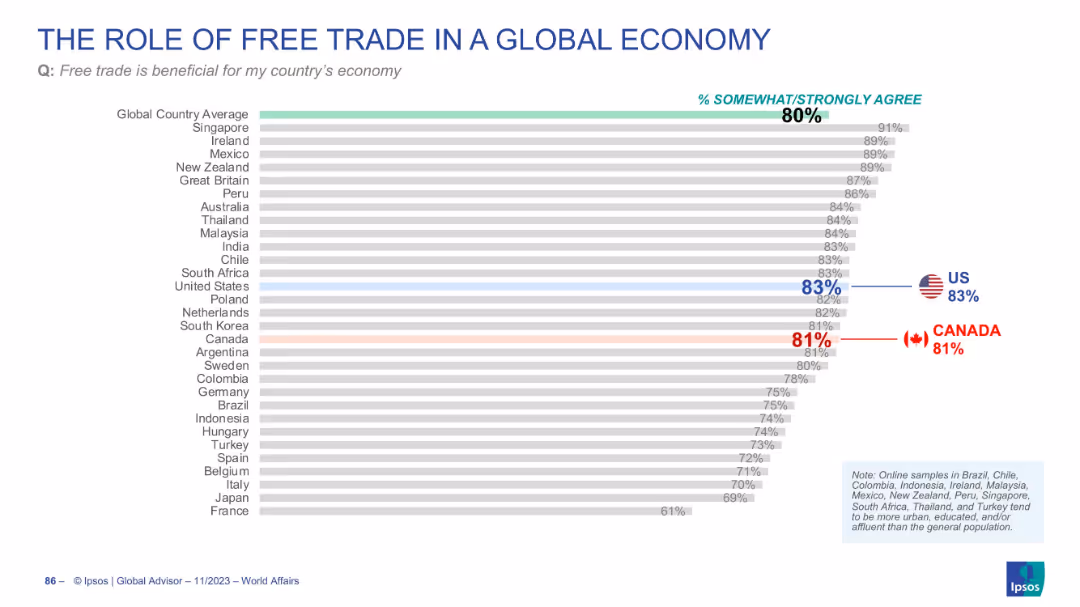
Horizontal bar chart showing agreement with the benefit of free trade by country
Market Analysis and Trends
Government & Public Sector
The chart demonstrates strong global support for free trade (80%). The US (83%) and Canada (81%) show slightly stronger than average belief in its economic benefits.
free trade, globalization, economy, international trade, public opinion
false
Market Analysis and Trends
Government & Public Sector
Single Chart
IPSOS
Add to my slides
Remove from favorites
Slide with multiple data visualizations including a line chart showing container freight rates and IMF Food Price Index, and two column charts comparing China export containerized freight index and Msla crude palm oil prices. Red and white colors dominate with text annotations explaining trends.
Market Analysis and Trends
Financial Services
This slide tracks trends in freight costs and commodity prices, emphasizing a potential stabilization or "levelling off" in these sectors after significant fluctuations. Useful for stakeholders in transportation and logistics as well as financial services to evaluate recent market dynamics.
freight rates, commodity prices, market trends, stabilization, transportation
false
Market Analysis and Trends
Financial Services
Multiple Chart
Deloitte
Add to my slides
Remove from favorites
Consists of multiple line and column charts analyzing the seasonal variations in dry bulk freight rates and the factors influencing these rates.
Market Analysis and Trends
Transportation & Logistics
Evaluates the seasonal fluctuations in dry bulk freight rates, identifying external influences like maintenance schedules and new vessel deliveries.
freight rates, dry bulk, market trends, seasonal variations, economic impact
false
Market Analysis and Trends
Transportation & Logistics
Multiple Chart
Deutsche Bank
Add to my slides
Remove from favorites
The slide features a stacked bar chart comparing domestic supply chain costs and freight costs by transport mode, with a cost estimate for the industry.
Financial Performance
Transportation & Logistics
It analyzes the distribution of supply chain costs in the cement industry, highlighting the significant contribution of freight and transportation modes.
Freight, supply chain, cement, costs, road, shipping, rail, transport, industry, analysis
false
Financial Performance
Transportation & Logistics
Single Chart
LEK
Add to my slides
Remove from favorites
Column charts display opinions on French-American relations and EU-US trade concerns with additional professional quotes.
Regulatory and Compliance
Government & Public Sector
Reviews concerns about French-American relations and potential impacts of a trade war with the US on the European Union, with industry expert insights.
French-American relations, EU, trade war, international relations, investment impact, Macron
false
Regulatory and Compliance
Government & Public Sector
Multiple Chart
Bain
Add to my slides
Remove from favorites
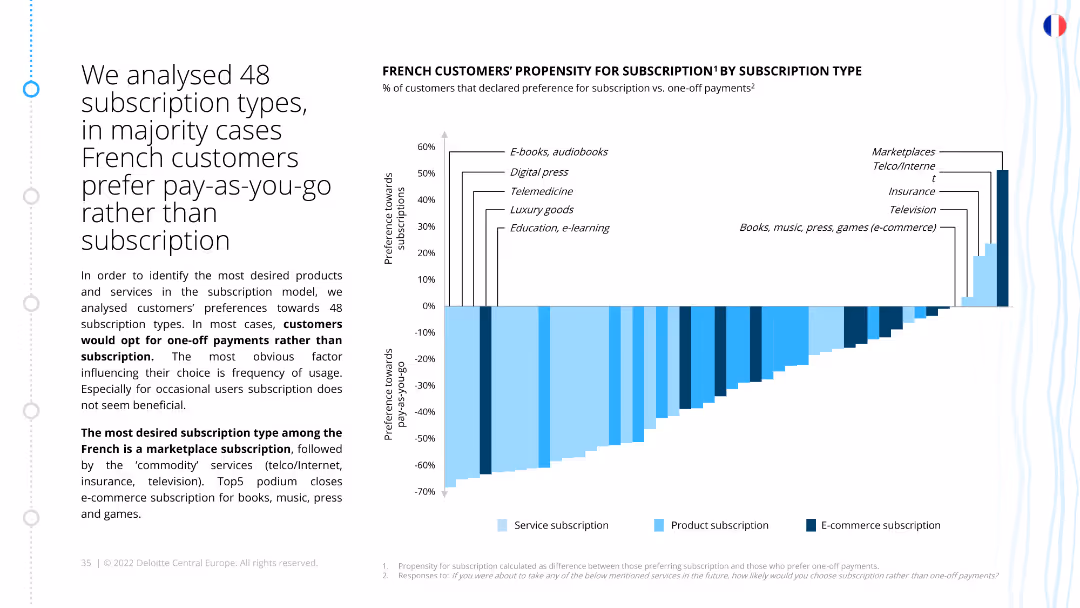
The slide includes a bar chart showing French customers' preferences for subscriptions versus one-off payments across various categories. It highlights significant differences in preferences.
Market Analysis and Trends
Consumer Goods
This slide analyzes French customers' preferences for subscription types, revealing a tendency towards one-off payments. It identifies the most desired subscription types and factors influencing these preferences.
French customers, subscription preferences, one-off payments, market analysis, ecommerce, retail
false
Market Analysis and Trends
Consumer Goods
Mixed Chart
Deloitte
Add to my slides
Remove from favorites
Features multiple small bar charts in red and green, visually comparing sentiments like burnout and job pride among French workers against other countries.
Organizational Structure and Change
Professional Services
Explores job satisfaction and employee sentiment among French workers compared to other countries, focusing on aspects like burnout and pride, valuable for HR and organizational planning.
French workers, job satisfaction, burnout, bar chart
false
Organizational Structure and Change
Professional Services
Multiple Chart
BCG
Add to my slides
Remove from favorites
Features a detailed chart analyzing the correlation between various job satisfaction elements and employee retention in France.
Organizational Structure and Change
Professional Services
Detailed analysis of how different factors of job satisfaction impact employee retention among French deskless workers, critical for HR management and policy-making.
French workers, job satisfaction, emotional needs, chart
false
Organizational Structure and Change
Professional Services
Multiple Chart
BCG
Add to my slides
Remove from favorites
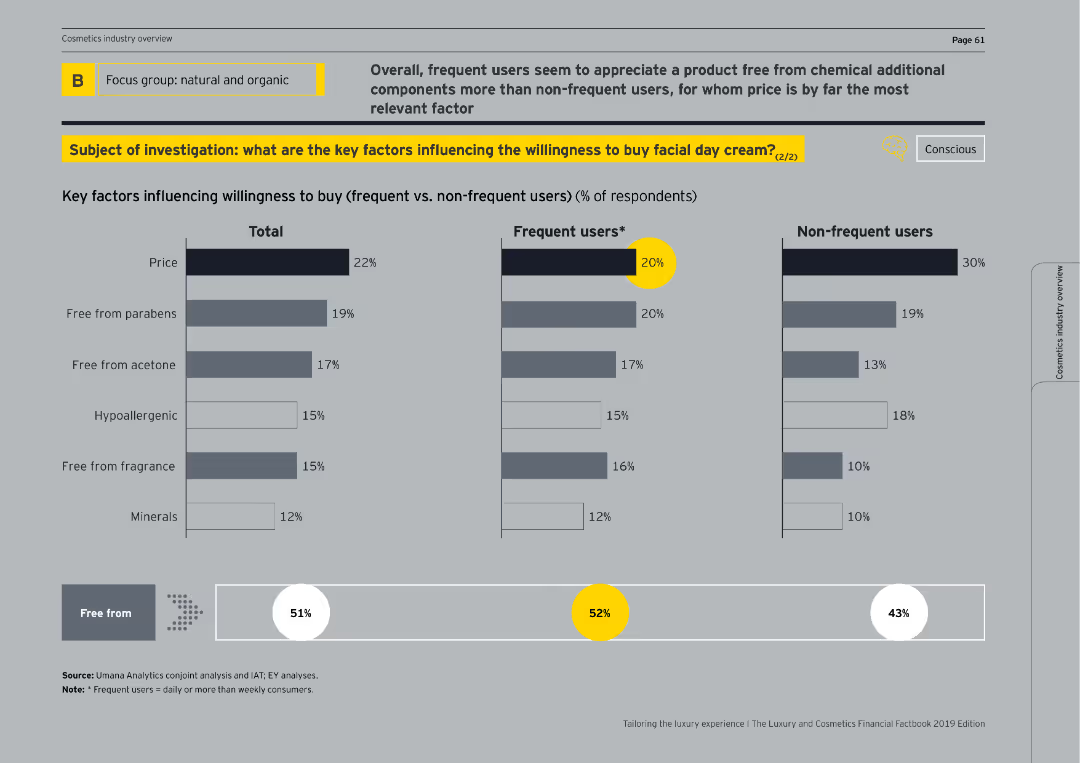
This slide has a bar chart comparing factors influencing the willingness to buy facial day cream among frequent and non-frequent users.
Customer and Market Segmentation
Consumer Goods
It explores how frequent and non-frequent users value different attributes in facial day creams, such as being free from parabens, acetone, fragrance, and hypoallergenic properties.
frequent users, non-frequent users, facial creams, buying factors
false
Customer and Market Segmentation
Consumer Goods
Multiple Chart
EY
Add to my slides
Remove from favorites
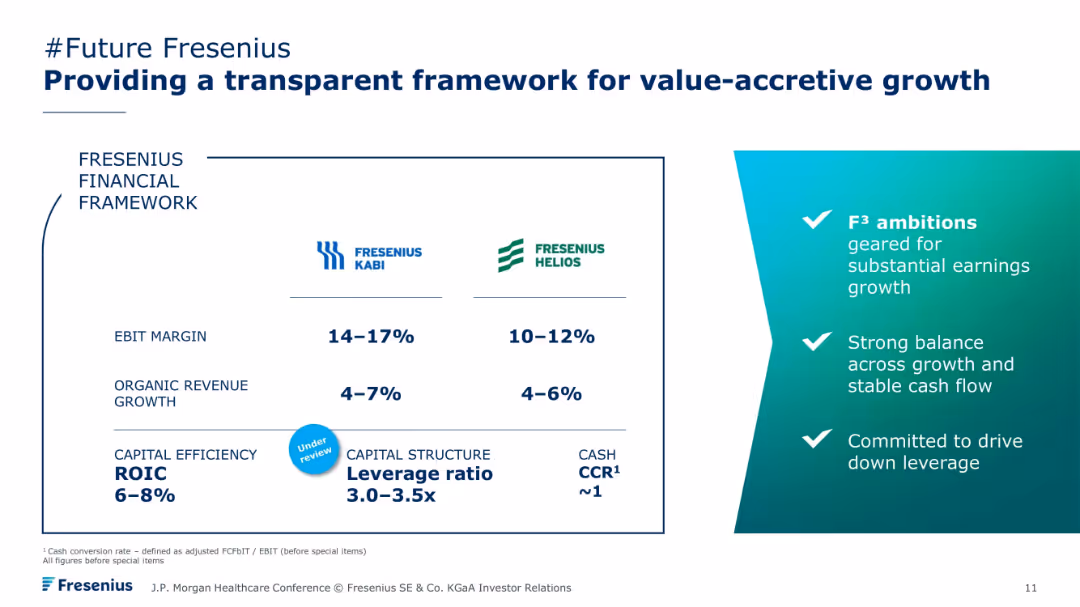
Two-column layout showing Fresenius Kabi and Helios metrics: EBIT margin, revenue growth, ROIC, and leverage ratio. Right column lists strategic goals. Teal and blue color palette with iconography.
Corporate Finance and Valuation
Healthcare & Pharmaceuticals
Presents Fresenius’ financial framework and targets for both Kabi and Helios divisions. It includes key performance metrics and outlines strategic ambitions: strong earnings growth, balance between growth and cash flow, and reduction of financial leverage.
Fresenius, EBIT margin, value-accretive growth, Helios, financial targets, capital structure
false
Corporate Finance and Valuation
Healthcare & Pharmaceuticals
Framework
JP Morgan
Add to my slides
Remove from favorites
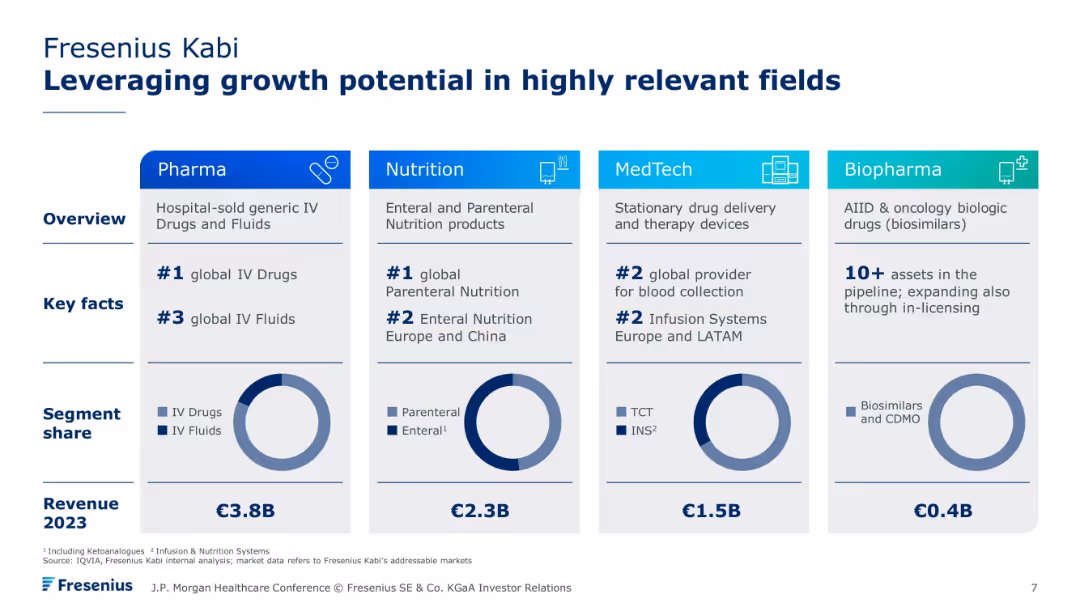
Four-column layout with product segment focus: Pharma, Nutrition, MedTech, and Biopharma. Includes key facts, market positions, and 2023 revenue per segment. Blue-themed design with pie charts.
Strategic Planning
Healthcare & Pharmaceuticals
Fresenius Kabi’s diversified portfolio across pharmaceuticals, nutrition, MedTech, and biosimilars is detailed, showing global leadership in key areas like IV drugs and parenteral nutrition. Each vertical is quantified with 2023 revenue and market ranking.
Fresenius Kabi, pharma segments, IV drugs, nutrition, MedTech, biosimilars, growth strategy
false
Strategic Planning
Healthcare & Pharmaceuticals
Single Chart
JP Morgan
Add to my slides
Remove from favorites
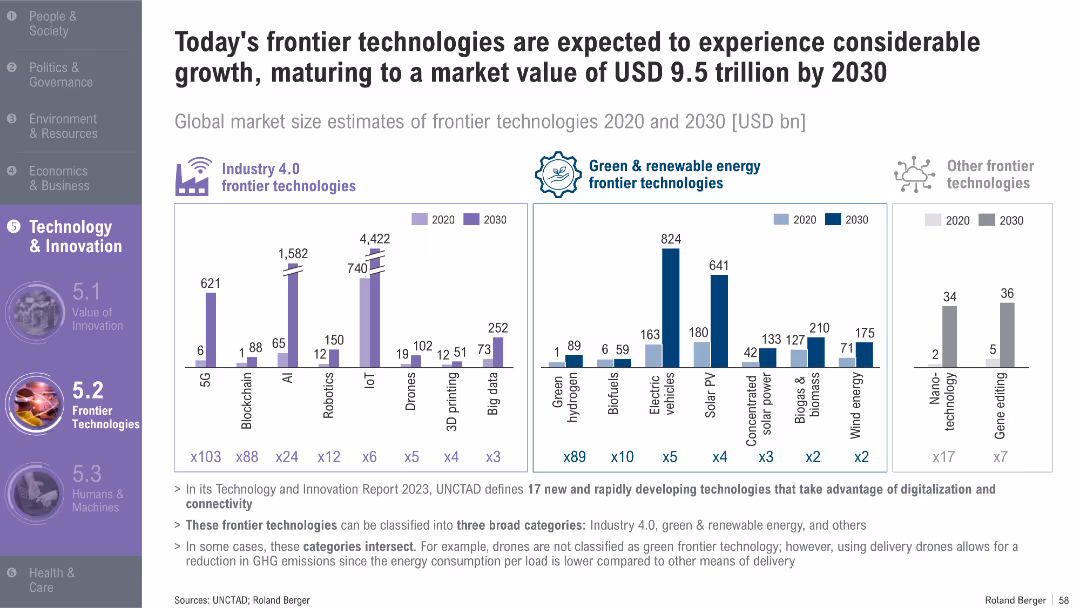
Bar charts compare 2020 vs. 2030 market sizes for Industry 4.0, green energy, and other technologies; explanatory text at bottom
Market Analysis and Trends
Artificial Intelligence
This slide estimates substantial growth in frontier technologies like AI, robotics, IoT, EVs, and renewables by 2030. It categorizes them into three areas and highlights their intersection and role in emissions reduction.
frontier tech, AI, robotics, electric vehicles, renewables, market growth, Industry 4.0, 2030, green energy
false
Market Analysis and Trends
Artificial Intelligence
Multiple Chart
Roland Berger
Add to my slides
Remove from favorites
Circular diagram categorizing various frontier technologies (e.g., AI, blockchain) and a bar chart projecting the global market size of these technologies from 2018 to 2025.
Technology and Digital Transformation
Technology & Software
This slide categorizes emerging frontier technologies and projects their market sizes up to 2025. It highlights the expected growth in technologies like AI, IoT, and blockchain, emphasizing their potential impact on future economic landscapes.
Frontier Technologies, Market Size, AI, IoT, Blockchain
false
Technology and Digital Transformation
Technology & Software
Mixed Chart
Roland Berger
Add to my slides
Remove from favorites
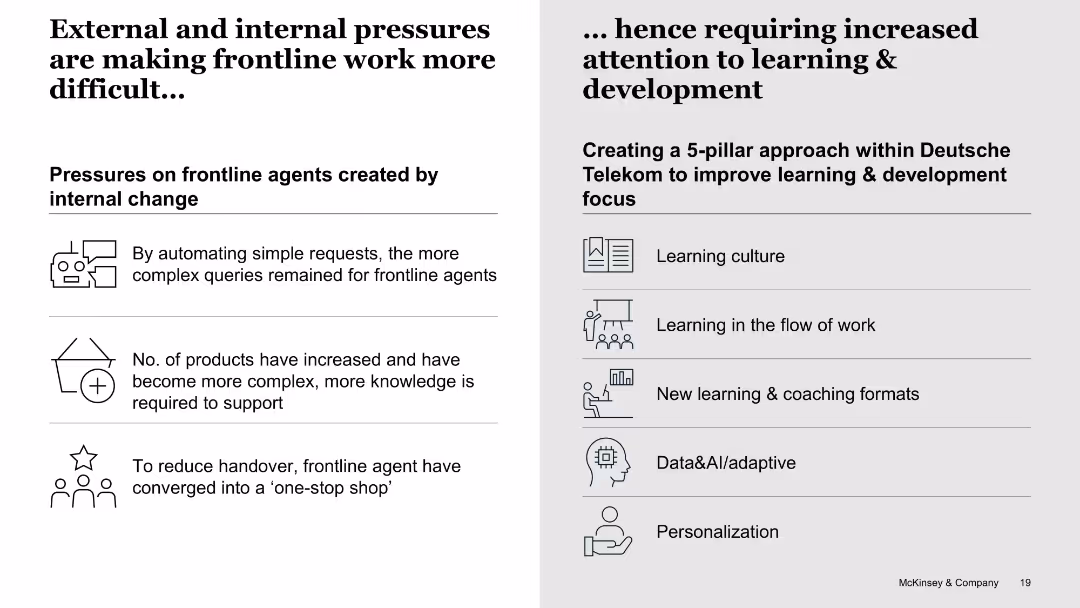
Split white slide with icons and bulleted lists on both sides, labeled as pressures vs. solutions
Human Resources and Talent Management
Telecommunications
The left side lists internal pressures on frontline agents, such as increased complexity and reduced handover. The right side introduces a five-pillar learning and development strategy from Deutsche Telekom to mitigate these challenges.
frontline agents, learning, complexity, pressure, telecom, L&D strategy, internal change
false
Human Resources and Talent Management
Telecommunications
Boxed
McKinsey
Add to my slides
Remove from favorites
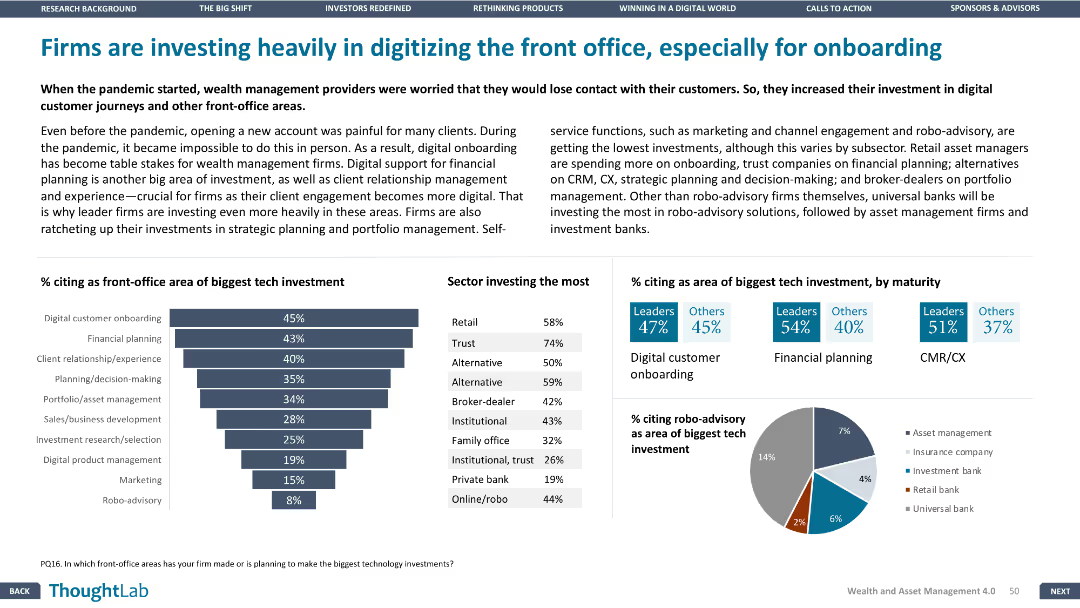
This slide includes a column chart and bar chart, along with a detailed table. The layout is dense, focusing on front-office tech investments and sectors investing the most.
Technology and Digital Transformation
Financial Services
The slide highlights the investment by firms in digitizing front-office operations, especially for digital onboarding, with data on the biggest tech investments and sectors leading these investments.
Front office, digital onboarding, tech investments, financial planning, CX
false
Technology and Digital Transformation
Financial Services
Multiple Chart
Deloitte
Add to my slides
Remove from favorites
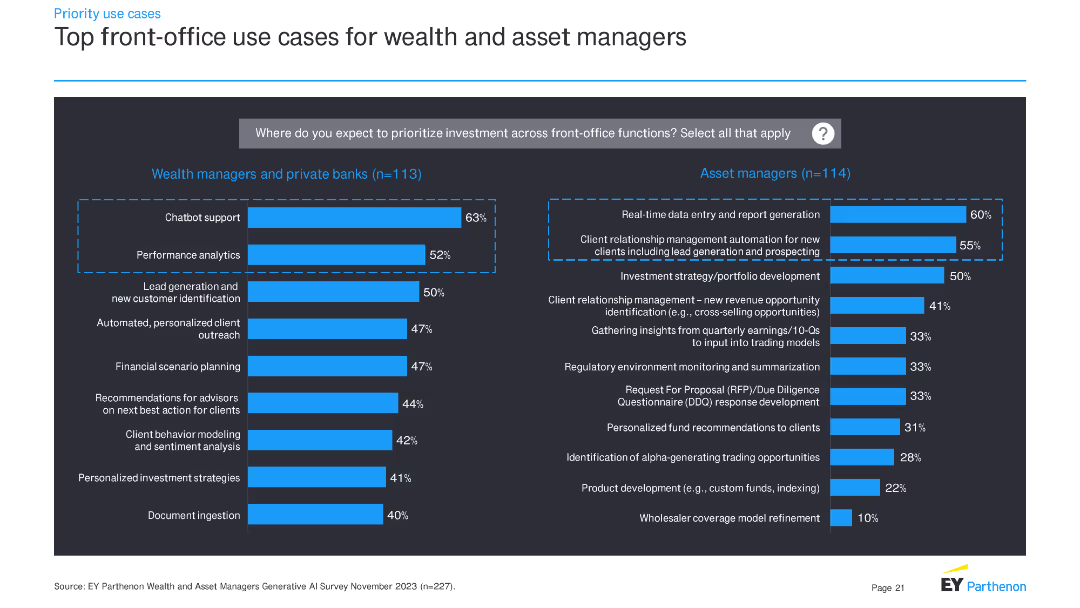
The slide features two sets of horizontal bar charts: one for wealth managers and private banks, and another for asset managers. These charts illustrate the top front-office use cases for investment priorities.
Operational Efficiency
Financial Services
This slide outlines priority front-office use cases for wealth managers, private banks, and asset managers, highlighting the key areas where investment is expected to focus in the near future.
front-office, investment, use cases, financial services, wealth managers, asset managers, bar charts, priorities
false
Operational Efficiency
Financial Services
Multiple Chart
EY
Add to my slides
Remove from favorites
Bar chart comparing top front-office use cases for retail and commercial banks.
Customer and Market Segmentation
Financial Services
Lists top front-office use cases prioritized by retail and commercial banks, focusing on customer segmentation and automation.
front-office, retail, commercial, banks, use cases
false
Customer and Market Segmentation
Financial Services
Multiple Chart
EY
Add to my slides
Remove from favorites
Left: stacked column chart showing front-office use cases. Right: pie chart of prioritization of front-office applications.
Market Analysis and Trends
Financial Services
Indicates majority of viable use cases are front-office focused, with many banks awaiting further testing before prioritizing.
front-office, use cases, prioritization, GenAI, testing
false
Market Analysis and Trends
Financial Services
Multiple Chart
EY
Add to my slides
Remove from favorites
A bar graph depicting the global top ten vehicles sold between 2010-2019 with a side image of the F-Series.
Client Case Studies
Transportation & Logistics
Asserts the F-Series as the top-selling pickup globally over the past ten years.
F-Series, best-selling, pickup truck, global market
true
Client Case Studies
Transportation & Logistics
Single Chart
BCG
Add to my slides
Remove from favorites
A bar graph compares the F-Series' revenue with other major consumer products and sports leagues.
Client Case Studies
Transportation & Logistics
Demonstrates the F-Series' revenue size in comparison to well-known products and major sports leagues' combined revenue.
F-Series, consumer products, sports leagues, revenue comparison
false
Client Case Studies
Transportation & Logistics
Single Chart
BCG
Add to my slides
Remove from favorites
Slide shows a breakdown of the F-Series' contribution to US GDP through production and multiplier effects with a graph.
Financial Performance
Transportation & Logistics
Explains the significant contribution of the Ford F-Series to the US GDP, taking into account direct sales, suppliers, dealers, and the broader community impact.
F-Series, GDP contribution, manufacturing, economic impact, multiplier effects, dealers, community, Ford
false
Financial Performance
Transportation & Logistics
Single Chart
BCG
Add to my slides
Remove from favorites
A bar graph comparing the top ten vehicles sold in the US from 2010-2019.
Client Case Studies
Transportation & Logistics
Communicates the F-Series' position as the highest-selling vehicle in the US over the past decade.
F-Series, highest-selling, vehicle, US market, decade
false
Client Case Studies
Transportation & Logistics
Single Chart
BCG
Add to my slides
Remove from favorites
A bar graph with text on the left showing the F-Series' market share among vehicles on the road.
Client Case Studies
Transportation & Logistics
States that the F-Series trucks make up a significant percentage of vehicles on the road.
F-Series, popularity, vehicles, market share, US roads
false
Client Case Studies
Transportation & Logistics
Single Chart
BCG
Add to my slides
Remove from favorites
A bar graph highlights the F-Series' revenue in comparison to other notable companies.
Financial Performance
Transportation & Logistics
Shows the F-Series' revenue outperforming that of many major companies in 2019.
F-Series, revenue, companies, financial performance
false
Financial Performance
Transportation & Logistics
Single Chart
BCG
Add to my slides
Remove from favorites
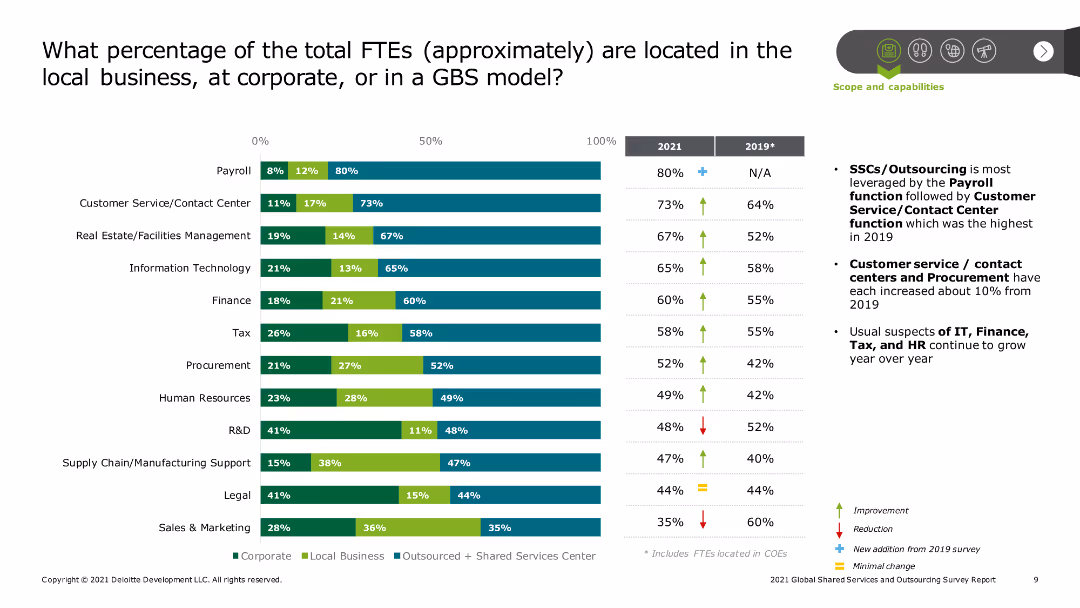
The slide has a column chart comparing the percentages of FTEs located in different organizational models (corporate, local business, outsourced/SSC) across various functions like payroll, customer service, IT, finance, and HR for the years 2021 and 2019.
Human Resources and Talent Management
Professional Services
The slide provides a detailed breakdown of the distribution of full-time employees (FTEs) across corporate, local business, and GBS models in 2021 compared to 2019. It highlights trends in workforce allocation, emphasizing shifts towards SSCs and outsourcing in various functions.
FTE distribution, workforce analysis, corporate vs. local, outsourcing, Shared Services Centers, payroll, customer service, IT, finance, HR
false
Human Resources and Talent Management
Professional Services
Mixed Chart
Deloitte
Add to my slides
Remove from favorites
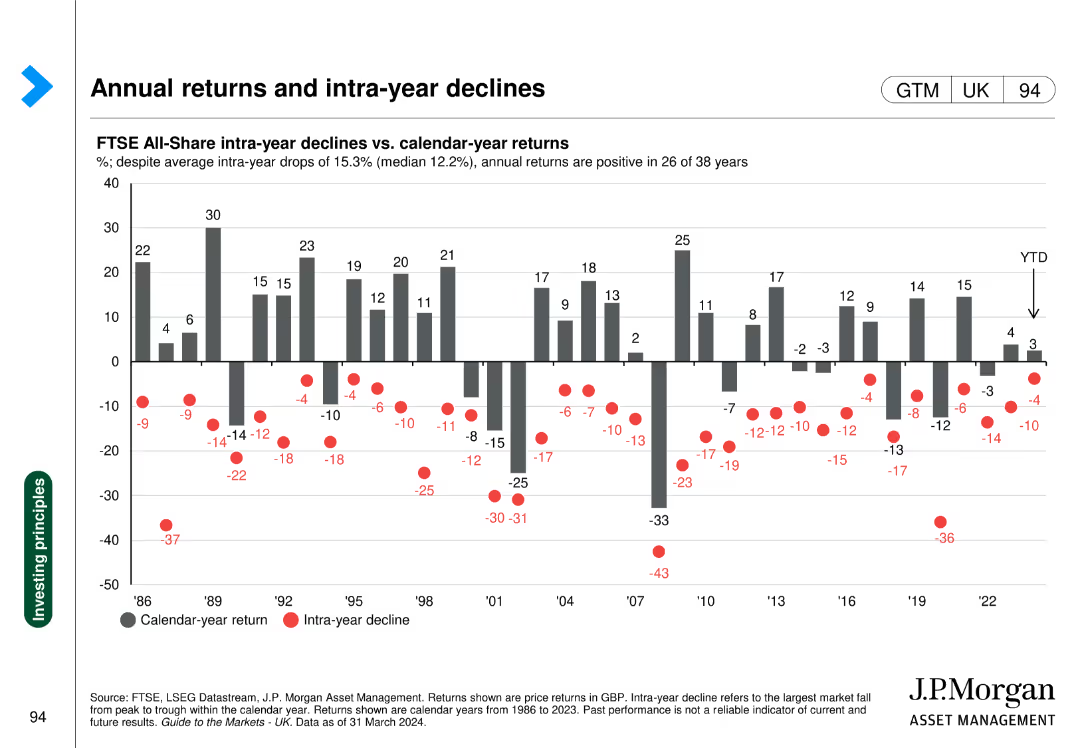
The slide features a column chart with annual returns and a scatter plot of intra-year declines represented as red dots for FTSE All-Share from 1986-2023.
Investment Analysis
Financial Services
This slide compares FTSE All-Share annual returns against intra-year declines, showing the volatility and overall performance trends over multiple years.
FTSE, annual returns, intra-year declines, volatility, investment analysis
false
Investment Analysis
Financial Services
Single Chart
JP Morgan
Add to my slides
Remove from favorites
The slide is organized into sections detailing fuel cell R&D funding, key improvement levers, areas improved, and benefits/challenges. Includes a bar chart on R&D funding breakdown.
Risk Assessment and Management
Energy & Utilities
Discusses the challenges in fuel cell technology related to cost and durability, and outlines key improvement areas with corresponding benefits and challenges.
Fuel cells, cost reduction, durability, performance, challenges, R&D funding, improvement levers, benefits
false
Risk Assessment and Management
Energy & Utilities
Mixed Chart
Kearney
Add to my slides
Remove from favorites
This Timeline or Roadmap Slide outlines the expansion plan of 'Symbio' with a timeline from 2014 to 2030. It includes milestone markers, text descriptions, and a flow diagram that effectively communicates the progressive development of the company. The design employs a mix of icons, images, and a linear path to guide viewers through the timeline, making complex information easily digestible.
Strategic Planning
Energy & Utilities
Detailing the strategic development of 'Symbio' towards global leadership in commercial vehicles, this slide maps key milestones, including investments, partnerships, and future expansion plans. It highlights Michelin’s role and strategy in fuel cell development for commercial vehicles, emphasizing their commitment to sustainable energy solutions and industrial innovation.
fuel cells, expansion, global leadership, commercial vehicles, sustainability, partnerships, timeline, Symbio, Michelin
false
Strategic Planning
Energy & Utilities
Linear Flow
Morgan Stanley
Add to my slides
Remove from favorites
The slide features a table comparing various fuel cell technologies. The table includes parameters like temperature, stack size, electrical performance, applications, advantages, and challenges.
Technology and Digital Transformation
Energy & Utilities
The slide compares different types of fuel cells, highlighting the potential of Polymer Electrolyte Membrane (PEM) technology in terms of efficiency, application range, and improvement potential.
Fuel cells, PEM, efficiency, comparison, advantages, challenges, technology, applications, temperature, performance
false
Technology and Digital Transformation
Energy & Utilities
Table
Kearney
Add to my slides
Remove from favorites
The slide contains a column chart showing technical targets and system cost reduction projections for fuel cell power systems over several years. Additional data on efficiency and power density.
Market Analysis and Trends
Energy & Utilities
Focuses on the advancements in fuel cell research aimed at improving efficiency, durability, and cost-effectiveness. Displays trends and projections in technical performance and cost reduction.
Fuel cells, research, efficiency, durability, cost reduction, projections, targets, power systems, data
false
Market Analysis and Trends
Energy & Utilities
Mixed Chart
Kearney
Add to my slides
Remove from favorites
The slide presents multiple data visualizations including column charts and data boxes to depict the role of fuel generators in GHG emissions, with clear segmentation of data.
Regulatory and Compliance
Energy & Utilities
Discusses the disproportionate impact of fuel generators on Nigeria's GHG emissions, focusing on the residential and industrial sectors' contributions.
fuel generators, GHG emissions, energy consumption, Nigeria, industrial impact
false
Regulatory and Compliance
Energy & Utilities
Multiple Chart
BCG
Add to my slides
Remove from favorites
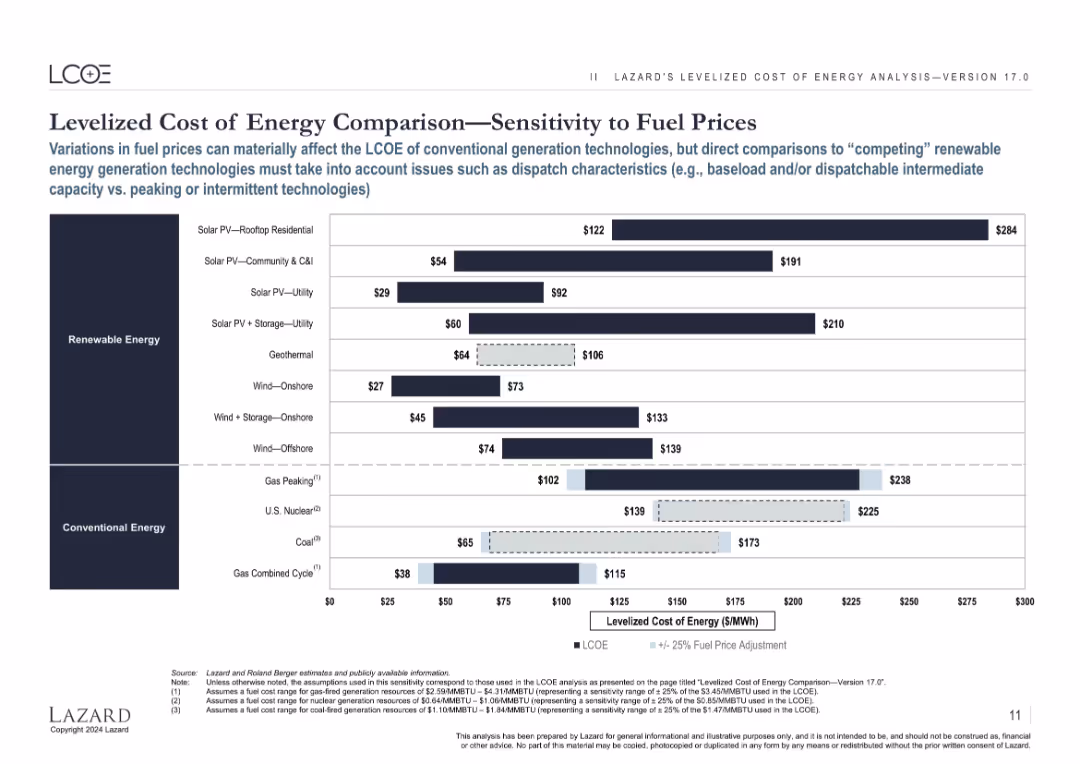
Horizontal bar chart with light overlays showing how 25% fuel price changes affect LCOE of conventional sources; renewables remain stable.
Risk Assessment and Management
Energy & Utilities
Analyzes how conventional energy sources’ LCOEs are sensitive to fuel price volatility, while renewable energy sources remain stable, making them less risky long-term investments.
fuel price, LCOE, volatility, gas, coal, nuclear, renewables, sensitivity, risk
false
Risk Assessment and Management
Energy & Utilities
Single Chart
Roland Berger
Add to my slides
Remove from favorites
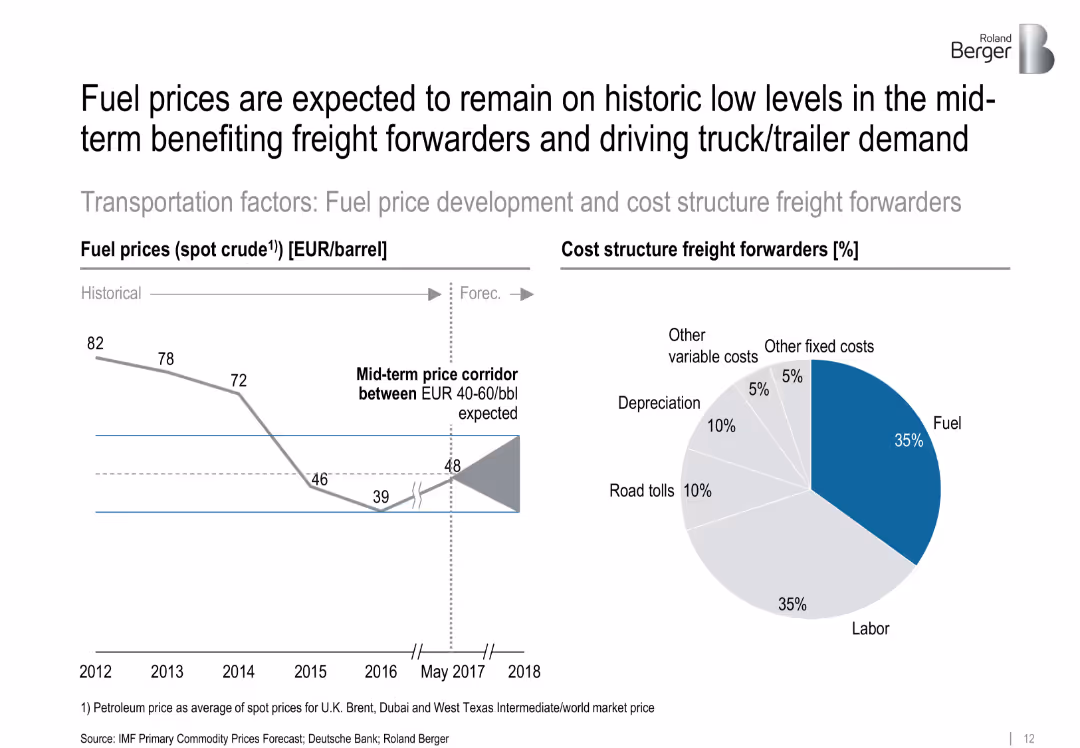
Split chart: left shows historical oil prices with a forecast corridor; right shows pie chart of freight forwarder cost structure. Minimalist style with strong visual cues.
Operational Efficiency
Energy & Utilities
The slide forecasts oil prices staying between €40–60/bbl, benefitting freight forwarders. It also shows a cost breakdown, where fuel and labor make up the majority of expenses, driving demand for efficient freight solutions.
['fuel prices', 'freight forwarding', 'cost structure', 'oil forecast', 'energy costs', 'logistics', 'operational cost']
false
Operational Efficiency
Energy & Utilities
Multiple Chart
Roland Berger
Add to my slides
Remove from favorites
The slide features a column chart showcasing growth, two pie charts, and a pictogram of a bank. It has a moderate amount of text and visual elements like icons and a three-color scheme.
Strategic Planning
Financial Services
This slide highlights the benefits of a full-service offering within a branch ecosystem, comparing advisor hiring and client acquisition with growth metrics. The slide is used to illustrate strategic growth and the impact of integrated services on client acquisition and advisor performance.
Full-service, Client acquisition, Advisor hiring, Growth, Branch ecosystem
false
Strategic Planning
Financial Services
Multiple Chart
JP Morgan
Add to my slides
Remove from favorites
The slide contains multiple column charts showing share and size of wallet, net revenues, and financial performance improvements over the years.
Financial Performance
Financial Services
This slide presents the performance results of Credit Suisse's full-service model in Switzerland, highlighting improvements in share and wallet size and net revenues.
Full service model, financial performance, share of wallet, net revenues, Switzerland
false
Financial Performance
Financial Services
Multiple Chart
Credit Suisse
Add to my slides
Remove from favorites
The slide features a bar chart showing the market value of the global full-service restaurant market by the top countries in 2022. Flags represent each country, with Italy highlighted in yellow.
Market Analysis and Trends
Hospitality & Tourism
This slide shows the market value distribution of full-service restaurants among the top 10 countries, emphasizing Italy's significant contribution as the leading European country in this sector.
Full service restaurants, market value, top countries, Italy, 2022
false
Market Analysis and Trends
Hospitality & Tourism
Mixed Chart
Deloitte
Add to my slides
Remove from favorites
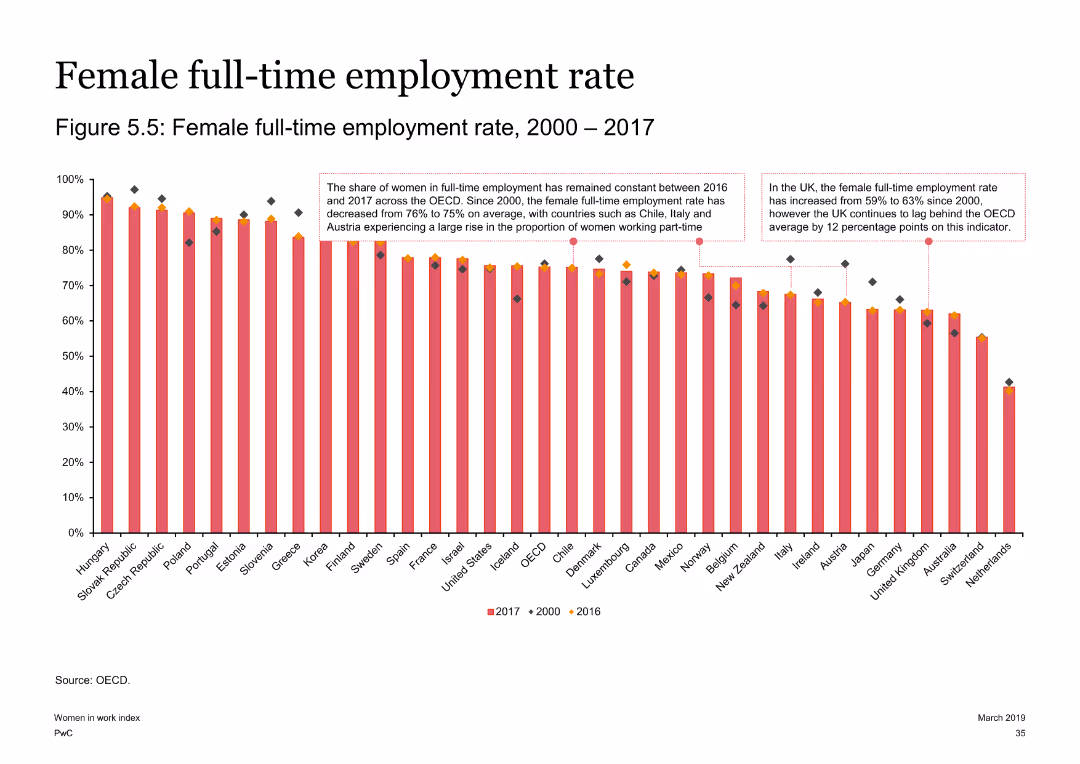
The slide contains a column chart depicting female full-time employment rates from 2000 to 2017 across multiple countries. Key observations for the OECD, UK, and Austria are highlighted with text boxes.
Risk Assessment and Management
Government & Public Sector
This slide presents the full-time employment rates for women over a 17-year period, noting the constancy in some regions and significant changes in others, such as the UK and Austria.
Full-time employment, female, OECD, UK, Austria, employment trends
false
Risk Assessment and Management
Government & Public Sector
Single Chart
PwC/Strategy&
Add to my slides
Remove from favorites
Slide includes a bar chart detailing the functions performed within shared service centers across various departments.
Strategic Planning
Professional Services
Highlights the diverse functions of shared service centers, emphasizing the increasing role of non-financial functions such as IT and HR, important for strategic resource allocation.
functions, shared services, strategic, resource allocation, non-financial, IT, HR
false
Strategic Planning
Professional Services
Mixed Chart
Deloitte
Add to my slides
Remove from favorites
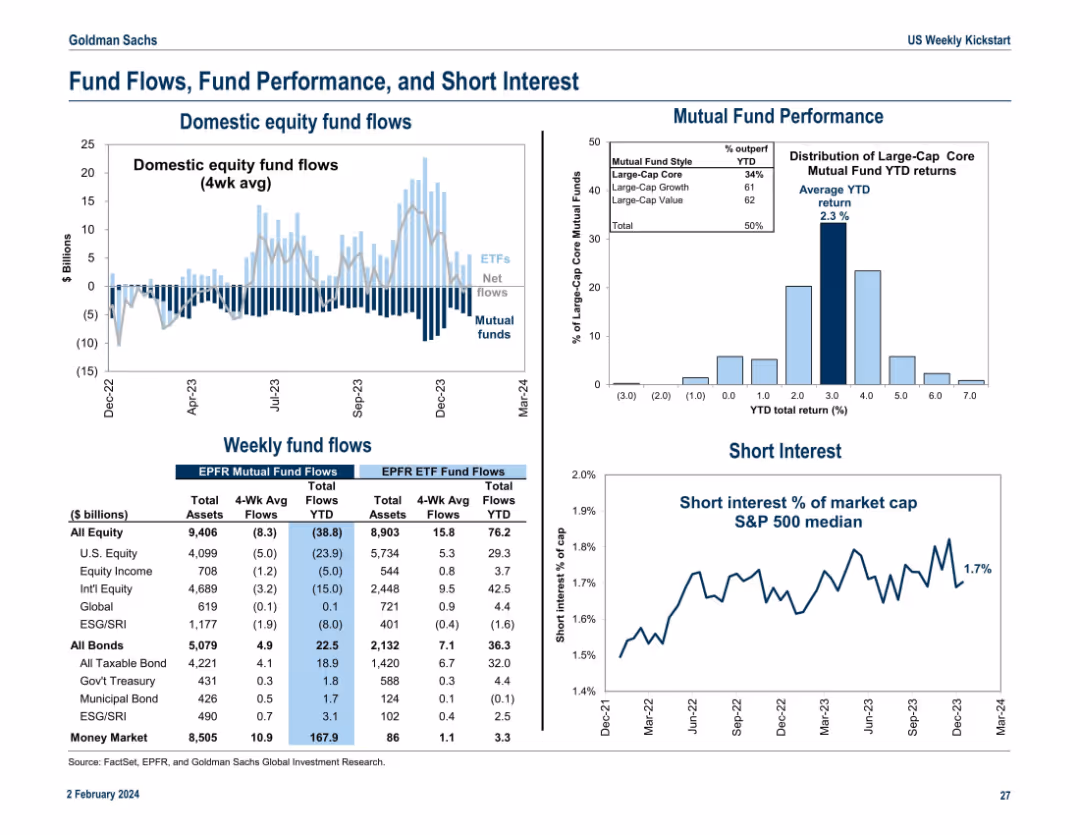
Divided into five segments: bar charts, fund performance histogram, line chart on short interest, and tables with flow data. Dense but organized presentation of capital movement trends.
Performance Metrics and KPIs
Financial Services
This slide summarizes current trends in equity and bond fund flows, mutual fund returns, and short interest levels. It tracks investor positioning and sentiment across asset classes with weekly and YTD data, along with S&P 500 short interest as a percentage of market cap.
fund flows, mutual funds, short interest, equity flows, ETF, performance
false
Performance Metrics and KPIs
Financial Services
Multiple Chart
Goldman Sachs
Add to my slides
Remove from favorites
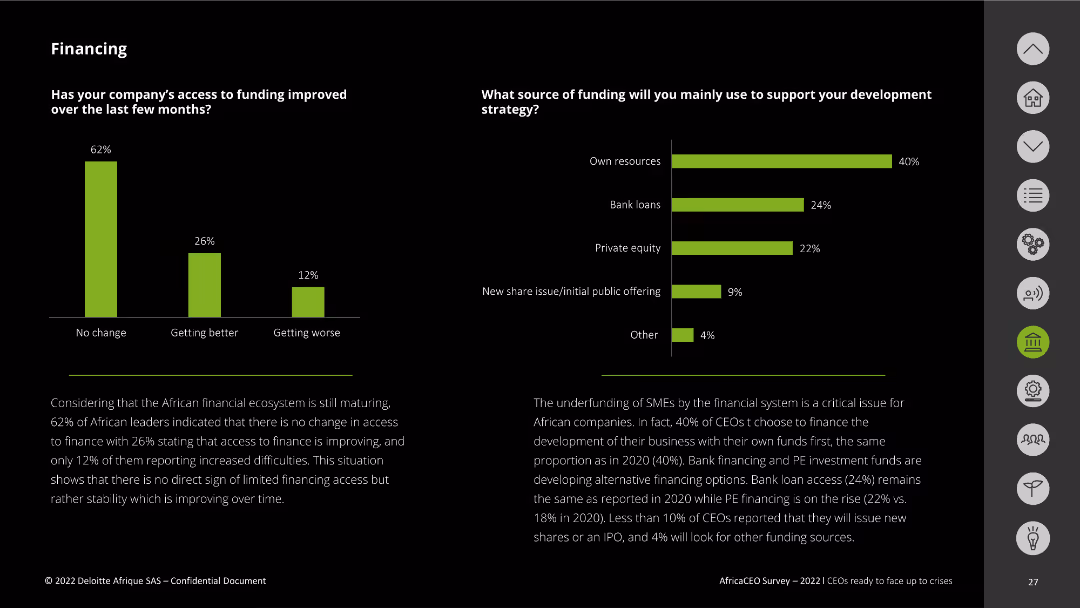
The slide includes two column charts. The first chart shows the change in access to funding, and the second chart highlights the sources of funding for development strategy. The charts are color-coded with a legend for clarity.
Financial Performance
Financial Services
This slide analyzes the improvement in companies' access to funding over the last few months and identifies the primary sources of funding for development strategies, including own resources, bank loans, and private equity.
funding, access, sources, development strategy, financial improvement
false
Financial Performance
Financial Services
Multiple Chart
Deloitte
Add to my slides
Remove from favorites
Features bar charts detailing the challenges automotive companies face in securing funding for digital transformation, accompanied by a list of reasons for funding refusals.
Financial Performance
Transportation & Logistics
Analyzes the difficulties automotive companies encounter when seeking board approval for digital projects, including common reasons for refusal and the extent of these challenges.
funding, automotive, digital transformation, board approval, investment challenges
false
Financial Performance
Transportation & Logistics
Mixed Chart
Accenture
Add to my slides
Remove from favorites
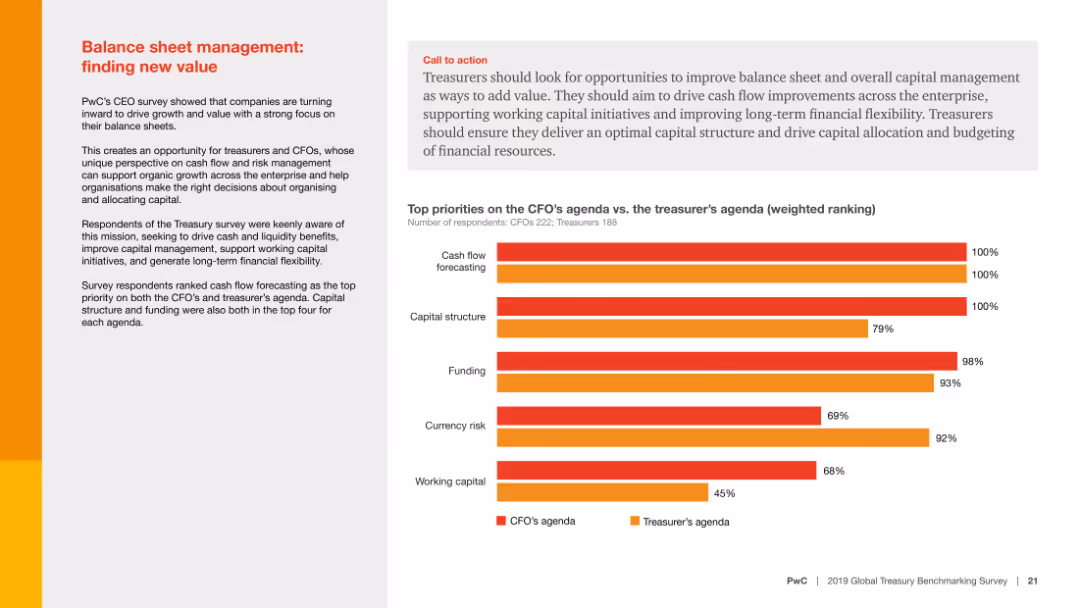
A column chart shows criteria for selecting banking partners. The text highlights the importance of long-term funding in banking relationships.
Investment Analysis
Financial Services
Emphasizes the need for long-term funding when choosing banking partners and provides criteria organizations consider important when selecting these partners.
Funding, banking, relationships, criteria, selection
false
Investment Analysis
Financial Services
Mixed Chart
PwC/Strategy&
Add to my slides
Remove from favorites
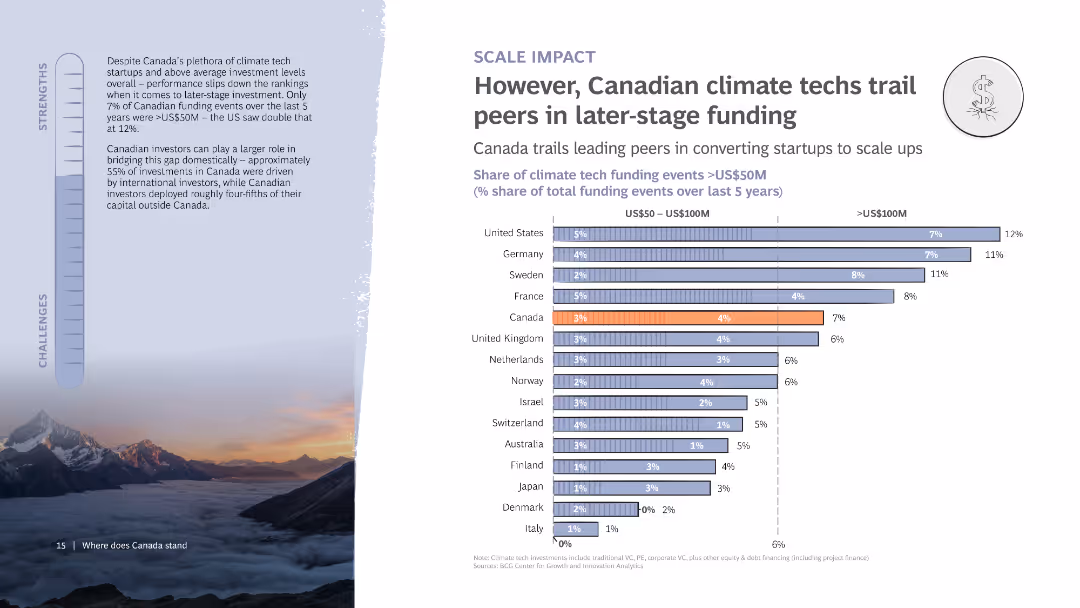
The slide shows a column chart comparing the share of climate tech funding events over $50M in various countries. It features text on the left discussing the challenges Canadian startups face in securing later-stage funding.
Investment Analysis
Financial Services
Examines Canada’s challenges in securing late-stage funding for climate tech startups, comparing funding events in other countries and discussing the implications for Canadian startups.
Funding, Climate tech, Canada, Investment, Chart
false
Investment Analysis
Financial Services
Mixed Chart
BCG
Add to my slides
Remove from favorites
Bar chart showing expected changes in digital transformation funding, highlighting sectors like Consumer Goods and Tech. A quote from a CIO emphasizes investment scrutiny.
Financial Performance
Technology & Software
Discusses anticipated changes in funding for digital transformation across different sectors post-COVID-19, emphasizing the need for careful investment and clear business cases.
funding, digital transformation, post-COVID, investment scrutiny, sectors
false
Financial Performance
Technology & Software
Mixed Chart
BCG
Add to my slides
Remove from favorites
Column chart showing average amount raised by startups in various industries in 2022, broken down by women-only and men-only teams.
Market Analysis and Trends
Financial Services
The slide highlights that even in industries where women predominantly found startups, they raise significantly less funding compared to men.
funding disparity, industry, women startups, 2022
false
Market Analysis and Trends
Financial Services
Single Chart
BCG
Add to my slides
Remove from favorites
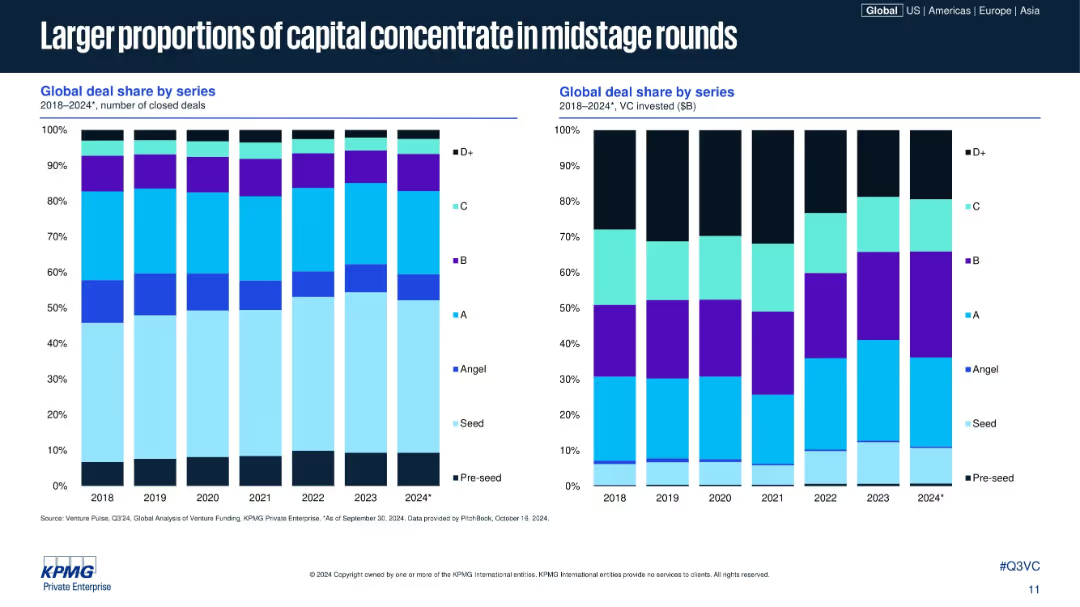
Two vertical stacked bar charts (deal share & VC invested share) by funding series, years 2018–2024; labeled with clear color legend; same white background and color palette.
Market Analysis and Trends
Financial Services
The slide compares global venture capital deal share and investment volume share by funding round, showing mid-stage rounds (Series B & C) have attracted a growing share of capital, both in volume and deal frequency. Early-stage rounds are declining proportionally.
funding distribution, midstage capital, VC investment, deal share, B round, C round, venture trends, capital allocation, PitchBook
false
Market Analysis and Trends
Financial Services
Multiple Chart
KPMG
Add to my slides
Remove from favorites
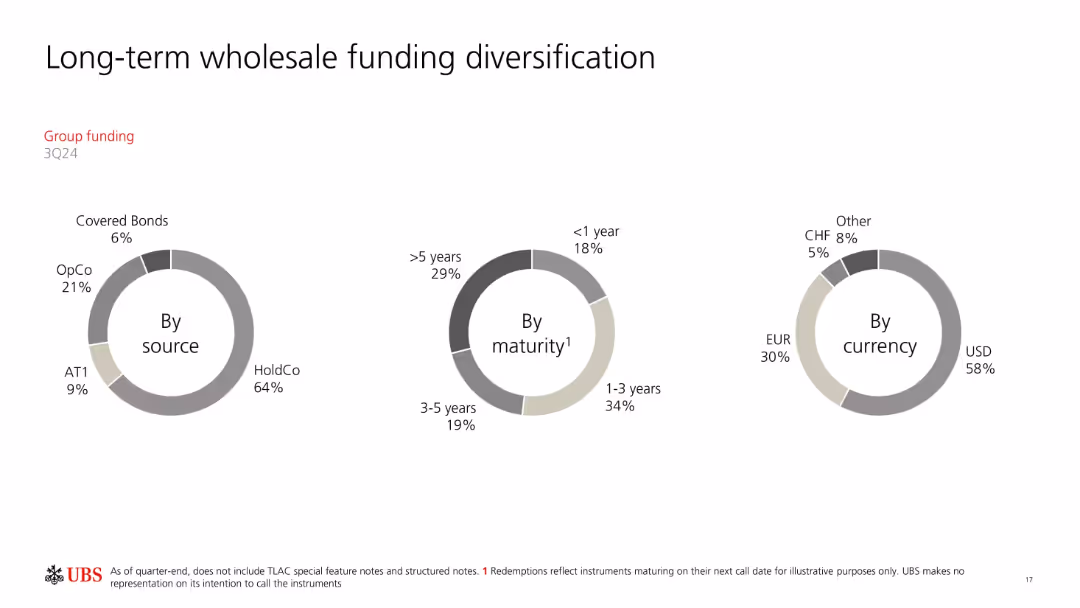
Three donut charts categorizing funding by source, maturity, and currency.
Investment Analysis
Financial Services
Displays the diversification of UBS’s long-term wholesale funding portfolio. Categorizes by instrument type (e.g., HoldCo, OpCo), maturity periods, and currency mix. Emphasizes UBS's broad funding base and balanced risk structure.
funding diversification, maturity, currency mix, UBS, wholesale funding
false
Investment Analysis
Financial Services
Single Chart
UBS
Add to my slides
Remove from favorites
Moderate complexity with multiple column charts representing funding stages from Seed to Series E+. Text blocks to the side provide context for the visual data.
Investment Analysis
Financial Services
Discusses trends in early-stage funding, noting its strength, and highlights the plateau in mid-stage funding with accompanying visual data on investment stages.
Funding, early-stage, mid-stage, plateau
false
Investment Analysis
Financial Services
Mixed Chart
Bain
Add to my slides
Remove from favorites
A column chart showing funding composition from 2020 to 2023 with labels for shareholder equity, debt, and customer deposits. To the right, data boxes highlight specific figures for 4Q23. The chart uses neutral colors for clarity and emphasis.
Financial Performance
Financial Services
The slide provides an overview of the group's funding over several years, focusing on the breakdown of shareholder equity, debt, and customer deposits. It includes a detailed view of the 4Q23 figures, highlighting changes and components of funding.
funding, equity, debt, deposits, financial report
false
Financial Performance
Financial Services
Multiple Chart
UBS
Add to my slides
Remove from favorites
Column charts showing group funding by year and quarter, with percentage breakdowns of shareholders equity, debt, and deposits.
Financial Performance
Financial Services
Overview of UBS group funding from 2020 to 3Q23, highlighting changes in shareholder equity, debt, and customer deposits.
Funding, equity, debt, deposits, trends
false
Financial Performance
Financial Services
Multiple Chart
UBS
Add to my slides
Remove from favorites
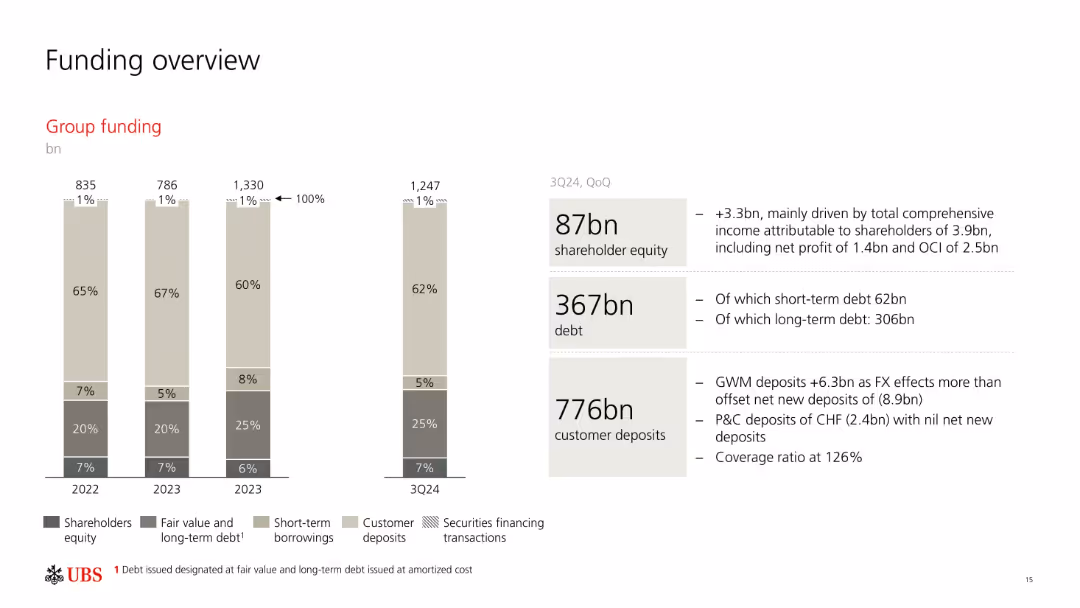
Stacked bar chart showing group funding composition over time; side panel with 3Q24 funding stats.
Corporate Finance and Valuation
Financial Services
Summarizes UBS’s funding structure including equity, debt, and deposits. Breaks down short-term and long-term funding and customer deposits. Commentary highlights quarterly changes and contributing factors like FX and deposit flows.
funding, equity, debt, deposits, UBS, 3Q24, capital sources
false
Corporate Finance and Valuation
Financial Services
Mixed Chart
UBS
Add to my slides
Remove from favorites
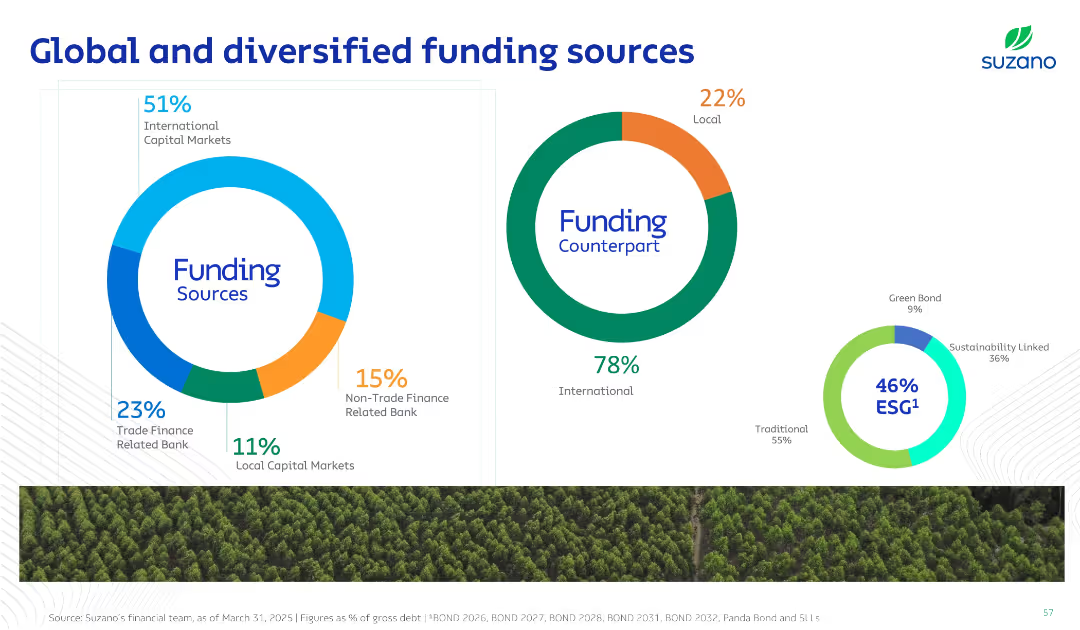
Three donut charts with distinct color schemes showing funding source distribution, counterpart breakdown (local/international), and ESG vs traditional debt split.
Investment Analysis
Consumer Goods
This slide visualizes the diversification of Suzano’s funding sources, highlighting a strong reliance on international capital and significant ESG-aligned funding. It emphasizes strategic capital sourcing and sustainability.
Funding, ESG, Capital Markets, Diversification, Debt
false
Investment Analysis
Consumer Goods
Single Chart
Goldman Sachs
Add to my slides
Remove from favorites
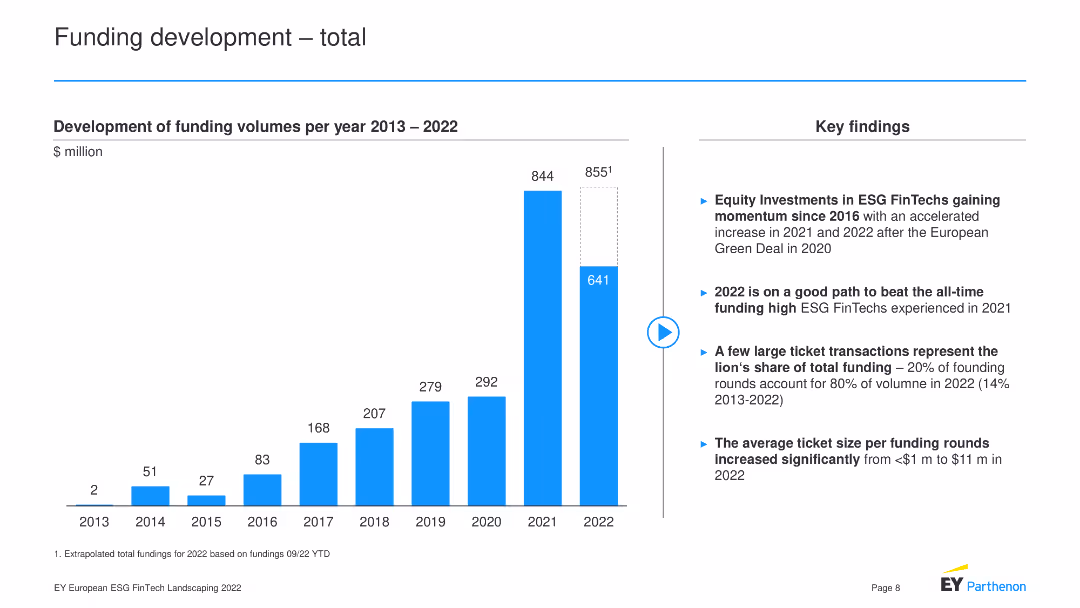
The slide contains a column chart showing the development of funding volumes per year from 2013 to 2022.
Market Analysis and Trends
Financial Services
The slide depicts the growth of funding volumes for ESG FinTech from 2013 to 2022, highlighting key findings such as the rise of equity investments, the potential for 2022 to surpass 2021's funding high, the concentration of large ticket transactions, and the increase in average ticket size per funding round.
Funding, ESG FinTech, Investment, Growth, Trends
false
Market Analysis and Trends
Financial Services
Mixed Chart
EY
Add to my slides
Remove from favorites
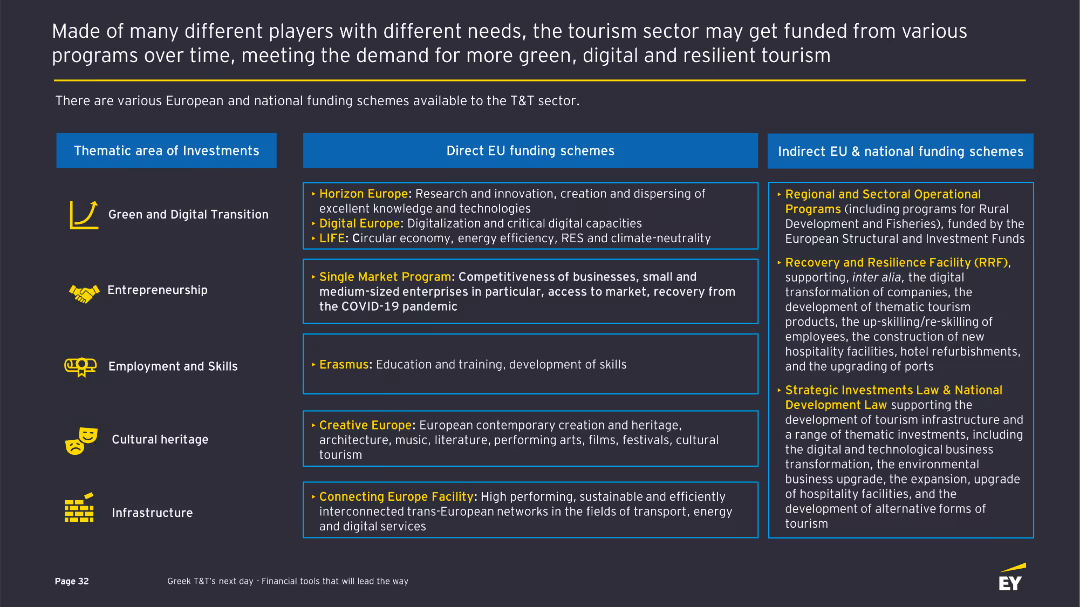
This slide details various European and national funding schemes available to the T&T sector. It categorizes the schemes into thematic areas of investment, such as green transition, entrepreneurship, and cultural heritage, with descriptions of each.
Financial Performance
Hospitality & Tourism
Describes funding opportunities for the T&T sector, covering EU and national programs aimed at green transition, digital capacities, entrepreneurship, and infrastructure. Lists specific funding schemes and their objectives.
Funding, EU programs, Investment, Green transition, Entrepreneurship
false
Financial Performance
Hospitality & Tourism
Table
EY
Add to my slides
Remove from favorites
This slide details various European and national funding schemes available to the T&T sector. It categorizes the schemes into thematic areas of investment, such as green transition, entrepreneurship, and cultural heritage, with descriptions of each.
Financial Performance
Hospitality & Tourism
Describes funding opportunities for the T&T sector, covering EU and national programs aimed at green transition, digital capacities, entrepreneurship, and infrastructure. Lists specific funding schemes and their objectives.
Funding, EU programs, Investment, Green transition, Entrepreneurship
false
Financial Performance
Hospitality & Tourism
Mixed Chart
EY
Add to my slides
Remove from favorites
The slide has a pie chart in various colors representing funding sources, accompanied by text sections with detailed financial information.
Corporate Finance and Valuation
Financial Services
This slide provides insights into a financial institution's funding strategy and its impact on net interest margin. It is suitable for financial analysis and understanding the conservative approach in managing capital and interest earnings.
Funding, Financial Strategy, Net Interest Margin, Borrowings, Deposits, Conservative, Capital Management
false
Corporate Finance and Valuation
Financial Services
Mixed Chart
Morgan Stanley
Add to my slides
Remove from favorites
Moderate complexity with three column charts representing funding in FinTech, HealthTech, and EdTech sectors, alongside descriptive text blocks.
Investment Analysis
Financial Services
Reviews the consistent increase in funding value for emerging sectors like FinTech, HealthTech, and EdTech, with specific mentions of significant deals and momentum.
Funding, FinTech, HealthTech, EdTech, growth
false
Investment Analysis
Financial Services
Mixed Chart
Bain
Add to my slides
Remove from favorites
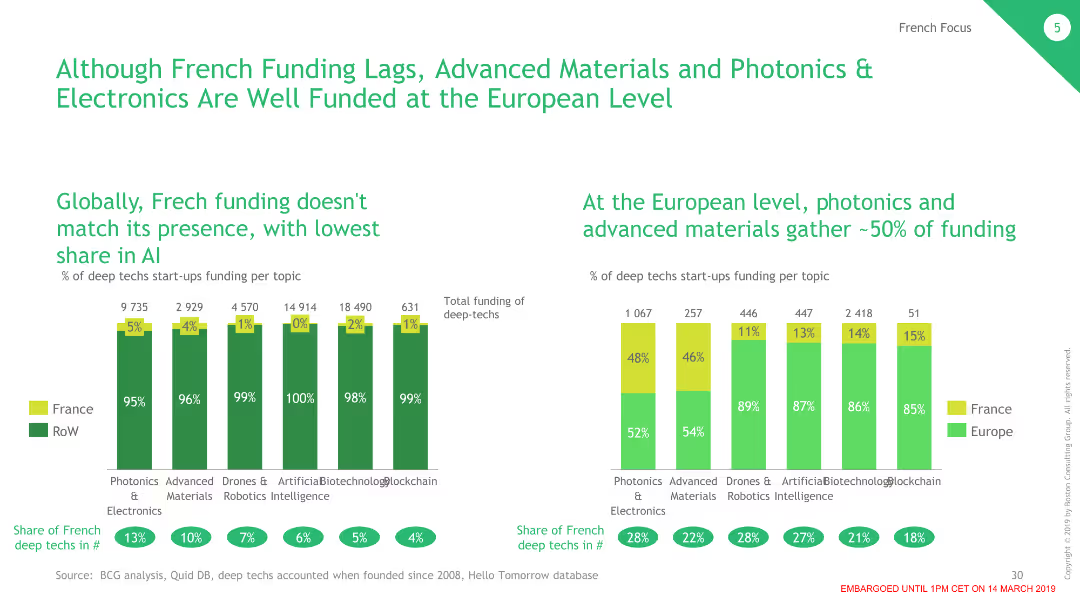
The slide contains two column charts. The left chart shows the percentage of French deep tech startups funding by category, and the right chart compares the funding shares between France and Europe.
Investment Analysis
Technology & Software
This slide discusses the disparity in funding for deep tech startups in France, noting strong funding in advanced materials and photonics & electronics, but overall lower investment compared to Europe.
Funding, France, Deep Tech, Investment, Comparison
false
Investment Analysis
Technology & Software
Multiple Chart
BCG
Add to my slides
Remove from favorites
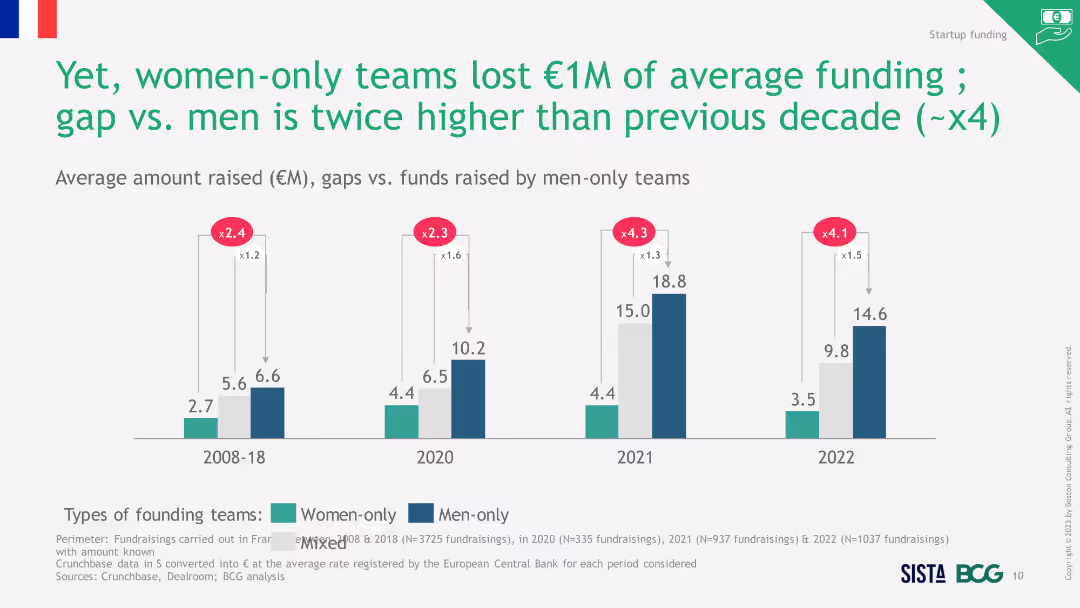
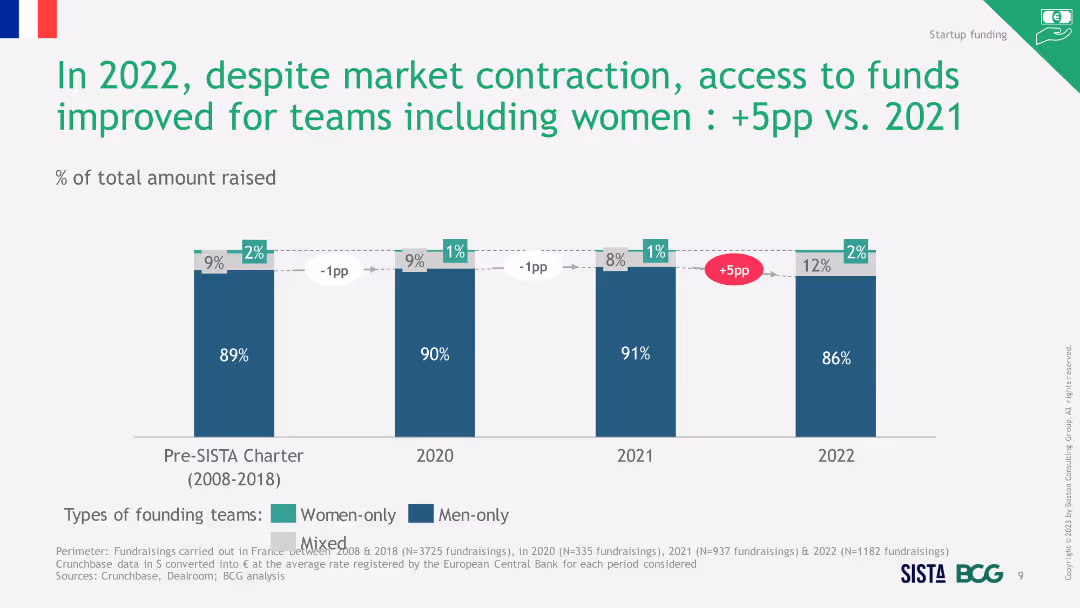
Column chart showing average amount of funds raised by different types of founding teams from 2008 to 2022, highlighting the funding gap for women.
Investment Analysis
Financial Services
The slide reveals that women-only teams received significantly less funding than men-only teams, with the gap increasing over the years.
funding gap, women-only teams, average funding, startups
false
Investment Analysis
Financial Services
Single Chart
BCG
Add to my slides
Remove from favorites
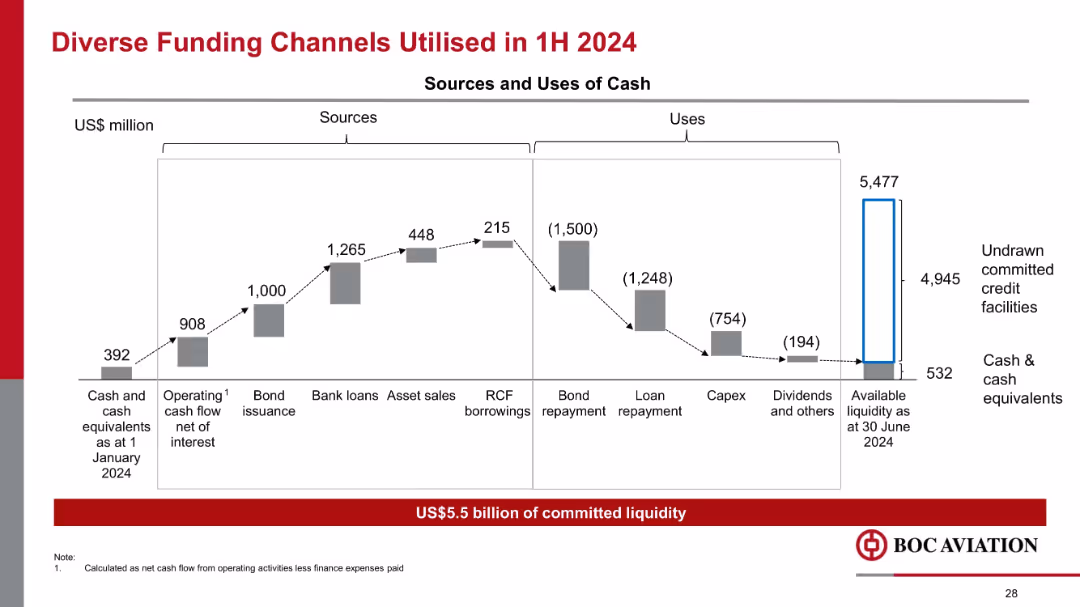
Waterfall chart showing sources and uses of cash; bar segments connected by dotted lines; blue/red emphasis
Corporate Finance and Valuation
Financial Services
Illustrates a detailed breakdown of funding sources (cash, operations, bonds, loans) and uses (repayments, capex, dividends) in 1H 2024. Highlights US$5.5B liquidity and strong cash flow management practices.
funding, liquidity, capex, bond repayment, debt, aviation finance, sources of cash, capital management
false
Corporate Finance and Valuation
Financial Services
Mixed Chart
Goldman Sachs
Add to my slides
Remove from favorites
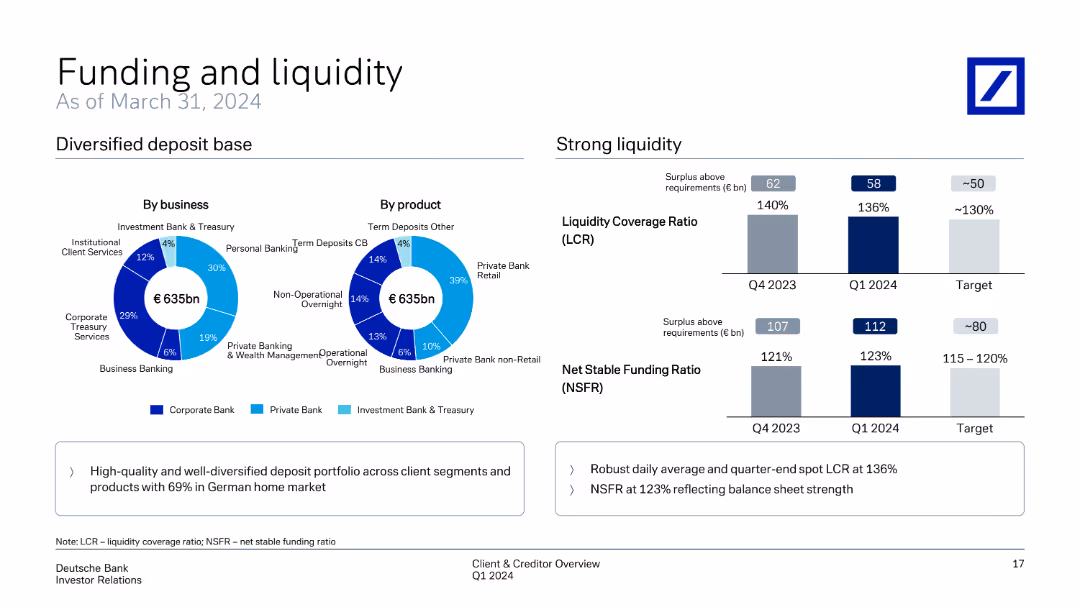
This slide includes multiple pie charts depicting the diversified deposit base by business and product. It also features column charts comparing liquidity coverage ratios and net stable funding ratios from Q4 2023 to Q1 2024.
Financial Performance
Financial Services
Focuses on the diversified deposit base and liquidity ratios, presenting the bank's funding and liquidity status as of March 31, 2024. It highlights the strength of liquidity coverage and stability in funding sources across different business segments.
funding, liquidity, deposit base, coverage ratio, stable funding
false
Financial Performance
Financial Services
Multiple Chart
Deutsche Bank
Add to my slides
Remove from favorites
Slide contains multiple pie charts and column charts showing the composition of deposits and liquidity metrics. Layout is straightforward with distinct color coding.
Financial Performance
Financial Services
Analysis of funding sources and liquidity ratios, important for assessing the financial health and operational capabilities.
funding, liquidity, deposits, financial health, ratios
false
Financial Performance
Financial Services
Multiple Chart
Deutsche Bank
Add to my slides
Remove from favorites
The slide shows a dark theme with two divided column charts comparing the unsecured funding mix between years. Text blocks detail the growth in deposits and total assets in bank entities.
Financial Performance
Financial Services
Aimed at depicting the funding strategy improvement over time, the slide contrasts the wholesale unsecured and deposit percentages from 2019 to 2022.
Funding, Liquidity, Deposits, Unsecured, Assets, Banks, Growth, Strategy
false
Financial Performance
Financial Services
Mixed Chart
Goldman Sachs
Add to my slides
Remove from favorites
The slide includes pie and column charts displaying trends in liquidity ratios and funding sources over several quarters. The information is organized in a clear, easy-to-follow layout.
Financial Performance
Financial Services
Outlines the funding and liquidity status of a financial institution, highlighting the diversified deposit base and liquidity ratios. Useful for financial analysis and discussions on maintaining liquidity in banking operations.
funding, liquidity, finance, banking, stability
false
Financial Performance
Financial Services
Multiple Chart
Deutsche Bank
Add to my slides
Remove from favorites
Slide features pie charts showing the diversified deposit base by business and product, and column charts for liquidity ratios.
Operational Efficiency
Financial Services
Discusses the funding sources and liquidity metrics of the bank, showcasing the stability and distribution of deposits and their impact on financial health.
funding, liquidity, financial health, deposits, ratios, banking, operational efficiency
false
Operational Efficiency
Financial Services
Multiple Chart
Deutsche Bank
Add to my slides
Remove from favorites
Multiple pie charts and column charts showing deposit base breakdown and liquidity ratios with future targets.
Operational Efficiency
Financial Services
Discusses the diversified funding and robust liquidity position of Deutsche Bank, with an emphasis on stability and targets.
funding, liquidity, operational, stability, banking, pie charts, bar graphs, deposits, ratios, targets
false
Operational Efficiency
Financial Services
Multiple Chart
Deutsche Bank
Add to my slides
Remove from favorites
This slide features a clear title, bullet points outlining strategy tenets, and a line graph (future state vs current state) with a focus on funding costs over different time intervals (tenor). It includes a legend for clarity.
Financial Performance
Financial Services
Focuses on Goldman Sachs’ strategic financial approach, presenting the methods and goals of diversifying funding and managing assets and liquidity to generate revenue through lower interest expenses, supported by a graph indicating projections of funding costs over time.
funding, liquidity, strategy, management, finance
false
Financial Performance
Financial Services
Mixed Chart
Goldman Sachs
Add to my slides
Remove from favorites
Moderate complexity with four column charts comparing funding in key sectors, accompanied by a comprehensive text explanation on the right side.
Market Analysis and Trends
Financial Services
Evaluates funding trends in mature and consolidated sectors, indicating a slowdown, and offers a detailed analysis of unicorn and other investments.
Funding, mature sectors, consolidation, slowdown
false
Market Analysis and Trends
Financial Services
Mixed Chart
Bain
Add to my slides
Remove from favorites
Slide presents various funding methods with corresponding icons and bullet points explaining the suitability of each method for enhancing school connectivity in well-developed regions. A text box details concerns and justifications for each funding strategy.
Strategic Planning
Education & Training
Analyzes potential funding strategies for achieving full school connectivity in developed regions of Indonesia. Discusses the advantages and concerns associated with each method, including government subsidies and private investment models.
funding methods, school connectivity, government subsidy, private investment, developed regions
false
Strategic Planning
Education & Training
Table
BCG
Add to my slides
Remove from favorites
The slide includes two stacked column charts showing the evolution of the funding mix over time and a checklist on the right side. The visual elements are balanced and provide a clear comparison of data between two periods.
Financial Performance
Financial Services
Showcasing the company's funding strategy, this slide compares the composition of the funding sources from a past period to the current one, underlining the diversification and liquidity strategy. Ideal for presentations aimed at investors or financial analysts to discuss funding stability and strategy.
Funding Mix, Financial Strategy, Liquidity, Diversification, Capital Management
false
Financial Performance
Financial Services
Mixed Chart
Goldman Sachs
Add to my slides
Remove from favorites
A column chart comparison of funding mixes from different years with forecast projections and explanatory text.
Operational Efficiency
Financial Services
This slide projects the benefits of optimizing unsecured funding, suitable for presentations on financial strategy or banking operations efficiency.
Funding Mix, Optimization, Deposits, Financial Strategy, Banking Operations, Projections
false
Operational Efficiency
Financial Services
Single Chart
Goldman Sachs
Add to my slides
Remove from favorites
The slide displays pie charts reflecting the funding mix in 2015, 2019, and the medium-term. A breakdown sidebar shows the strategic deposit growth areas: consumer, private bank, institutional, and central channels.
Investment Analysis
Financial Services
Examines the evolution of Goldman Sachs' funding mix, detailing the strategic increase in deposits and the consequent improvement in funding costs through clear visual representations. The focus is on diversification and the role of strategic business channels in this growth.
funding mix, strategic growth, deposits, finance, diversification
false
Investment Analysis
Financial Services
Multiple Chart
Goldman Sachs
Add to my slides
Remove from favorites
Shows a line graph with a future state projection and a list of key strategic points, indicating stages of funding optimization.
Operational Efficiency
Financial Services
Discusses strategies for funding optimization for better returns, presented to stakeholders for financial and operational strategy reviews.
Funding Optimization, Strategy, Returns, Financial Planning, Operational Efficiency
false
Operational Efficiency
Financial Services
Mixed Chart
Goldman Sachs
Add to my slides
Remove from favorites
The slide showcases vertical column charts with a blue and grey color scheme, displaying the changes in private funding value across different sectors from 2019 to H1 2023 in the Philippines. Each sector is represented by a stacked column, showing the trend of funding before and after the pandemic peak, along with the number of deals. The layout is clear and informative, with a focus on presenting the data succinctly.
Investment Analysis
Financial Services
It illustrates the significant drop in private funding in the Philippines post-pandemic, with a specific focus on digital financial services. This slide serves as an analytical resource for investors and financial analysts to understand the impact of the pandemic on investment trends and to strategize for recovery and future funding allocations.
Funding, Pandemic, Philippines, Digital Financial Services, Investment Trends, Recovery, Analysis
false
Investment Analysis
Financial Services
Single Chart
Bain
Add to my slides
Remove from favorites
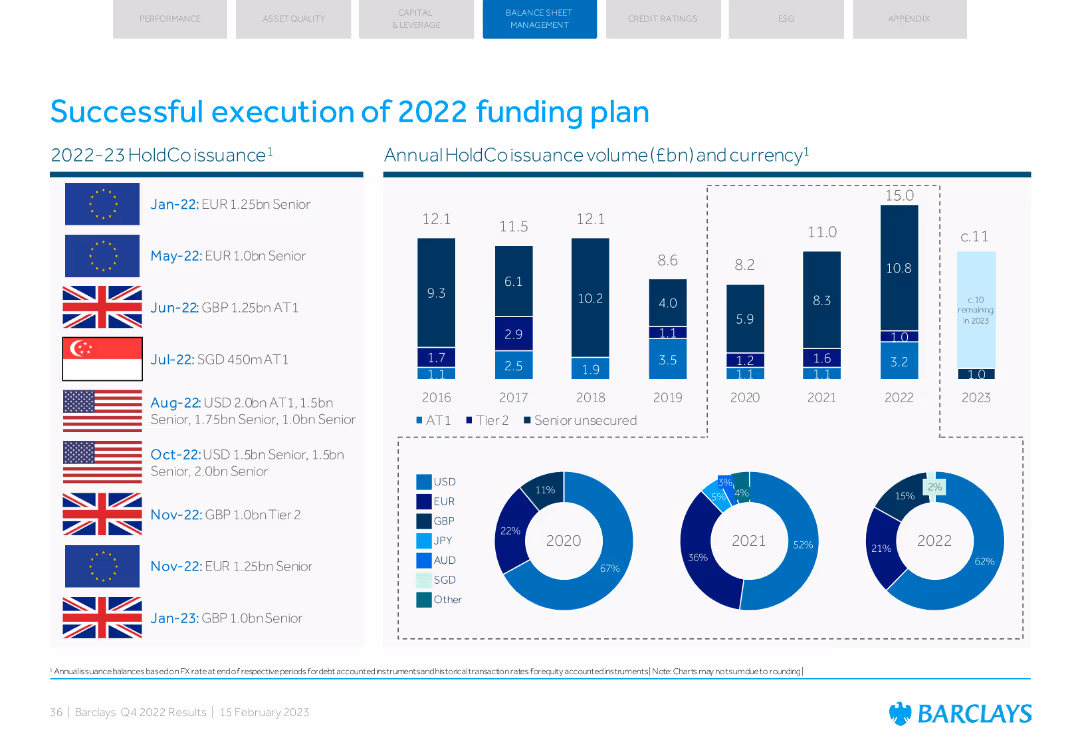
Column charts and pie charts illustrating holdco issuance volumes and currency breakdowns for 2022.
Financial Performance
Financial Services
Reviews the 2022 funding plan execution, detailing issuance volumes, currencies used, and the financial impact of these actions.
funding plan, issuance, 2022, volumes, currency
false
Financial Performance
Financial Services
Multiple Chart
Barclays
Add to my slides
Remove from favorites
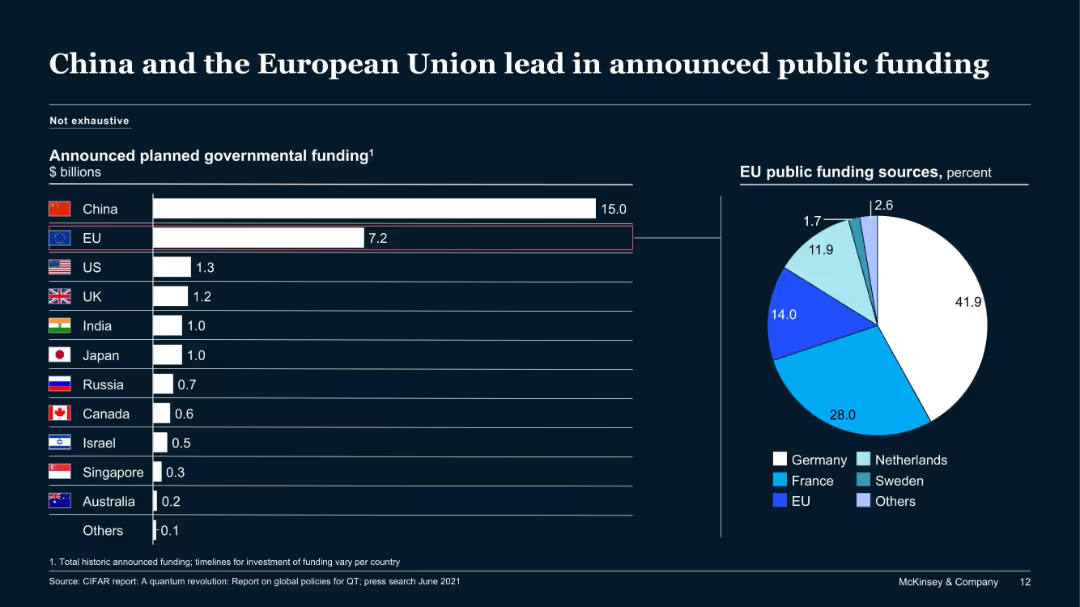
Bar chart (left) and pie chart (right) on a dark background. Left compares public funding ($B) by country; right shows EU funding distribution by country.
Strategic Planning
Government & Public Sector
This slide highlights that China and the EU are leading in governmental funding for quantum technologies, with China at $15B and the EU at $7.2B. It also breaks down EU funding sources, showing Germany as the largest contributor (41.9%).
funding, quantum technology, China, EU, public investment, government, Germany, pie chart, bar chart
false
Strategic Planning
Government & Public Sector
Multiple Chart
McKinsey
Add to my slides
Remove from favorites
A stacked bar graph shows the growth of different deal sizes over time, with a focus on larger-ticket and mega rounds. The accompanying text analyzes the trend towards bigger investments.
Investment Analysis
Financial Services
This slide showcases the shift in the venture investing market towards larger-ticket funding rounds, particularly mega rounds over the past two decades. It highlights the increase in average deal size, driven by these substantial investments, and the implications for startups and investors alike. The slide provides a comprehensive view of investment strategies and market responses to evolving business models and funding needs.
funding rounds, mega rounds, venture capital, investment trend, deal size
false
Investment Analysis
Financial Services
Mixed Chart
Oliver Wyman
Add to my slides
Remove from favorites
This slide includes a vertical column chart and text, showing the breakdown of group funding by type from 2019 to 2Q23, with specific figures for shareholder equity, debt, and customer deposits.
Financial Performance
Financial Services
The slide provides an overview of UBS's funding structure over several years, highlighting changes in shareholder equity, debt, and customer deposits, to show the bank's financial stability and funding sources.
funding, shareholder equity, debt, customer deposits, UBS
false
Financial Performance
Financial Services
Multiple Chart
UBS
Add to my slides
Remove from favorites
A column graph with annotations displays the shift in venture deal mix by investment round, highlighting the movement away from early-stage funding.
Investment Analysis
Technology & Software
This slide analyzes changes in the investment round mix within the technology sector, pointing out a significant shift from early-stage Angel and Seed funding towards later-stage investments. It discusses the volatility and the strategic adjustments in venture capital allocations in response to market conditions and the startup ecosystem's evolution.
funding shift, Angel funding, Seed funding, investment rounds, venture capital
false
Investment Analysis
Technology & Software
Single Chart
Oliver Wyman
Add to my slides
Remove from favorites
Contains a bullet list of firmwide funding sources and column chart detailing funding sources by type in billions. Text emphasizes the increased role of deposits and diversification of debt. There's a growth trajectory in the deposit percentage as a share of unsecured funding from 2019 to 2022.
Financial Performance
Financial Services
Discusses the diversified funding sources for firmwide operations, including the increasing significance of deposits. It presents a comparative financial analysis of the company's funding structure over several quarters, highlighting the strategic use of unsecured long-term and short-term debt.
funding sources, deposits, unsecured debt, diversification, financial strategy, column chart
false
Financial Performance
Financial Services
Mixed Chart
Goldman Sachs
Add to my slides
Remove from favorites
The slide is primarily textual with a header at the top. It includes a list titled 'Key Tenets of our Strategy' with three strategic points, and a line chart on the right depicting 'Target State' with a timeline and plotted points, illustrating the future direction of funding costs.
Strategic Planning
Financial Services
Aimed at outlining strategic approaches for diversifying funding and managing assets and liabilities, this slide provides insights into the future funding cost targets, suitable for financial strategists or management.
funding strategy, asset management, liability management, line chart, strategic planning, diversification, financial goals, cost targets, liquidity optimization, financial forecasting
false
Strategic Planning
Financial Services
Mixed Chart
Goldman Sachs
Add to my slides
Remove from favorites
Mixed column and table showing funding execution and requirements over a period, alongside textual details.
Corporate Finance and Valuation
Energy & Utilities
Outlines the funding strategy and execution for Enbridge, emphasizing sources and uses of capital.
funding, strategy, capital, execution, planning
false
Corporate Finance and Valuation
Energy & Utilities
Multiple Chart
Barclays
Add to my slides
Remove from favorites
Features pie charts detailing Macquarie's term funding by currency, tenor, and type, with percentages and color differentiation for visual clarity.
Corporate Finance and Valuation
Financial Services
The slide conveys Macquarie's funding strategy, emphasizing diversification by currency, duration, and funding type, useful for stakeholders analyzing financial strategy and currency exposure.
funding, strategy, diversification, currency, finance, term, issuance, pie chart, financial, exposure
false
Corporate Finance and Valuation
Financial Services
Multiple Chart
Goldman Sachs
Add to my slides
Remove from favorites
A bar graph contrasts the percentage of early-stage versus late-stage funding rounds in the technology sector over time, supported by textual analysis.
Investment Analysis
Technology & Software
This slide contemplates the investment pattern shifts in the technology sector over the years, highlighting a move towards more significant later-stage funding rounds. It places this trend within the context of historical cycles, suggesting a consistent pattern of evolution in the sector's investment stages. The graphical representation combined with the analytical text provides a clear and concise overview of how funding preferences have developed, corresponding with industry maturity and investor confidence.
funding trends, later-stage investment, technology sector, market cycles, venture capital
false
Investment Analysis
Technology & Software
Single Chart
Oliver Wyman
Add to my slides
Remove from favorites
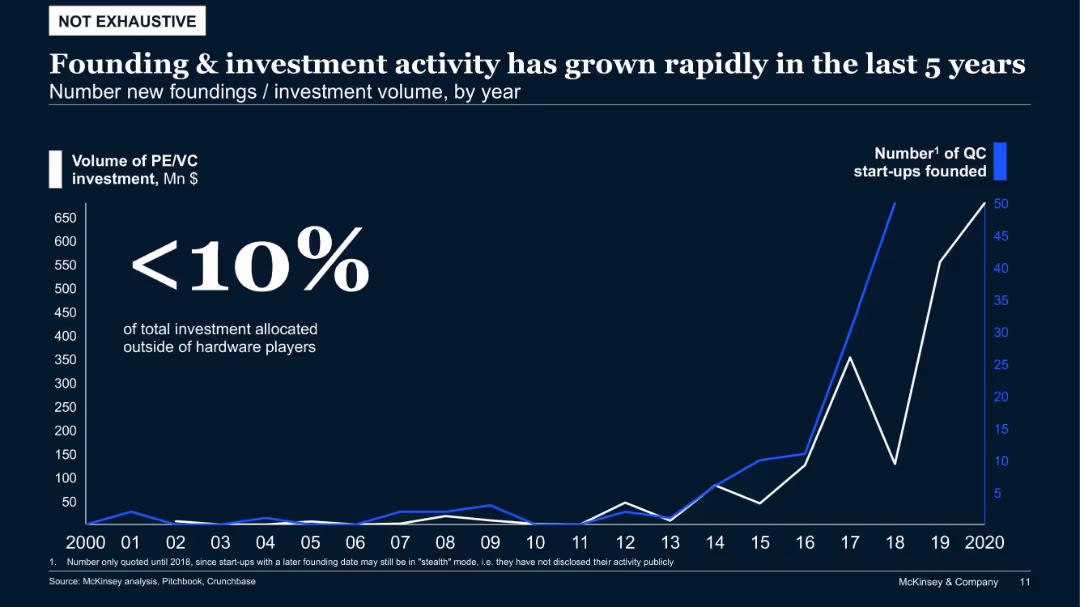
Line chart showing number of start-ups and investment volume over time (2000–2020), emphasizing surge since 2015
Investment Analysis
Artificial Intelligence
The chart demonstrates exponential growth in quantum computing start-up founding and venture capital activity in recent years. Despite this, <10% of investment goes outside hardware, showing a concentrated funding focus.
funding trends, VC, hardware investment, start-up growth, quantum computing, venture capital
false
Investment Analysis
Artificial Intelligence
Single Chart
McKinsey
Add to my slides
Remove from favorites
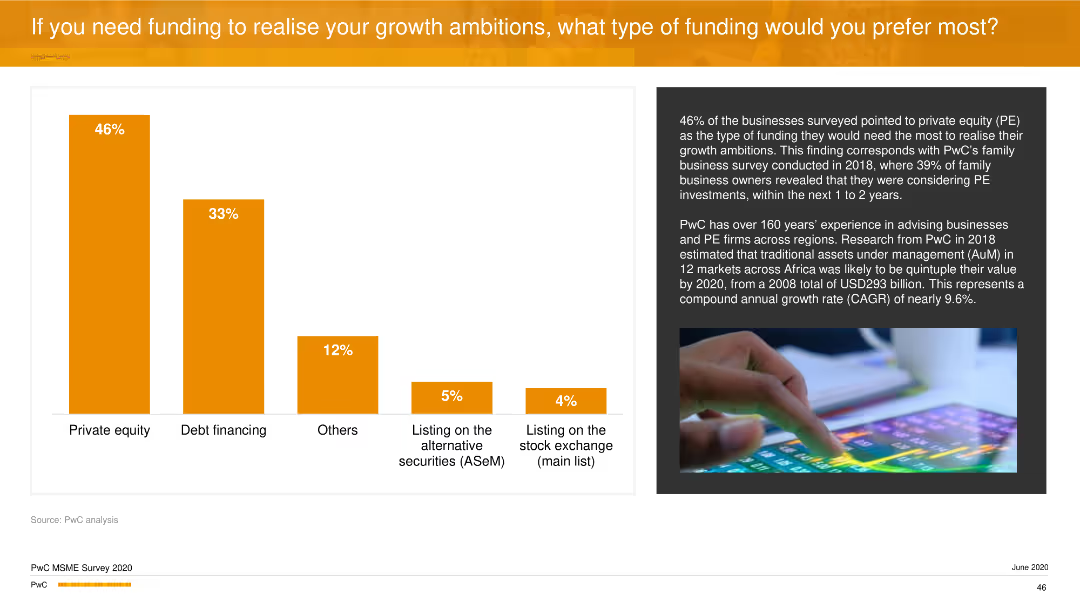
A column chart depicting preferred types of funding, with the highest preference for private equity. Orange bars indicate percentages, and there is an explanatory text on the right.
Investment Analysis
Financial Services
This slide shows the preferred funding types for business growth, with private equity being the top choice, followed by debt financing, others, and listings on various exchanges.
funding types, private equity, debt financing, investment, professional services
false
Investment Analysis
Financial Services
Mixed Chart
PwC/Strategy&
Add to my slides
Remove from favorites
Previous
Next
You don't have any favorites yet.
Please wait loading your favorites slides...
Create a FREE account to continue browsing
Receive Instant Access to 1,000+ slides from companies like McKinsey, Google, and Goldman Sachs
First Name
Last Name
Email
Password
I agree to all
Terms & Privacy Policy
Thank you! Your submission has been received!
Oops! Something went wrong while submitting the form.
Have an account?
Sign in
Upgrade to PRO to Save slides
Advanced Search and Filters
Access to 15,000+ slides
Access to Category Pages
Save/Bookmark Slides
PowerPoint Template Library
Pick a Plan
MONTHLY
$12/month
Billed every month, Cancel anytime.
YEARLY
$9/year
Billed $108 annually, Cancel anytime.
Checkout for $12/month
Checkout for $108/yr
Secured by Stripe | AES-256 bit encryption


![Although finance has consistently been the most popular function for SSCs, interest in other functions has been rising sharply— in this year’s survey, supply chain and manufacturing experienced one of the largest increases in adoption [Figure 7]](https://cdn.prod.website-files.com/654e70fb59937215cac87b19/6703689244e59d9178ef98cf_4hoIM9XVzXPp2oXDvcrosgS6gCXfeEUQ8qolMyPRI2g.avif)