My Account
My Slides
Search by Category
Companies
Slide Type
Use Case
Industry
Pricing
Templates
View All Templates
Download Template Slides
✦ AI
AI Prompt Library
AI Search
Feedback
Login
Logout
Get Started
Browse all Slides
Browse all Slides
Create a FREE Account
Instant access to 1,000+ real slides from top companies like McKinsey, BCG, Goldman Sachs, Google and many more!
First Name
Last Name
Email
Password
I agree to all
Terms & Privacy Policy
Thank you! Your submission has been received!
Oops! Something went wrong while submitting the form.
Have an account?
Sign in
Saved Slides
Total No. of slides saved
0
↻ Refresh
✖ Clear all
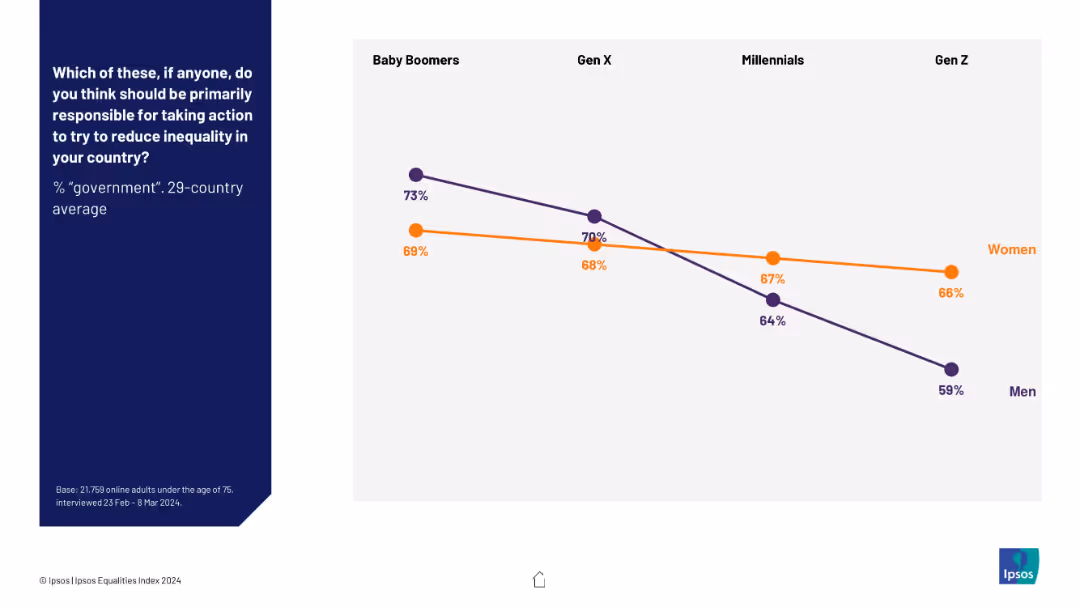
Line graph comparing men vs. women across four generations on government responsibility to reduce inequality. Orange and purple trend lines with markers.
Strategic Planning
Government & Public Sector
This slide shows that belief in government responsibility for reducing inequality declines with each younger generation, particularly among men. While Baby Boomers show the highest agreement, Gen Z men have the lowest. Women consistently rate higher than men across generations.
generational trends, gender comparison, inequality, government, responsibility, survey, Ipsos, policy opinion
false
Strategic Planning
Government & Public Sector
Mixed Chart
IPSOS
Add to my slides
Remove from favorites
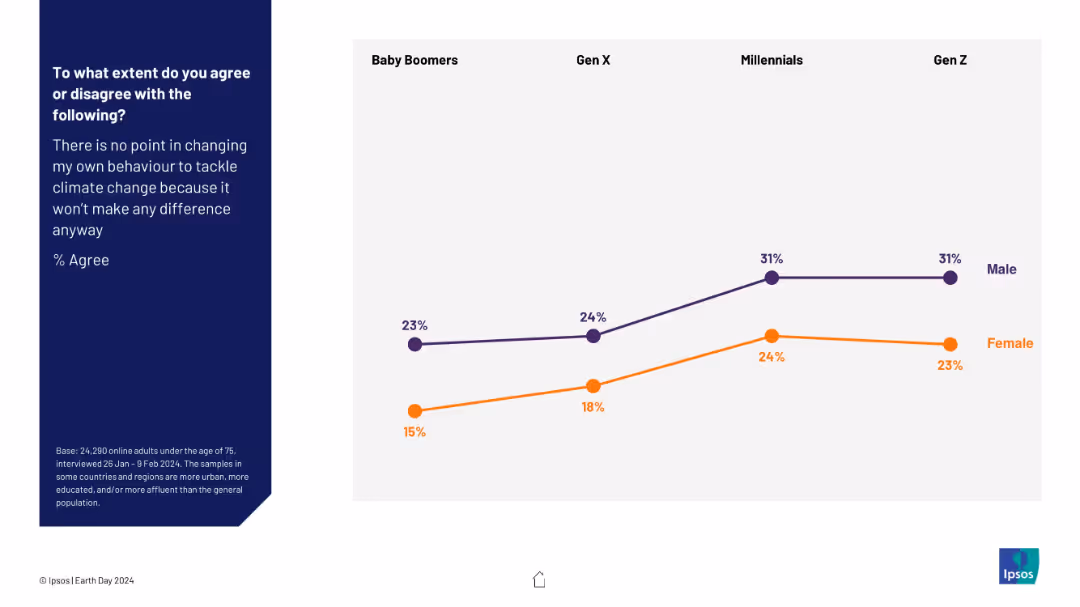
Line graph showing agreement percentages by gender (male and female) across four generations (Baby Boomers, Gen X, Millennials, Gen Z). Purple lines represent males, orange lines represent females.
Market Analysis and Trends
Environmental Services & Sustainability
The slide shows generational and gender-based differences in agreement with the statement that individual behavior change does not impact climate change. Male agreement rises with younger generations, peaking at 31% among Millennials and Gen Z. Female agreement is consistently lower, showing stronger belief in the effectiveness of personal action.
generational trends, gender gap, climate beliefs, survey data, public opinion, behavior change, environment, youth perspective, Ipsos, Earth Day
false
Market Analysis and Trends
Environmental Services & Sustainability
Mixed Chart
IPSOS
Add to my slides
Remove from favorites
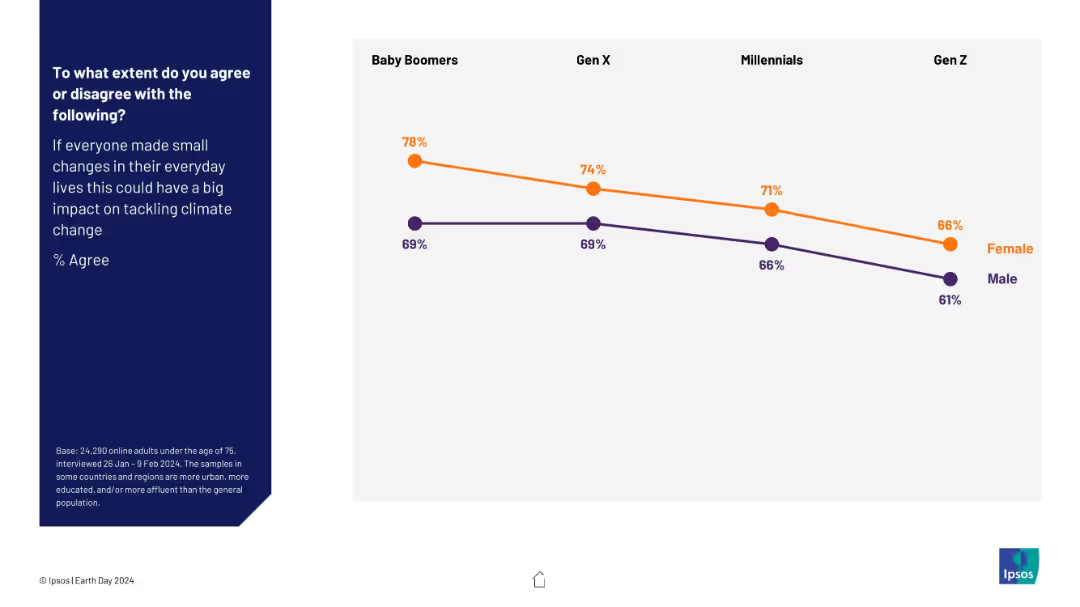
Line chart by generation and gender. Orange (female) and purple (male) trend lines across four generations.
Customer and Market Segmentation
Environmental Services & Sustainability
This demographic breakdown shows generational and gender differences in agreement that small lifestyle changes help climate action. Older generations and women agree more.
generational trends, gender gap, individual impact, climate behavior, opinion analysis, Ipsos, sustainability attitudes
false
Customer and Market Segmentation
Environmental Services & Sustainability
Mixed Chart
IPSOS
Add to my slides
Remove from favorites
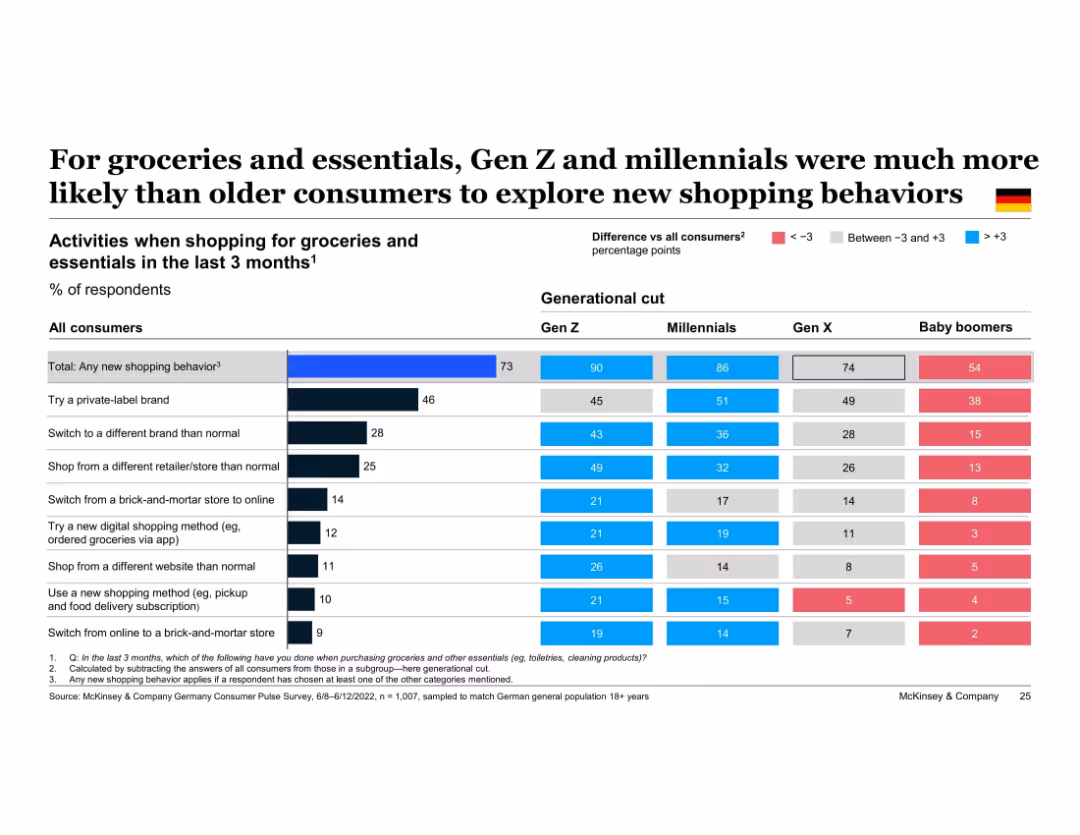
Table comparing generational behavior (Gen Z to Boomers) in a side-by-side percentage chart, with differences highlighted using red, gray, and blue color coding
Customer and Market Segmentation
Retail & E-commerce
This slide compares generational differences in shopping behavior. Gen Z and millennials are significantly more likely than Gen X and baby boomers to try new behaviors like switching brands or trying private-label products. Each row compares one behavior across generations against the overall average.
generational trends, Gen Z, Millennials, shopping behavior, brand switching, private label, consumer segmentation, retail innovation
false
Customer and Market Segmentation
Retail & E-commerce
Multiple Chart
McKinsey
Add to my slides
Remove from favorites
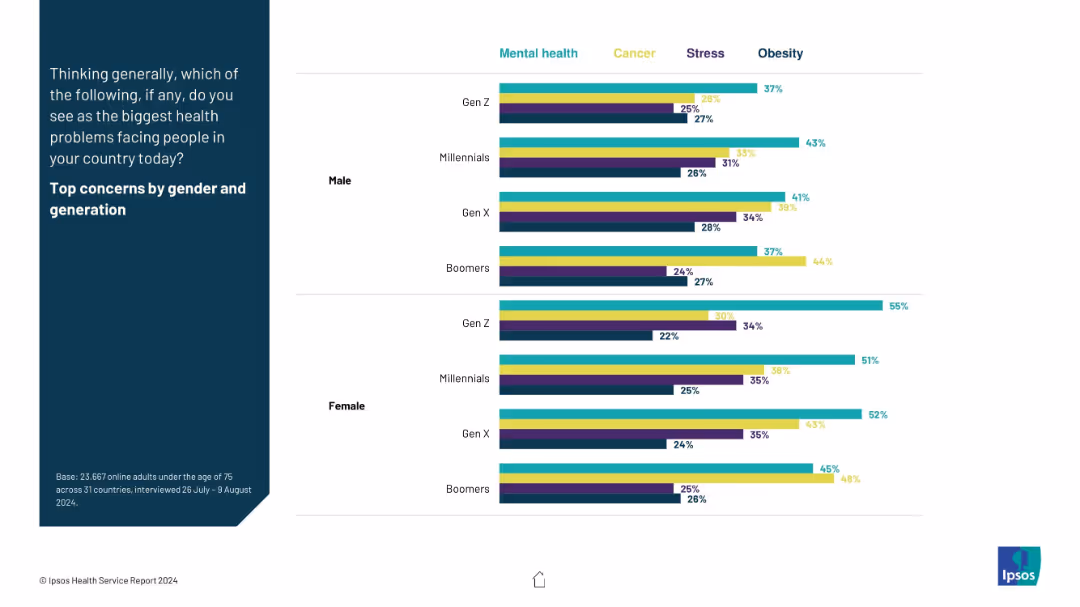
Side-by-side bar chart layout by gender and generation on a white background. Uses color-coded categories like mental health, cancer, stress
Customer and Market Segmentation
Healthcare & Pharmaceuticals
This slide analyzes top health concerns by generation and gender. Mental health dominates for younger groups, while obesity and cancer are prevalent concerns across generations.
generational trends, health concerns, mental health, stress, obesity, cancer, gender analysis, Ipsos health report
false
Customer and Market Segmentation
Healthcare & Pharmaceuticals
Mixed Chart
IPSOS
Add to my slides
Remove from favorites
The slide displays a generational breakdown of luxury goods consumers using vertical column charts, showing shifts from 2018 to projected 2035 figures.
Customer and Market Segmentation
Consumer Goods
Analyzes generational shifts in the consumption of luxury goods, highlighting the growing influence of Gen Y and Gen Z in the market.
Generational trends, Luxury goods, Market analysis
false
Customer and Market Segmentation
Consumer Goods
Mixed Chart
Bain
Add to my slides
Remove from favorites
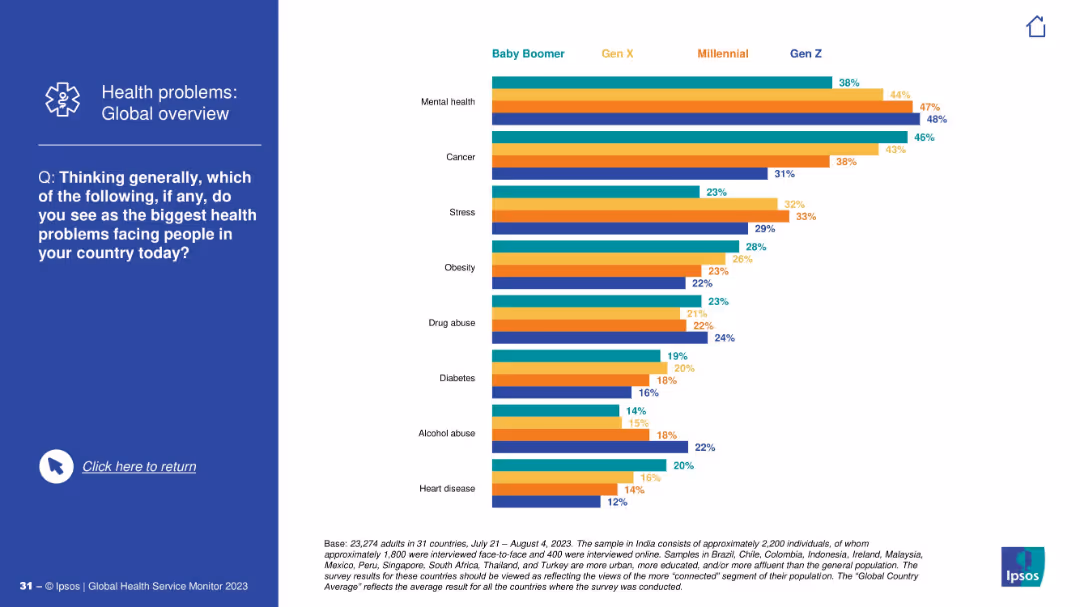
Multi-colored horizontal bar chart comparing generational views on health problems.
Market Analysis and Trends
Healthcare & Pharmaceuticals
This slide shows generational perspectives (Boomers to Gen Z) on health issues like mental health, cancer, stress, and obesity. Mental health tops concerns for younger generations, while cancer is more prominent among older cohorts.
generational trends, mental health, cancer, stress
false
Market Analysis and Trends
Healthcare & Pharmaceuticals
Mixed Chart
IPSOS
Add to my slides
Remove from favorites
The slide is dominated by three large circular diagrams representing data percentages, each labeled for a different generation. A succinct title is positioned at the top, and the design is clean with generous use of white space for clarity.
Market Analysis and Trends
Financial Services
This slide shows generational differences in response to economic concerns, with a particular focus on reduced contributions to savings plans. It's relevant for presentations on generational financial behaviors and HR policy adaptations in financial services.
generational trends, savings, economic concerns, 401(k), Millennials
false
Market Analysis and Trends
Financial Services
Single Chart
Goldman Sachs
Add to my slides
Remove from favorites
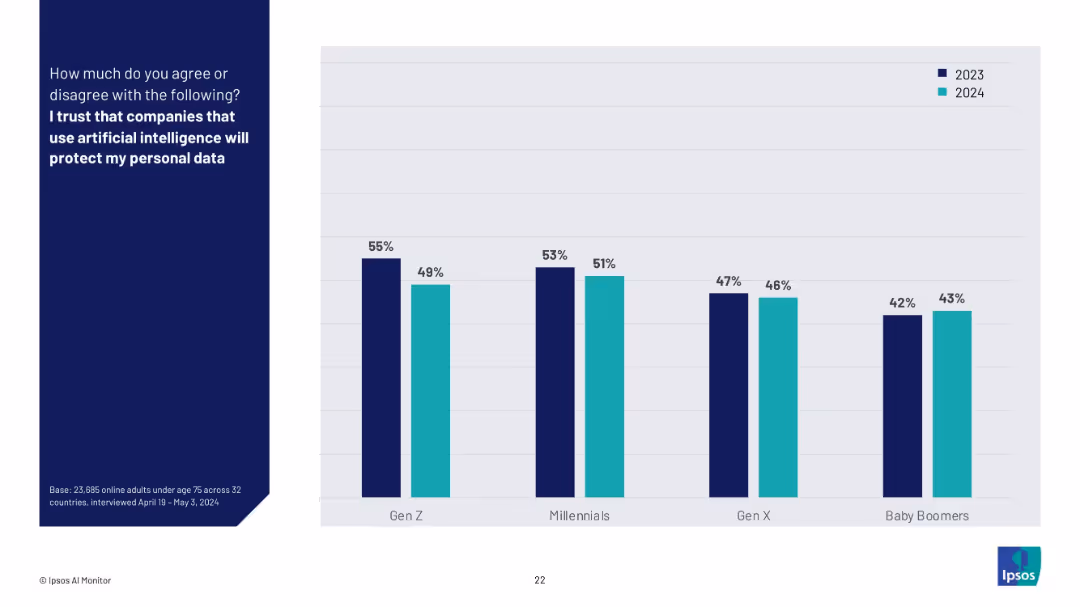
Grouped vertical bar chart comparing trust percentages in 2023 vs 2024 across four generations (Gen Z to Baby Boomers).
Risk Assessment and Management
Artificial Intelligence
This generational comparison chart tracks changes in trust over time concerning companies using AI to protect data. It reveals declining trust among younger groups and relatively stable trust among older generations.
generational trust, AI, data protection, age comparison, Ipsos, time series, privacy, consumer behavior
false
Risk Assessment and Management
Artificial Intelligence
Mixed Chart
IPSOS
Add to my slides
Remove from favorites
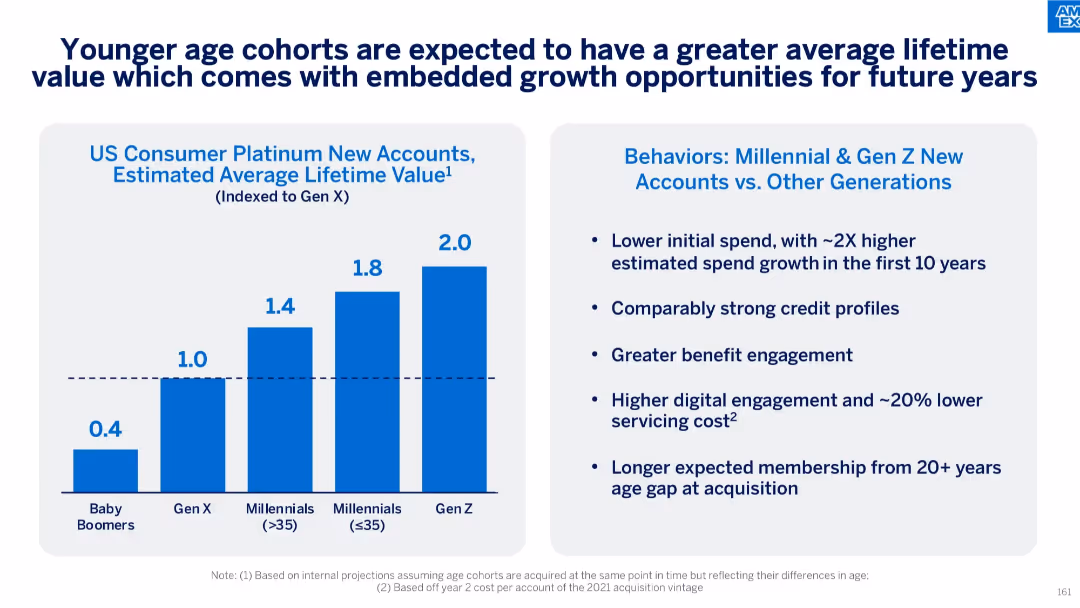
Left: bar chart comparing average lifetime value of new accounts by generation. Right: bullet points describing millennial and Gen Z behavior vs other generations.
Customer and Market Segmentation
Financial Services
This slide suggests that Millennials and Gen Z offer the highest average lifetime value as customers, supported by stronger digital engagement, higher benefit use, and longer expected tenure. Gen Z's value is indexed at 2.0, double that of Gen X, emphasizing future growth potential.
generational value, lifetime value, Gen Z, Millennials, customer behavior, digital engagement, loyalty, market potential
false
Customer and Market Segmentation
Financial Services
Mixed Chart
McKinsey
Add to my slides
Remove from favorites
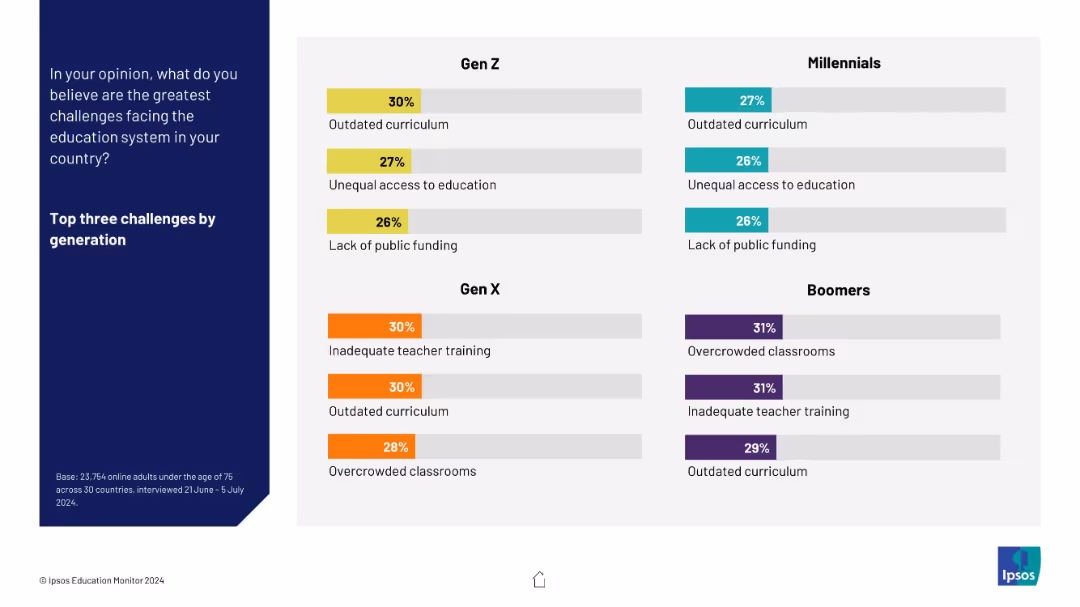
Split into four quadrant-style boxes by generation (Gen Z to Boomers), each showing top three challenges with percentages. Color-coded bars by generation.
Customer and Market Segmentation
Education & Training
This slide breaks down the top three perceived educational challenges by generation. Gen Z focuses on access and funding; Boomers highlight overcrowded classrooms and outdated content. Each group shows differing priorities.
generational views, education concerns, curriculum, access, teacher training, overcrowding
false
Customer and Market Segmentation
Education & Training
Mixed Chart
IPSOS
Add to my slides
Remove from favorites
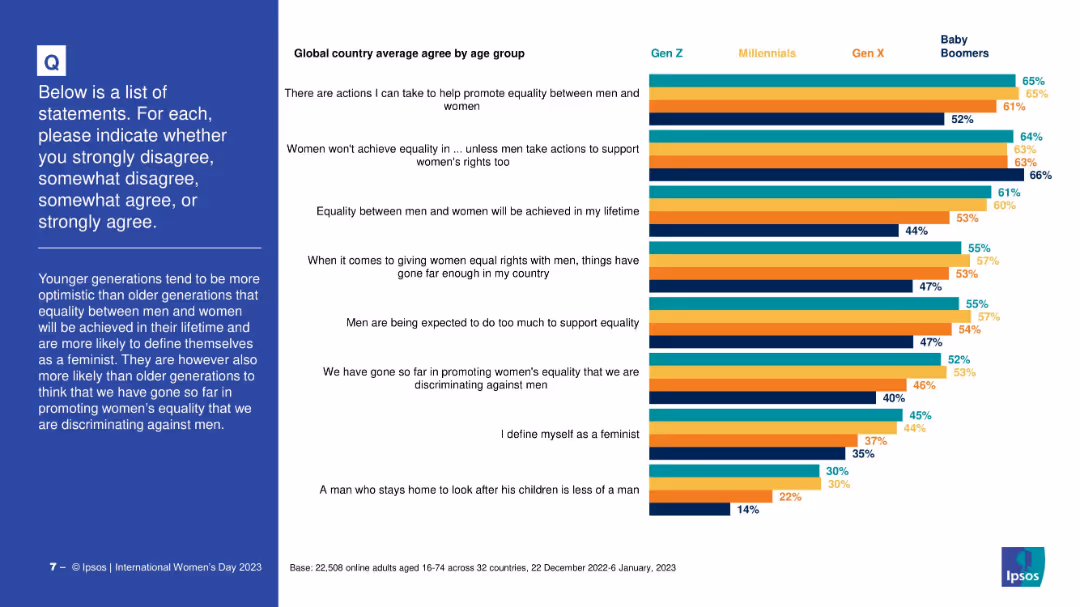
Horizontal grouped bar chart by age group (Gen Z to Boomers) for each statement; color-coded by generation.
Human Resources and Talent Management
Government & Public Sector
Compares views on gender equality by generation, showing that younger people are more optimistic about future equality and more likely to identify as feminists.
generational views, gender equality, feminism, age analysis, social attitudes, intergenerational comparison, Ipsos
false
Human Resources and Talent Management
Government & Public Sector
Mixed Chart
IPSOS
Add to my slides
Remove from favorites
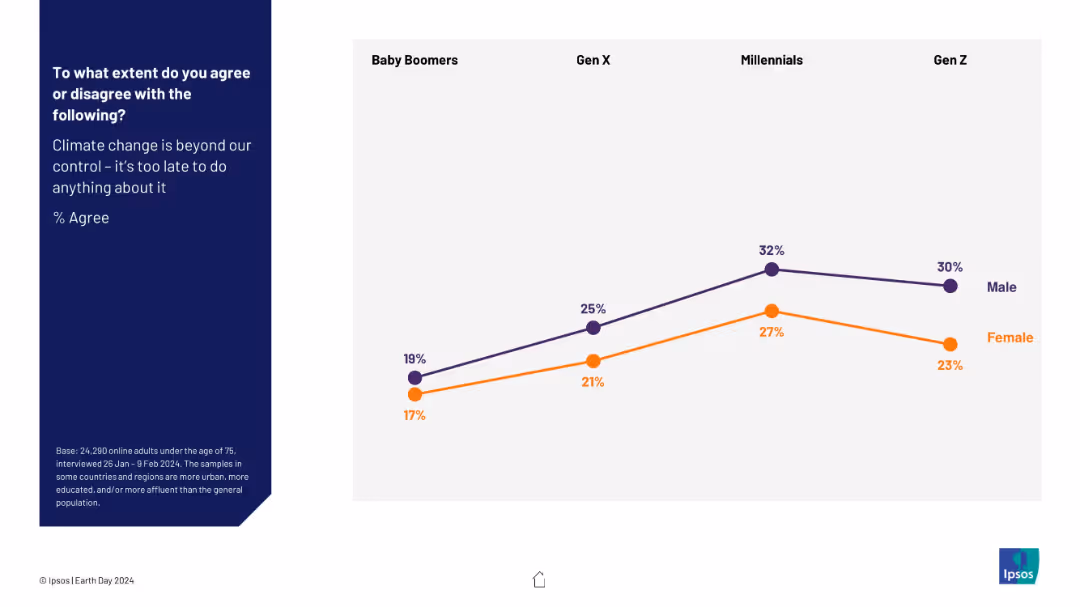
Line chart by generation and gender. Purple (male) and orange (female) lines across four generational cohorts.
Risk Assessment and Management
Environmental Services & Sustainability
A generational and gender-based perspective on belief in climate inevitability. Agreement increases with younger generations, especially among males.
generational views, gender gap, climate despair, youth perception, Ipsos, fatalism, environment psychology
false
Risk Assessment and Management
Environmental Services & Sustainability
Mixed Chart
IPSOS
Add to my slides
Remove from favorites
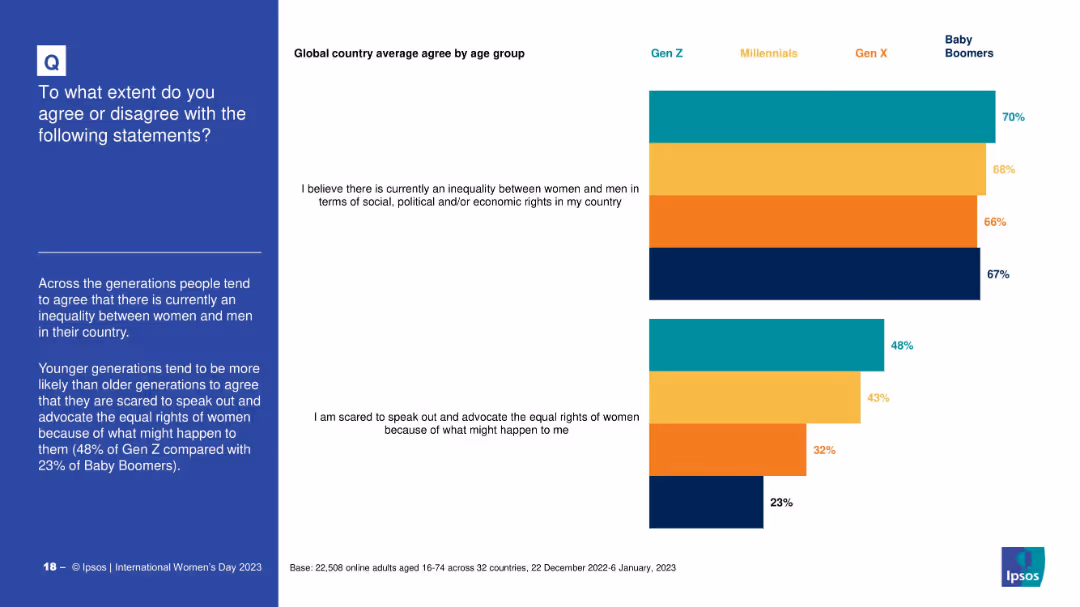
Horizontal bar charts segmented by age group; uses color-coded bars to show generational differences; clean, contrasting palette
Customer and Market Segmentation
Professional Services
The slide explores generational differences in belief in gender inequality and fear of speaking up. Gen Z is shown to be most likely to agree with both statements, while Baby Boomers are the least likely.
generational views, Gen Z, Baby Boomers, advocacy, fear, gender gap, opinions, age comparison
false
Customer and Market Segmentation
Professional Services
Mixed Chart
IPSOS
Add to my slides
Remove from favorites
Features a line chart and a large, detailed column chart comparing generational focus of wealth firms currently and predictions for the next three years across different sectors. The design is data-intensive yet clearly structured for easy interpretation.
Market Analysis and Trends
Financial Services
Analyzes the anticipated wealth transfer across generations and its impact on investment strategies, with a focus on how firms plan to adapt to these demographic shifts.
generational wealth, investment focus, wealth transfer, demographic shifts, financial strategy
false
Market Analysis and Trends
Financial Services
Multiple Chart
Deloitte
Add to my slides
Remove from favorites
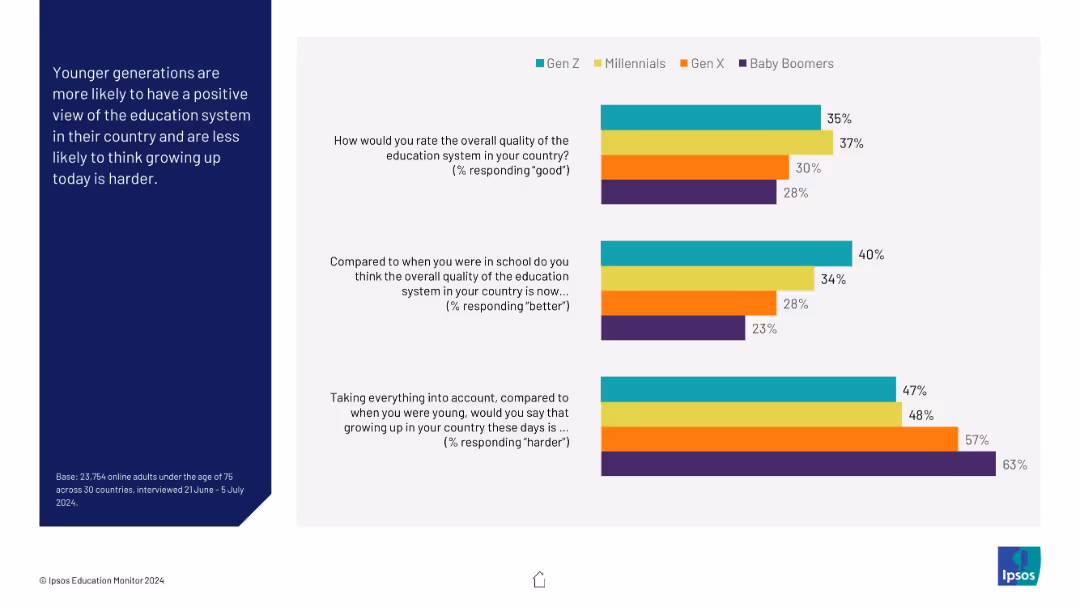
Bar charts showing Gen Z, Millennials, Gen X, and Baby Boomers’ views on education system quality, improvement over time, and whether growing up is harder now.
Customer and Market Segmentation
Education & Training
This generational analysis reveals that younger generations have a more favorable view of education and are less likely to believe growing up today is harder, while older generations report greater concern and skepticism toward modern challenges.
generation gap, education quality, growing up, Ipsos, Baby Boomers, Gen Z, perception
false
Customer and Market Segmentation
Education & Training
Mixed Chart
IPSOS
Add to my slides
Remove from favorites
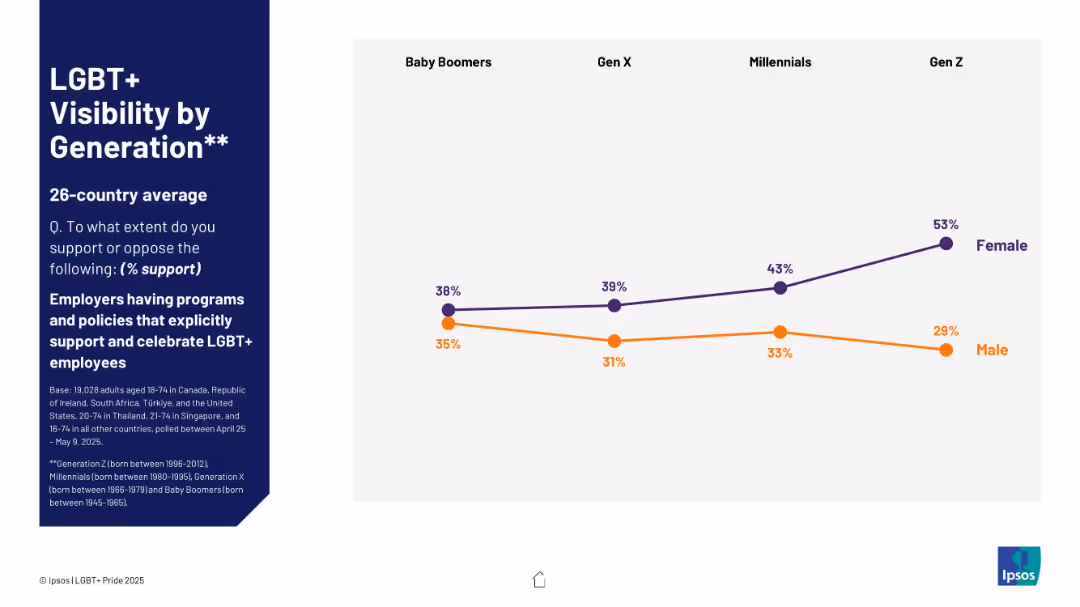
Dual-line chart with female/male generational support; left panel with dark blue background and context.
Market Analysis and Trends
Government & Public Sector
Generational support for LGBT+ employee policies shows increasing support among women across generations, especially Gen Z. Male support remains relatively flat or declining.
generation, LGBT+, workplace, employee support, gender trends, equality
false
Market Analysis and Trends
Government & Public Sector
Mixed Chart
IPSOS
Add to my slides
Remove from favorites
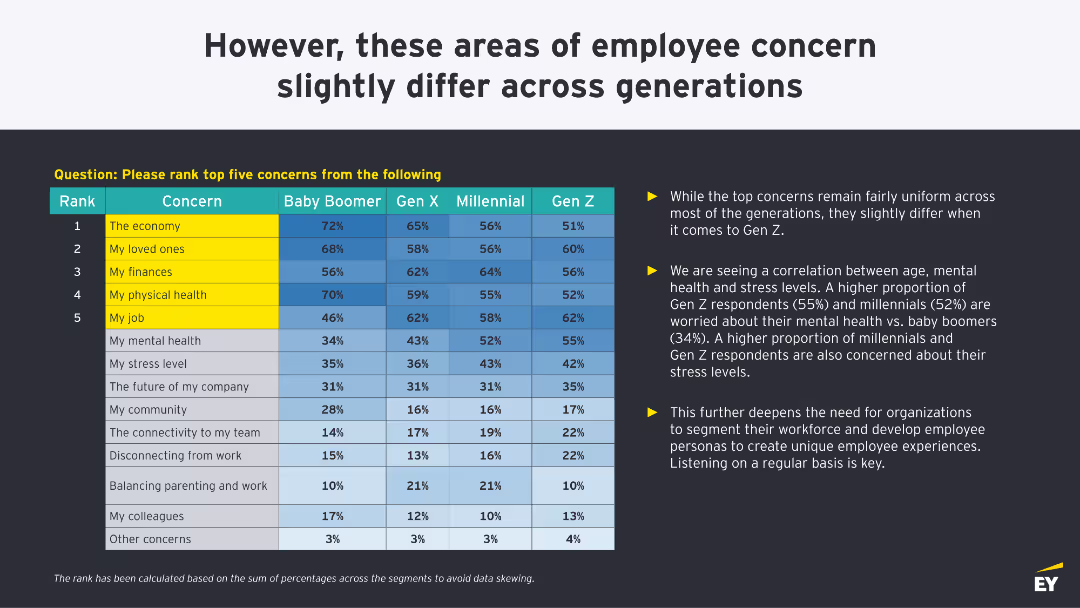
The slide features a table ranking employee concerns by generation, along with bullet points highlighting the differences and correlations between generations.
Human Resources and Talent Management
Professional Services
The slide analyzes the concerns of employees from different generations, showing how priorities like mental health and stress levels vary across age groups, highlighting the need for tailored approaches.
generations, employee, concerns, analysis, differences
false
Human Resources and Talent Management
Professional Services
Table
EY
Add to my slides
Remove from favorites
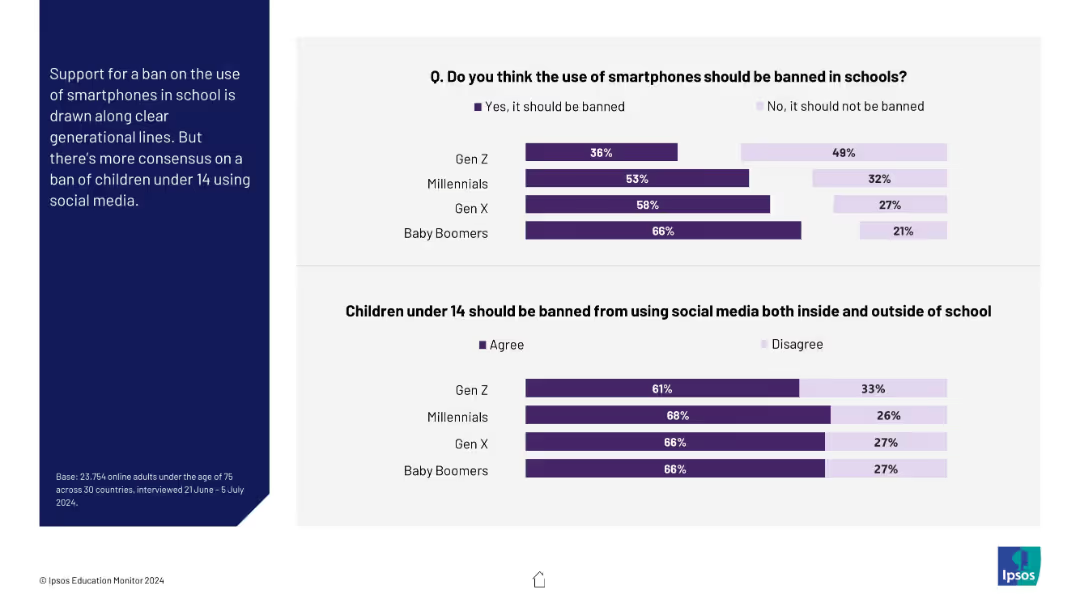
Two horizontal bar charts comparing generational views on smartphone bans and under-14 social media bans
Market Analysis and Trends
Education & Training
This slide examines generational differences in support for banning smartphones in school and children under 14 from using social media. Older generations (especially Boomers) are more supportive of restrictions.
generations, Gen Z, Baby Boomers, smartphone ban, social media, children, education
false
Market Analysis and Trends
Education & Training
Mixed Chart
IPSOS
Add to my slides
Remove from favorites
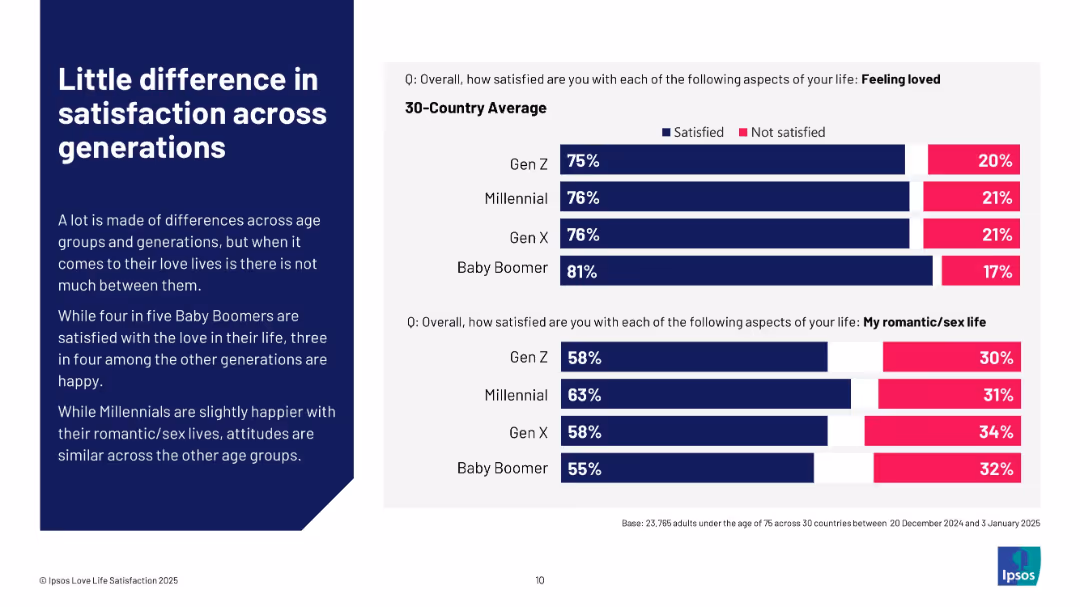
Similar layout to 19471: left with text summary, right with two bar charts comparing generations
Market Analysis and Trends
Media & Entertainment
The slide illustrates minimal generational differences in satisfaction with love and romantic lives. Baby Boomers are slightly more satisfied in love; Millennials lead slightly in romantic/sex life satisfaction.
generations, Gen Z, Millennials, Boomers, sex life, satisfaction, survey, bar chart, age
false
Market Analysis and Trends
Media & Entertainment
Mixed Chart
IPSOS
Add to my slides
Remove from favorites
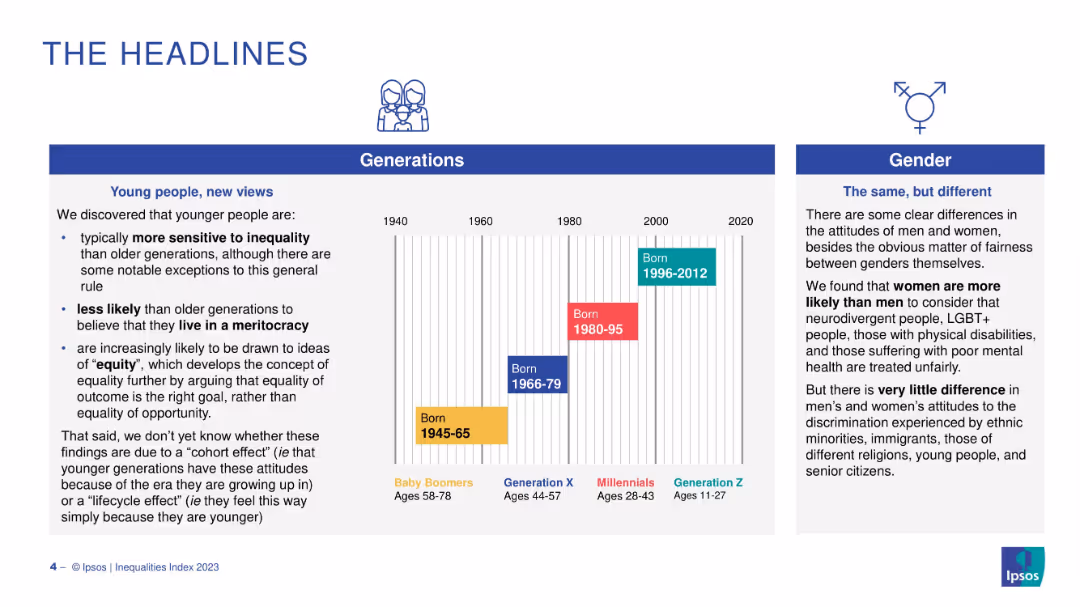
Three-column layout with icons, text blocks on generations and gender differences. Color-coded generation bands chart.
Strategic Planning
Government & Public Sector
The slide explains shifts in societal attitudes across generations and between genders, noting Gen Z's greater sensitivity to inequality and interest in equity over meritocracy, as well as gender-based perception gaps.
generations, inequality, meritocracy, equity, gender, cohort effect
false
Strategic Planning
Government & Public Sector
Mixed Chart
IPSOS
Add to my slides
Remove from favorites
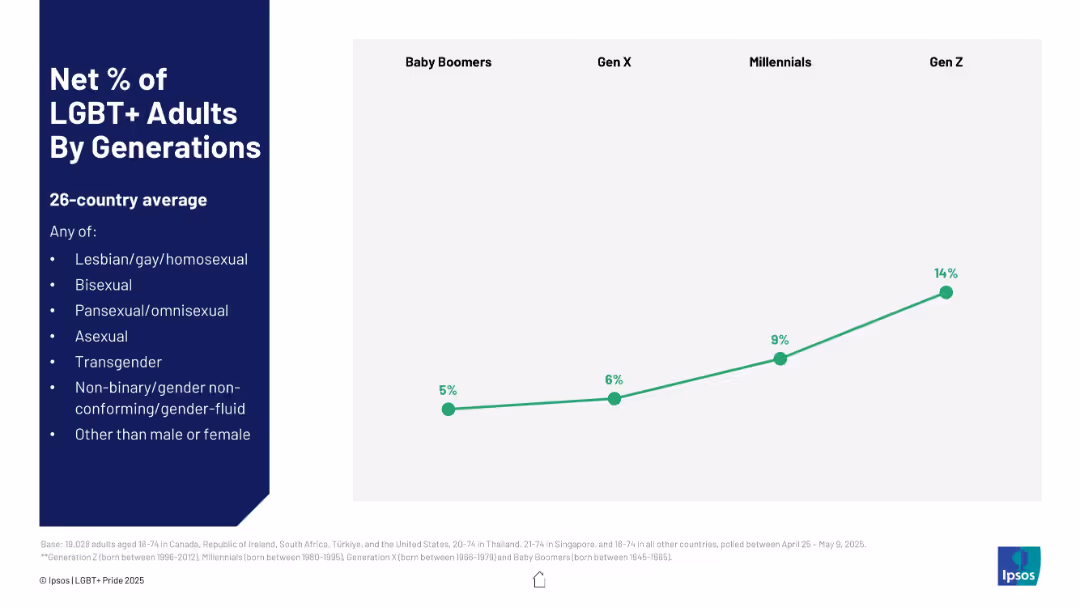
Line chart with four data points (Baby Boomers to Gen Z); left-aligned title and legend.
Market Analysis and Trends
Government & Public Sector
The graph shows a generational trend in LGBT+ self-identification, with Gen Z reaching 14%, a sharp increase from 5% for Baby Boomers, indicating a shift in openness or identity recognition over generations.
generations, LGBT+, Gen Z, social trends, demographics, identity
false
Market Analysis and Trends
Government & Public Sector
Mixed Chart
IPSOS
Add to my slides
Remove from favorites
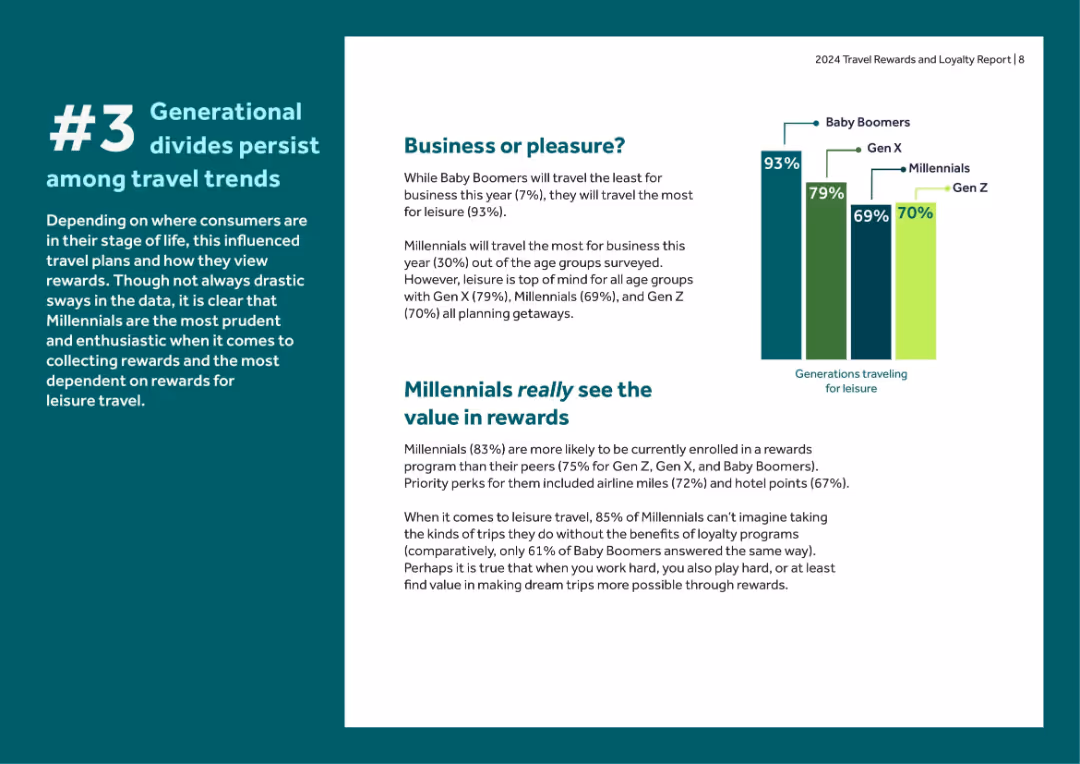
Green and white color block layout with charts and segmented text. Emphasizes generational travel habits and reward usage.
Customer and Market Segmentation
Financial Services
Analyzes how different generations use and value travel rewards—highlighting Millennials' strong reward dependence and Baby Boomers' preference for leisure travel over business.
generations, Millennials, Baby Boomers, Gen Z, travel rewards, leisure, business travel, loyalty enrollment
false
Customer and Market Segmentation
Financial Services
Mixed Chart
Barclays
Add to my slides
Remove from favorites
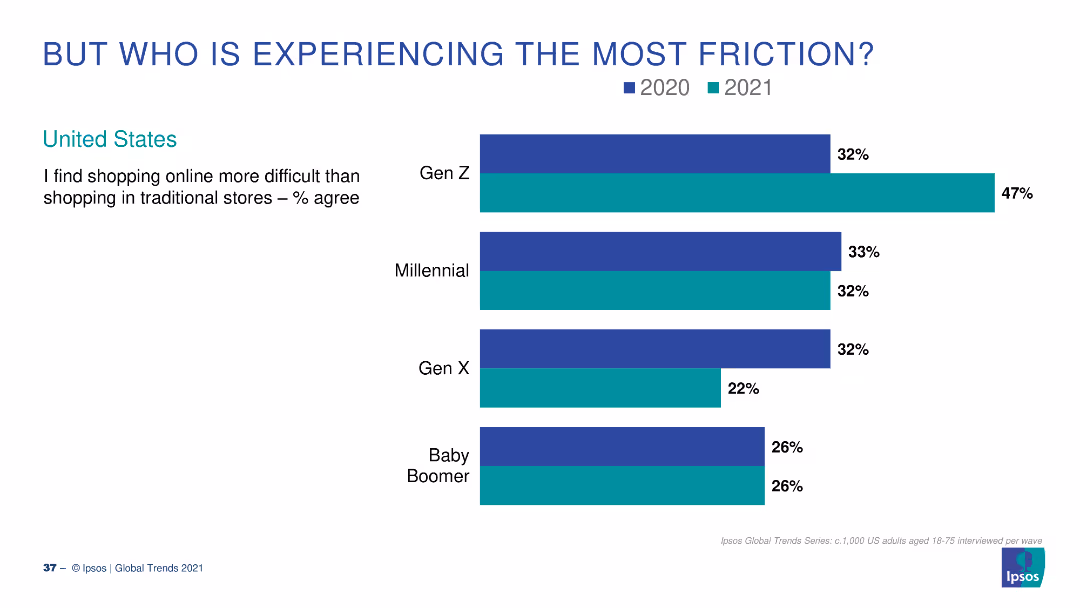
A column chart showing percentages of different generational groups in the US who find online shopping more difficult than traditional shopping for the years 2020 and 2021.
Market Analysis and Trends
Retail & E-commerce
This slide compares the percentage of various generational groups in the US who found online shopping more difficult in 2020 and 2021, focusing on Gen Z, Millennials, Gen X, and Baby Boomers.
generations, online shopping, friction, US, survey
false
Market Analysis and Trends
Retail & E-commerce
Single Chart
IPSOS
Add to my slides
Remove from favorites
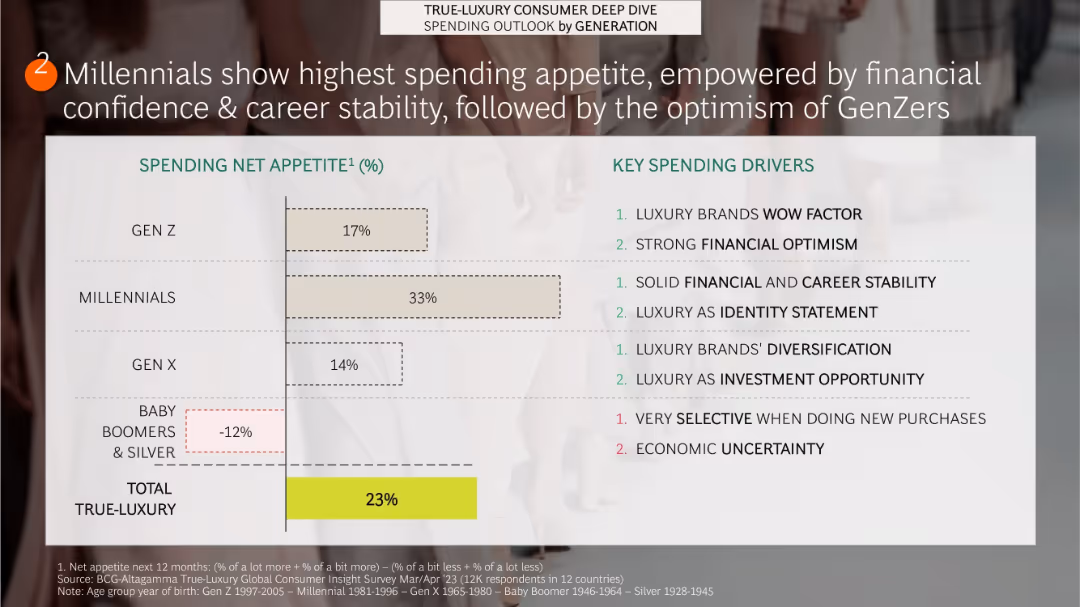
Split layout with left side bar chart showing spending appetite by generation and right side listing key spending drivers by cohort
Customer and Market Segmentation
Consumer Goods
Millennials show the highest net appetite for luxury spending (33%), attributed to financial and career stability. Gen Z (17%) follows due to optimism and luxury's wow factor. Older generations like Baby Boomers and Silvers have a negative net appetite, citing economic uncertainty.
generations, spending appetite, Millennials, Gen Z, Baby Boomers, financial optimism, identity, luxury market
false
Customer and Market Segmentation
Consumer Goods
Single Chart
BCG
Add to my slides
Remove from favorites
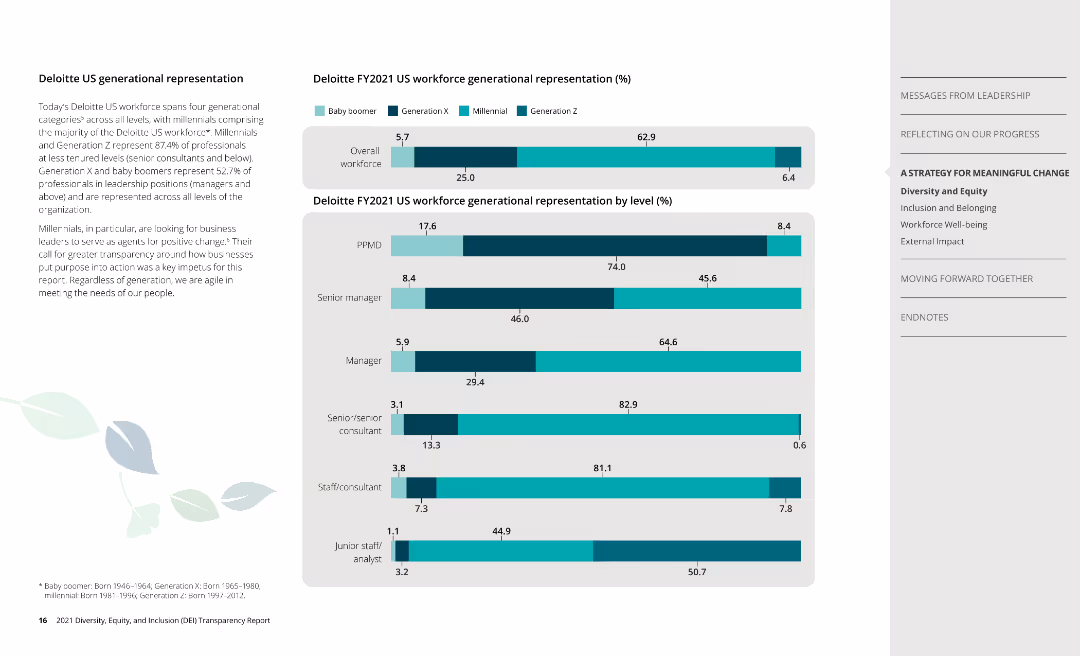
Column charts display generational representation across overall workforce and by job level at Deloitte.
Human Resources and Talent Management
Professional Services
Highlights generational diversity at Deloitte, breaking down representation across different age groups.
generation, workforce, diversity, Deloitte
false
Human Resources and Talent Management
Professional Services
Multiple Chart
Deloitte
Add to my slides
Remove from favorites
Left side has a pie chart showing generative AI adoption, right side has multiple bubbles and text
Technology and Digital Transformation
Technology & Software
Analysis of generative AI adoption in IT with top use cases like data analysis and marketing highlighted
Generative AI, adoption, IT, data analysis, marketing
false
Technology and Digital Transformation
Technology & Software
Multiple Chart
Gartner
Add to my slides
Remove from favorites
The slide includes multiple circular charts depicting percentages related to challenges faced by D&A leaders with AI-generated synthetic data and a triangular chart showing barriers among sales leaders.
Risk Assessment and Management
Technology & Software
This slide discusses the challenges of AI adoption for D&A and sales leaders, focusing on data accuracy, integration, and availability of data.
Generative AI, Barriers, D&A Leaders, Data Accuracy, Sales
false
Risk Assessment and Management
Technology & Software
Multiple Chart
Gartner
Add to my slides
Remove from favorites
The slide features text and percentage data, along with a column chart with horizontal bars showing the adoption barriers for marketing and supply chain leaders.
Risk Assessment and Management
Technology & Software
The slide outlines the barriers to adopting Generative AI for marketing and supply chain leaders, including skills gaps, technology integration, and security threats.
Generative AI, Barriers, Marketing Leaders, Supply Chain, Security
false
Risk Assessment and Management
Technology & Software
Mixed Chart
Gartner
Add to my slides
Remove from favorites
The slide contains text, percentage data, and a column chart with horizontal bars showing percentages related to risks and challenges faced by IT & InfoSec leaders and software engineering leaders.
Risk Assessment and Management
Technology & Software
The slide highlights the top risks and challenges in adopting Generative AI according to IT, InfoSec, and Software Engineering leaders. It includes statistics on security, bias, and leadership issues.
Generative AI, Barriers, Risks, IT Leaders, Security
false
Risk Assessment and Management
Technology & Software
Mixed Chart
Gartner
Add to my slides
Remove from favorites
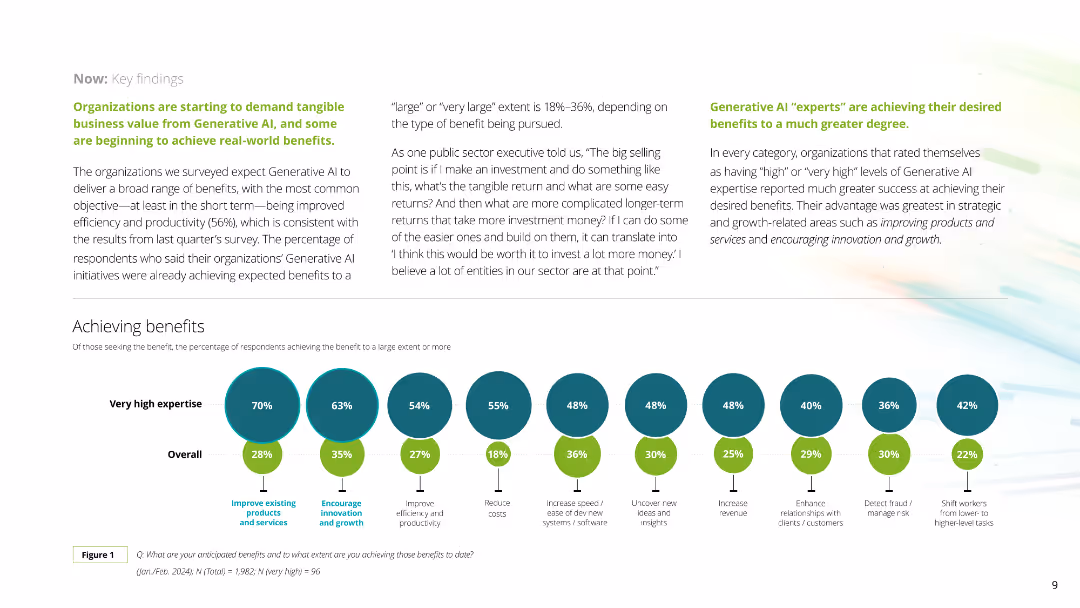
This slide includes a series of circular diagrams showing percentages of benefits achieved by companies with varying levels of expertise in Generative AI. The layout is clean with distinct colors for each expertise level.
Technology and Digital Transformation
Technology & Software
The slide details the benefits companies are achieving from Generative AI, such as improved products and services, innovation, productivity, cost reduction, and new revenue streams, categorized by expertise levels.
Generative AI, benefits, expertise, improvement, productivity
false
Technology and Digital Transformation
Technology & Software
Mixed Chart
Deloitte
Add to my slides
Remove from favorites
The slide contains text, percentage data, and circular charts showing expected benefits of Generative AI for IT & InfoSec leaders and realized benefits for D&A leaders.
Strategic Planning
Technology & Software
This slide highlights the benefits of Generative AI as seen by IT & InfoSec leaders and D&A leaders, including financial performance, model accuracy, and data privacy.
Generative AI, Benefits, IT Leaders, Financial Performance, D&A Leaders
false
Strategic Planning
Technology & Software
Mixed Chart
Gartner
Add to my slides
Remove from favorites
The slide features text and percentage data, along with a column chart showing the potential for replacing personnel and a triangular chart depicting benefits for marketing leaders.
Strategic Planning
Technology & Software
This slide discusses the perceived benefits of Generative AI for sales and marketing leaders, focusing on productivity, ROI, and speed to market.
Generative AI, Benefits, Sales Leaders, Marketing Leaders, Productivity
false
Strategic Planning
Technology & Software
Mixed Chart
Gartner
Add to my slides
Remove from favorites
The slide includes text and percentage data, along with a column chart with horizontal bars showing the positive impact of Generative AI on software engineering and supply chain leaders.
Strategic Planning
Technology & Software
This slide presents the expected positive impacts of Generative AI on software engineering and supply chain leaders, such as improved agility, productivity, and cybersecurity.
Generative AI, Benefits, Software Engineering, Supply Chain, Productivity
false
Strategic Planning
Technology & Software
Mixed Chart
Gartner
Add to my slides
Remove from favorites
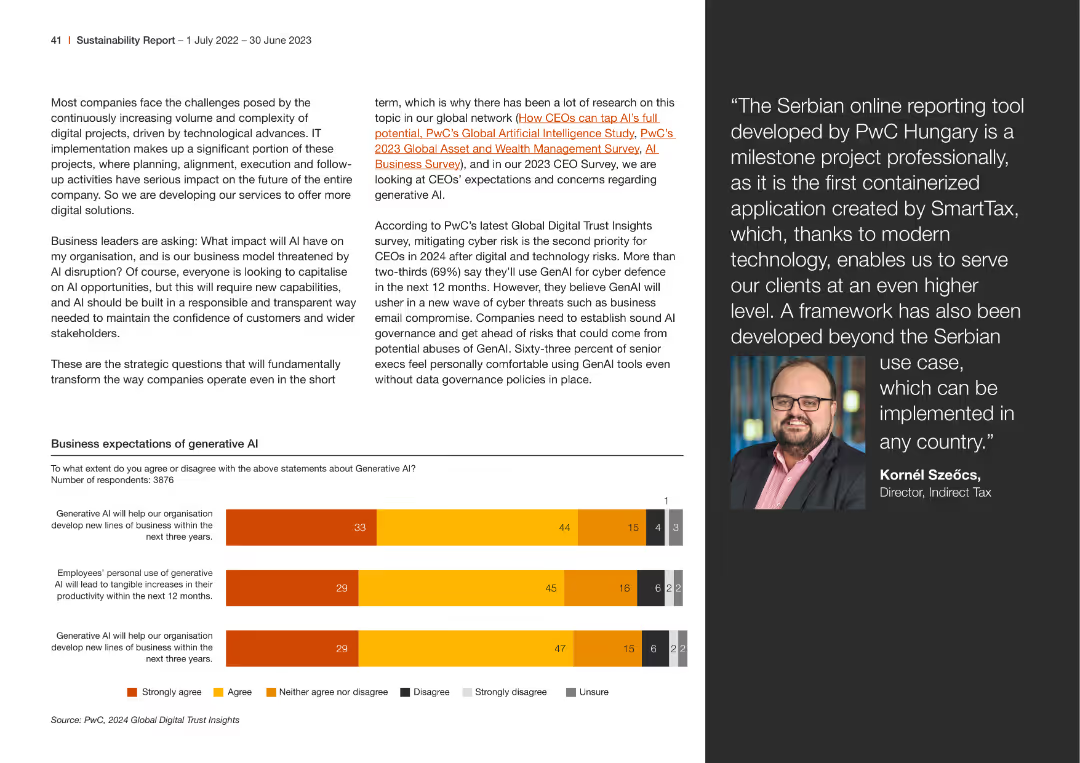
Bar charts showing business leaders' responses on generative AI's impact on new business lines and productivity
Technology and Digital Transformation
Technology & Software
This slide presents survey results on business leaders' expectations of generative AI, highlighting its perceived impact on developing new business lines and increasing productivity, with a focus on mitigating cyber risks
generative AI, business impact, survey results, productivity, new business lines
false
Technology and Digital Transformation
Technology & Software
Mixed Chart
PwC/Strategy&
Add to my slides
Remove from favorites
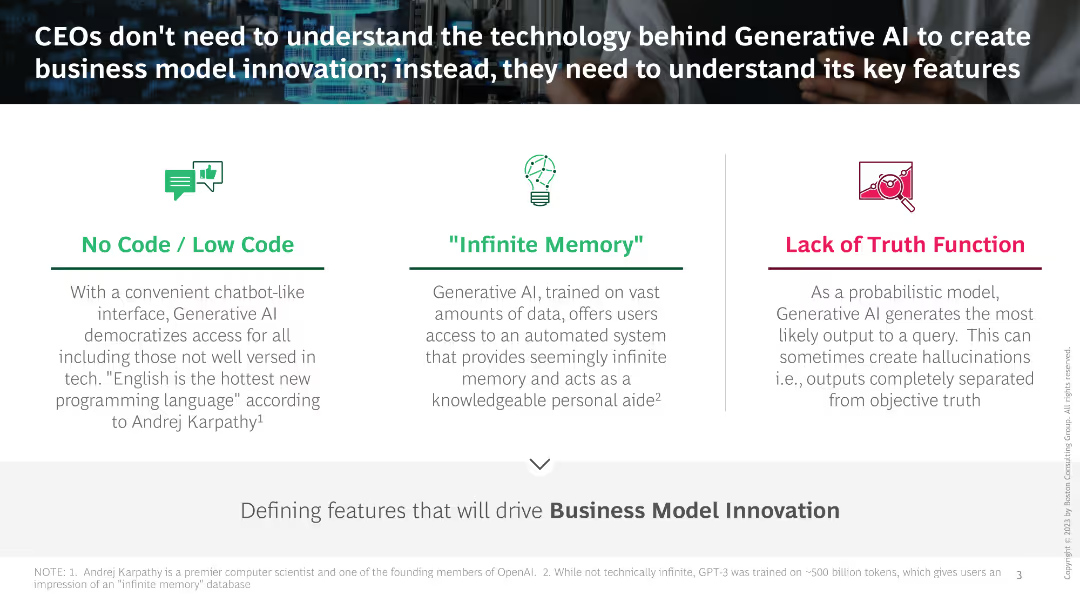
Three sections describing features of Generative AI: No Code / Low Code, "Infinite Memory", Lack of Truth Function, with icons and brief descriptions.
Technology and Digital Transformation
Technology & Software
The slide explains key features of Generative AI relevant for business model innovation, highlighting accessibility, extensive memory, and probabilistic output.
Generative AI, Business model, No code, Infinite memory, Truth function
false
Technology and Digital Transformation
Technology & Software
Pillar
BCG
Add to my slides
Remove from favorites
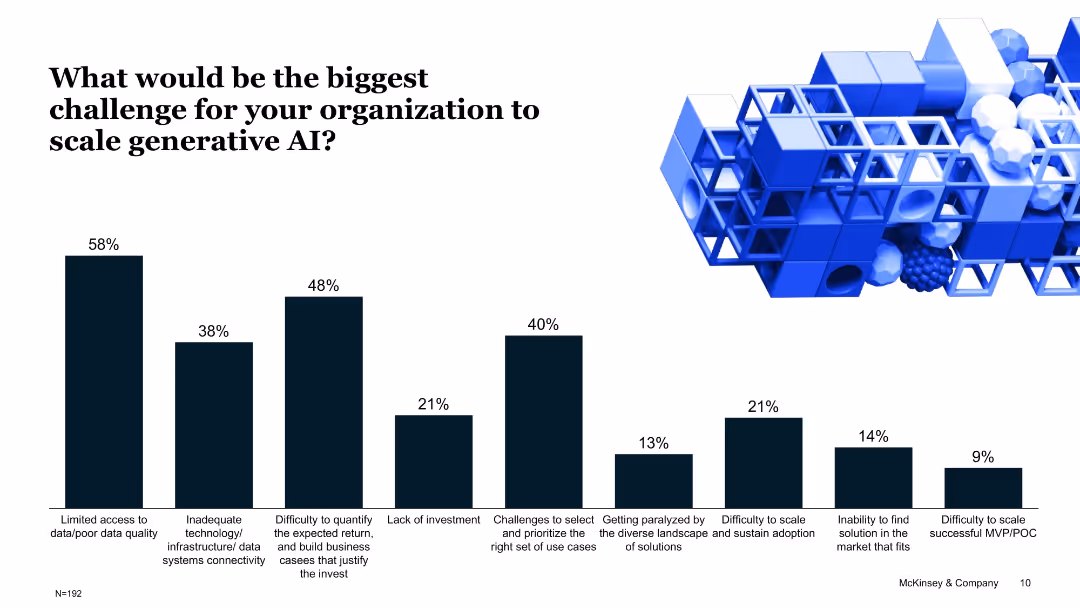
Bar chart with percentages showing top challenges to scaling Gen AI; structured list of barriers with iconography.
Risk Assessment and Management
Artificial Intelligence
This slide captures survey results from organizations identifying key challenges in Gen AI adoption, such as data quality, technology infrastructure, and difficulty quantifying ROI, which hinder successful scaling.
generative AI, challenges, data quality, infrastructure, ROI, investment, scaling
false
Risk Assessment and Management
Artificial Intelligence
Single Chart
McKinsey
Add to my slides
Remove from favorites
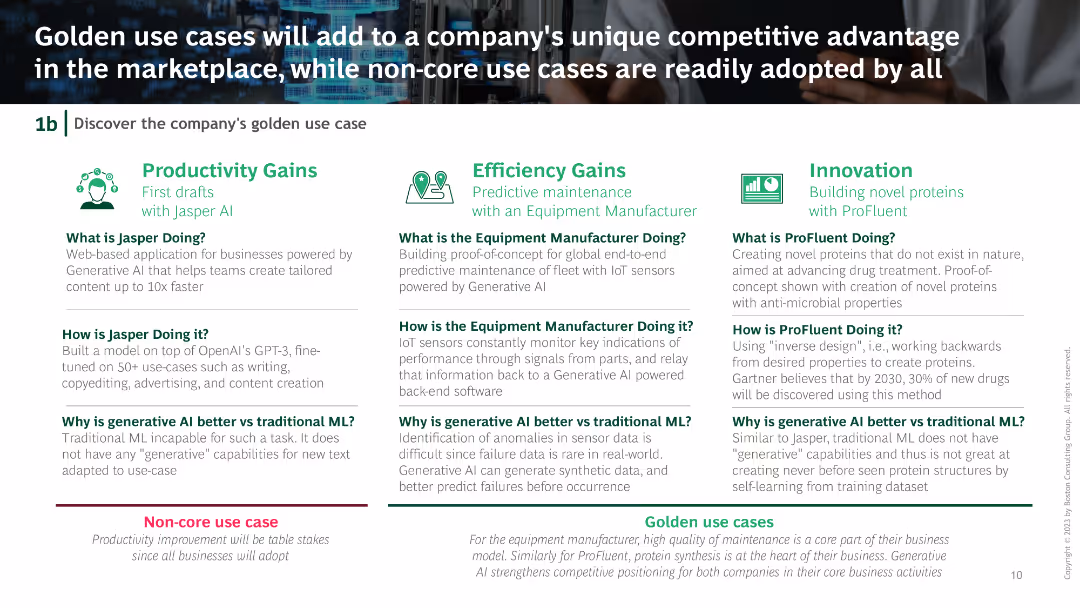
Side-by-side comparison of core and non-core use cases for Generative AI, with detailed examples under Productivity Gains, Efficiency Gains, and Innovation.
Strategic Planning
Technology & Software
The slide discusses strategic use cases of Generative AI that can provide a competitive advantage, compared to general use cases adopted by all businesses.
Generative AI, Competitive advantage, Use cases, Productivity, Efficiency
false
Strategic Planning
Technology & Software
Pillar
BCG
Add to my slides
Remove from favorites
Contains a large pie chart and three smaller ones, showing percentages of people aware of Generative AI, with demographic breakdowns (gender, income, age). Text blocks provide contextual data.
Industry Overview
Technology & Software
This slide presents data on consumer awareness of Generative AI, highlighting demographic disparities in familiarity with such technologies.
Generative AI, consumer awareness, demographic analysis, technology trends, market research
false
Industry Overview
Technology & Software
Multiple Chart
Deloitte
Add to my slides
Remove from favorites
Includes column charts comparing opinions between those aware of and those who have used Generative AI, focusing on perceptions of accuracy and bias.
Market Analysis and Trends
Technology & Software
Analyzes consumer perceptions of Generative AI's accuracy and bias, revealing a significant divide in understanding its flaws.
Generative AI, consumer perceptions, accuracy, bias, technology understanding
false
Market Analysis and Trends
Technology & Software
Multiple Chart
Deloitte
Add to my slides
Remove from favorites
Dark background with infographic layout; pie charts, icons, and segmented boxes on AI use, types, concerns, and investment trends.
Technology and Digital Transformation
Financial Services
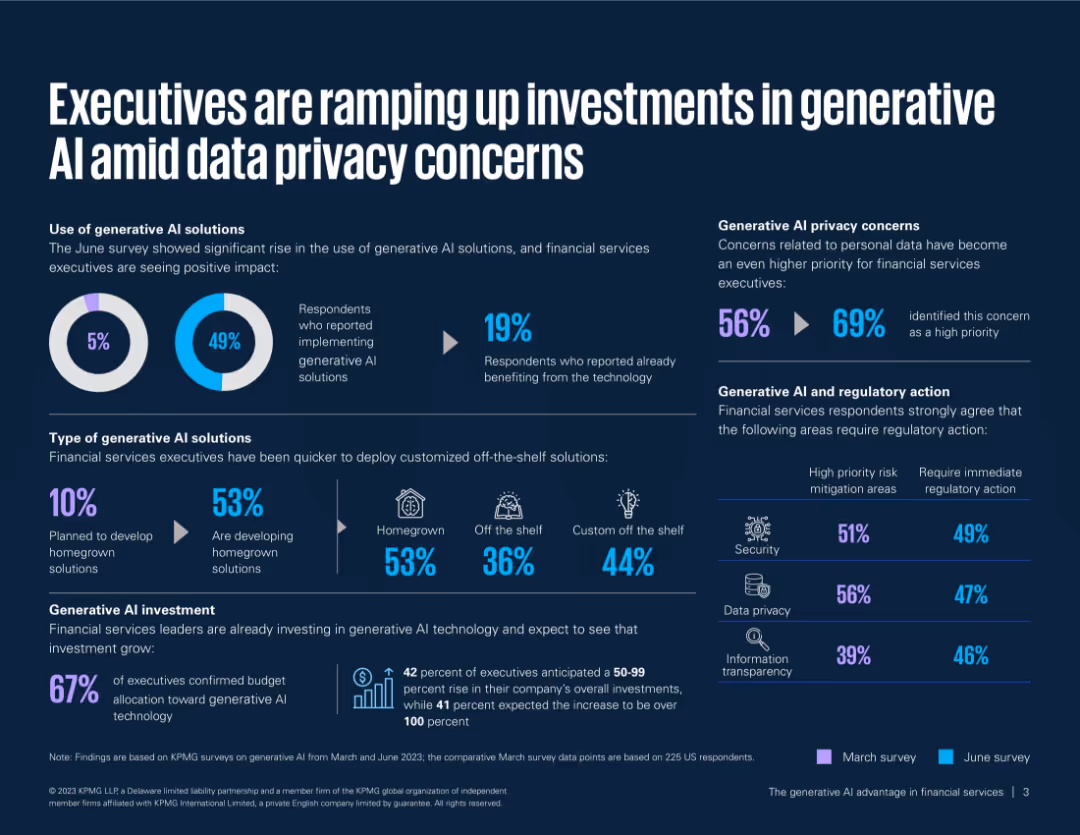
Highlights trends in generative AI use in financial services, including high investment growth, privacy concerns, and types of solutions (homegrown/off-the-shelf). It also presents regulatory concerns and expected ROI impacts.
generative AI, data privacy, investment, homegrown solutions, regulatory action, financial sector
false
Technology and Digital Transformation
Financial Services
Mixed Chart
KPMG
Add to my slides
Remove from favorites
A layout with two bubble charts, each showing the benefits organizations hope to gain from generative AI, with text explanation on the left.
Market Analysis and Trends
Technology & Software
It explores the tactical and strategic benefits organizations seek from generative AI, focusing on efficiency, productivity, cost reduction, innovation, and growth.
Generative AI, Efficiency, Growth, Strategy, Benefits
false
Market Analysis and Trends
Technology & Software
Mixed Chart
Deloitte
Add to my slides
Remove from favorites
A balanced layout featuring a pie chart on the right about self-assessed generative AI expertise and a column of text on the left. Color scheme is green and white.
Market Analysis and Trends
Technology & Software
Slide shows confidence among leaders in their organizations' generative AI expertise, with a pie chart visualizing the levels of self-assessed expertise across surveyed respondents.
Generative AI, Expertise, Confidence, Survey
false
Market Analysis and Trends
Technology & Software
Mixed Chart
Deloitte
Add to my slides
Remove from favorites
The slide features a column chart on the left and a bar chart on the right. The column chart shows the percentage of firms across different financial sectors that believe they are well-equipped to implement GenAI. The bar chart on the right highlights concerns related to regulatory ambiguity and other issues.
Risk Assessment and Management
Financial Services
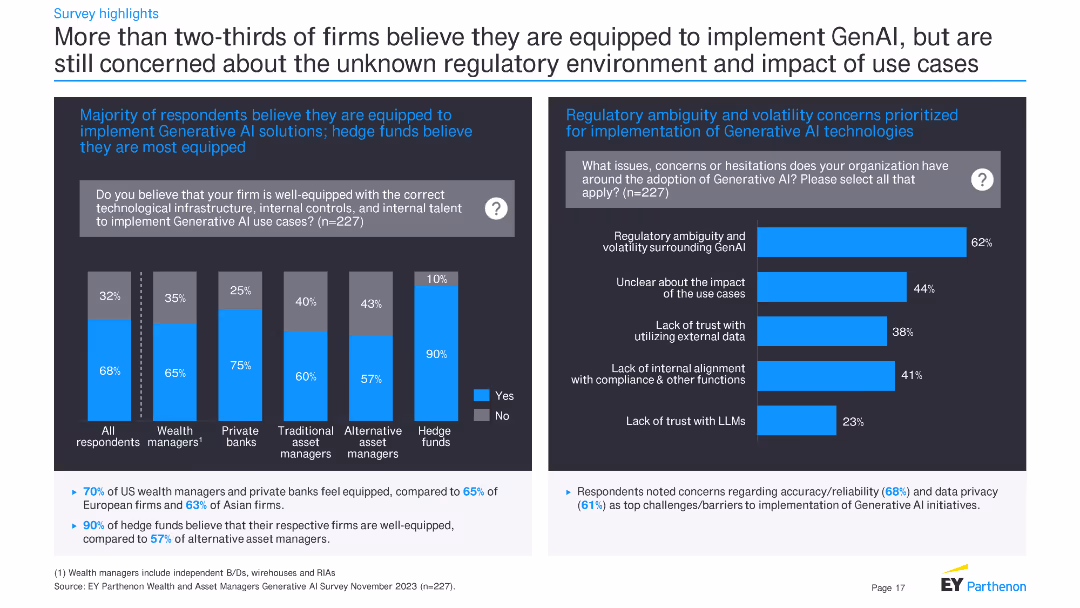
The slide indicates that more than two-thirds of firms believe they are equipped to implement Generative AI, with hedge funds being the most confident. It also highlights major concerns like regulatory ambiguity, impact of use cases, and lack of trust with external data.
Generative AI, financial firms, regulatory concerns, implementation, survey results, hedge funds, technological readiness, data trust
false
Risk Assessment and Management
Financial Services
Multiple Chart
EY
Add to my slides
Remove from favorites
The slide is divided into two parts: a column chart on the left and a list of barriers on the right. The column chart shows responses from different types of financial firms on their plans to establish a GenAI team, with the x-axis representing firm types and the y-axis showing percentage values. The right side lists eight barriers to establishing these teams, formatted in a simple text list.
Strategic Planning
Financial Services
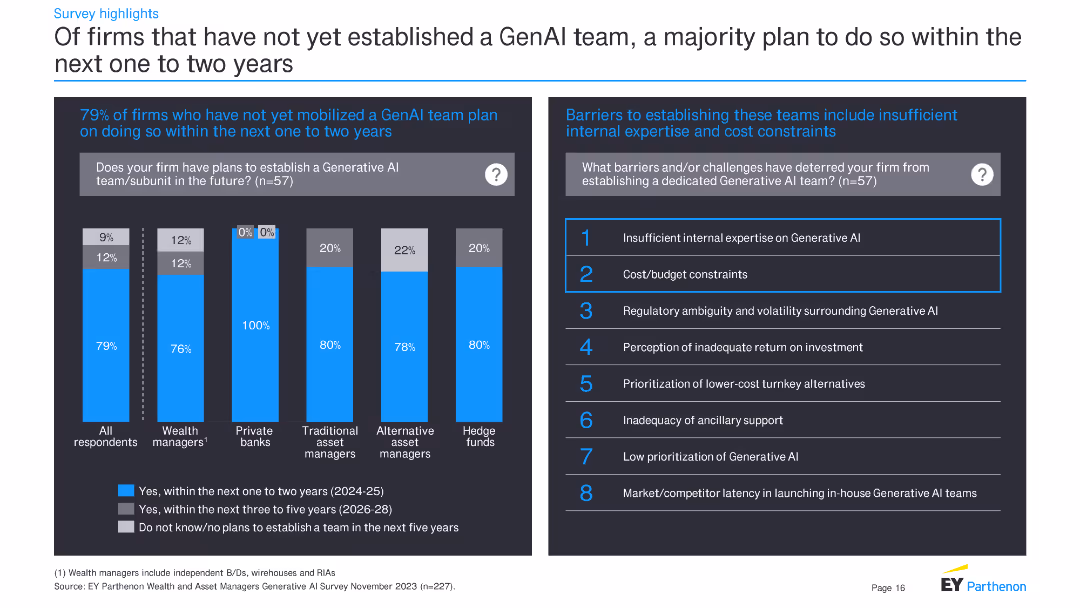
The slide presents survey results showing that 79% of firms plan to establish a GenAI team within the next one to two years. It also lists eight barriers preventing firms from establishing these teams, with insufficient internal expertise and cost constraints being the top reasons.
Generative AI, financial firms, survey results, barriers, expertise, cost constraints, future plans, team establishment
false
Strategic Planning
Financial Services
Mixed Chart
EY
Add to my slides
Remove from favorites
The slide includes a column chart showing enterprise head count changes segmented by expertise levels. The layout is clear with a mix of text and visual elements.
Human Resources and Talent Management
Professional Services
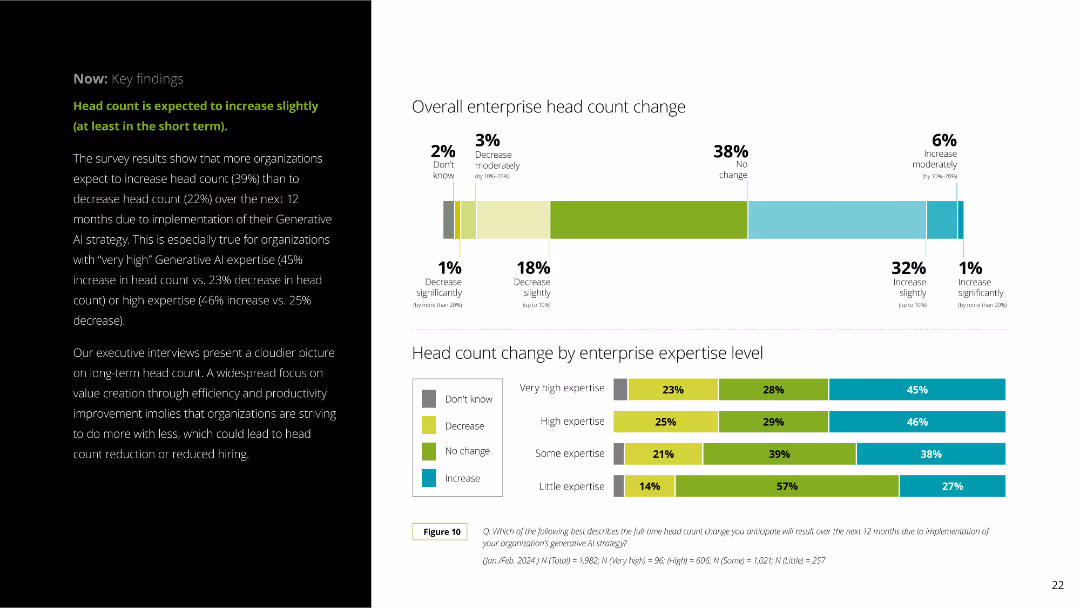
The slide explains anticipated changes in enterprise head count due to Generative AI, with survey results indicating slight increases. It breaks down the data by expertise level and provides detailed percentages.
Generative AI, head count, enterprise, survey results, expertise levels, workforce, HR, professional services, employee changes, AI impact
false
Human Resources and Talent Management
Professional Services
Multiple Chart
Deloitte
Add to my slides
Remove from favorites
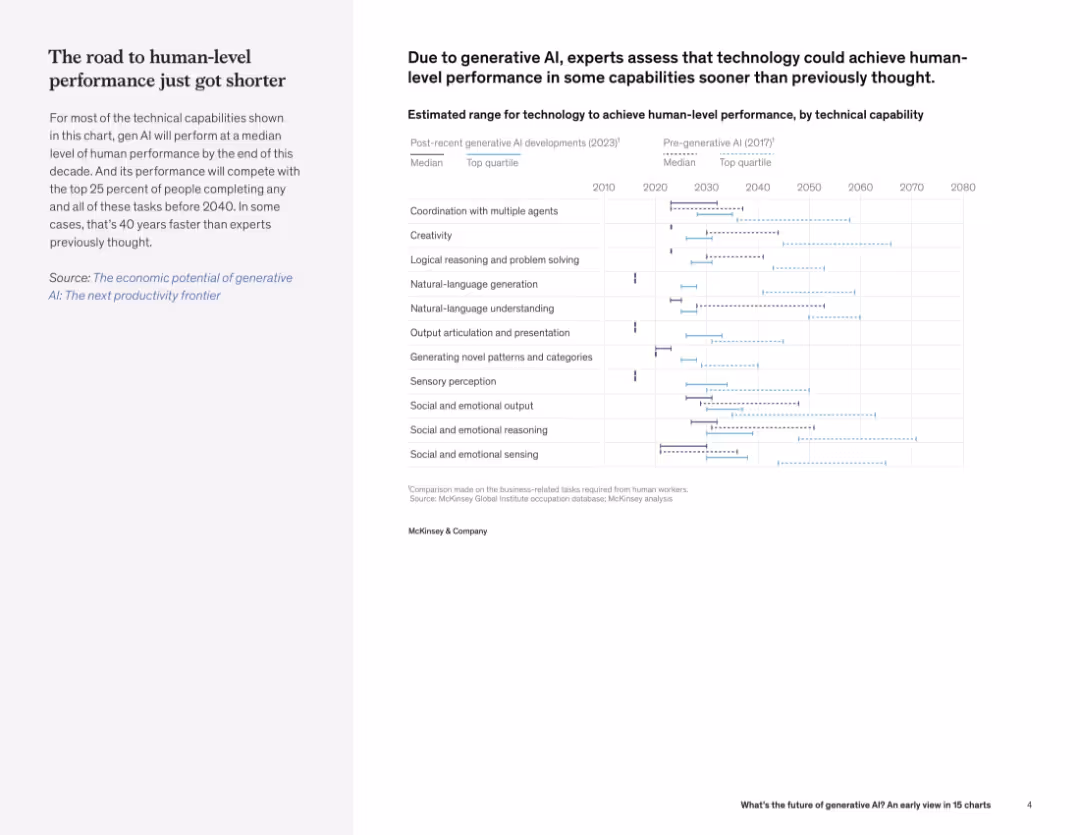
Horizontal timeline chart showing median and top quartile estimates for various AI capabilities pre- and post-2023; left panel interprets results.
Technology and Digital Transformation
Artificial Intelligence
This slide compares projections from 2017 and 2023 regarding when AI will achieve human-level performance in multiple capabilities. It highlights an accelerated timeline due to generative AI advancements.
generative AI, human-level performance, prediction, technical capability, productivity
false
Technology and Digital Transformation
Artificial Intelligence
Mixed Chart
McKinsey
Add to my slides
Remove from favorites
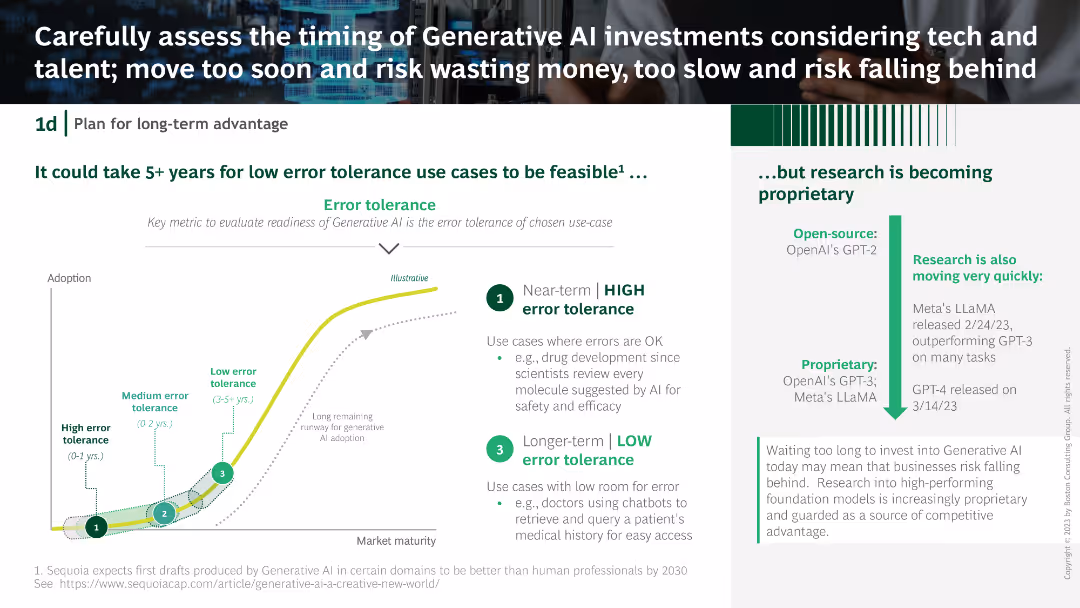
A column chart with error tolerance categories, a textual explanation on the right, and a descriptive flow chart at the bottom depicting AI adoption stages.
Strategic Planning
Technology & Software
The slide explains the error tolerance levels for generative AI use cases, emphasizing the timing for investments. It provides an analysis of short-term and long-term AI adoption strategies.
Generative AI, investment, error tolerance, AI adoption, strategic planning
false
Strategic Planning
Technology & Software
Mixed Chart
BCG
Add to my slides
Remove from favorites
Split layout with definitions side by side, green accent
Technology and Digital Transformation
Technology & Software
Defines Generative AI and LLMs and their applications
Generative AI, LLM, AI definition
false
Technology and Digital Transformation
Technology & Software
Header Horizontal
Deloitte
Add to my slides
Remove from favorites
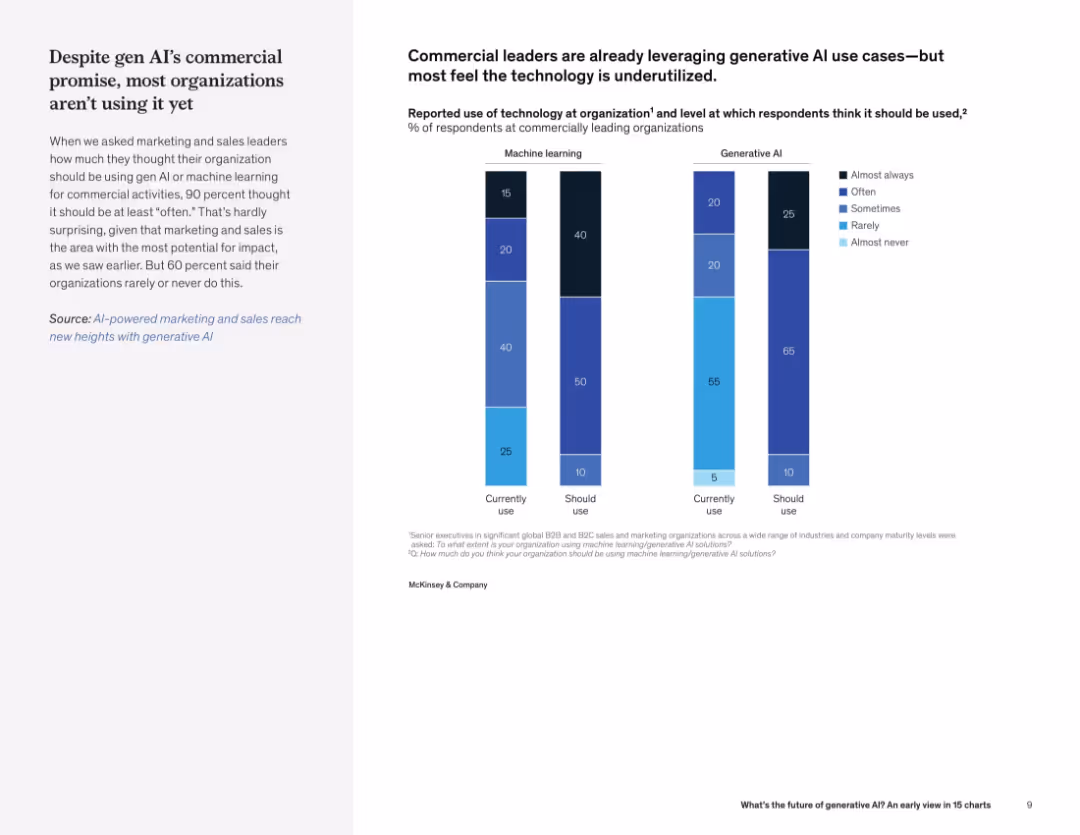
Two-column layout with text on the left and vertical bar charts comparing current vs. desired use of ML and generative AI on the right.
Technology and Digital Transformation
Artificial Intelligence
This slide compares the current vs. ideal use of ML and generative AI in commercial organizations. Although leaders believe AI should be used often, current adoption is much lower, particularly for generative AI.
generative AI, machine learning, adoption, underutilized, commercial leaders, usage gap, current use, expected use
false
Technology and Digital Transformation
Artificial Intelligence
Mixed Chart
McKinsey
Add to my slides
Remove from favorites
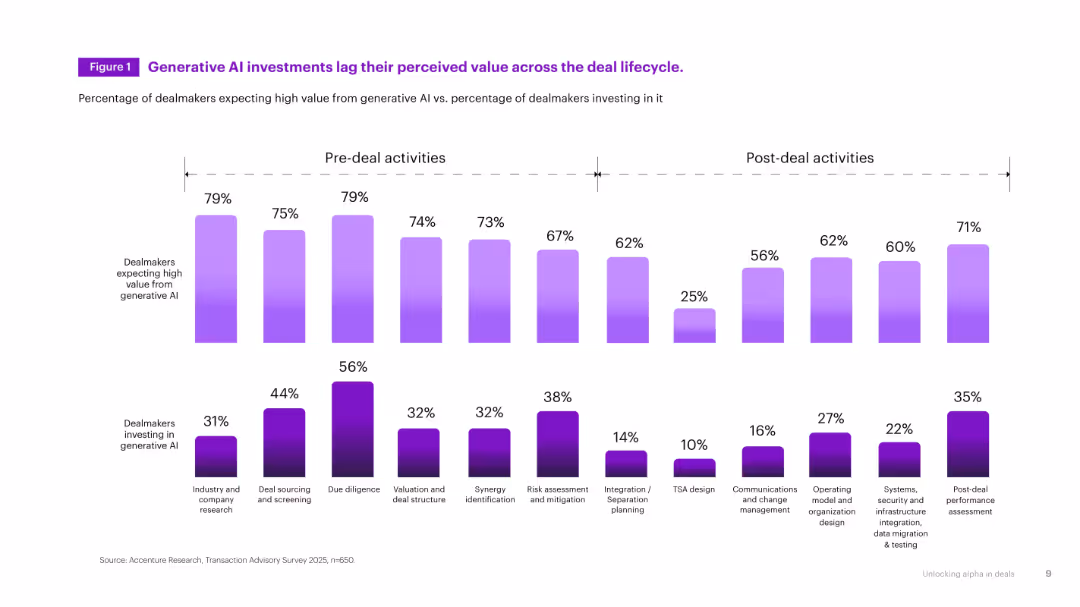
Dual-bar chart with vertical bars split between pre-deal and post-deal activities. Two rows of bars compare "expecting value" vs. "investing in AI." Purple gradient.
Technology and Digital Transformation
Artificial Intelligence
Highlights a significant gap between where dealmakers expect value from generative AI and where they are actually investing in it across the M&A lifecycle. Emphasizes pre- and post-deal stages.
generative AI, M&A, investment gap, pre-deal, post-deal, value, survey
false
Technology and Digital Transformation
Artificial Intelligence
Single Chart
Accenture
Add to my slides
Remove from favorites
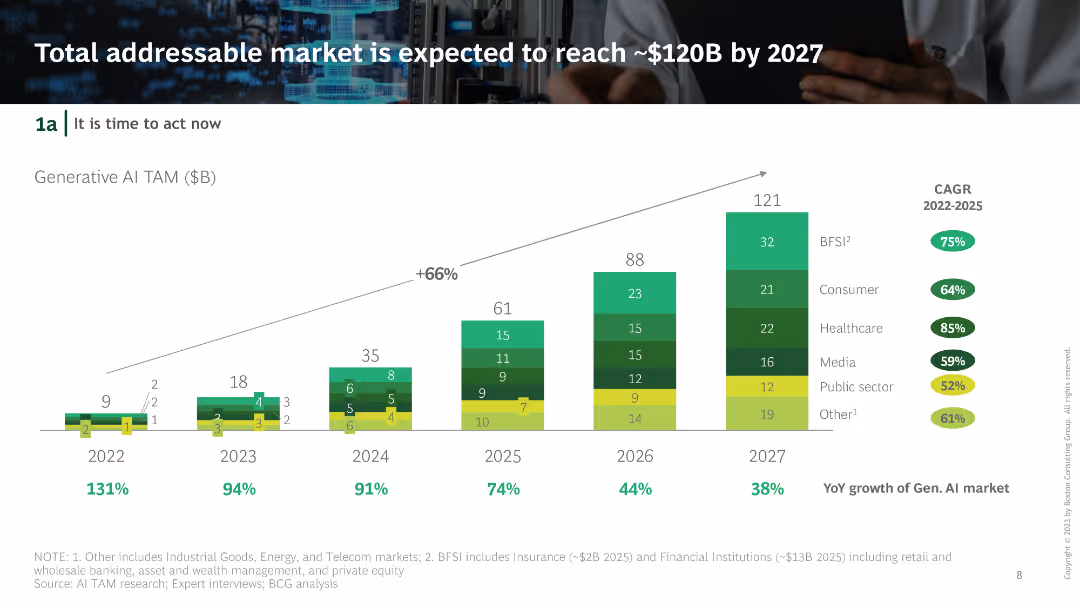
Column chart showing the projected growth of Generative AI TAM from 2022 to 2027. Includes segments like BFSI, Consumer, Healthcare, Media, Public sector.
Market Analysis and Trends
Financial Services
The slide forecasts the growth of the Generative AI market, with a breakdown of different industry segments contributing to the total addressable market.
Generative AI market, TAM, Growth projection, Industry segments, CAGR
false
Market Analysis and Trends
Financial Services
Single Chart
BCG
Add to my slides
Remove from favorites
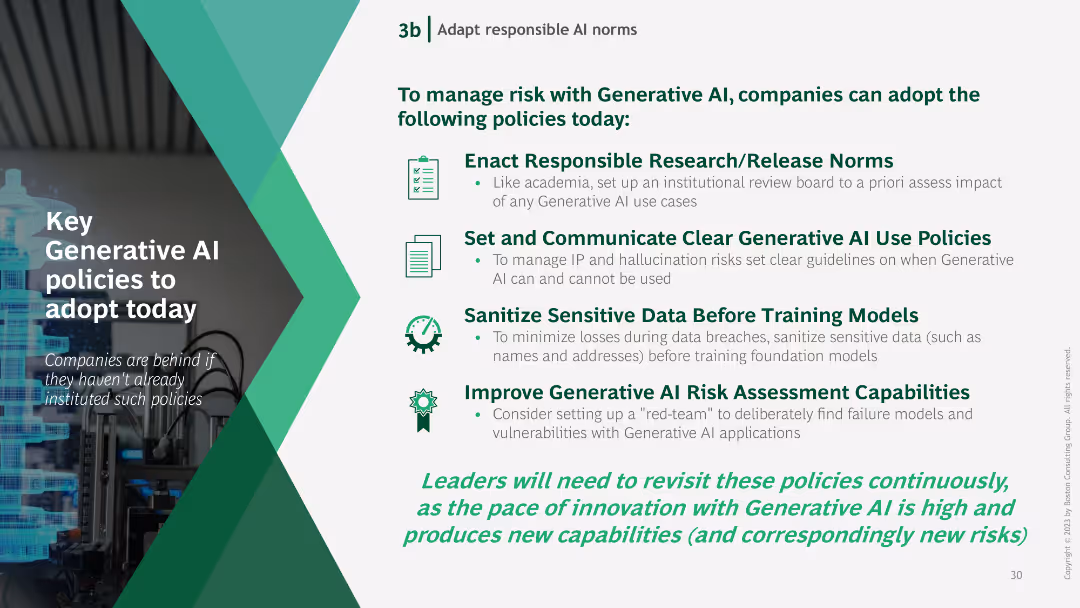
Text-based slide with bullet points outlining key policies for managing Generative AI risks, accompanied by icons representing each policy.
Regulatory and Compliance
Technology & Software
The slide lists essential policies for managing Generative AI risks, including responsible research norms, clear use policies, data sanitization, and risk assessment improvements.
Generative AI, policies, risk management, research norms, data sanitization
false
Regulatory and Compliance
Technology & Software
Vertical Flow
BCG
Add to my slides
Remove from favorites
The slide features a bar chart with four categories and a key findings box. Colors differentiate levels of preparedness. Text is descriptive but minimal, creating a clean look.
Risk Assessment and Management
Technology & Software
The slide depicts corporate preparedness for generative AI across four domains: technology infrastructure, strategy, risk & governance, and talent. It highlights a disparity in readiness, with technology infrastructure being the most prepared aspect and talent the least.
generative AI, preparedness, technology, strategy, risk, governance, talent, infrastructure
false
Risk Assessment and Management
Technology & Software
Single Chart
Deloitte
Add to my slides
Remove from favorites
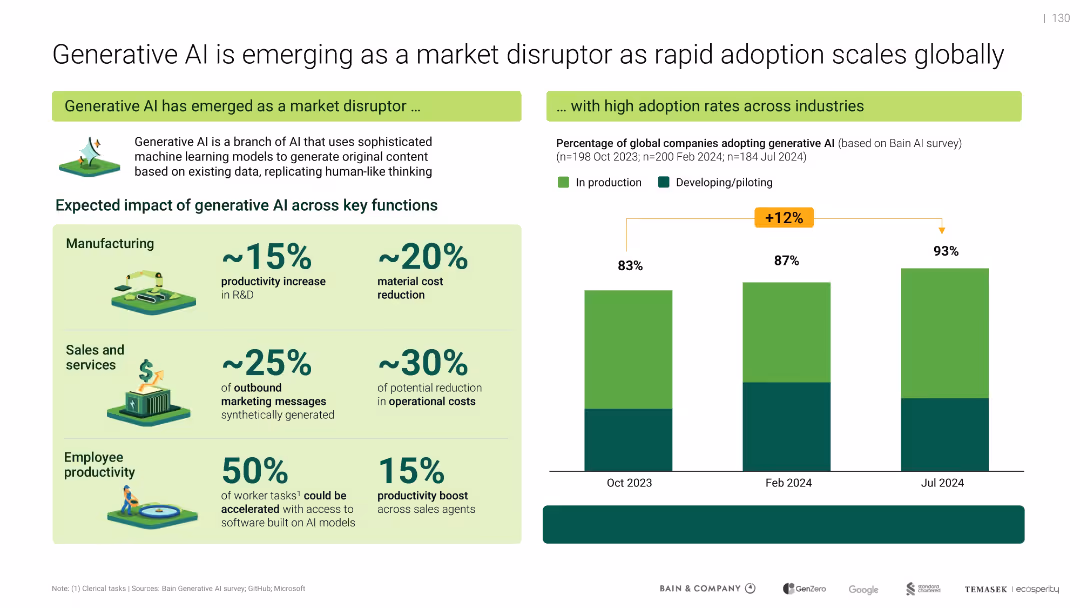
Left: table showing AI’s impact by function; Right: bar chart tracking AI adoption across companies; bright icons and color-coded bars.
Market Analysis and Trends
Artificial Intelligence
Describes generative AI’s growing influence, with 93% of global companies using or piloting it by mid-2024. Shows productivity benefits in manufacturing, sales, and employee tasks. Predicts disruption across key operational areas.
generative AI, productivity, adoption, disruption, enterprise, impact
false
Market Analysis and Trends
Artificial Intelligence
Mixed Chart
Bain
Add to my slides
Remove from favorites
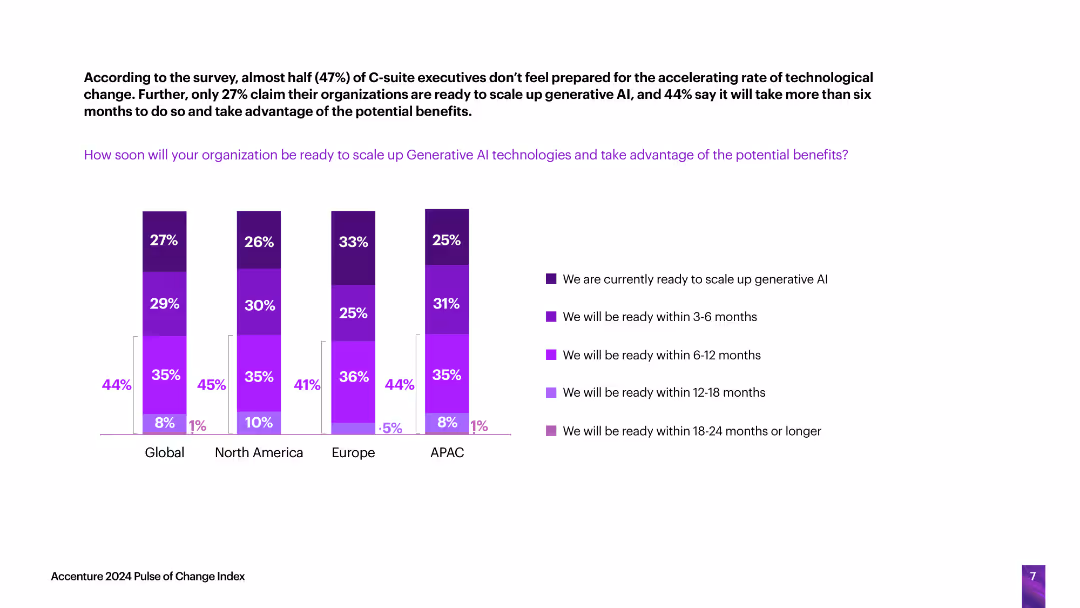
The slide includes vertical column charts indicating how soon organizations in different regions will be ready to scale up generative AI technologies, with readiness categorized by time frames (current, 3-6 months, etc.).
Technology and Digital Transformation
Technology & Software
The slide evaluates the readiness of organizations across various regions to scale up generative AI technologies, highlighting the time frames within which they expect to be prepared.
generative AI, readiness, scaling, technology adoption, time frames
false
Technology and Digital Transformation
Technology & Software
Single Chart
Accenture
Add to my slides
Remove from favorites
Features a column charts with a key findings section to the left. The chart displays the efforts in recruitment, education, and reskilling due to generative AI's impact. The colors green and teal denote different levels of expertise.
Human Resources and Talent Management
Technology & Software
The slide assesses efforts made by organizations in preparing their workforce for the advent of generative AI. It emphasizes the proactive steps taken in hiring, educating, and reskilling employees and compares these efforts with the perceived expertise in generative AI within the organizations.
generative AI, recruitment, education, reskilling, workforce, efforts, expertise, preparation
false
Human Resources and Talent Management
Technology & Software
Mixed Chart
Deloitte
Add to my slides
Remove from favorites
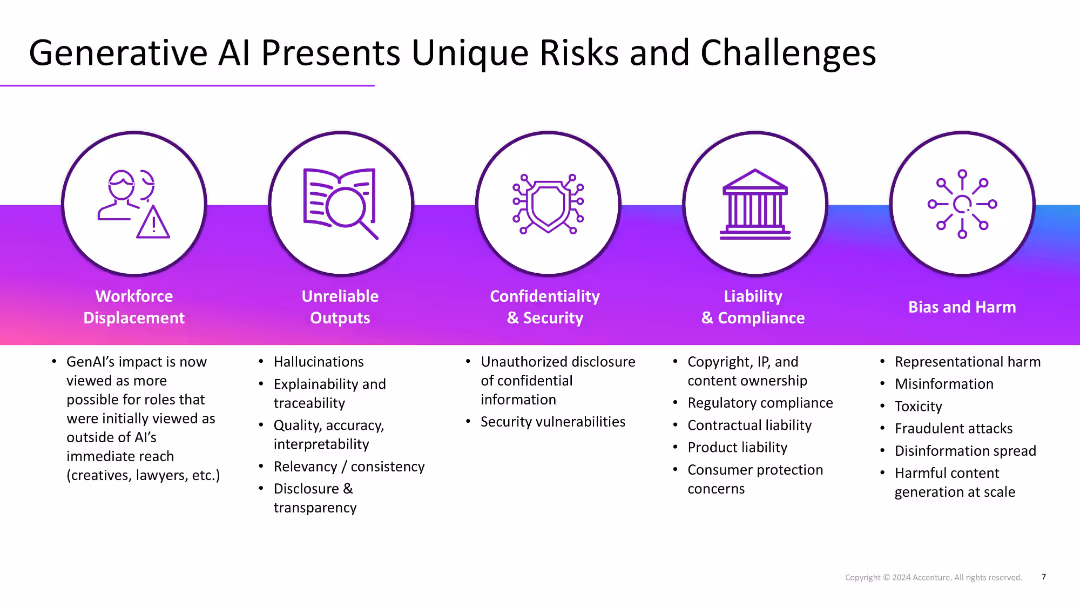
Horizontal layout with icons and headers for five risk categories, each with bulleted subpoints below. Uses strong color contrast with a gradient bar.
Risk Assessment and Management
Artificial Intelligence
Highlights five key risk areas of generative AI: workforce displacement, unreliable outputs, security, legal liabilities, and bias. Each risk includes bullet points describing specific challenges.
generative AI, risk, bias, security, misinformation, hallucination, compliance
false
Risk Assessment and Management
Artificial Intelligence
Pillar
Accenture
Add to my slides
Remove from favorites
The slide is divided into two sections with a large green title at the top. The left side contains a block of text outlining the key findings related to AI risks and concerns, governance issues, and active management steps. On the right, a pie chart illustrates strategies organizations are implementing to manage AI risks, with percentages. The slide background is white with a green design element on the left and the number '18' at the bottom right corner.
Risk Assessment and Management
Technology & Software
This slide details the governance and risk management practices for generative AI implementation, identifying concerns like inaccurate results, copyright infringement, and systemic bias. It summarizes a survey's findings from Q4 2023 and presents management strategies adopted by organizations, such as monitoring compliance and conducting internal audits. This content is crucial for informing businesses about common risks associated with AI and the importance of establishing robust governance frameworks to manage these risks effectively.
generative AI, risk management, governance, compliance, audits, bias, data privacy, regulation, survey findings, Q4 2023
false
Risk Assessment and Management
Technology & Software
Mixed Chart
Deloitte
Add to my slides
Remove from favorites
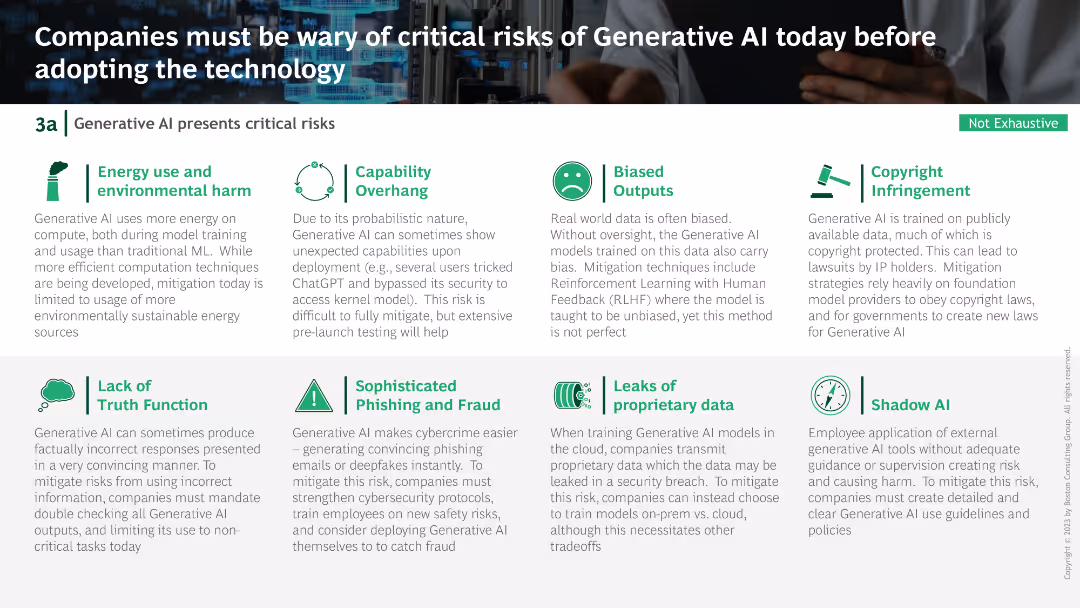
Text-based slide with icons representing various risks associated with Generative AI, such as environmental harm and capability overhang.
Risk Assessment and Management
Technology & Software
The slide discusses several critical risks of adopting Generative AI, including energy use, biased outputs, and copyright infringement, highlighting the need for mitigation.
Generative AI, risks, environmental harm, bias, copyright
false
Risk Assessment and Management
Technology & Software
Header Vertical
BCG
Add to my slides
Remove from favorites
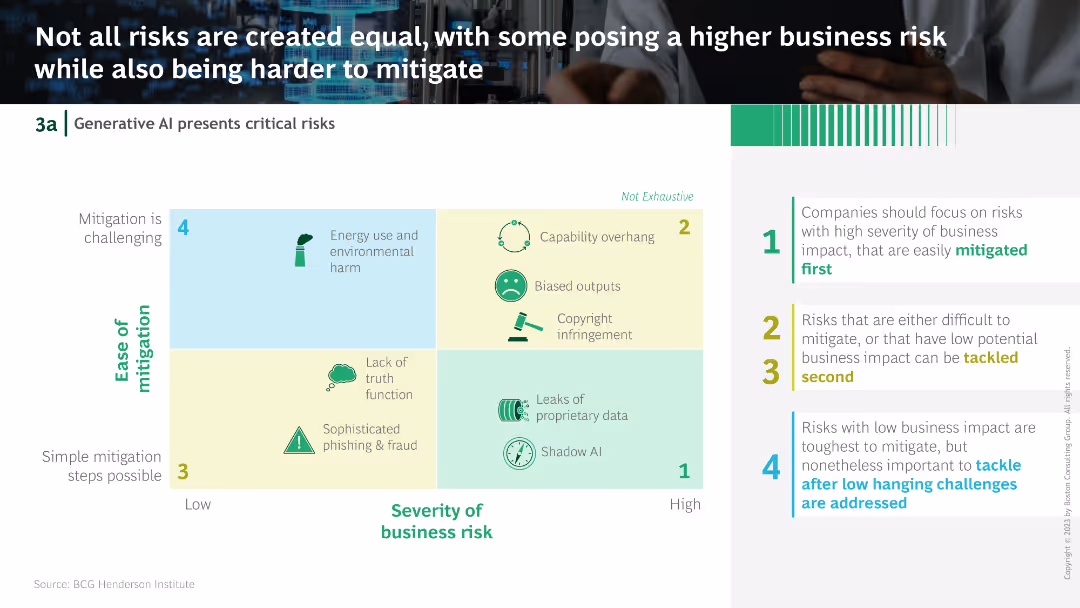
A grid comparing different risks of Generative AI in terms of ease of mitigation and severity of business impact, color-coded for clarity.
Risk Assessment and Management
Technology & Software
This slide categorizes the risks of Generative AI by their ease of mitigation and severity of business impact, suggesting a prioritization strategy for addressing these risks.
Generative AI, risks, mitigation, business impact, strategy
false
Risk Assessment and Management
Technology & Software
Diagram
BCG
Add to my slides
Remove from favorites
This slide features a column chart illustrating the skills expected to rise in value due to Generative AI adoption. It uses clear color coding to distinguish between human-centered and technology-centered skills.
Human Resources and Talent Management
Professional Services
The slide focuses on the increasing value of certain skills in the AI era, with data analysis, prompt engineering, and creativity among the top skills. It presents survey results with percentages for each skill category.
Generative AI, skills, data analysis, prompt engineering, creativity, technology, human-centered, survey results, workforce, value
false
Human Resources and Talent Management
Professional Services
Mixed Chart
Deloitte
Add to my slides
Remove from favorites
Consists of two bar charts that predict the societal impact of generative AI on the distribution of economic power and levels of inequality. The charts use shades of green and teal, with percentages indicating survey responses.
Market Analysis and Trends
Technology & Software
Analyzes expected changes in economic power distribution and inequality levels as a result of generative AI adoption. It suggests that while some expect a more equitable distribution, a significant portion anticipates increased centralization and inequality.
generative AI, societal impact, economic power, inequality, distribution, survey
false
Market Analysis and Trends
Technology & Software
Multiple Chart
Deloitte
Add to my slides
Remove from favorites
The slide features various charts, including a map, bar charts, and pie charts, summarizing survey data from 833 leaders across 21 industries.
Market Analysis and Trends
Technology & Software
This slide provides a comprehensive summary of survey data, showing insights from business leaders on generative AI programs and their impact.
generative AI, survey data, business leaders, market trends, industry insights, charts
false
Market Analysis and Trends
Technology & Software
Multiple Chart
Gartner
Add to my slides
Remove from favorites
A two-column layout with a text section on the left and a cluster bubble chart on the right showing emotional responses to generative AI. Colors are green and grey.
Market Analysis and Trends
Technology & Software
The slide presents survey findings on the high interest and transformative expectations from generative AI in business and technology sectors, highlighting mixed emotions like excitement and uncertainty.
Generative AI, Survey, Emotions, Expectations, Business, Technology
false
Market Analysis and Trends
Technology & Software
Mixed Chart
Deloitte
Add to my slides
Remove from favorites
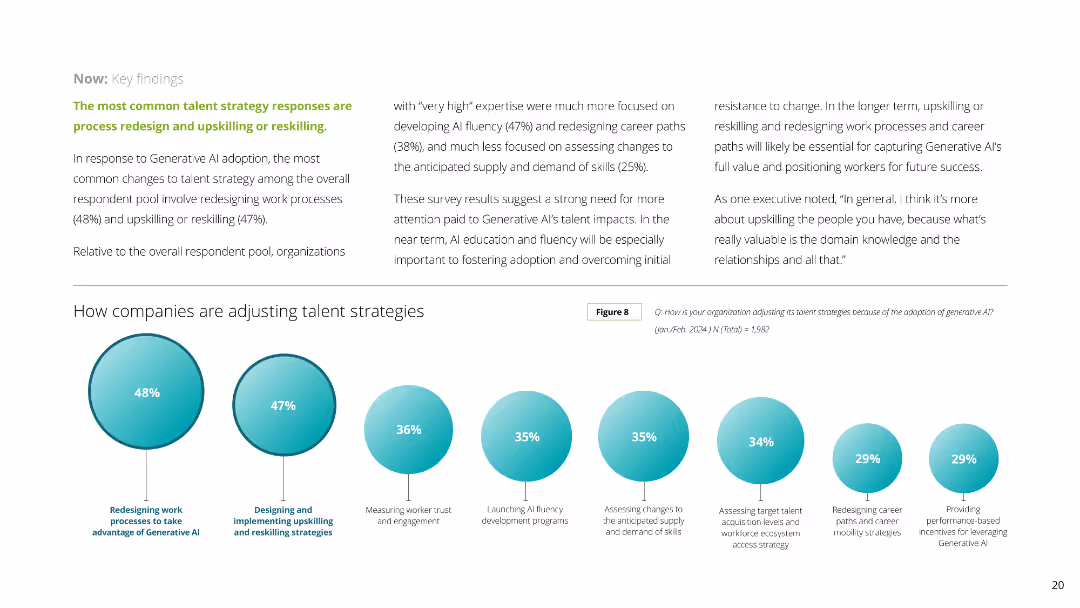
The slide contains a column chart and circular infographics displaying various percentages related to talent strategy responses. The layout is moderately complex with balanced use of visuals and text.
Human Resources and Talent Management
Professional Services
The slide discusses how companies are adjusting their talent strategies in response to Generative AI, highlighting redesigning work processes and upskilling/reskilling. It includes survey results with specific percentages for different strategies.
Generative AI, talent strategy, upskilling, reskilling, survey results, work processes, professional services, HR, workforce, engagement
false
Human Resources and Talent Management
Professional Services
Mixed Chart
Deloitte
Add to my slides
Remove from favorites
Utilizes simple bar charts and textual analysis to discuss the regular use of generative AI by different organizational roles, emphasizing leadership.
Technology and Digital Transformation
Technology & Software
Explores the prevalence of generative AI usage within organizations, highlighting a significant embrace by leaders, critical for understanding technology integration and leadership roles.
generative AI, technology integration, organizational roles, leadership, AI usage
false
Technology and Digital Transformation
Technology & Software
Multiple Chart
BCG
Add to my slides
Remove from favorites
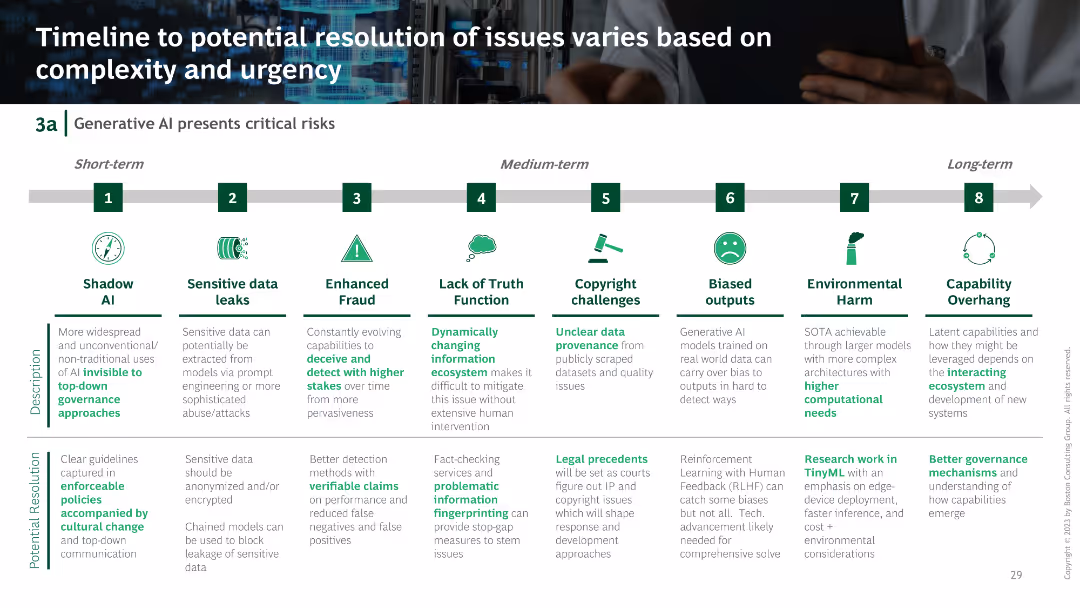
A horizontal timeline showing the short-term, medium-term, and long-term resolution of various Generative AI issues, with icons and text descriptions.
Risk Assessment and Management
Technology & Software
The slide presents a timeline for resolving different Generative AI issues, from shadow AI to capability overhang, detailing potential resolutions for each timeframe.
Generative AI, timeline, resolution, shadow AI, capability
false
Risk Assessment and Management
Technology & Software
Linear Flow
BCG
Add to my slides
Remove from favorites
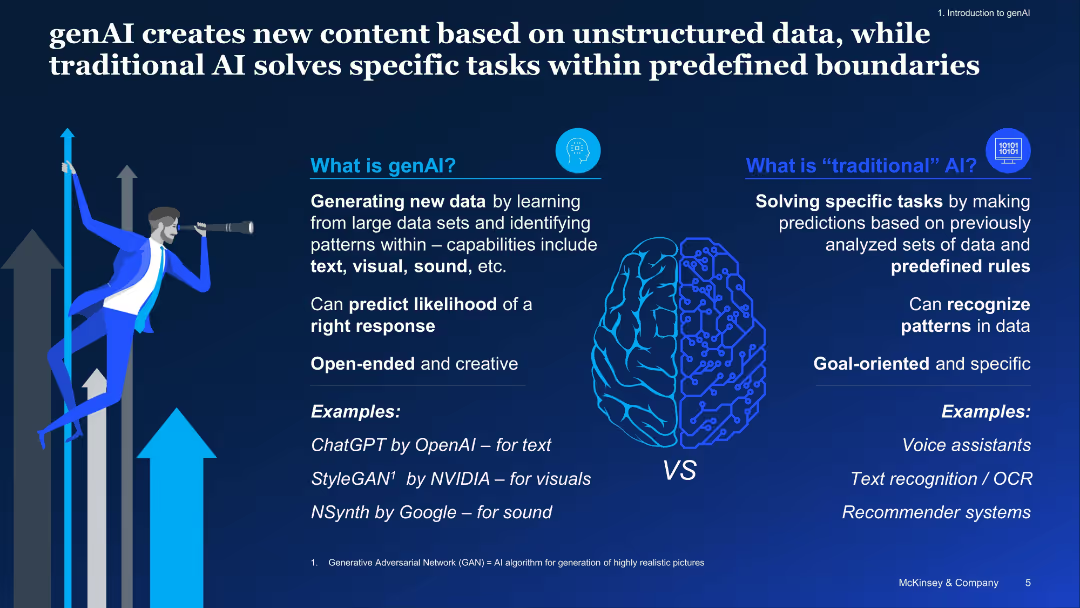
Split-brain visual with left-right text blocks comparing genAI and traditional AI, includes illustrative icons
Technology and Digital Transformation
Artificial Intelligence
Contrasts generative AI's ability to create new data (text, visuals, sound) with traditional AI's rule-based, goal-oriented structure. Highlights capabilities and examples of each (e.g., ChatGPT, StyleGAN, OCR).
generative AI, traditional AI, comparison, capabilities, examples, genAI
false
Technology and Digital Transformation
Artificial Intelligence
Pillar
McKinsey
Add to my slides
Remove from favorites
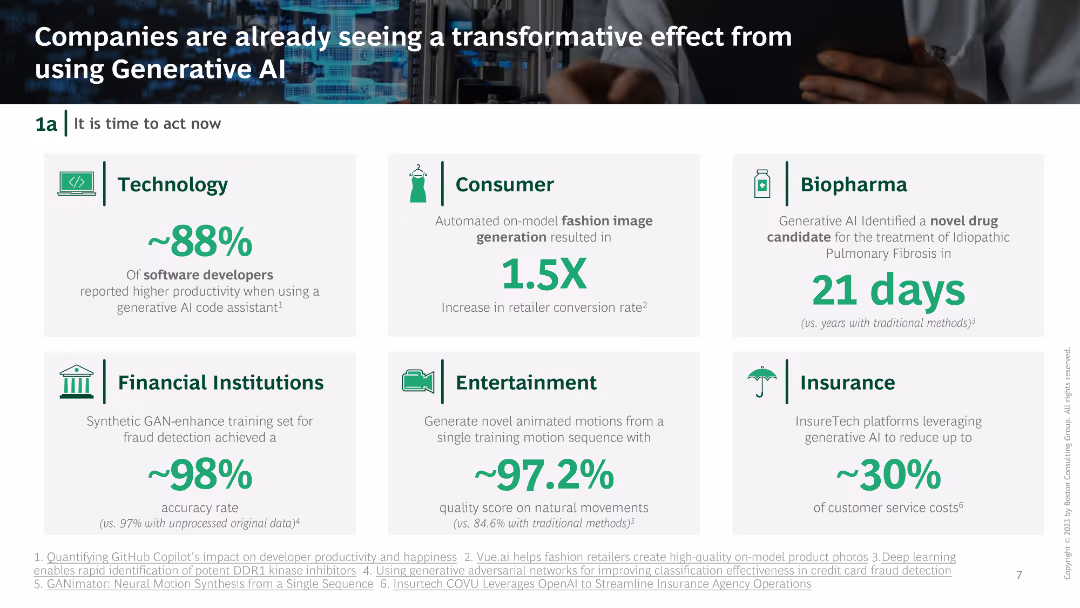
Grid layout with icons and statistics for different industries: Technology, Consumer, Biopharma, Financial Institutions, Entertainment, Insurance.
Performance Metrics and KPIs
Technology & Software
The slide highlights the transformative impact of Generative AI across various sectors, presenting key metrics and improvements reported by companies.
Generative AI, Transformation, Industry impact, Key metrics, Statistics
false
Performance Metrics and KPIs
Technology & Software
Table
BCG
Add to my slides
Remove from favorites
Contains a large pie chart detailing the frequency of Generative AI usage among users, accompanied by a bar graph showing specific usage rates from daily to less frequent.
Market Analysis and Trends
Technology & Software
Discusses the infrequent use of Generative AI tools by those who have tried them, pointing to potential usability or interest barriers.
Generative AI, usage frequency, user engagement, technology utilization, survey data
false
Market Analysis and Trends
Technology & Software
Mixed Chart
Deloitte
Add to my slides
Remove from favorites
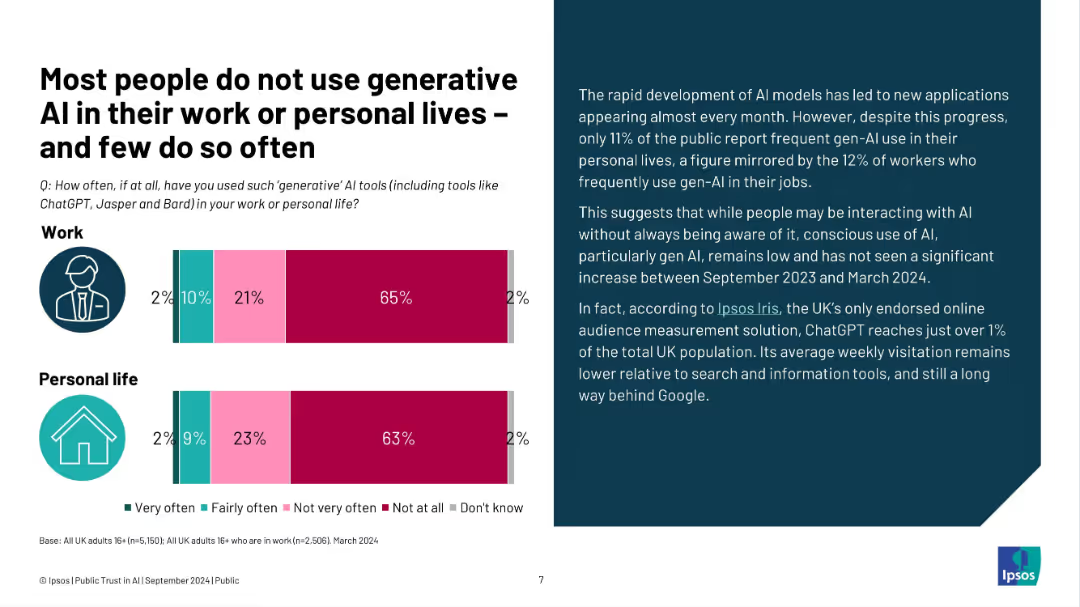
Left: title and bar charts on AI usage at work and personal life; right: paragraph analysis of gen-AI usage
Technology and Digital Transformation
Artificial Intelligence
Generative AI tools like ChatGPT are infrequently used by the public, both in professional and personal contexts. Despite tech advances, only 11–12% use these tools often. Public engagement with gen-AI remains relatively stagnant from late 2023 to early 2024.
generative AI, usage, personal, professional, ChatGPT, Ipsos, UK, digital transformation, trends
false
Technology and Digital Transformation
Artificial Intelligence
Mixed Chart
IPSOS
Add to my slides
Remove from favorites
Features a large pie chart showing percentages of Generative AI tool usage among the public, with explanatory text providing additional context on usage barriers.
Market Analysis and Trends
Technology & Software
Analyzes the percentage of the population that has used Generative AI tools, emphasizing the low engagement despite high awareness.
Generative AI, usage statistics, technology adoption, market barriers, public engagement
false
Market Analysis and Trends
Technology & Software
Mixed Chart
Deloitte
Add to my slides
Remove from favorites
The slide includes text and circular charts depicting percentages for top use cases cited by IT & InfoSec leaders, including data analysis, marketing, and logistics.
Financial Performance
Technology & Software
This slide identifies the primary use cases for Generative AI as cited by IT & InfoSec leaders, such as data analysis, fraud detection, and research & development.
Generative AI, Use Cases, IT Leaders, Data Analysis, Marketing
false
Financial Performance
Technology & Software
Single Chart
Gartner
Add to my slides
Remove from favorites
The slide includes text and circular charts depicting use cases selected by marketing leaders, such as ad copy and content production, and common uses for sales leaders.
Financial Performance
Technology & Software
This slide presents the common use cases for Generative AI as selected by marketing and sales leaders, including ad copy generation and sales enablement materials.
Generative AI, Use Cases, Marketing Leaders, Sales Leaders, Ad Copy
false
Financial Performance
Technology & Software
Mixed Chart
Gartner
Add to my slides
Remove from favorites
The slide contains text and triangular charts depicting the excitement of software engineering leaders for various Generative AI applications and the planned uses by supply chain leaders.
Financial Performance
Technology & Software
This slide highlights the enthusiasm of software engineering leaders for Generative AI applications like code generation and the intended uses for supply chain leaders.
Generative AI, Use Cases, Software Engineering, Supply Chain, Code Generation
false
Financial Performance
Technology & Software
Multiple Chart
Gartner
Add to my slides
Remove from favorites
Features a pie chart showing the percentage of people using Generative AI for work, with a bar chart for specific purposes like personal, work, and education.
Market Analysis and Trends
Technology & Software
Highlights the adoption of Generative AI tools in professional contexts, estimating the number of users and their application areas.
Generative AI, workplace adoption, professional use, technology impact, user statistics
false
Market Analysis and Trends
Technology & Software
Mixed Chart
Deloitte
Add to my slides
Remove from favorites
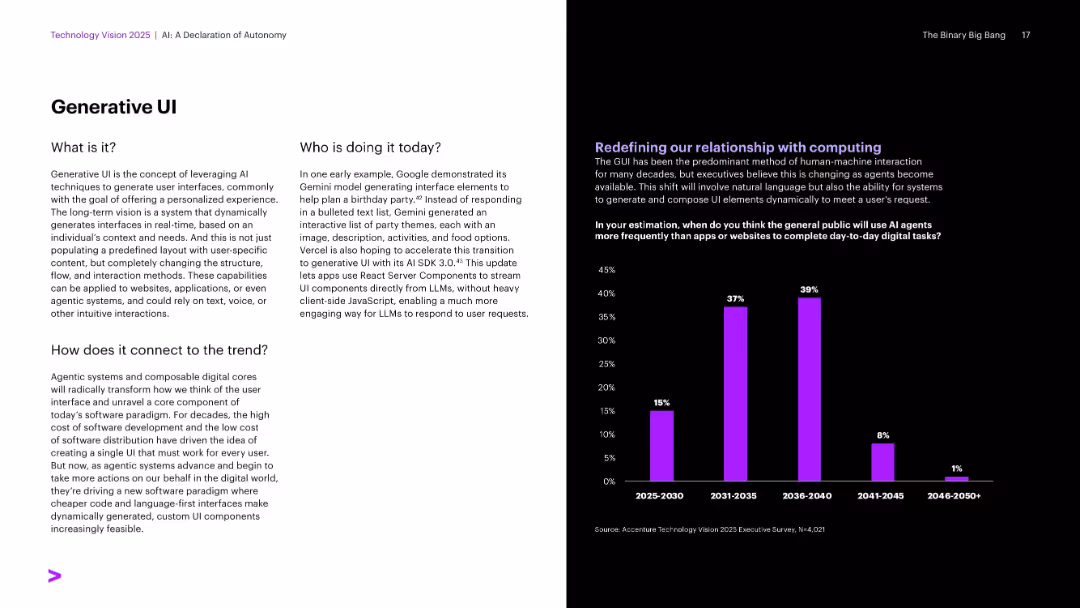
Split layout with concept explanation and examples on left; bar chart on right forecasting public adoption timeline.
Product and Service Analysis
Artificial Intelligence
Discusses generative UIs that dynamically build personalized interfaces in real-time using LLMs. Provides a future outlook on when the general public will predominantly use AI agents over traditional apps.
Generative UI, AI Agents, User Experience, Gemini, React Server, Personalized Interfaces
false
Product and Service Analysis
Artificial Intelligence
Multiple Chart
Accenture
Add to my slides
Remove from favorites
Visual comparison using bar charts to show the cost disparities between generators, solar mini-grids, and grid electricity, alongside another chart depicting the proportion of market fires caused by generators, emphasizing economic and safety impacts.
Regulatory and Compliance
Industrial & Manufacturing
Highlighting the economic and safety challenges posed by generator use in Nigeria, this slide compares their high costs to other energy sources and their significant role in market fires, advocating for safer and more economical alternatives like solar energy.
generators, costs, fires, market safety, energy sources, Nigeria, economic impact, safety
false
Regulatory and Compliance
Industrial & Manufacturing
Multiple Chart
BCG
Add to my slides
Remove from favorites
The slide features a column chart comparing the levelized cost of electricity from generators, solar mini-grids, and the grid, annotated with cost multipliers. It also includes a circular infographic illustrating the percentage of market fires caused by generators in Nigeria.
Market Analysis and Trends
Energy & Utilities
This slide highlights the challenges MSMEs face due to reliance on generators, specifically their high costs compared to other energy sources and their role in causing significant fire incidents in Nigeria.
generators, MSMEs, energy costs, market fires, Nigeria
false
Market Analysis and Trends
Energy & Utilities
Mixed Chart
BCG
Add to my slides
Remove from favorites
This slide uses a combination of icons, bar charts, and descriptive text to outline the risks associated with generator use in Nigerian markets, including fire risks and operational safety hazards, using visual elements to emphasize key data points.
Regulatory and Compliance
Industrial & Manufacturing
Detailing the safety issues related to generator use in Nigerian markets, this slide outlines how improper use and lack of safety measures contribute to a significant number of market fires, advocating for improved safety practices and alternative energy sources to mitigate these risks.
generators, safety, market fires, Nigeria, risks, operational safety, fire hazards, energy
false
Regulatory and Compliance
Industrial & Manufacturing
Mixed Chart
BCG
Add to my slides
Remove from favorites
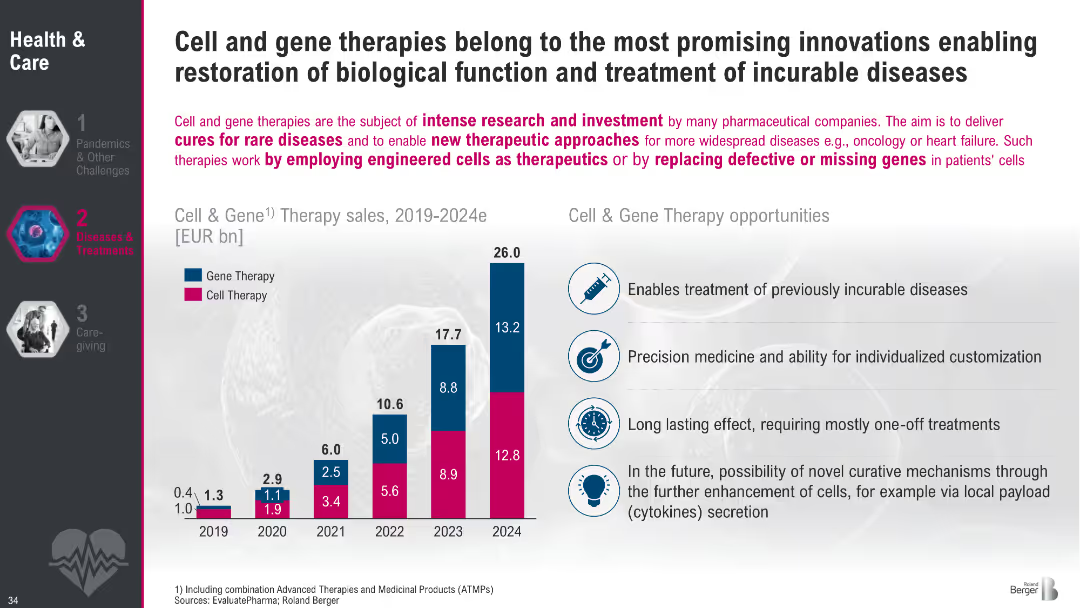
Two-column layout with a left-side bar chart showing projected therapy sales (2019–2024) and a right-side opportunity list with icons. Bold headers and color-coded bars distinguish gene and cell therapy data.
Market Analysis and Trends
Healthcare & Pharmaceuticals
This slide highlights the rapid growth of cell and gene therapy markets, driven by innovation targeting incurable diseases. It explains how these therapies function and their expected impact, emphasizing market projections and therapeutic advantages such as precision medicine, long-lasting effects, and future potential.
gene therapy, cell therapy, biomedical innovation, rare diseases, therapeutic market, precision medicine, market growth, regenerative medicine
false
Market Analysis and Trends
Healthcare & Pharmaceuticals
Mixed Chart
Roland Berger
Add to my slides
Remove from favorites
The slide includes several data representations, such as bar graphs displaying top industry focus and a line chart depicting trend evolution. It also features a list of concepts and tags.
Market Analysis and Trends
Professional Services
Focuses on the intersection of economic trends with generational impact, highlighting how social values and corporate governance are influencing industry trends.
Gen X, Millennials, Government, Financial, Nonprofit, ESG, Climate, Conservatives
false
Market Analysis and Trends
Professional Services
Multiple Chart
Bain
Add to my slides
Remove from favorites
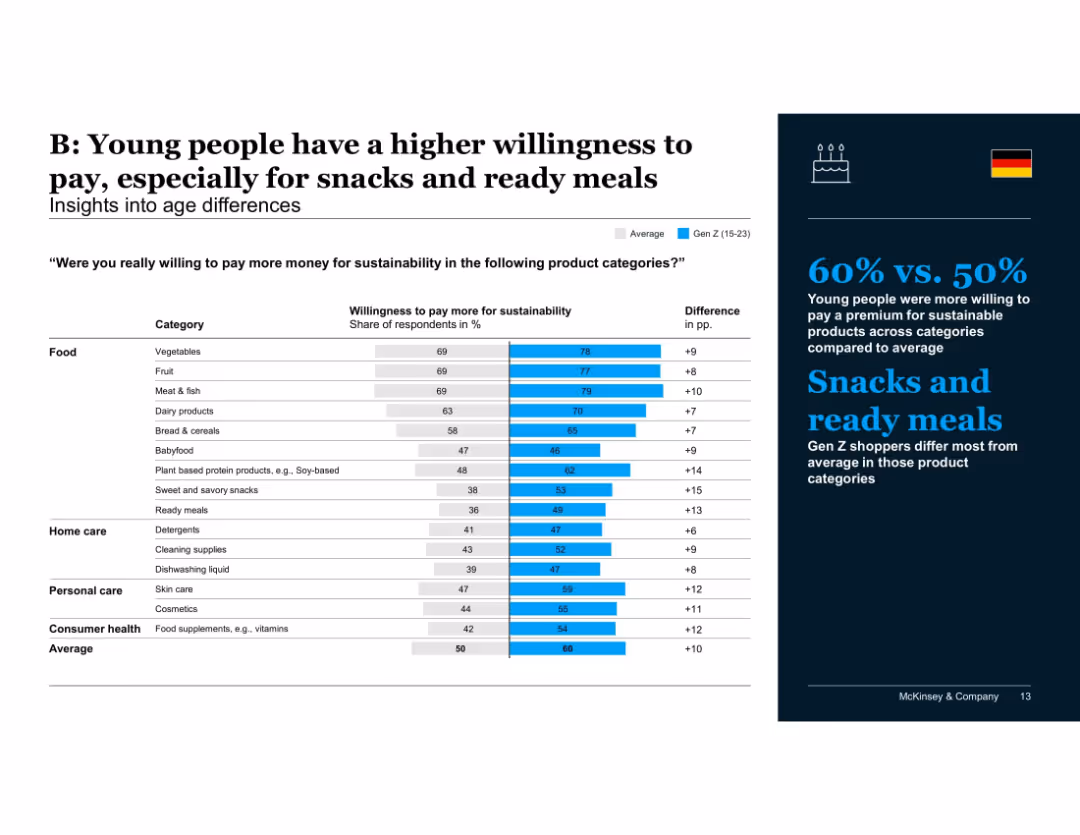
Bar chart showing Gen Z vs. average willingness to pay across various product categories; differences labeled
Customer and Market Segmentation
Consumer Goods
Gen Z consumers are more likely to pay more for sustainability, especially for snacks, ready meals, and soy-based products. Their higher values across nearly all categories highlight a generational shift in sustainable consumption habits.
Gen Z, age differences, willingness to pay, snacks, ready meals, consumer behavior, sustainability, product categories, McKinsey
false
Customer and Market Segmentation
Consumer Goods
Mixed Chart
McKinsey
Add to my slides
Remove from favorites
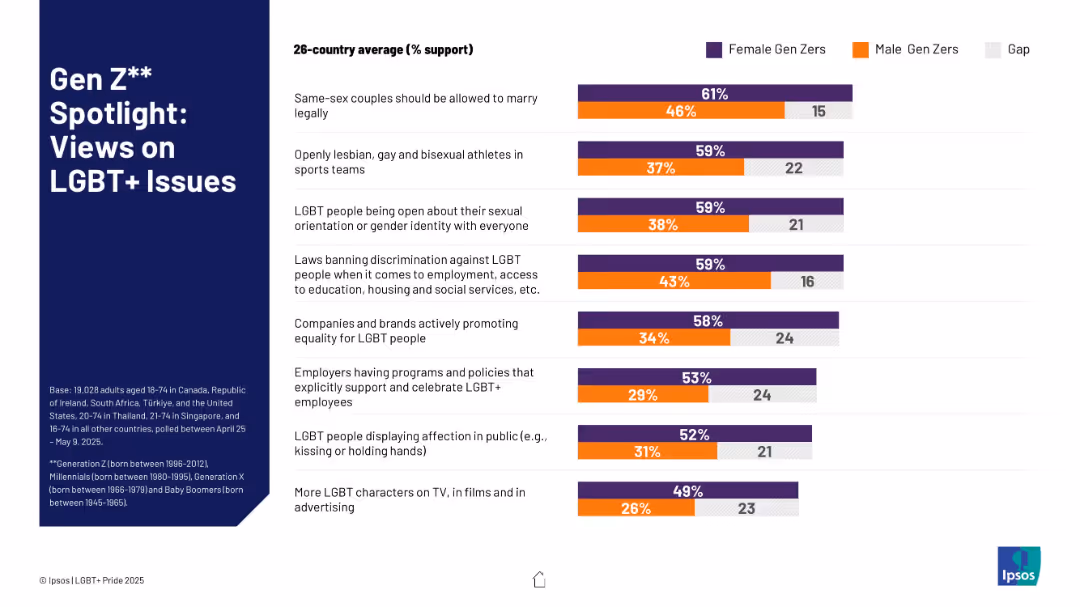
Bar chart comparing support levels among Gen Z males vs. females across various LGBT+ issues; includes support gap.
Customer and Market Segmentation
Government & Public Sector
This slide focuses on Gen Z attitudes toward LGBT+ rights and representation. It shows significant gender differences in support for issues like same-sex marriage, LGBT visibility in media, and corporate inclusion policies, indicating a pronounced gender divide within Gen Z.
Gen Z, gender gap, LGBT+ support, youth opinion, same-sex marriage, media representation, corporate inclusion, survey statistics
false
Customer and Market Segmentation
Government & Public Sector
Mixed Chart
IPSOS
Add to my slides
Remove from favorites
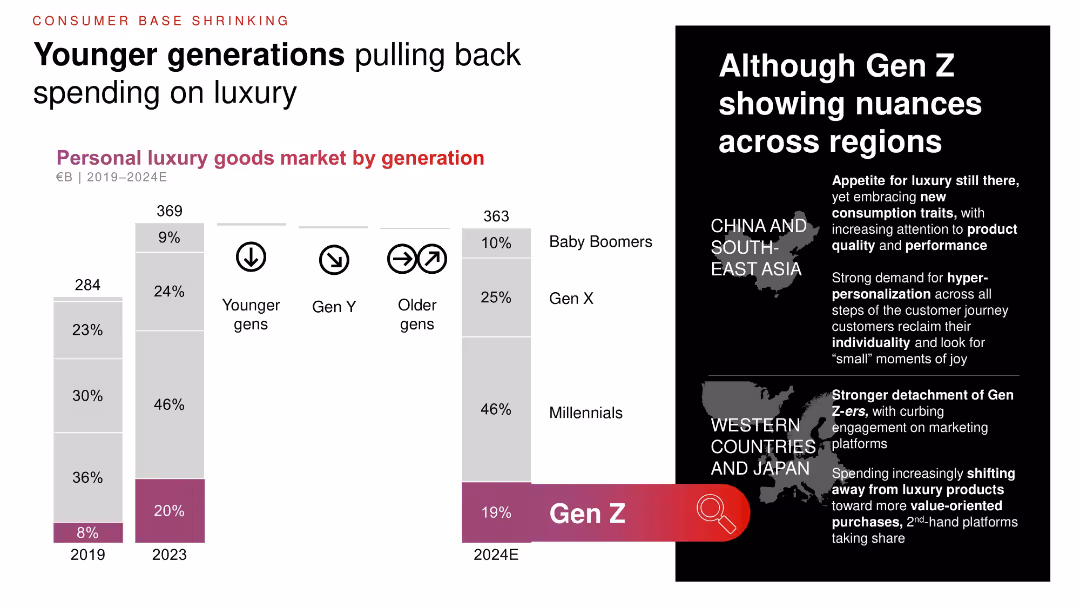
Vertical stacked bar charts of luxury goods market by generation (2019–2024E); regional callouts with maps; focus on Gen Z’s evolving consumption behaviors.
Customer and Market Segmentation
Consumer Goods
This slide highlights a pullback in luxury spending from younger generations, especially Gen Z. It breaks down spending by generation, noting regional differences in behavior and preferences between Asia and Western countries.
Gen Z, generational trends, luxury spending, consumer behavior, regional analysis, millennials
false
Customer and Market Segmentation
Consumer Goods
Mixed Chart
Bain
Add to my slides
Remove from favorites
Consists of circular diagrams and percentages focusing on Gen Z's buying habits in the luxury market, with emphasis on sustainability and digital interactions.
Customer and Market Segmentation
Retail & E-commerce
Provides detailed insights into Gen Z's consumption patterns in the luxury sector, especially their preferences for sustainability and digital engagement.
Gen Z, luxury market, sustainability, digital engagement, circular diagrams, buying habits
false
Customer and Market Segmentation
Retail & E-commerce
Vertical Flow
BCG
Add to my slides
Remove from favorites
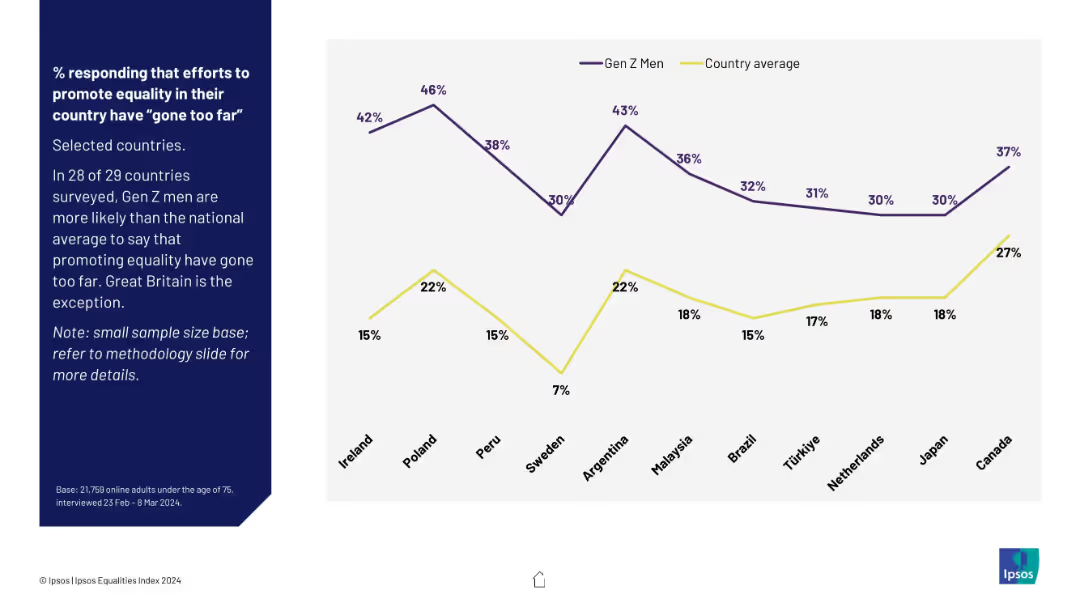
Line graph comparing Gen Z men to national average across selected countries; purple and yellow lines; note on sample size.
Regulatory and Compliance
Government & Public Sector
This slide spotlights Gen Z men across countries, showing their likelihood to say equality efforts have gone too far. In 28 of 29 countries, Gen Z men surpass national averages—Great Britain is the exception.
Gen Z men, backlash, equality efforts, country comparison, Ipsos, public perception, overreach concern
false
Regulatory and Compliance
Government & Public Sector
Mixed Chart
IPSOS
Add to my slides
Remove from favorites
The slide includes a main text section at the top, followed by two sets of data visuals. The left visual is a column chart showing the top concerns among Gen Zs, and the right visual for millennials.
Market Analysis and Trends
Consumer Goods
The slide highlights the top concerns for Gen Z and millennials, with cost of living being the primary issue. It includes survey data showing the percentages of respondents from both groups who are concerned about various issues like climate change and unemployment.
Gen Z, millennials, cost of living, survey, concerns
false
Market Analysis and Trends
Consumer Goods
Multiple Chart
Deloitte
Add to my slides
Remove from favorites
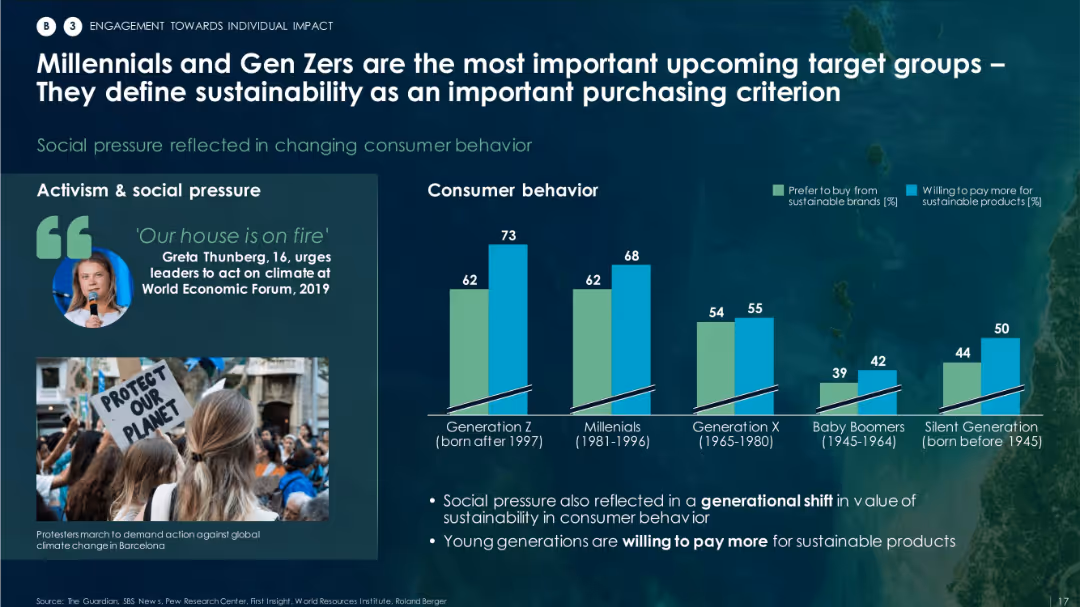
Mixed layout with an image on the left and bar graph on the right showing consumer behavior by generation.
Customer and Market Segmentation
Environmental Services & Sustainability
Focuses on how younger generations (Gen Z and Millennials) are more likely to prefer and pay more for sustainable brands. It also touches on social pressure and changing consumer behavior regarding sustainability.
Gen Z, Millennials, sustainable brands, social pressure, consumer behavior, ESG preferences
false
Customer and Market Segmentation
Environmental Services & Sustainability
Mixed Chart
Roland Berger
Add to my slides
Remove from favorites
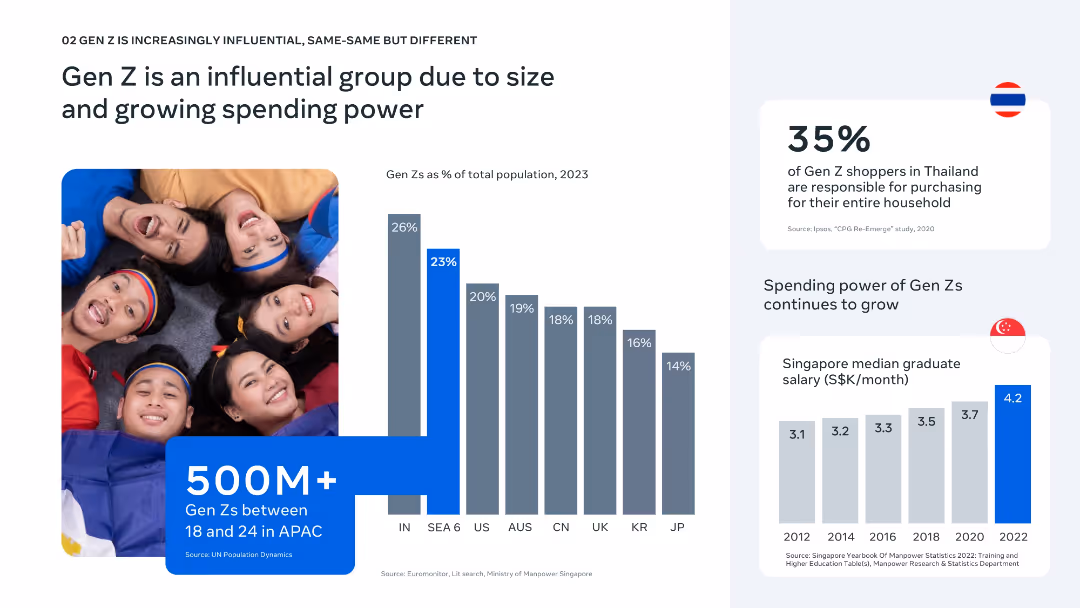
Side-by-side layout with image left, bar charts and stat blocks right; bright, youthful aesthetic.
Customer and Market Segmentation
Consumer Goods
Gen Z represents a significant share of the population in SEA and plays a key purchasing role. The slide includes data on population percentage, purchasing influence, and growing median salaries in Singapore as an example of increasing power.
Gen Z, population, spending power, household influence, APAC, income growth, graduate salary, youth market, Southeast Asia, purchasing behavior
false
Customer and Market Segmentation
Consumer Goods
Multiple Chart
Bain
Add to my slides
Remove from favorites
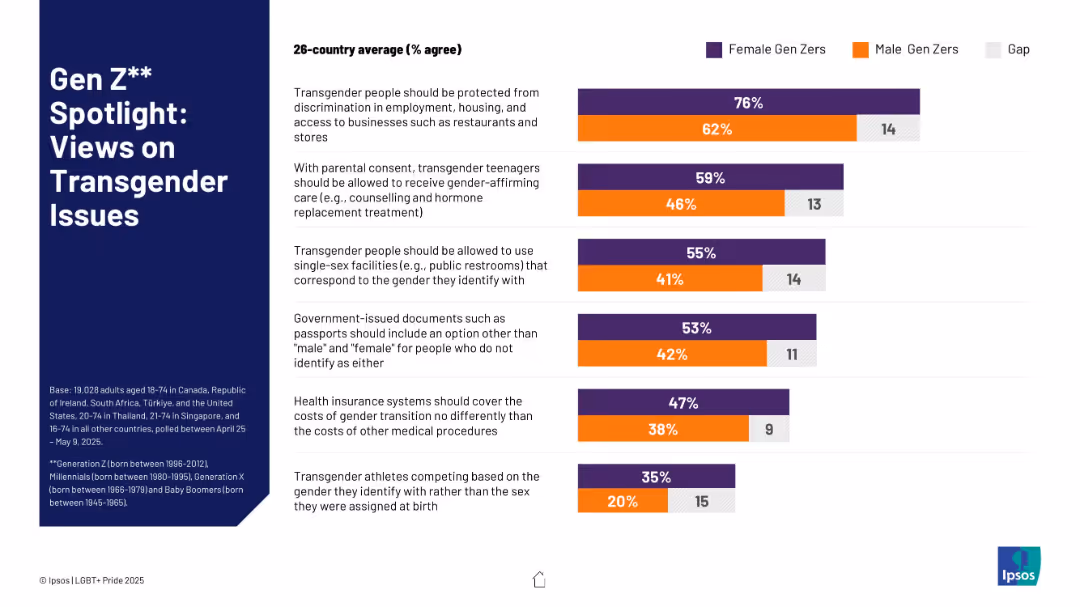
Split bar chart with horizontal bars for Male vs. Female Gen Zers, color-coded. Text-heavy right side; title block left.
Market Analysis and Trends
Government & Public Sector
The slide presents survey data comparing the views of male and female Gen Z individuals across six transgender-related statements, highlighting gender gaps in support levels and rights acknowledgment.
Gen Z, transgender rights, gender gap, survey, discrimination, equity
false
Market Analysis and Trends
Government & Public Sector
Mixed Chart
IPSOS
Add to my slides
Remove from favorites
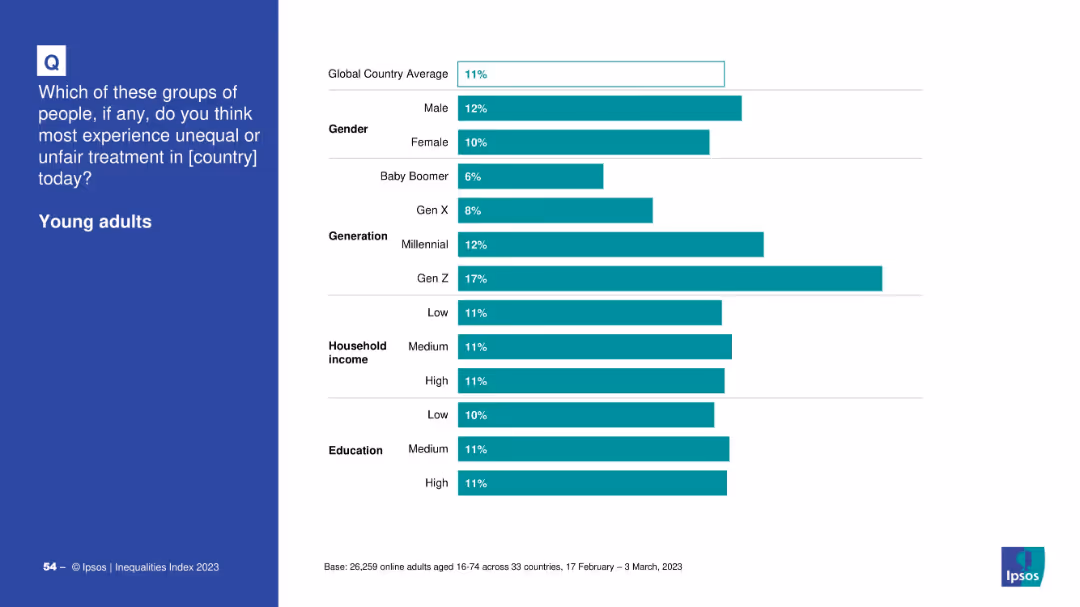
Bar chart of global perception by demographics: gender, generation, income, education
Market Analysis and Trends
Government & Public Sector
The slide compares demographic perceptions of unfair treatment of young adults. Gen Z respondents and Millennials report higher concerns, while Baby Boomers and older generations perceive less discrimination against the youth.
Gen Z, young adults, generational gap, Ipsos, inequality, survey analysis, education, income
false
Market Analysis and Trends
Government & Public Sector
Mixed Chart
IPSOS
Add to my slides
Remove from favorites
The slide contains a line chart showing the increase in trade tensions over time, with separate lines for goods, services, and investment restrictions.
Market Analysis and Trends
Financial Services
The slide analyzes the rise in geoeconomic disintegration, evidenced by the increasing number of harmful trade restriction measures imposed globally.
geoeconomic disintegration, trade tensions, global trade, restrictions, economic trends
false
Market Analysis and Trends
Financial Services
Mixed Chart
PwC/Strategy&
Add to my slides
Remove from favorites
Three pie charts showing geographical distribution of accounts, commissions, and client equity for IBKR.
Client Case Studies
Financial Services
Highlights geographical diversity in IBKR’s client base and financials, with pie charts displaying the regional spread of accounts and assets.
Geographical Diversity, Interactive Brokers, Client Accounts, Client Equity, Pie Charts, Americas, Europe, Asia-Pacific
false
Client Case Studies
Financial Services
Multiple Chart
Goldman Sachs
Add to my slides
Remove from favorites
The slide displays a geographical map showing various data points with different color codes and markers. It features a dark background with highlighted routes and areas, showing service ticket locations and statuses.
Operational Efficiency
Energy & Utilities
This slide demonstrates an embedded geographical map for monitoring and managing service tickets within the utility sector, providing real-time data on locations and statuses.
Geographical, Map, Service Tickets, Locations, Monitoring
false
Operational Efficiency
Energy & Utilities
Graphic
EY
Add to my slides
Remove from favorites
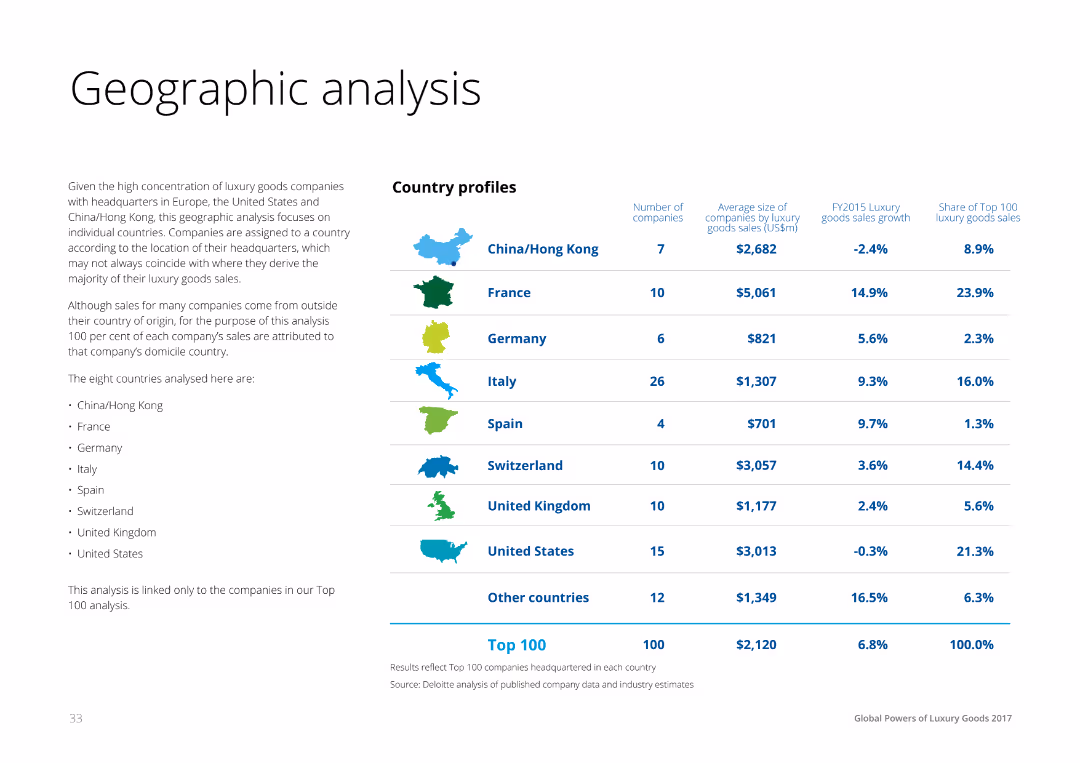
Text on the left with a table on the right showing country profiles for luxury goods markets, including the number of companies, average sales size, growth rates, and share of top 100 sales for countries like China, France, Germany, etc.
Market Analysis and Trends
Consumer Goods
This slide presents a geographic analysis of luxury goods markets, comparing countries by the number of companies, average sales size, growth rates, and market share. It provides insights into regional market dynamics and growth opportunities.
Geographic, Analysis, Luxury, Market, Countries
false
Market Analysis and Trends
Consumer Goods
Table
Deloitte
Add to my slides
Remove from favorites
This slide presents a world map illustrating the geographic distribution of respondents from the pulse survey. Green and blue dots of various sizes represent the number of Millennials and Gen Z participants from different regions.
Market Analysis and Trends
Media & Entertainment
The slide shows the geographical distribution of respondents from the pulse survey conducted between April and May 2020. It helps in understanding the global coverage of the survey and the regional variations in responses, providing a basis for analyzing changes in sentiment over time and the impact of the pandemic across different locations.
Geographic Distribution, Pulse Survey, Millennials, Gen Z, Map
false
Market Analysis and Trends
Media & Entertainment
Graphic
Deloitte
Add to my slides
Remove from favorites
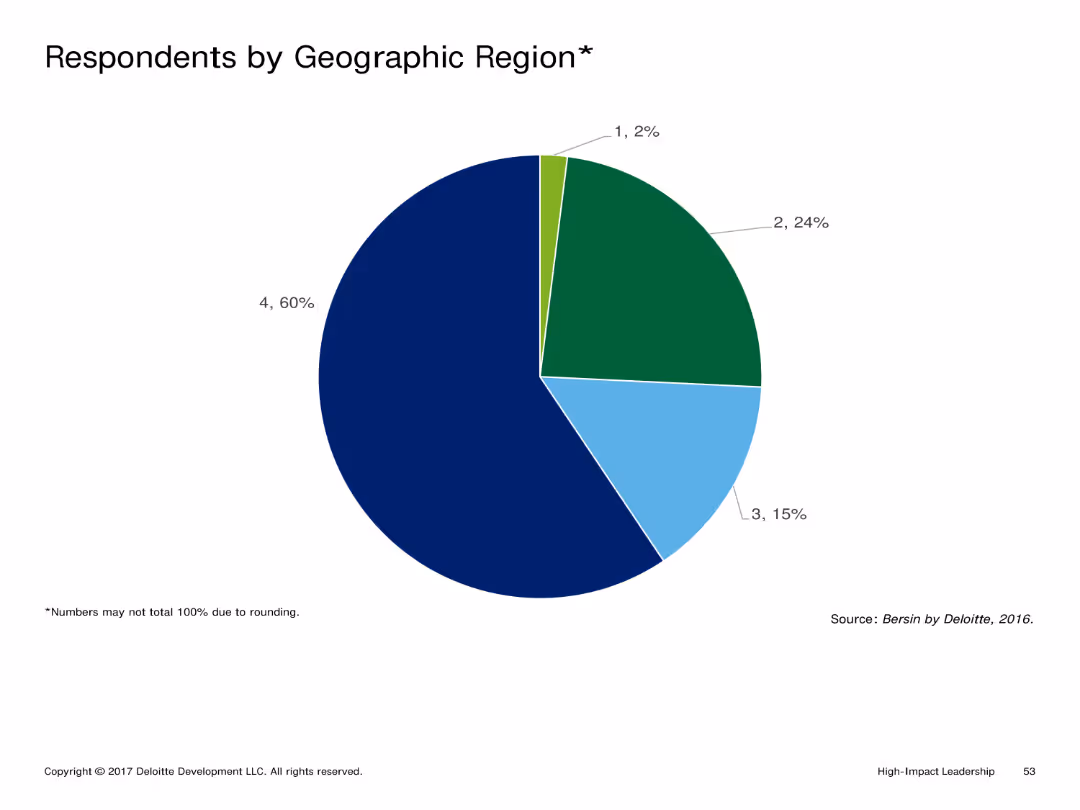
This slide shows a pie chart divided into different segments representing the percentage of respondents by geographic region. Each segment is color-coded and labeled with the corresponding percentage.
Market Analysis and Trends
Professional Services
The slide presents the distribution of survey respondents across different geographic regions. It highlights the proportion of respondents from each region, providing insights into the demographic spread of the survey participants.
Geographic Distribution, Respondents, Survey, Regions, Analysis
false
Market Analysis and Trends
Professional Services
Single Chart
Deloitte
Add to my slides
Remove from favorites
This slide features a world map showing the geographic distribution of survey respondents. Different sizes of green and blue dots indicate the number of Millennials and Gen Z participants from various regions.
Market Analysis and Trends
Media & Entertainment
The slide visualizes the geographic distribution of respondents from the primary survey conducted between November 2019 and January 2020. It provides a clear view of the global reach of the survey, highlighting regions with the highest participation, which is useful for understanding the demographic spread and diversity of opinions.
Geographic Distribution, Survey, Millennials, Gen Z, Map
false
Market Analysis and Trends
Media & Entertainment
Graphic
Deloitte
Add to my slides
Remove from favorites
Previous
Next
You don't have any favorites yet.
Please wait loading your favorites slides...
Create a FREE account to continue browsing
Receive Instant Access to 1,000+ slides from companies like McKinsey, Google, and Goldman Sachs
First Name
Last Name
Email
Password
I agree to all
Terms & Privacy Policy
Thank you! Your submission has been received!
Oops! Something went wrong while submitting the form.
Have an account?
Sign in
Upgrade to PRO to Save slides
Advanced Search and Filters
Access to 15,000+ slides
Access to Category Pages
Save/Bookmark Slides
PowerPoint Template Library
Pick a Plan
MONTHLY
$12/month
Billed every month, Cancel anytime.
YEARLY
$9/year
Billed $108 annually, Cancel anytime.
Checkout for $12/month
Checkout for $108/yr
Secured by Stripe | AES-256 bit encryption