My Account
My Slides
Search by Category
Companies
Slide Type
Use Case
Industry
Pricing
Templates
View All Templates
Download Template Slides
✦ AI
AI Prompt Library
AI Search
Feedback
Login
Logout
Get Started
Browse all Slides
Browse all Slides
Create a FREE Account
Instant access to 1,000+ real slides from top companies like McKinsey, BCG, Goldman Sachs, Google and many more!
First Name
Last Name
Email
Password
I agree to all
Terms & Privacy Policy
Thank you! Your submission has been received!
Oops! Something went wrong while submitting the form.
Have an account?
Sign in
Saved Slides
Total No. of slides saved
0
↻ Refresh
✖ Clear all
Two-column layout with bar charts showing year-over-year percentage change in real GDP for global, developed, and emerging markets from 2022-2025F.
Market Analysis and Trends
Financial Services
Highlights the resilience of the global economy and faster-than-expected disinflation amid significant monetary policy tightening in 2023.
global economy, disinflation, GDP growth, monetary policy, economic resilience
false
Market Analysis and Trends
Financial Services
Mixed Chart
EY
Add to my slides
Remove from favorites
The slide features a column chart comparing year-on-year percentage change in real GDP from 2022 to 2025 across various regions, including Global, US, Euro area, UK, Japan, China, India, Brazil, Developed markets, and Emerging markets. The chart uses different colors to represent the years.
Market Analysis and Trends
Financial Services
This slide presents projections for the global economy, highlighting expected growth trajectories from 2022 to 2025. It compares real GDP percentage changes across multiple regions, offering insights into the economic outlook for developed and emerging markets over the forecast period.
global economy, GDP, financial services, market trends, economic projections, real GDP, developed markets, emerging markets, growth trajectory, forecast
false
Market Analysis and Trends
Financial Services
Single Chart
EY
Add to my slides
Remove from favorites
This slide presents a multi-line chart tracking the Global Composite PMI. Different lines represent global, US, Eurozone, and China data, showing trends over several years with annotations about economic events and recoveries.
Market Analysis and Trends
Financial Services
Provides a comprehensive view of the global economic recovery, highlighting the non-linear improvement in manufacturing and service sectors worldwide. The slide analyzes the impact of the pandemic and subsequent recovery phases, useful for understanding macroeconomic trends and planning.
global economy, PMI, economic recovery, financial trends, manufacturing
false
Market Analysis and Trends
Financial Services
Single Chart
Deloitte
Add to my slides
Remove from favorites
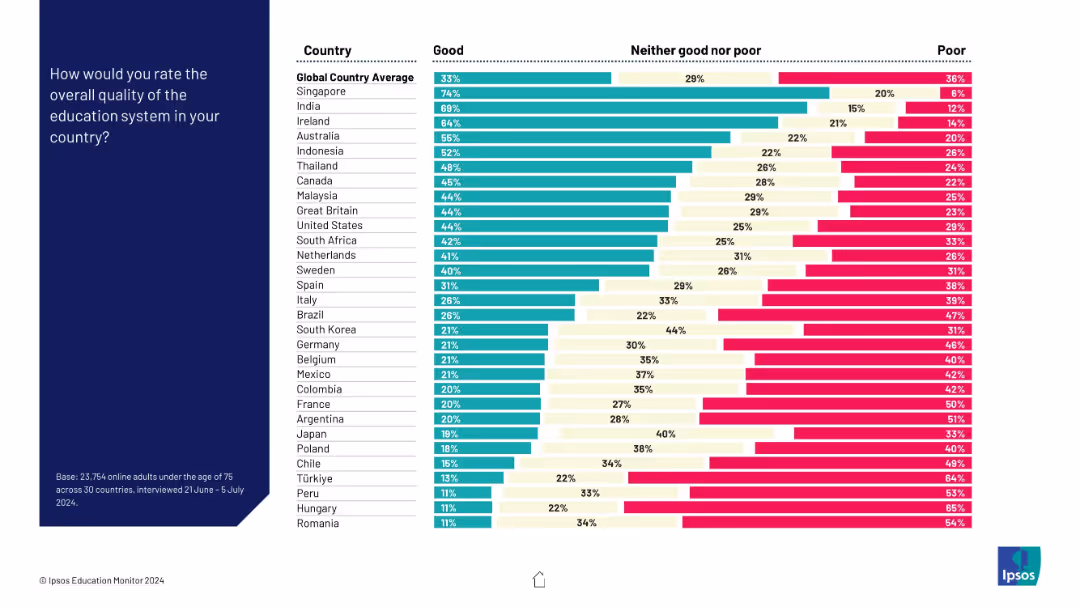
Horizontal bar chart showing perception of education system quality (good/neutral/poor) across 30 countries, ordered from most to least positive.
Market Analysis and Trends
Education & Training
This slide shows global variation in public perception of national education quality. Countries like Singapore and India rank highest in positive views, while Romania and Hungary rank lowest, reflecting regional trust gaps in education.
global, education quality, perception, countries, Ipsos, comparison, survey
false
Market Analysis and Trends
Education & Training
Mixed Chart
IPSOS
Add to my slides
Remove from favorites
This slide includes two large pie charts displaying the distribution of markets between developed and emerging regions and the breakdown of sales channels.
Market Analysis and Trends
Consumer Goods
Discusses the geographical distribution and sales channels of the company's global business, highlighting its strong position in emerging markets.
global, emerging markets, sales channels, developed markets, market distribution
false
Market Analysis and Trends
Consumer Goods
Multiple Chart
Deutsche Bank
Add to my slides
Remove from favorites
Complex layout with multiple visual elements: a column chart, world map, icons for services, and text blocks describing performance drivers.
Financial Performance
Financial Services
Focuses on the growth of a financial platform and client value drivers, useful for illustrating a company’s market performance.
Global Equities, Client-centric, Growth, Execution, Performance
false
Financial Performance
Financial Services
Mixed Chart
Goldman Sachs
Add to my slides
Remove from favorites
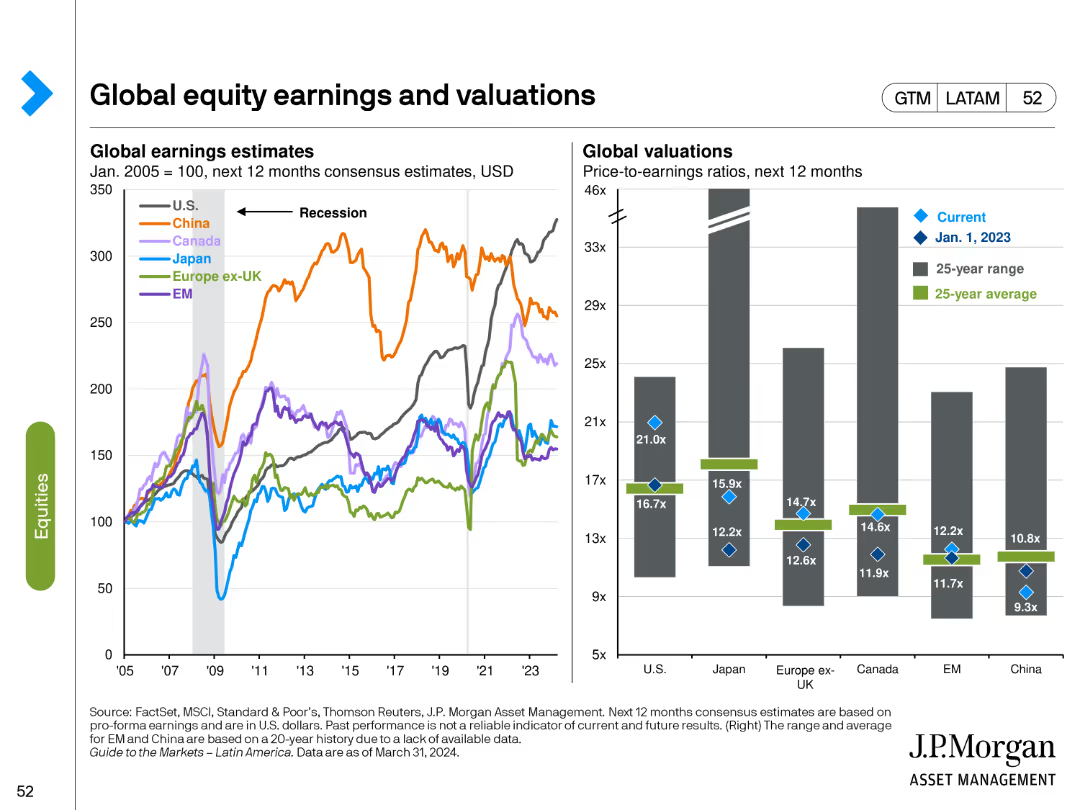
This slide includes a line chart for global earnings estimates and a bar chart for global valuations. Different colors represent various regions and time periods, highlighting trends and comparisons.
Financial Performance
Financial Services
It provides a comparison of earnings estimates and valuation metrics across global equity markets, helping to identify trends and potential investment opportunities based on relative valuations.
Global equities, earnings estimates, valuations, comparative analysis, trends
false
Financial Performance
Financial Services
Multiple Chart
JP Morgan
Add to my slides
Remove from favorites
Two charts illustrating earnings growth rates and growth estimates for global equities, comparing various regions and future projections.
Investment Analysis
Financial Services
The slide focuses on the earnings growth and future revisions for global equities, highlighting trends and forecasts for different geographical markets.
global equities, earnings growth, revisions, forecasts, regions
false
Investment Analysis
Financial Services
Multiple Chart
JP Morgan
Add to my slides
Remove from favorites
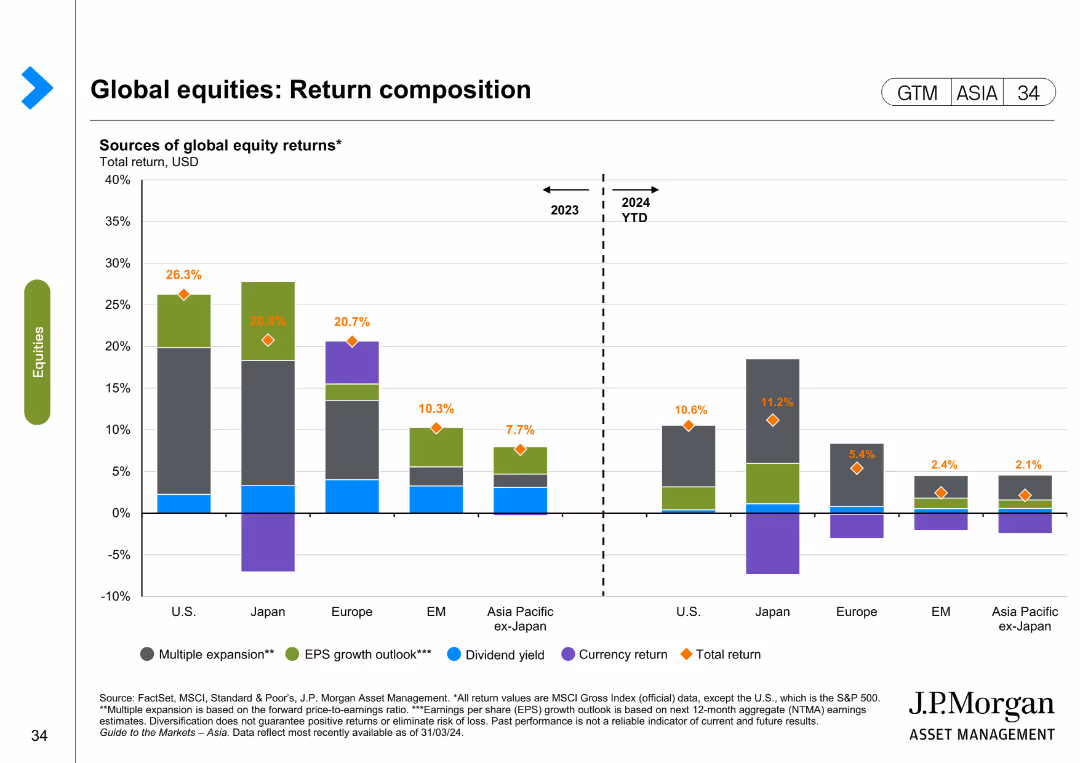
The slide features a column chart showing sources of global equity returns for different regions. The layout is detailed and moderately complex.
Investment Analysis
Financial Services
This slide analyzes the composition of global equity returns, breaking down the contributions of different factors such as multiple expansion and earnings growth.
global equities, return composition, investment analysis, regional comparison, equity returns
false
Investment Analysis
Financial Services
Single Chart
JP Morgan
Add to my slides
Remove from favorites
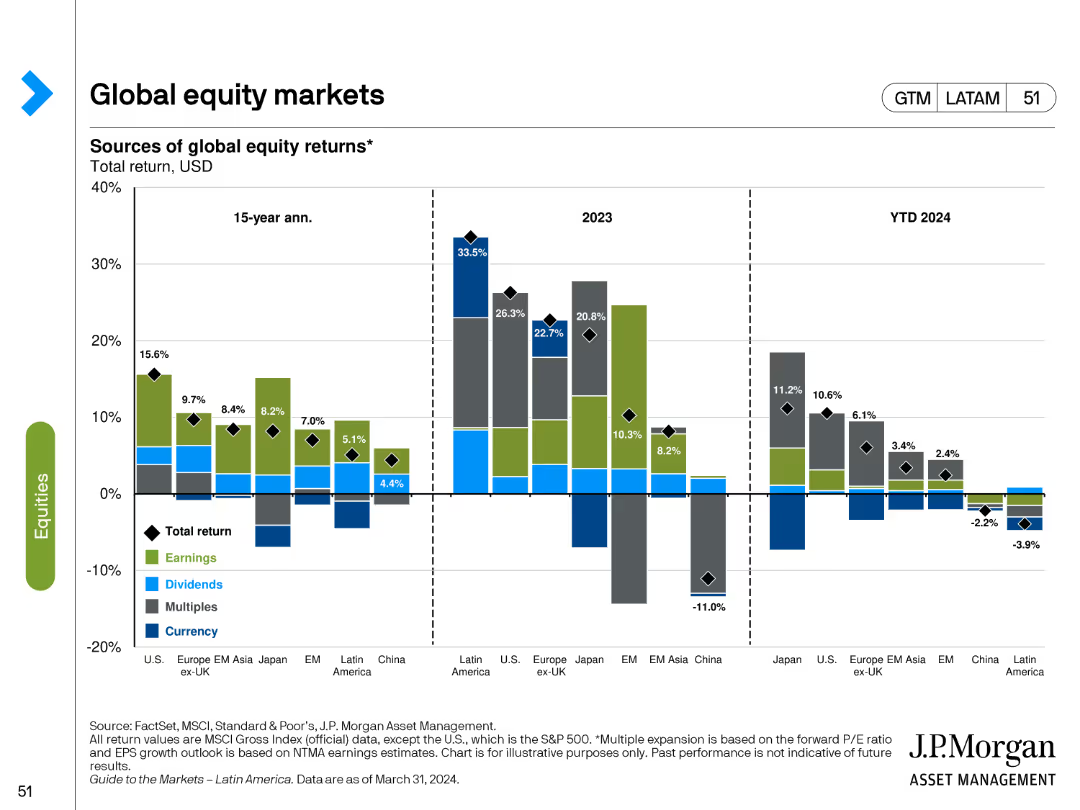
The slide features bar charts showing sources of global equity returns over different time periods. It uses various colors to represent different components of total return, such as earnings, dividends, and currency effects.
Market Analysis and Trends
Financial Services
It examines the sources of equity returns across global markets, providing insights into the factors driving performance in different regions and time frames.
Global equities, returns, earnings, dividends, currency effects
false
Market Analysis and Trends
Financial Services
Multiple Chart
JP Morgan
Add to my slides
Remove from favorites
Two column charts detailing sources of return for global equities and global valuations, including EPS, multiples, and dividends for various regions.
Investment Analysis
Financial Services
This slide provides an analysis of the sources of return and valuation metrics for global equities, comparing performance across different regions and indicators.
global equities, return sources, valuations, EPS, multiples, dividends
false
Investment Analysis
Financial Services
Multiple Chart
JP Morgan
Add to my slides
Remove from favorites
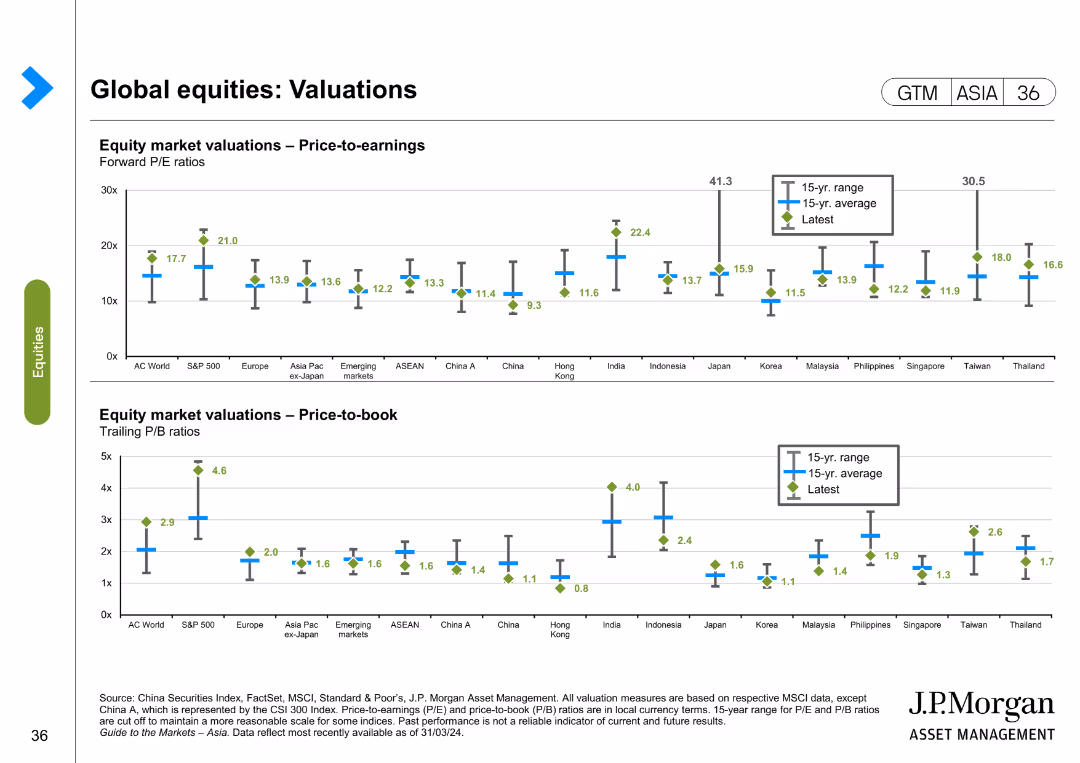
This slide contains two column charts. The first chart shows equity market valuations in terms of price-to-earnings ratios for various regions. The second chart shows price-to-book ratios. Color coding and markers represent different data points such as 15-year range, 15-year average, and the latest values.
Financial Performance
Financial Services
The slide analyzes global equity valuations through price-to-earnings and price-to-book ratios, comparing different regions to identify market trends and investment opportunities. It is used for financial performance evaluation and investment decision-making.
Global equities, valuations, price-to-earnings, price-to-book, financial markets, investment, Asia, Europe, AC World, S&P 500
false
Financial Performance
Financial Services
Multiple Chart
JP Morgan
Add to my slides
Remove from favorites
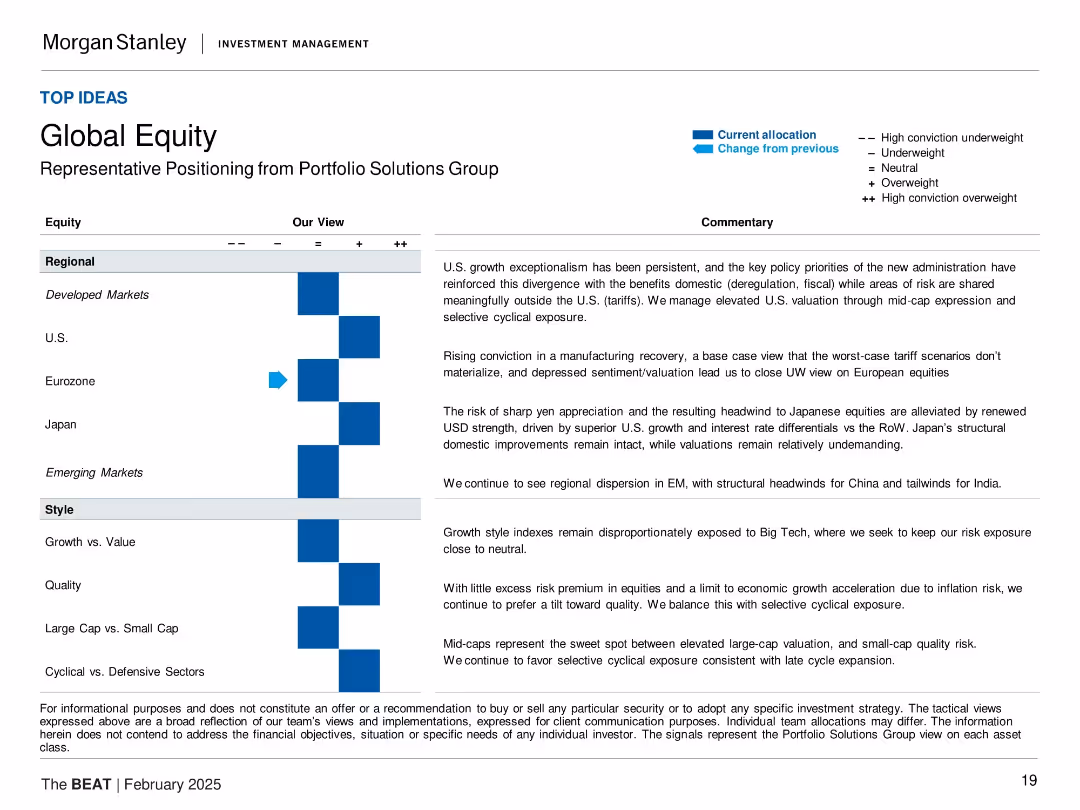
Matrix of equity views by region and style with commentary; professional layout with callouts.
Strategic Planning
Financial Services
This slide shows strategic equity allocations across regions (U.S., Eurozone, Japan, EM) and styles (Growth, Value, Quality). Commentary reflects views on macroeconomic risks and earnings outlook in different geographies.
global equity, allocation, growth vs value, regional equities, investment strategy, market outlook, Morgan Stanley
false
Strategic Planning
Financial Services
Table
Morgan Stanley
Add to my slides
Remove from favorites
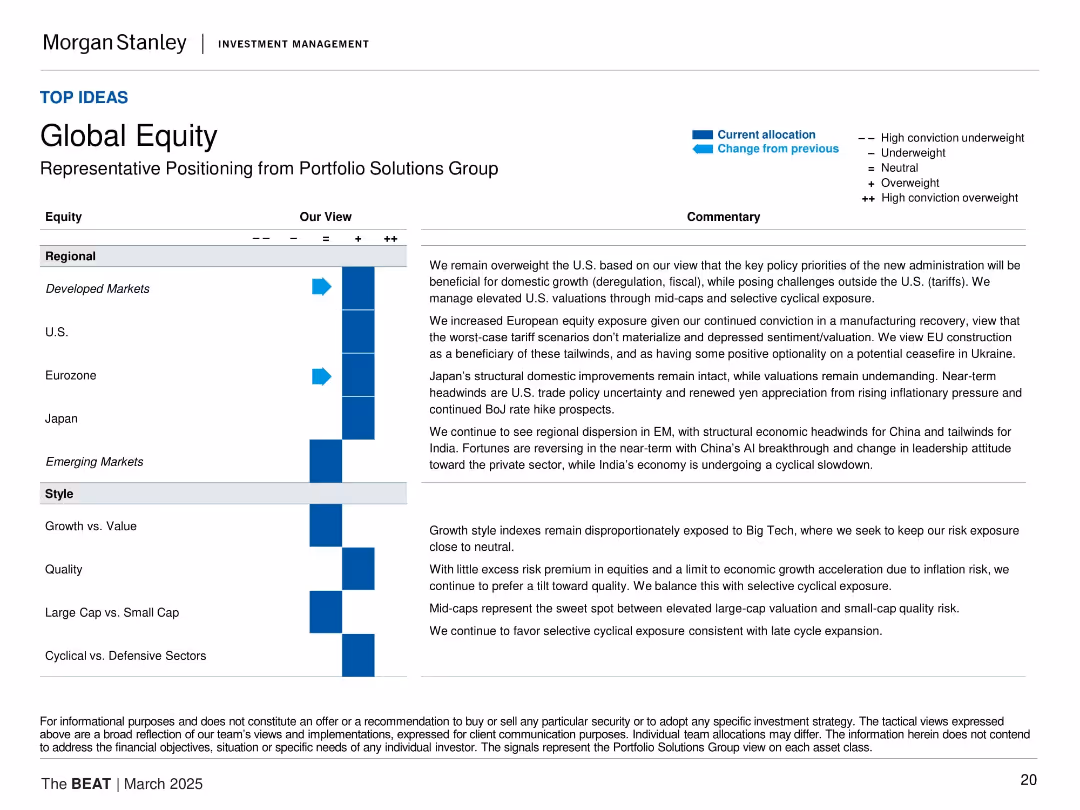
Same format as previous slides: allocation matrix on left, with categories like Developed Markets, U.S., Eurozone, Japan, etc. Commentary on right justifies views based on macroeconomic themes and regional developments.
Strategic Planning
Financial Services
The slide provides Morgan Stanley's global equity views, emphasizing overweight in developed markets, especially the U.S. and Europe. It discusses improving economic prospects, fiscal policies, and favorable tailwinds in construction and manufacturing as key drivers for equity exposure.
global equity, developed markets, U.S. economy, EU recovery, macro themes, Japan, emerging markets, cyclical exposure, fiscal policy
false
Strategic Planning
Financial Services
Table
Morgan Stanley
Add to my slides
Remove from favorites
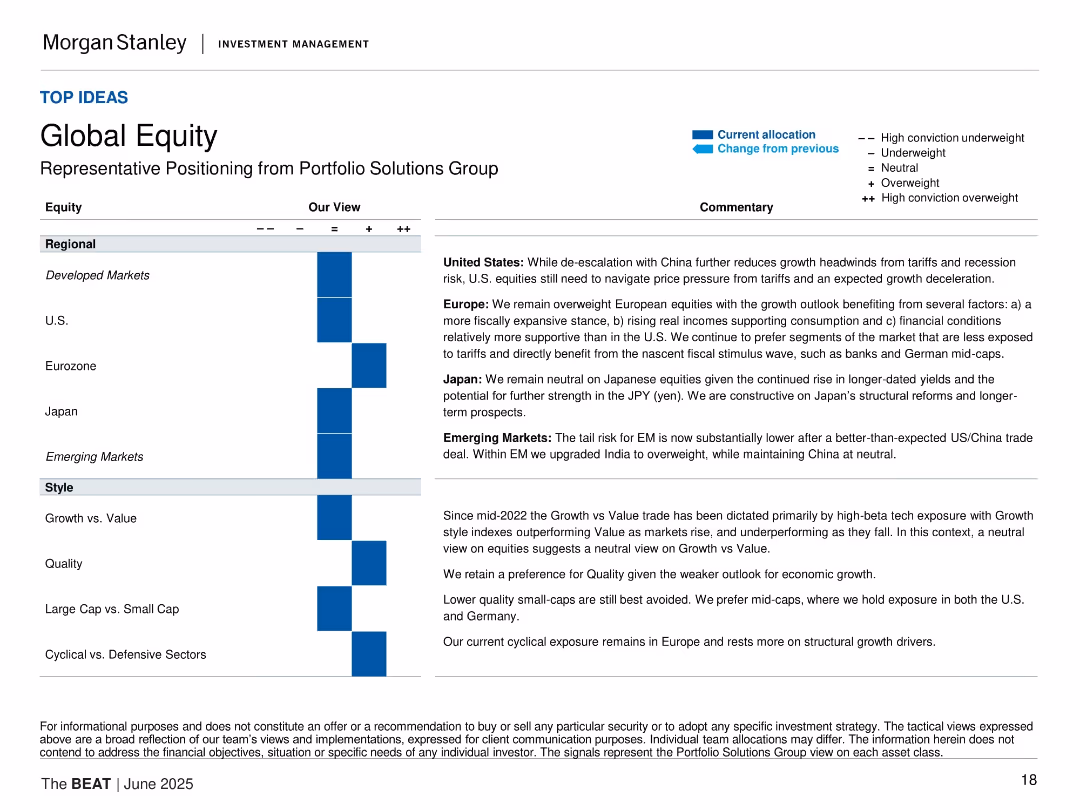
Structured by region and style factors with commentary alongside sentiment views
Market Analysis and Trends
Financial Services
Offers a regional and stylistic perspective on equity positioning. It explains favorable U.S. exposure, cautious stance on Eurozone equities, and a preference for quality and mid-cap stocks. Emphasis is placed on U.S. growth, macro divergence, and risk-adjusted positioning.
global equity, regional exposure, style factors, developed markets, growth vs value, mid-cap, quality equities
false
Market Analysis and Trends
Financial Services
Table
Morgan Stanley
Add to my slides
Remove from favorites
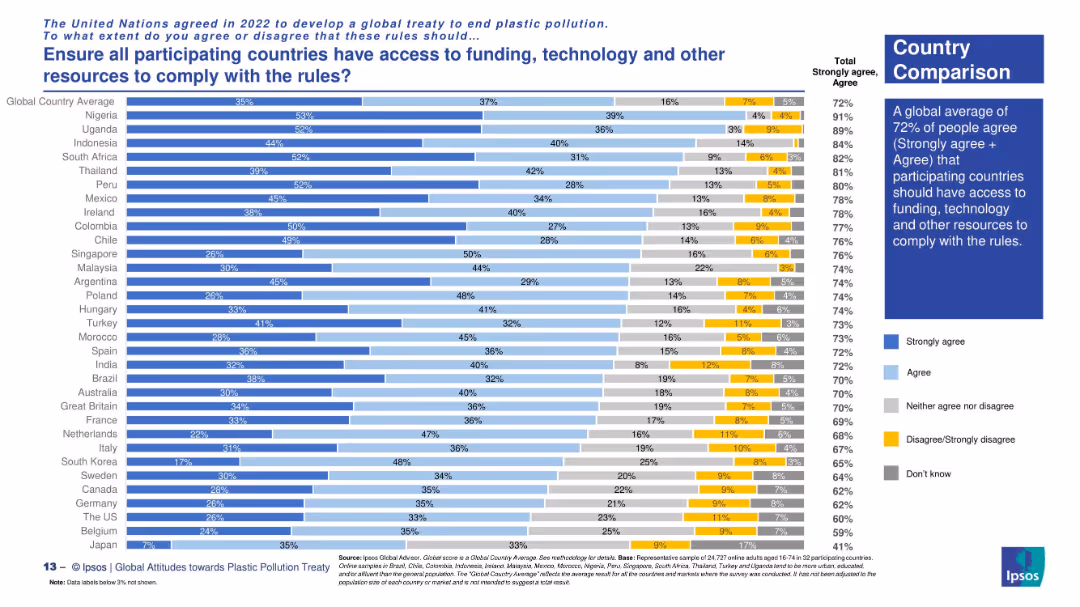
Country comparison via horizontal stacked bars with clear response categories.
Regulatory and Compliance
Environmental Services & Sustainability
The slide explores support across nations for ensuring equitable access to resources for treaty compliance. Highest support comes from Nigeria, Uganda, and South Africa. The global average for agreement is 72%.
global equity, treaty implementation, resource access, plastic rules, funding support, Ipsos survey, environmental policy, country views
false
Regulatory and Compliance
Environmental Services & Sustainability
Mixed Chart
IPSOS
Add to my slides
Remove from favorites
A global map highlighted in purple shades with yield percentages for various countries prominently displayed, facilitates a geographical comparison of equity yields.
Market Analysis and Trends
Financial Services
This visual slide displays global equity yields, simplifying the comparison of investment returns across countries, which can guide international investment strategies.
global, equity yields, investment returns, geographical comparison, countries, map, strategy, finance
false
Market Analysis and Trends
Financial Services
Graphic
Morgan Stanley
Add to my slides
Remove from favorites
Displays multiple pie charts and a geographic distribution chart, illustrating sales by customer and region. Visually complex and information-rich.
Client Case Studies
Transportation & Logistics
Summarizes Faurecia's transformation and global expansion through diversified customer portfolios and geographic sales distribution, highlighting its strengthened market position worldwide.
global expansion, customer portfolio, sales distribution, automotive
false
Client Case Studies
Transportation & Logistics
Multiple Chart
Deutsche Bank
Add to my slides
Remove from favorites
A triangle graphic represents wealth segments, while column chart track the growth of wealth management advisors, all in a color-coded scheme for clarity.
Financial Performance
Financial Services
The slide illustrates JPMorgan’s strategic growth in the wealth management sector, detailing the potential in different wealth segments and the expansion of advisor numbers.
global expansion, wealth management, JPMorgan, market segments, advisor growth, strategic planning
false
Financial Performance
Financial Services
Mixed Chart
JP Morgan
Add to my slides
Remove from favorites
Text-dominant layout with a column chart showing international revenue growth in blue bars and grey projection bar.
Financial Performance
Financial Services
Highlights JPMorgan Chase & Co.'s approach to serving multinational clients, with a focus on international expansion and the firm's revenue growth from it.
Global, Expertise, Revenue Growth, Multinational, Clients
false
Financial Performance
Financial Services
Mixed Chart
JP Morgan
Add to my slides
Remove from favorites
The slide features a line chart showing emerging market net portfolio flows as a percentage of GDP over time, with lines for China, other EM, and total.
Risk Assessment and Management
Financial Services
The slide details the challenges in the global financial landscape, focusing on the decline in emerging market portfolio flows due to US monetary tightening.
global financial landscape, portfolio flows, emerging markets, US monetary policy, financial challenges
false
Risk Assessment and Management
Financial Services
Mixed Chart
PwC/Strategy&
Add to my slides
Remove from favorites
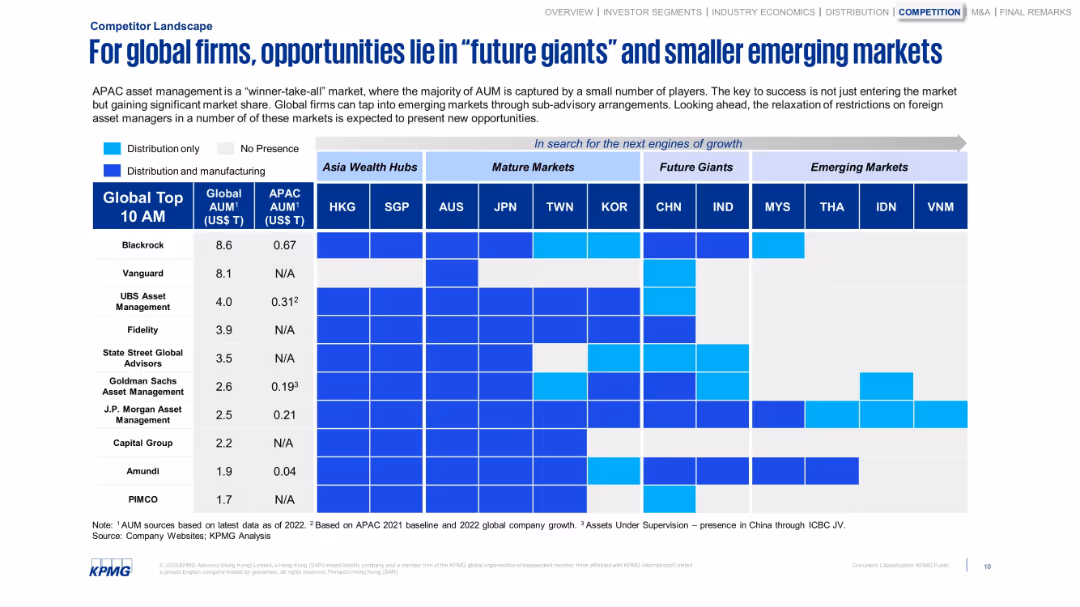
Grid matrix of global firms’ presence across markets. Coded by type of presence.
Competitive Landscape
Financial Services
Analyzes how major global asset managers are distributed across mature, future giant, and emerging APAC markets. Emphasizes the strategic opportunities in markets like India, Vietnam, and Indonesia due to rising AUM and reduced restrictions.
global firms, APAC, asset managers, emerging markets, competition
false
Competitive Landscape
Financial Services
Single Chart
KPMG
Add to my slides
Remove from favorites
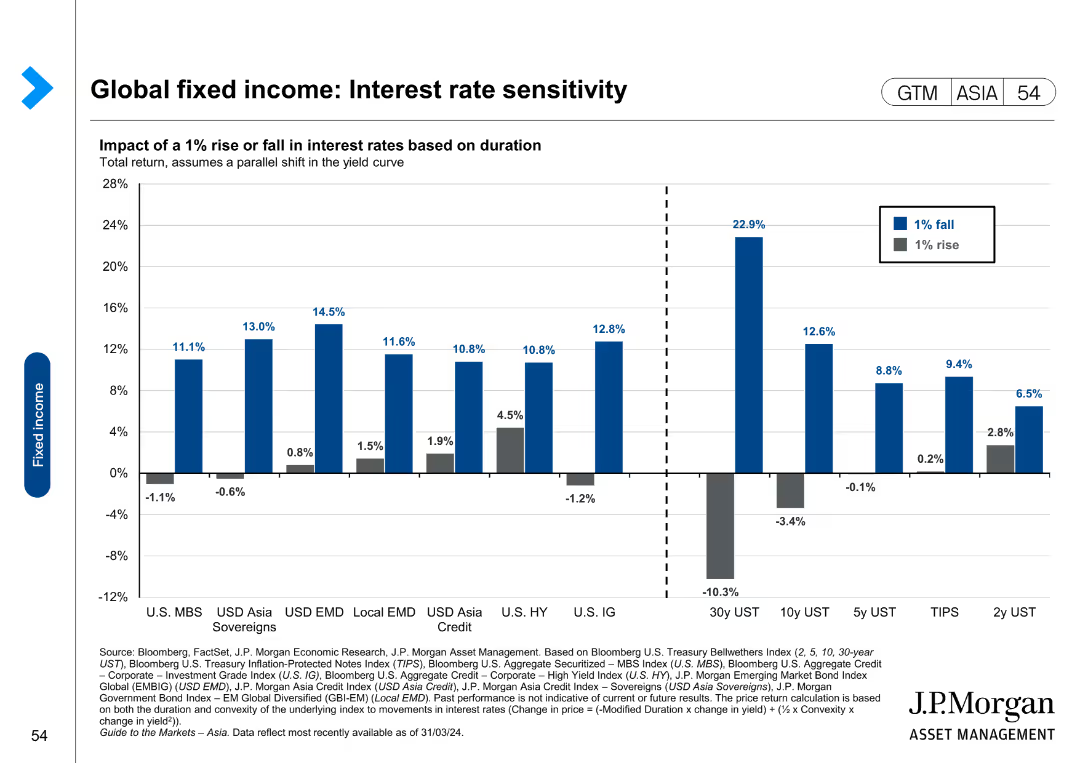
The slide features a bar chart showing the impact of a 1% rise or fall in interest rates on total return across various fixed income categories.
Risk Assessment and Management
Financial Services
This slide analyzes interest rate sensitivity for global fixed income investments, illustrating the impact of interest rate changes on total returns. It is used for risk assessment and management.
Global fixed income, interest rate sensitivity, total return, risk assessment, management
false
Risk Assessment and Management
Financial Services
Single Chart
JP Morgan
Add to my slides
Remove from favorites
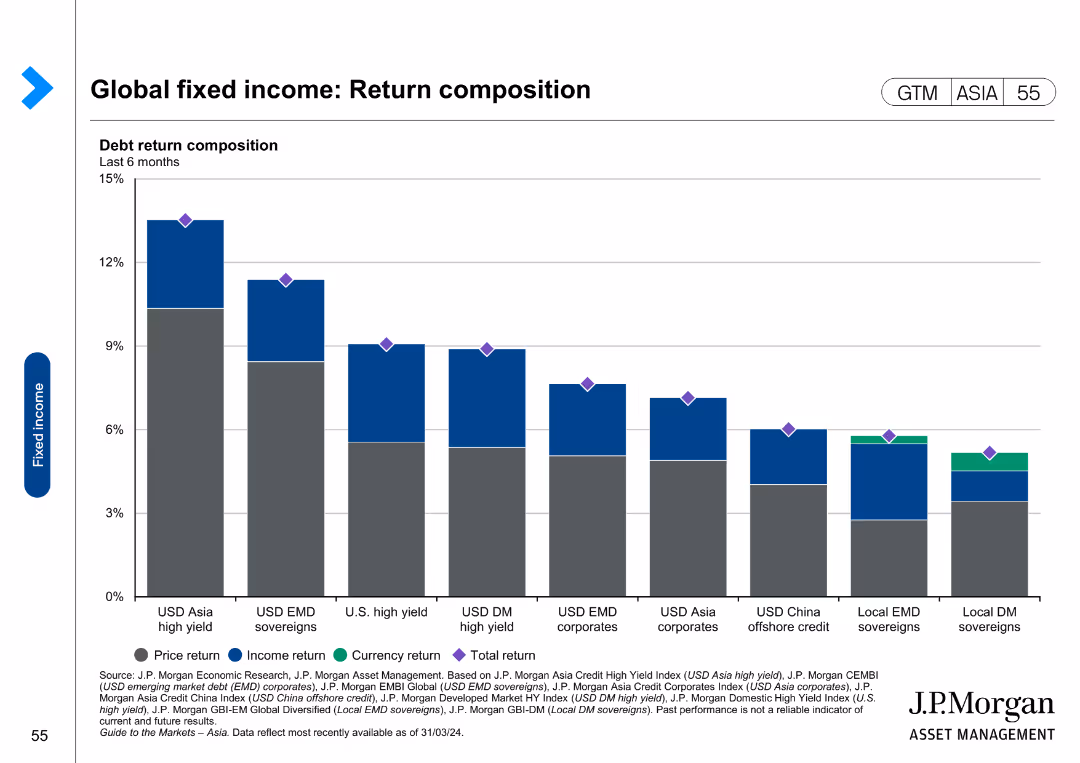
The slide contains a bar chart showing debt return composition for different fixed income categories, divided into price return, income return, and currency return.
Financial Performance
Financial Services
This slide evaluates return composition for global fixed income investments, breaking down returns into price, income, and currency components. It is used for financial performance analysis and investment strategy development.
Global fixed income, return composition, price return, income return, currency return, investment strategy
false
Financial Performance
Financial Services
Single Chart
JP Morgan
Add to my slides
Remove from favorites
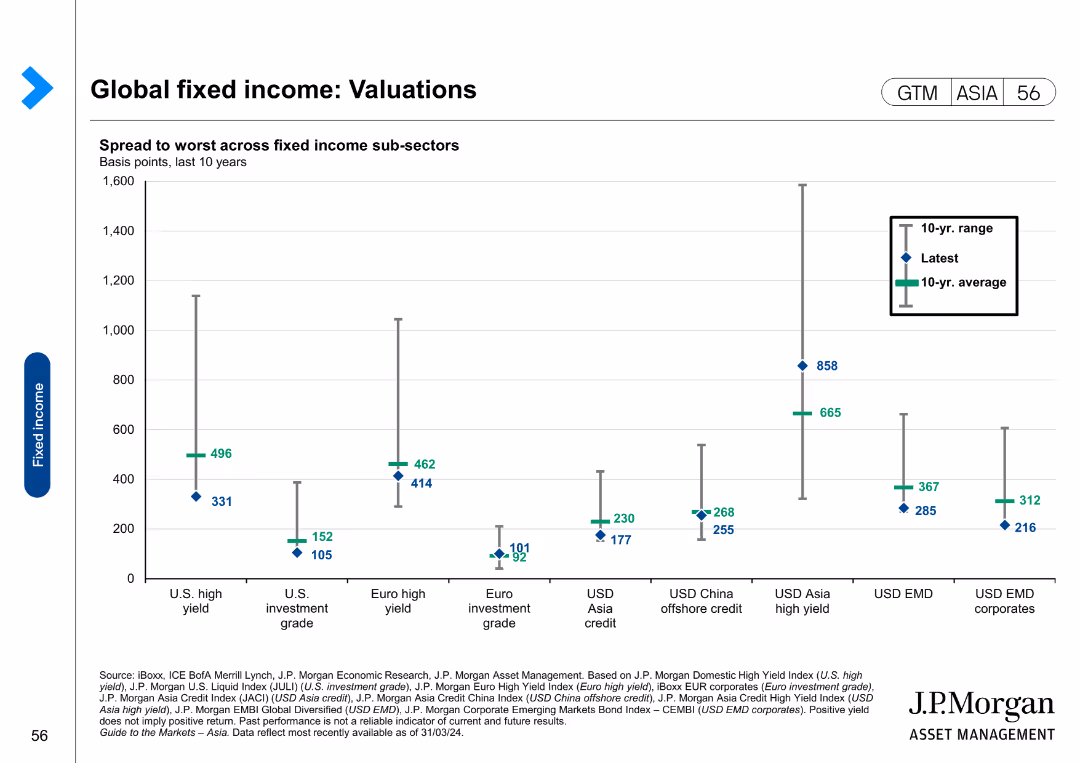
The slide features a scatter plot showing the spread to worst across fixed income sub-sectors over the last 10 years.
Market Analysis and Trends
Financial Services
The slide analyzes valuations in global fixed income markets, focusing on spreads across various sub-sectors. It is used for market analysis and investment decision-making.
Global fixed income, valuations, spreads, sub-sectors, market analysis, investment
false
Market Analysis and Trends
Financial Services
Single Chart
JP Morgan
Add to my slides
Remove from favorites
The slide contains a bar chart showing fixed income yields to maturity for different bond categories, divided into developed market government bonds, investment-grade bonds, high yield bonds, and Asia & emerging market bonds.
Financial Performance
Financial Services
This slide provides an overview of global fixed income yields and duration, highlighting yields to maturity for various bond categories. It is used for financial performance evaluation and fixed income strategy planning.
Global fixed income, yields, duration, bonds, investment-grade, high yield, emerging markets
false
Financial Performance
Financial Services
Multiple Chart
JP Morgan
Add to my slides
Remove from favorites
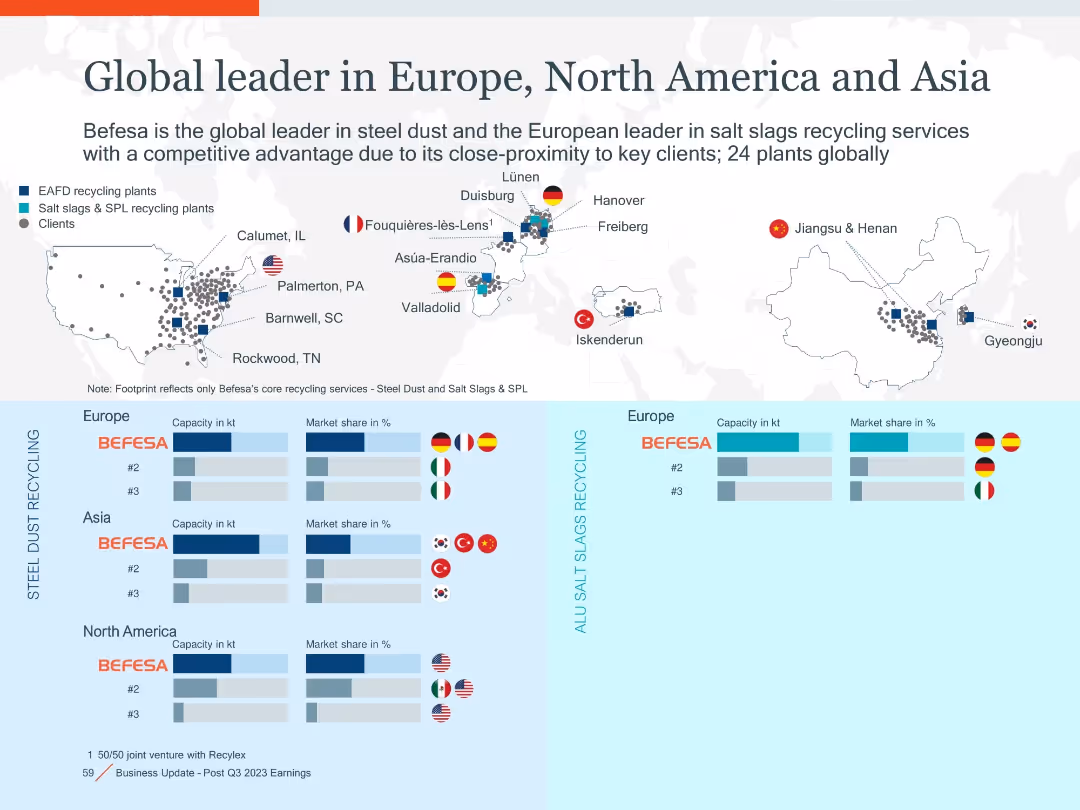
Map with plant and client locations, color-coded regions and bar graphs for market share/capacity by region.
Industry Overview
Industrial & Manufacturing
Visual overview of Befesa’s global footprint in steel dust and salt slags recycling, emphasizing its competitive positioning across Europe, Asia, and North America with 24 plants and high market share.
global footprint, plant map, recycling, Befesa, market share, steel dust
false
Industry Overview
Industrial & Manufacturing
Mixed Chart
Goldman Sachs
Add to my slides
Remove from favorites
The slide features a circular diagram representing global forces with different areas like 'business fragmentation' and 'individualism'. Each segment has brief descriptors and the design is color-coded for clarity.
Strategic Planning
Professional Services
This appendix slide offers a conceptual framework for understanding the forces influencing global business and people management. It associates various global trends with potential impacts on business structures and decision-making, providing a reference point for considering future scenarios in a corporate context.
Global forces, business trends, people management, conceptual framework
false
Strategic Planning
Professional Services
Framework
PwC/Strategy&
Add to my slides
Remove from favorites
Bar graph on the slide represents global capital spending as a percentage of GDP, with an increasing trend shown in different shades of blue. Annotations provide a year-by-year breakdown.
Investment Analysis
Environmental Services & Sustainability
Describes the front-loaded nature of investment in the net-zero transition, with spending rising to a peak percentage of global GDP by 2030 before reducing again. Indicates the importance of initial investment to facilitate long-term change.
Global GDP, Capital Spending, Net-Zero, Transition, Investment, 2030
false
Investment Analysis
Environmental Services & Sustainability
Single Chart
McKinsey
Add to my slides
Remove from favorites
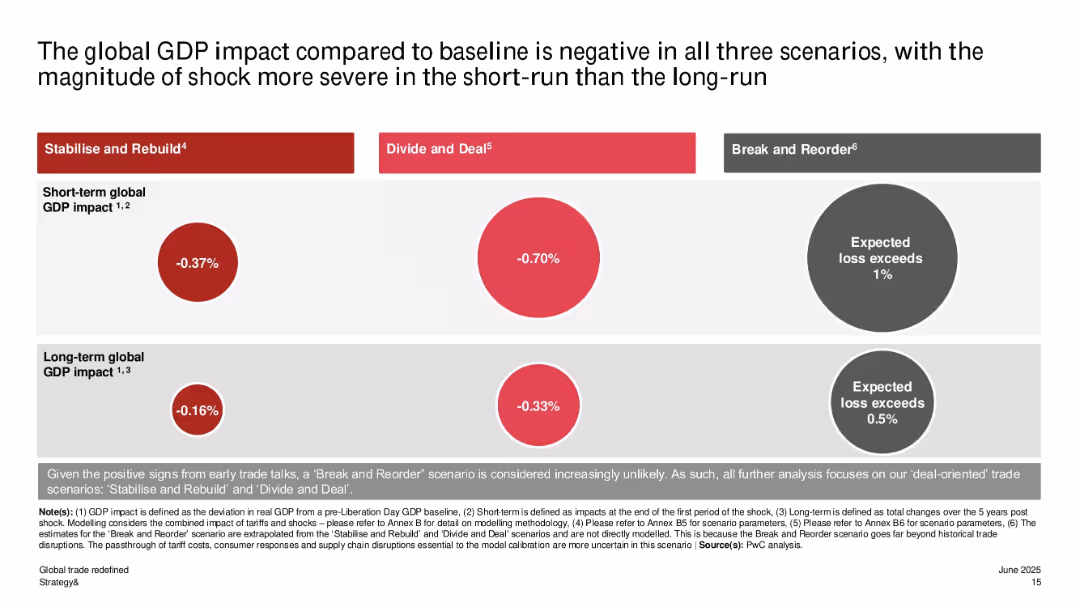
Matrix layout with red/grey circles showing short-term and long-term GDP impact across three scenarios; each scenario is labeled and explained.
Investment Analysis
Government & Public Sector
The slide quantifies short- and long-term GDP deviations from baseline under three trade policy scenarios. It shows that all scenarios lead to economic contraction, particularly in the short term. The most severe is “Break and Reorder”, with potential losses exceeding 1%.
global GDP, economic impact, trade shocks, policy scenarios, economic modeling, PwC analysis, long-term effects, Stabilise and Rebuild, Divide and Deal
false
Investment Analysis
Government & Public Sector
Single Chart
PwC/Strategy&
Add to my slides
Remove from favorites
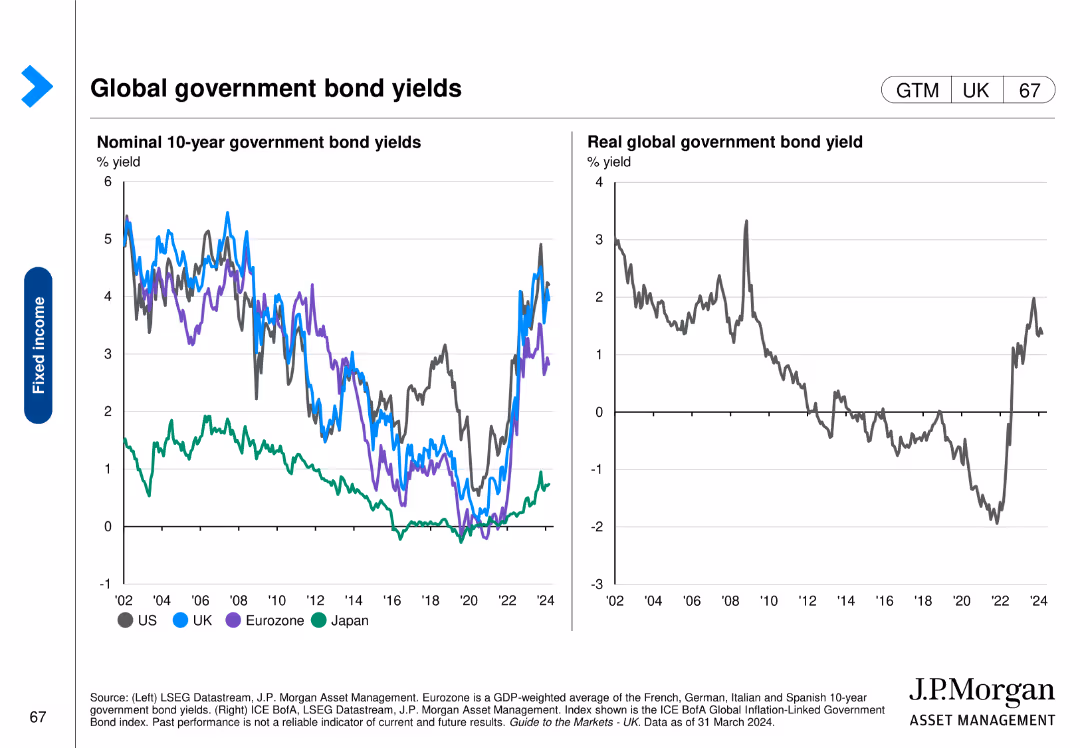
This slide contains two line charts. The first chart shows nominal 10-year government bond yields over time for various regions. The second chart shows real global government bond yields over time.
Financial Performance
Financial Services
The slide provides an analysis of nominal and real global government bond yields, offering insights into financial performance and trends.
global, government, bond yields, nominal, real, financial performance, analysis
false
Financial Performance
Financial Services
Multiple Chart
JP Morgan
Add to my slides
Remove from favorites
The slide includes a pie chart for regional distribution of advisors and text boxes detailing strategies for growth in different regions. The design is clean and professional, with strategic use of color and checkmarks for emphasis.
Strategic Planning
Financial Services
It details the firm’s strategy for increasing the scale of its global advisor workforce, emphasizing growth targets and methods for advisor acquisition in the Americas, EMEA, and APAC regions.
global growth, advisors, strategy, wealth management
false
Strategic Planning
Financial Services
Single Chart
Goldman Sachs
Add to my slides
Remove from favorites
The slide displays two line charts. The left chart shows the quarterly real GDP growth of developed markets, with distinct lines for the US, Eurozone, and Japan. The right chart shows the same for emerging markets, including China, India, and Brazil.
Market Analysis and Trends
Financial Services
The slide forecasts global GDP growth for developed and emerging markets, providing year-over-year change data. It is used for analyzing future economic conditions and making strategic financial decisions.
global growth, GDP, forecasts, developed markets, emerging markets, US, Eurozone, Japan, China, India, Brazil
false
Market Analysis and Trends
Financial Services
Multiple Chart
JP Morgan
Add to my slides
Remove from favorites
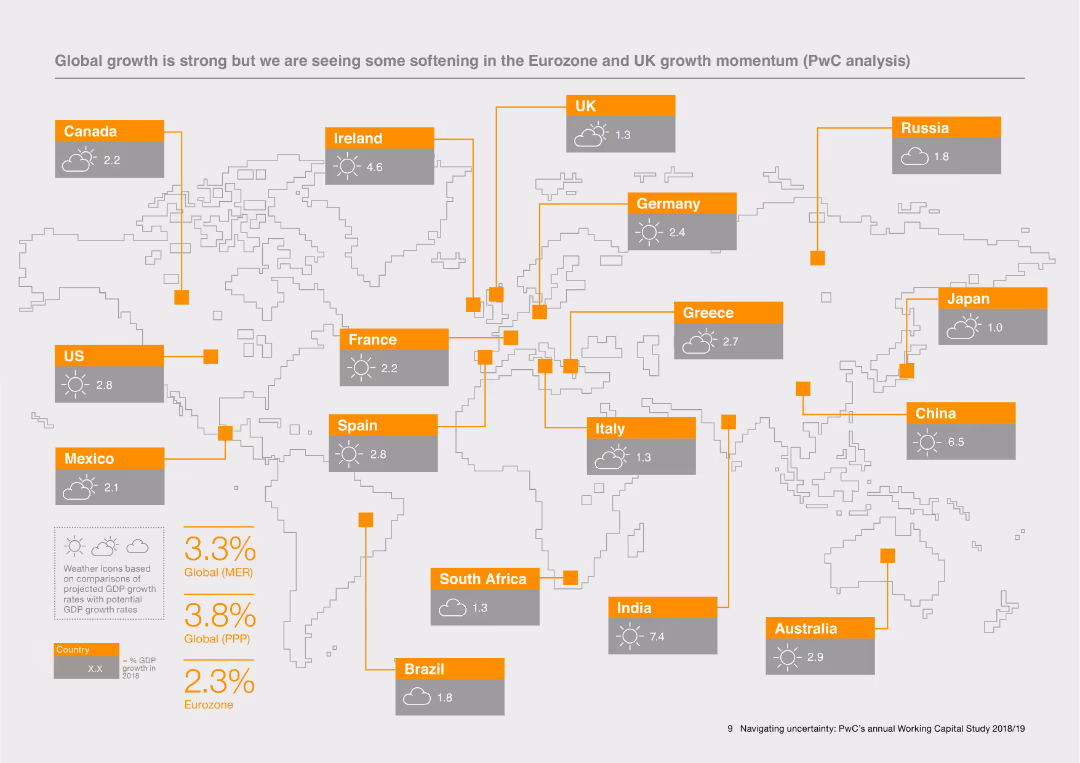
The slide presents a world map with highlighted countries, each showing projected GDP growth rates for 2018. The countries are marked with weather icons indicating economic conditions. An orange color scheme is used for labels and icons, and growth rates are displayed in percentage.
Market Analysis and Trends
Financial Services
This slide provides a visual overview of global GDP growth rates with a focus on the Eurozone and UK. The weather icons indicate economic conditions, while the map and data points highlight the projected growth rates for various countries in 2018.
Global growth, GDP rates, economic conditions, Eurozone, UK, PwC analysis, world map
false
Market Analysis and Trends
Financial Services
Graphic
PwC/Strategy&
Add to my slides
Remove from favorites
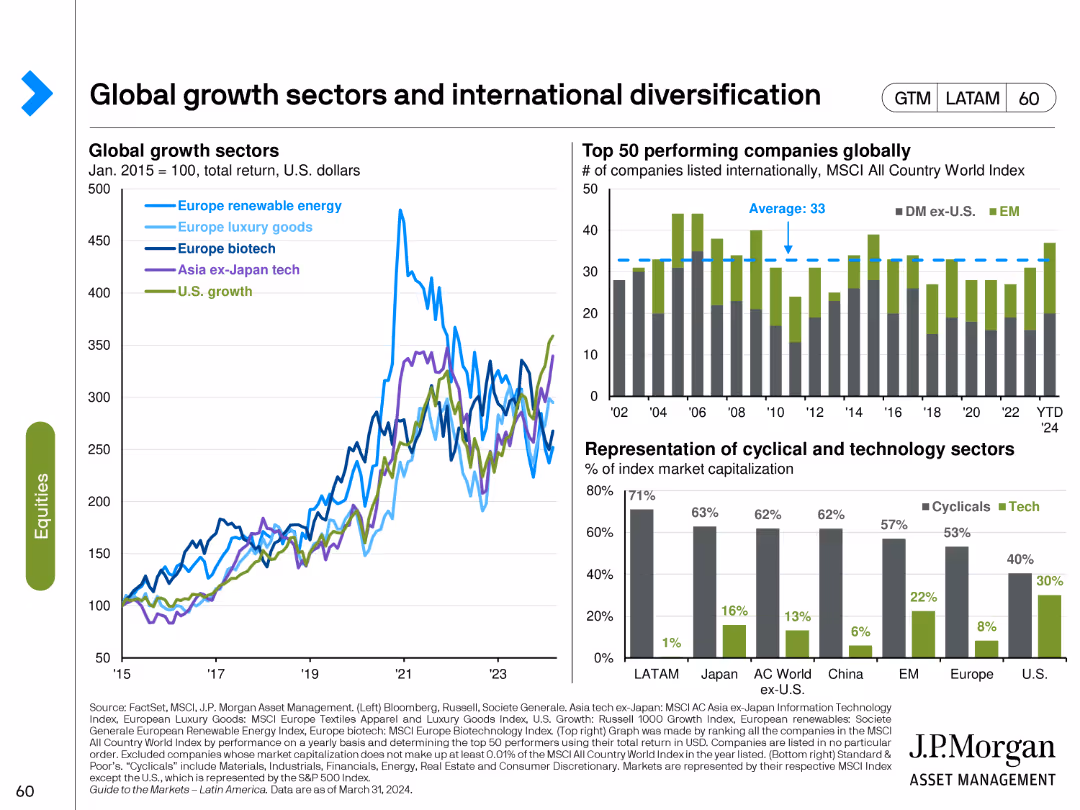
The slide includes a line chart comparing global growth sectors and a bar chart showing the top 50 performing companies globally. Another bar chart depicts the representation of cyclical and technology sectors.
Market Analysis and Trends
Financial Services
This slide discusses the performance of various global growth sectors and the diversification of investments across different regions, highlighting top-performing companies and sectors.
global growth, international diversification, sectors, performance, top companies
false
Market Analysis and Trends
Financial Services
Multiple Chart
JP Morgan
Add to my slides
Remove from favorites
World map with colored countries indicating different growth rates in entertainment and media expenditures from 2019 to 2023.
Market Analysis and Trends
Media & Entertainment
Predicts the growth rates in entertainment and media expenditures globally, with a focus on BRIC and mature markets.
Global, Growth Rate, Entertainment, Media, Expenditures, 2019-2023, BRIC, Mature Markets
false
Market Analysis and Trends
Media & Entertainment
Graphic
PwC/Strategy&
Add to my slides
Remove from favorites
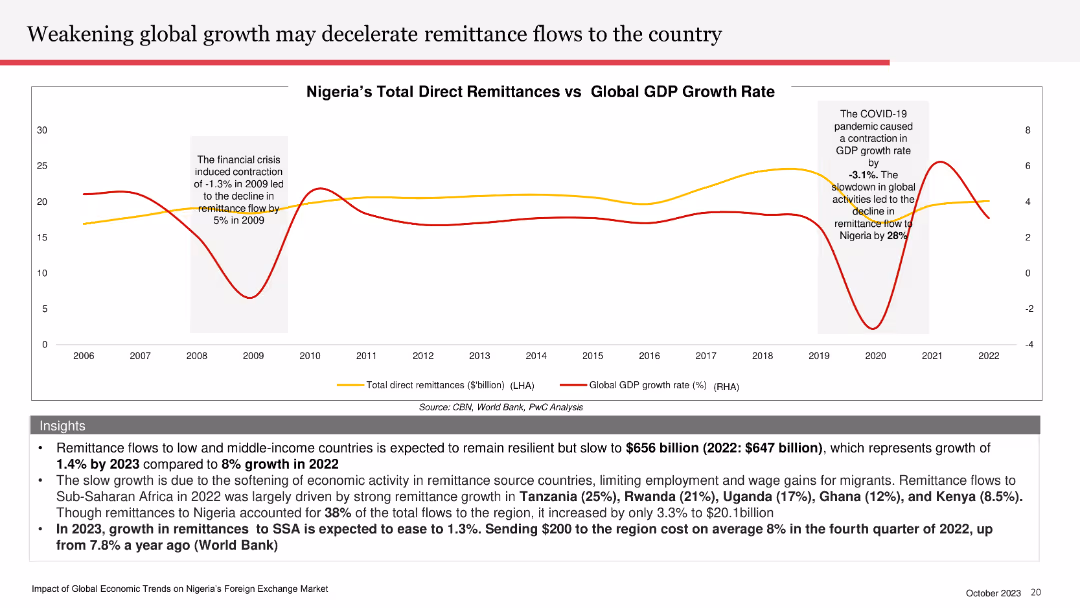
The slide features a line chart comparing Nigeria’s total direct remittances with global GDP growth rate, with separate lines for each.
Market Analysis and Trends
Financial Services
The slide explores how weakening global economic growth may slow remittance flows to Nigeria, with specific data and forecasts.
global growth, remittance flows, Nigeria, GDP growth, economic trends
false
Market Analysis and Trends
Financial Services
Mixed Chart
PwC/Strategy&
Add to my slides
Remove from favorites
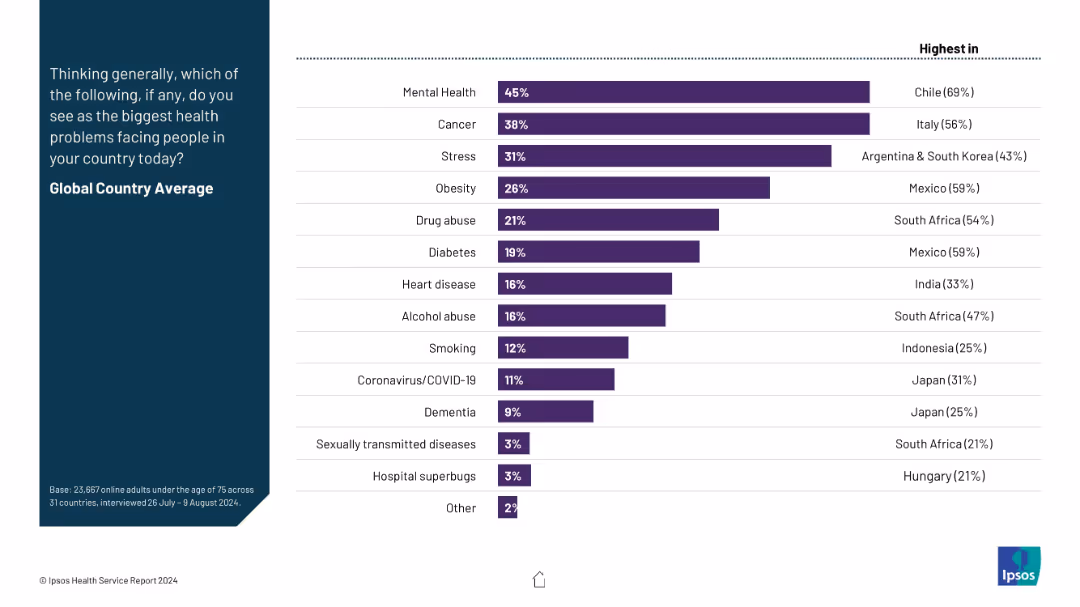
Horizontal bar chart showing top health concerns globally; includes highest-scoring countries per condition.
Market Analysis and Trends
Healthcare & Pharmaceuticals
This slide aggregates global perceptions of major health concerns. Mental health, cancer, and stress top the list, with country-specific highlights for each issue, revealing the global public’s evolving health priorities.
global health, mental health, public concern, stress, cancer, health priorities, survey ranking
false
Market Analysis and Trends
Healthcare & Pharmaceuticals
Mixed Chart
IPSOS
Add to my slides
Remove from favorites
Column charts comparing PMI output/activity for various industries and regions
Market Analysis and Trends
Financial Services
This slide analyzes PMI trends across different industries globally, highlighting the performance of consumer-facing sectors.
global industry, PMI, snapshot, February, trends
false
Market Analysis and Trends
Financial Services
Multiple Chart
Accenture
Add to my slides
Remove from favorites
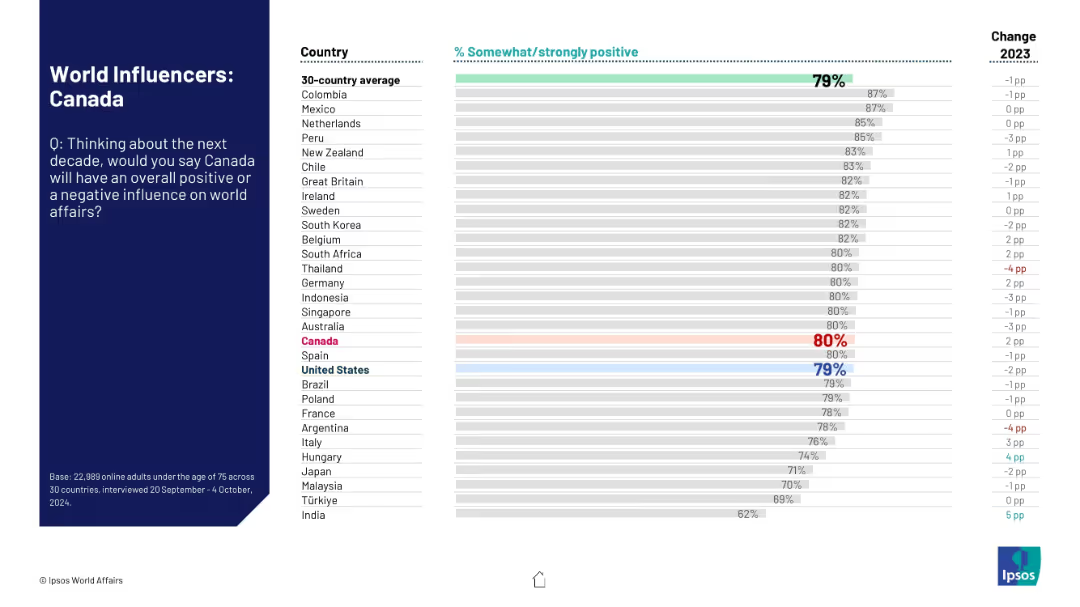
Standard Ipsos layout with ranked horizontal bars; shows 30-country perception of Canada's influence on world affairs over the next decade.
Strategic Planning
Government & Public Sector
This slide ranks global perceptions of Canada’s potential positive influence in world affairs over the next decade. Canada ranks high, with comparison to the 30-country average and change from previous year shown.
global influence, Canada, public opinion, world affairs, strategic perception, international relations, Ipsos ranking, soft power
false
Strategic Planning
Government & Public Sector
Mixed Chart
IPSOS
Add to my slides
Remove from favorites
This slide showcases a series of images representing various media sources with dates, signifying the ongoing discussion about innovation in the global context. Each image is a snapshot of a news headline from different prominent publications, with the background remaining consistently black. The slide layout is a montage of images, with clear captions underneath each to indicate the source and content relevance.
Product and Service Analysis
Technology & Software
The slide collates global news headlines that highlight innovation's role in the current global challenges and its presence on the global agenda. It is potentially used to emphasize the ubiquity of innovation in discussions across various sectors and to showcase the commitment of different sectors to innovative practices. This could be useful in a discussion on the pervasive nature of innovation and its importance across different domains.
global innovation, news headlines, media sources, COVID-19, sector commitment
false
Product and Service Analysis
Technology & Software
Boxed
BCG
Add to my slides
Remove from favorites
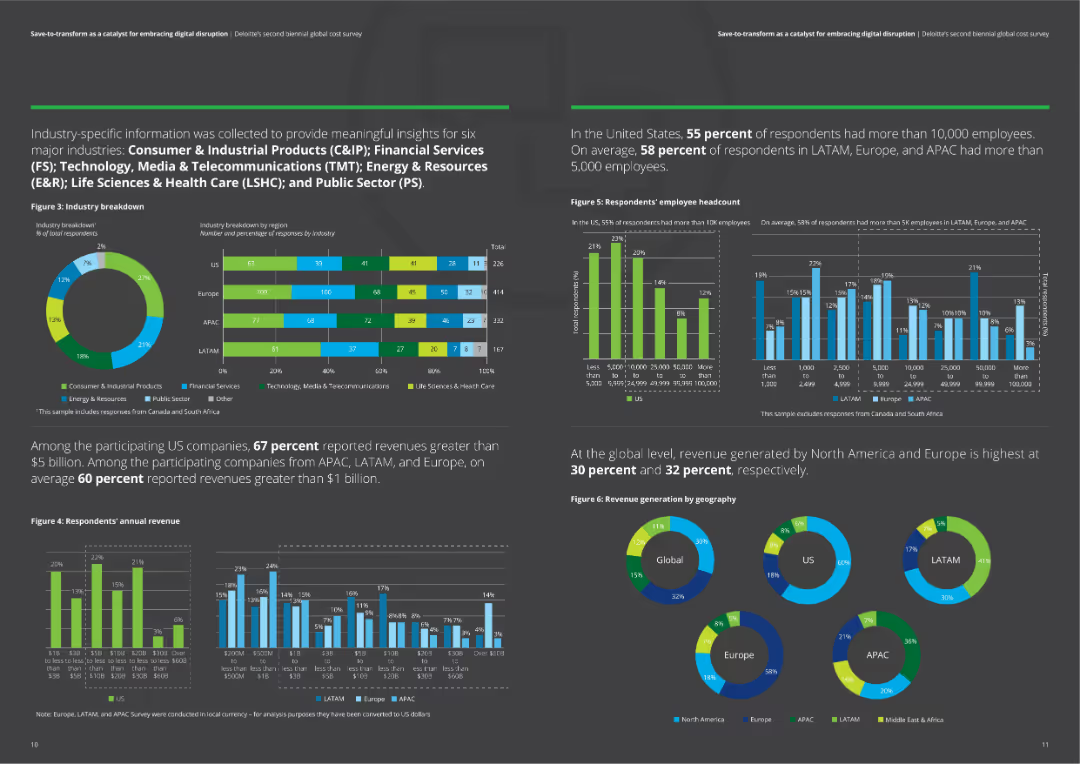
The slide is divided into two sections: a key insights summary on the left with a visual of a cityscape, and a detailed analysis on the right with column charts and key findings about global cost reduction trends and targets.
Market Analysis and Trends
Professional Services
This slide provides key global insights from Deloitte's survey, focusing on cost reduction trends and targets. It includes statistical data and key findings on the likelihood of cost reduction, with detailed analysis and graphical representation of the data.
global insights, cost reduction, Deloitte, survey findings
false
Market Analysis and Trends
Professional Services
Multiple Chart
Deloitte
Add to my slides
Remove from favorites
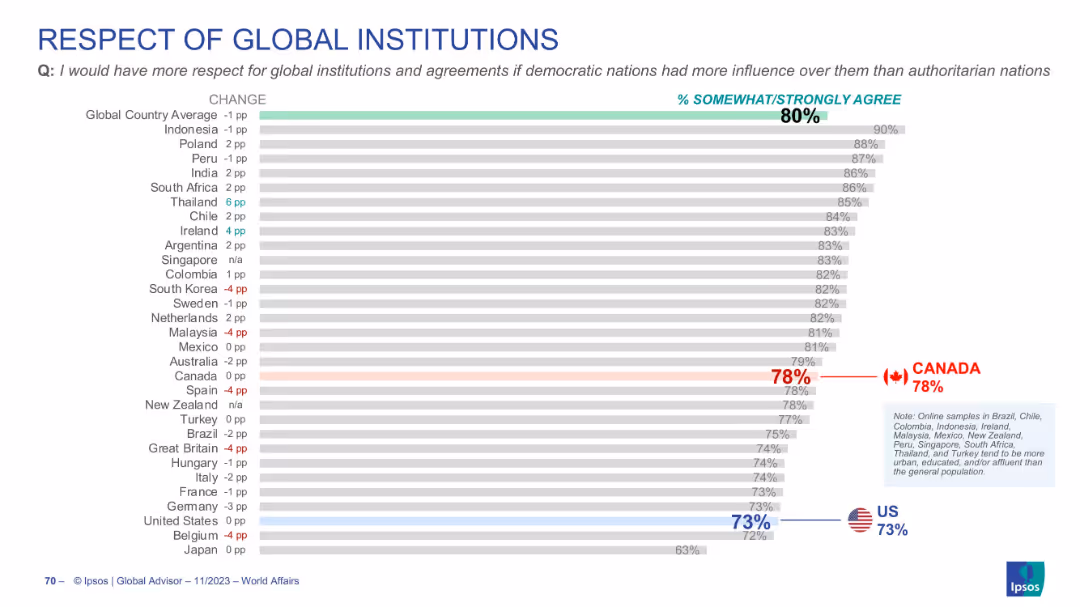
Bar chart displaying agreement on increased respect if democratic nations lead global institutions; sorted by agreement level; clear with flag markers.
Strategic Planning
Government & Public Sector
The chart shows that 80% globally agree they’d respect global institutions more if led by democracies. Canada ranks slightly below the average at 78%, while the US sits at 73%. Emphasizes the desire for democratic leadership in international affairs.
global institutions, democracy, respect, Canada, US, global governance
false
Strategic Planning
Government & Public Sector
Single Chart
IPSOS
Add to my slides
Remove from favorites
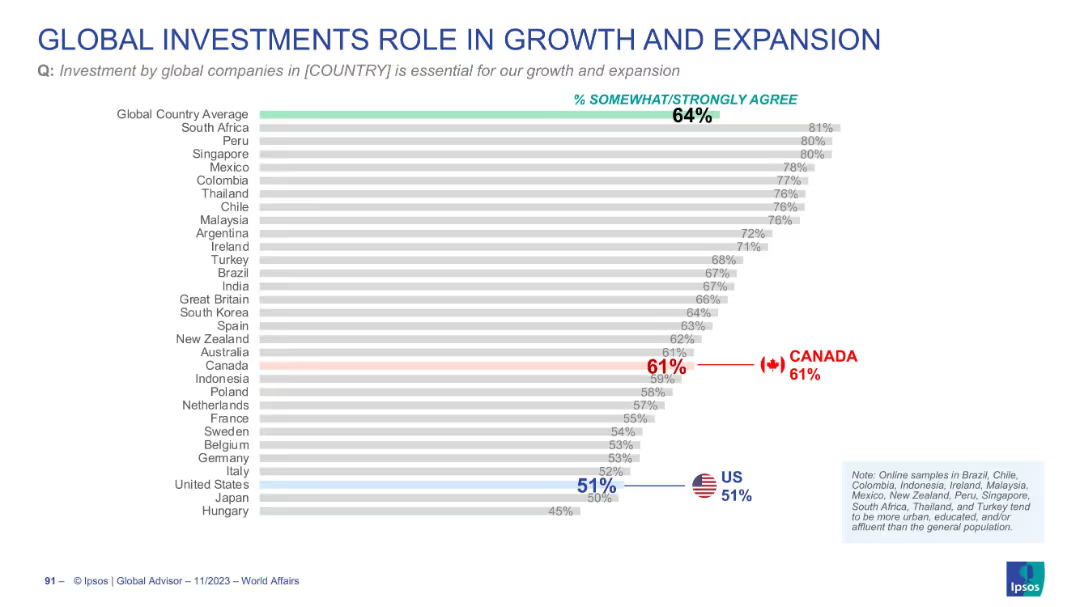
Horizontal bar chart ranking countries by agreement (% somewhat/strongly agree) on the importance of global investment for national growth; highlights global average, Canada, and the US in color. Grey bars used for other countries. Clean, professional layout.
Market Analysis and Trends
Financial Services
This slide shows how respondents in various countries perceive the importance of global investments for their nation's growth and expansion. The global average is 64%, with South Africa leading at 81%. Canada (61%) is slightly below the average, and the US (51%) is significantly lower.
global investment, economic growth, Canada, US, international perception, Ipsos, business expansion, rankings, bar chart, country comparison
false
Market Analysis and Trends
Financial Services
Single Chart
IPSOS
Add to my slides
Remove from favorites
Features a bar graphs, detailing global investments with annotations and comparative investment volumes and deal counts in top countries.
Market Analysis and Trends
Agriculture & Food Production
Analyzes global FoodTech sector investments in 2020, with focus on investment volumes and deal counts in the US, China, and India. Offers insight into geographic investment distribution and key market identification for FoodTech investments.
Global Investments, FoodTech, 2020, Investment Volumes, Deal Count, Geographic Distribution
false
Market Analysis and Trends
Agriculture & Food Production
Mixed Chart
Accenture
Add to my slides
Remove from favorites
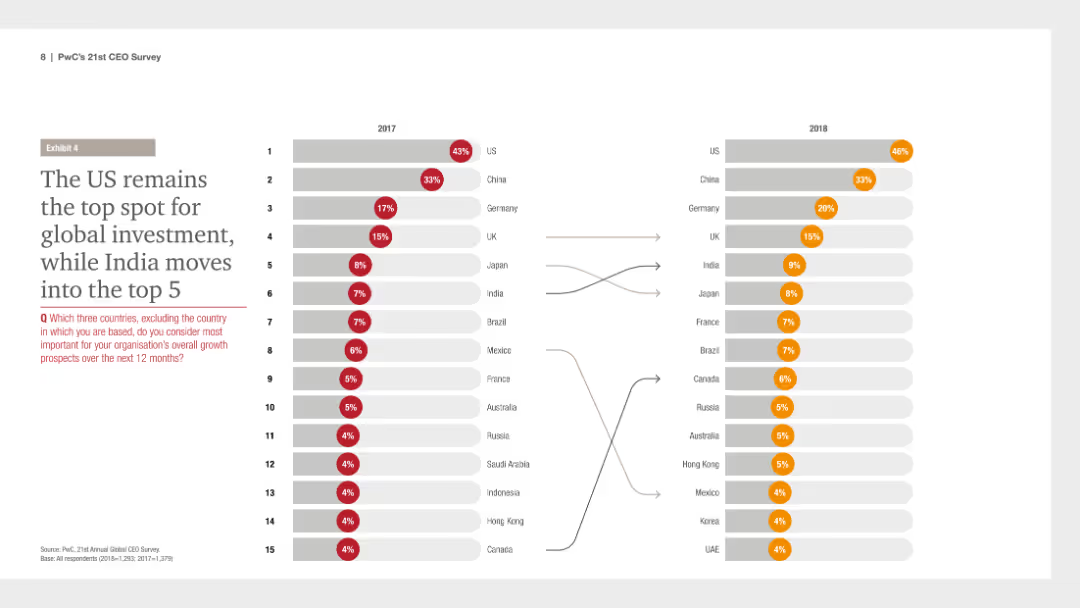
The slide features a column chart comparing the top countries for global investment in 2017 and 2018, with countries listed and color-coded to show changes in ranking.
Investment Analysis
Financial Services
It presents data showing that the US remains the top destination for global investment in 2018, with India entering the top 5, indicating shifts in global investment preferences.
global investment, US, India, top destinations, 2017 vs 2018, financial survey, PwC, CEO Survey, column chart
false
Investment Analysis
Financial Services
Multiple Chart
PwC/Strategy&
Add to my slides
Remove from favorites
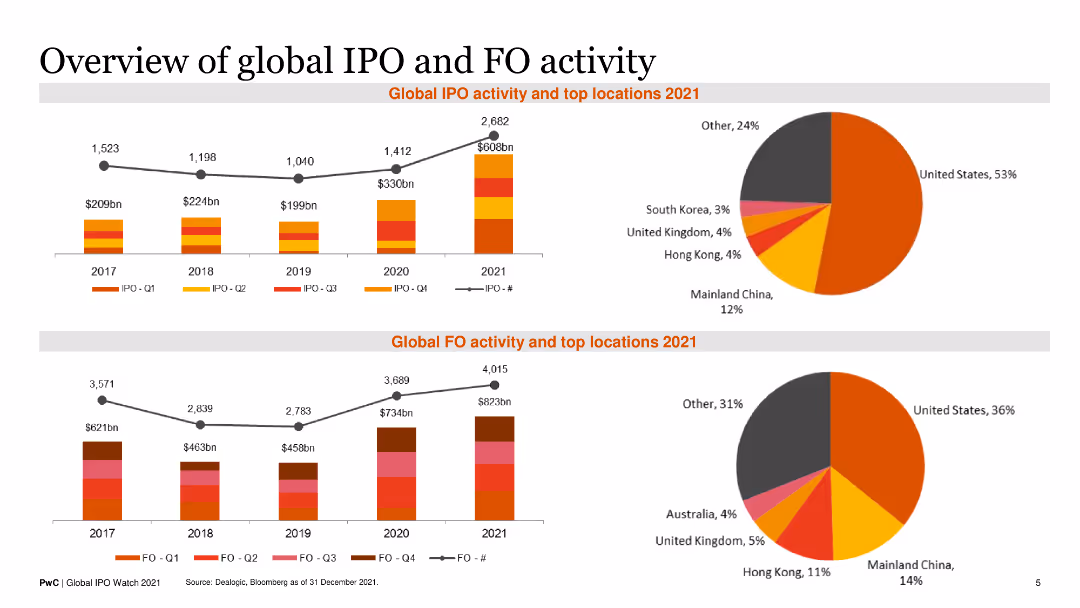
Contains two line charts showing historical IPO and FO activity with accompanying pie charts for top locations in 2021. Text blocks provide summary insights.
Financial Performance
Financial Services
It provides an overview of global IPO and FO activities over recent years, highlighting top regions and growth trends for 2021.
Global IPO, FO Activity, Historical Trends, Top Locations, 2021 Overview
false
Financial Performance
Financial Services
Multiple Chart
PwC/Strategy&
Add to my slides
Remove from favorites
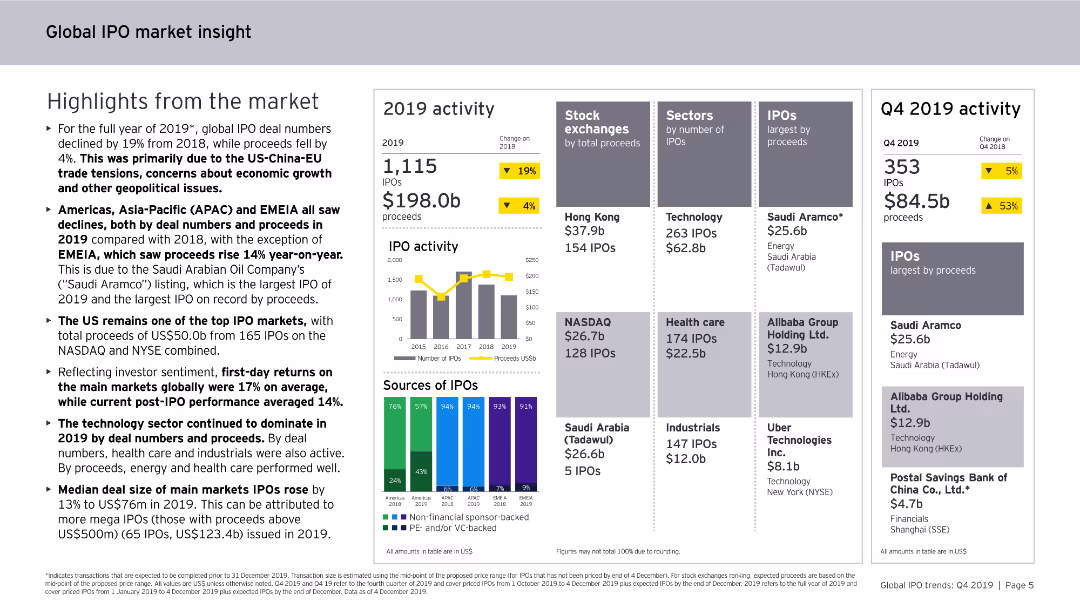
Includes column charts, bar charts, and data tables. The slide is information-rich with visual elements presenting global IPO market activities and trends.
Market Analysis and Trends
Financial Services
Provides insights into the global IPO market for 2019, covering regional performances, sector-specific trends, and the overall impact of geopolitical events on IPO activities.
global, IPO, market insight, 2019, trends
false
Market Analysis and Trends
Financial Services
Multiple Chart
EY
Add to my slides
Remove from favorites
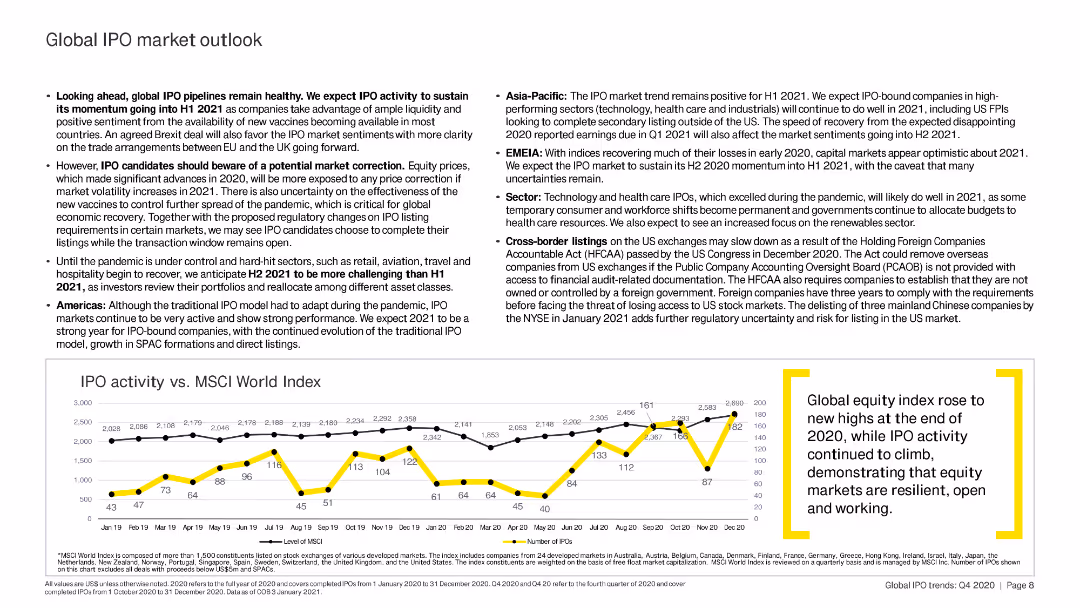
The slide features a line chart comparing IPO activity to the MSCI World Index, and several bullet points summarizing global IPO market outlook and potential risks.
Market Analysis and Trends
Financial Services
The slide offers a comprehensive outlook on the global IPO market, discussing expected trends and potential risks for the first half of 2021. Key points include market momentum, sector performance, and regional highlights.
global IPO, MSCI, market outlook, 2021, risks
false
Market Analysis and Trends
Financial Services
Mixed Chart
EY
Add to my slides
Remove from favorites
This slide presents tables ranking global stock exchanges by number of IPOs and proceeds, highlighting the performance of Asian and US exchanges.
Market Analysis and Trends
Financial Services
The slide analyzes the global IPO market, emphasizing the strong performance of Asian exchanges and the recovery of the US in terms of global share. Detailed rankings by number of IPOs and proceeds are included.
global IPOs, Asian exchanges, US market recovery, stock exchange rankings, financial trends
false
Market Analysis and Trends
Financial Services
Multiple Chart
EY
Add to my slides
Remove from favorites
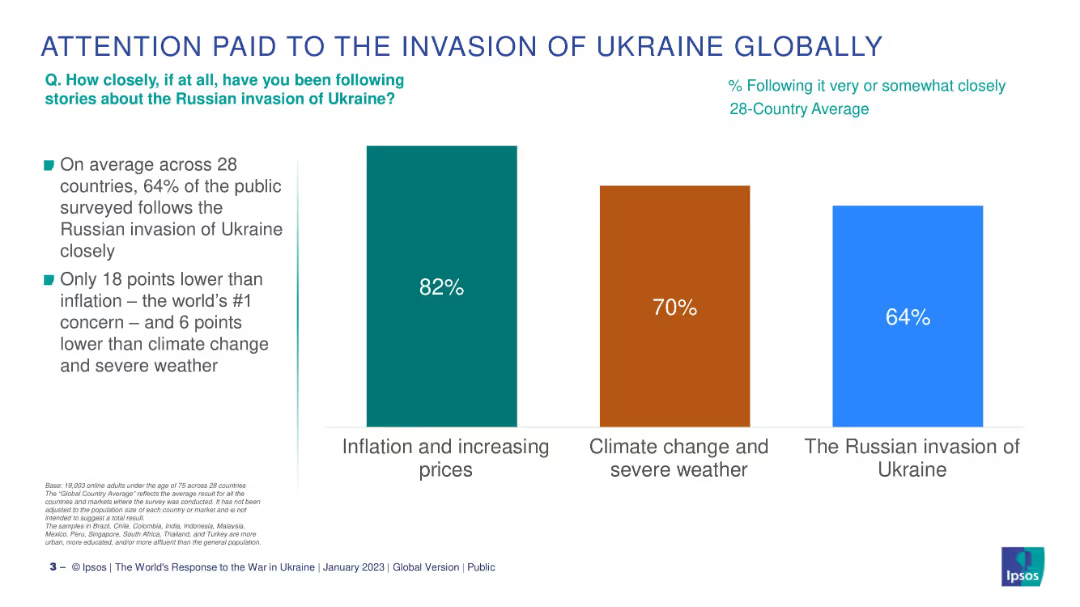
Bar chart comparing attention to inflation, climate change, and Ukraine war; 28-country avg data used.
Market Analysis and Trends
Government & Public Sector
This slide compares how closely people across 28 countries follow major global issues. Inflation (82%) is the top concern, followed by climate change (70%) and the Russian invasion of Ukraine (64%).
global issues, public attention, inflation, Ukraine invasion, climate change, Ipsos, international survey, top concerns
false
Market Analysis and Trends
Government & Public Sector
Mixed Chart
IPSOS
Add to my slides
Remove from favorites
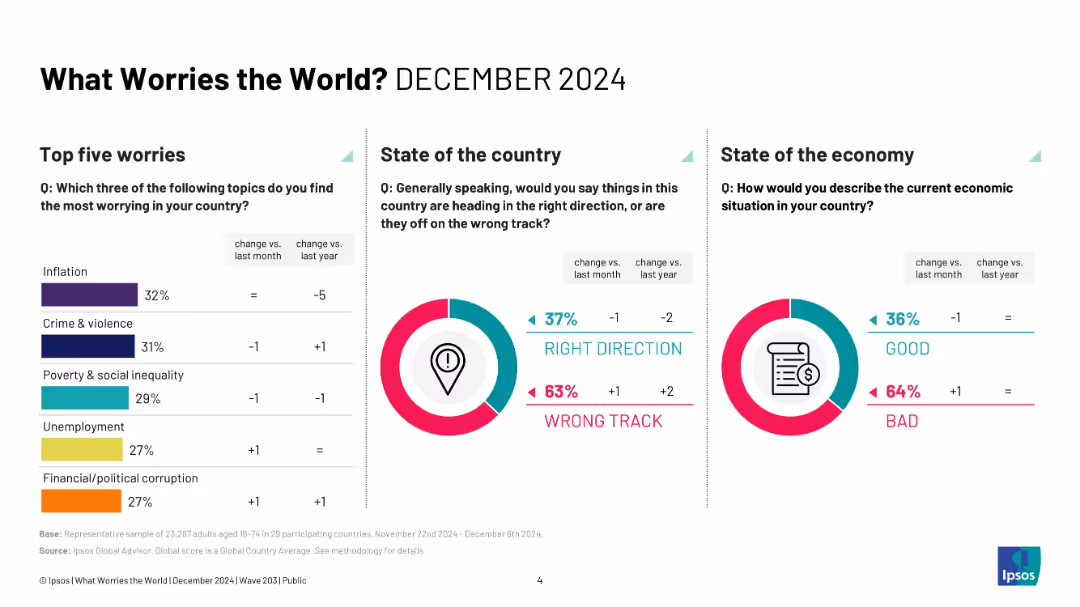
Dashboard layout with three sections: bar chart (left), two pie charts (middle and right); clear icons used.
Strategic Planning
Government & Public Sector
This slide presents the top five global concerns, and public sentiment about national direction and economic conditions. Inflation, crime, and inequality are key worries, while most respondents feel their country is off track.
global issues, public opinion, economy, inflation, Ipsos, concerns, trends, pie chart, strategic insights, December 2024
false
Strategic Planning
Government & Public Sector
Multiple Chart
IPSOS
Add to my slides
Remove from favorites
Text-heavy layout discussing opposing viewpoints on globalization, with lists of proponents and opponents along with their positions.
Strategic Planning
Professional Services
Explores various global and political perspectives on globalization, detailing arguments from both advocates and critics of global economic policies.
globalization, advocacy, opposition, economic policy, political perspectives
false
Strategic Planning
Professional Services
Table
Roland Berger
Add to my slides
Remove from favorites
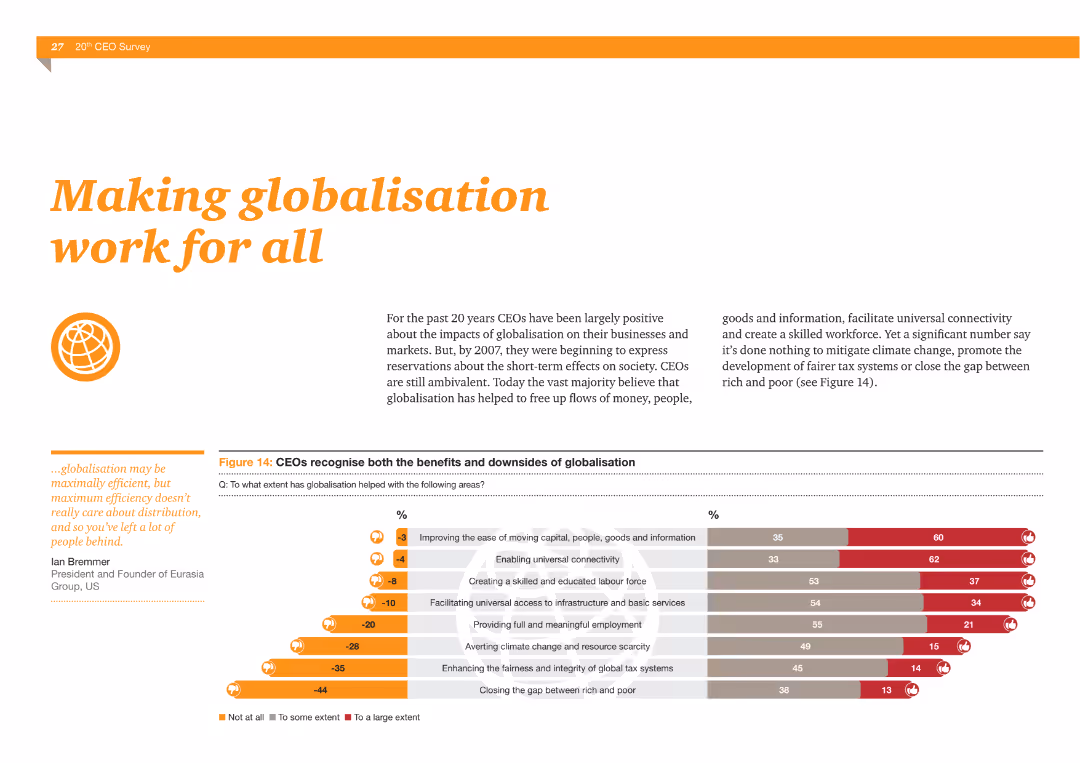
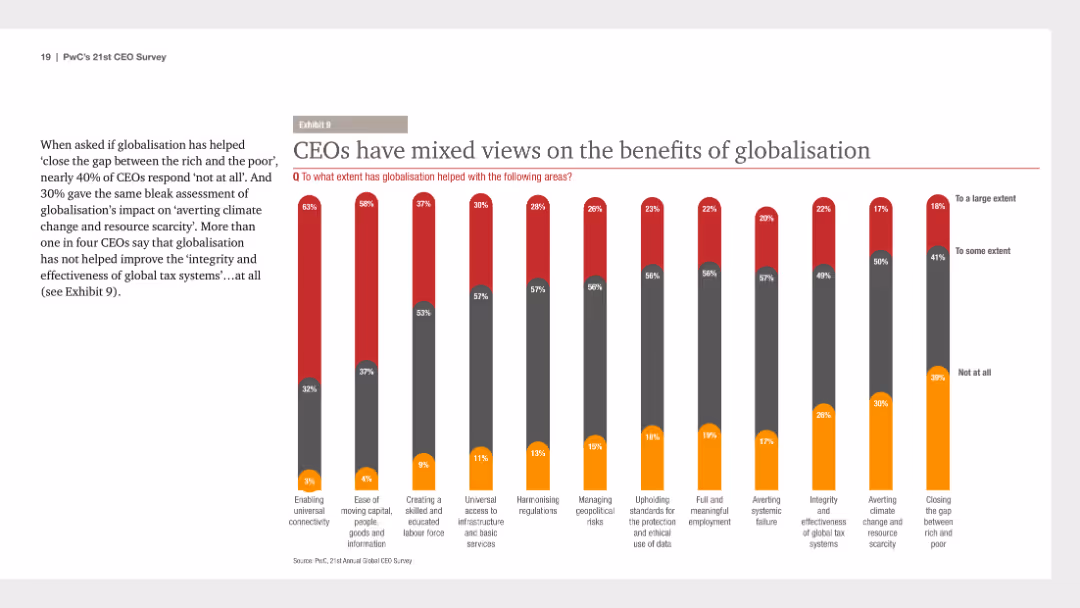
The slide features a column chart showing CEOs' views on the benefits and downsides of globalization, such as improving connectivity and creating a skilled workforce versus failing to address climate change and tax fairness.
Market Analysis and Trends
Financial Services
This slide illustrates CEOs' perspectives on globalization, highlighting both positive impacts like improved connectivity and negative aspects such as failing to address climate change and creating fair tax systems.
Globalization, benefits, downsides, connectivity, skilled workforce, climate change, tax fairness
false
Market Analysis and Trends
Financial Services
Multiple Chart
PwC/Strategy&
Add to my slides
Remove from favorites
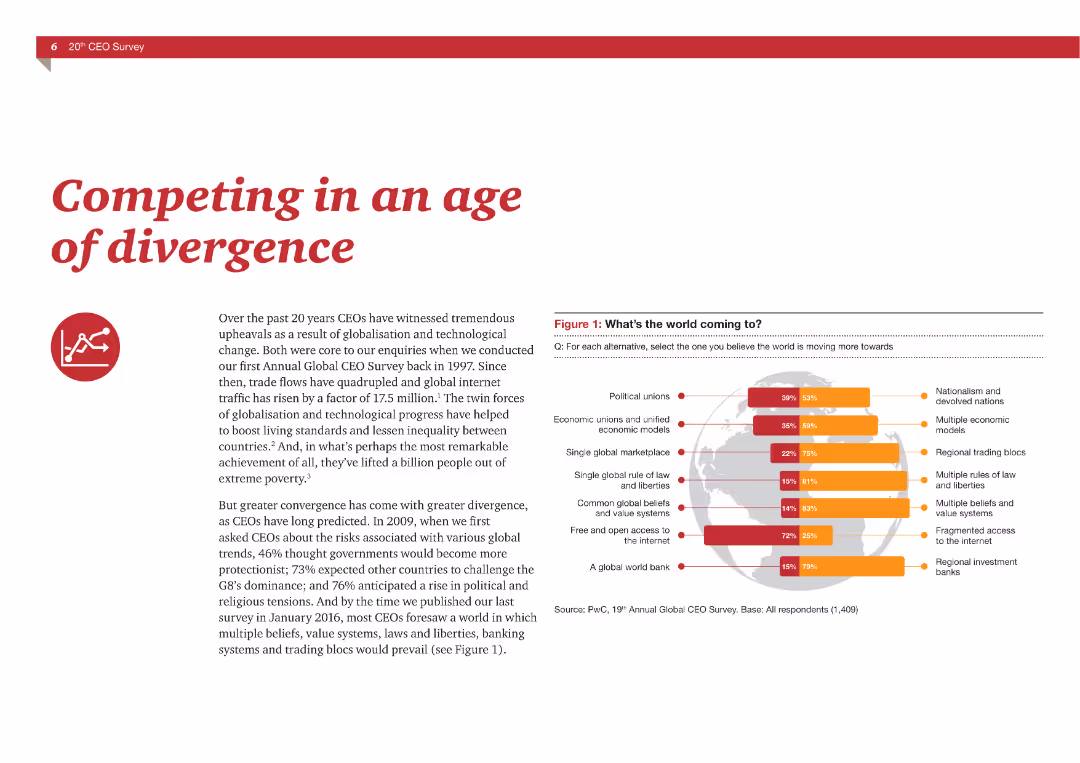
A mix of text and a chart, the chart shows CEOs' predictions about the future global scenario, with a world map highlighting different outcomes.
Strategic Planning
Professional Services
The slide discusses the impact of globalization and technological changes on business strategies, presenting survey data from CEOs.
globalization, CEO survey, future trends, business strategy, divergence
false
Strategic Planning
Professional Services
Mixed Chart
PwC/Strategy&
Add to my slides
Remove from favorites
The slide features a series of column charts displaying CEOs' views on the benefits of globalization in various areas, with columns color-coded to show different extents of agreement.
Market Analysis and Trends
Financial Services
It presents mixed CEO opinions on globalization's benefits, such as enabling connectivity and managing geopolitical risks, useful for understanding diverse viewpoints on globalization impacts.
globalization, CEO views, benefits, market analysis, 2018, column charts, financial survey, PwC, CEO Survey, mixed opinions
false
Market Analysis and Trends
Financial Services
Mixed Chart
PwC/Strategy&
Add to my slides
Remove from favorites
Similar to slide 1844, it presents a central, bold statement with a list of key opportunities and challenges against a monochromatic background, with the second point highlighted.
Strategic Planning
Professional Services
Focuses on the digitization of globalization as a key strategic point. The slide aims to discuss the specific implications and strategic considerations of digitizing global operations.
globalization, digitization, strategy, opportunities
false
Strategic Planning
Professional Services
Agenda
McKinsey
Add to my slides
Remove from favorites
Features three large numbered circles aligned horizontally, each describing a sub-trend of globalization including economic integration, and BRICS markets.
Market Analysis and Trends
Professional Services
Discusses three key aspects of globalization impacting new markets and economies, highlighting economic integration and the diversification of global markets.
globalization, economic integration, BRICS, new markets, sub-trends
false
Market Analysis and Trends
Professional Services
Pillar
Roland Berger
Add to my slides
Remove from favorites
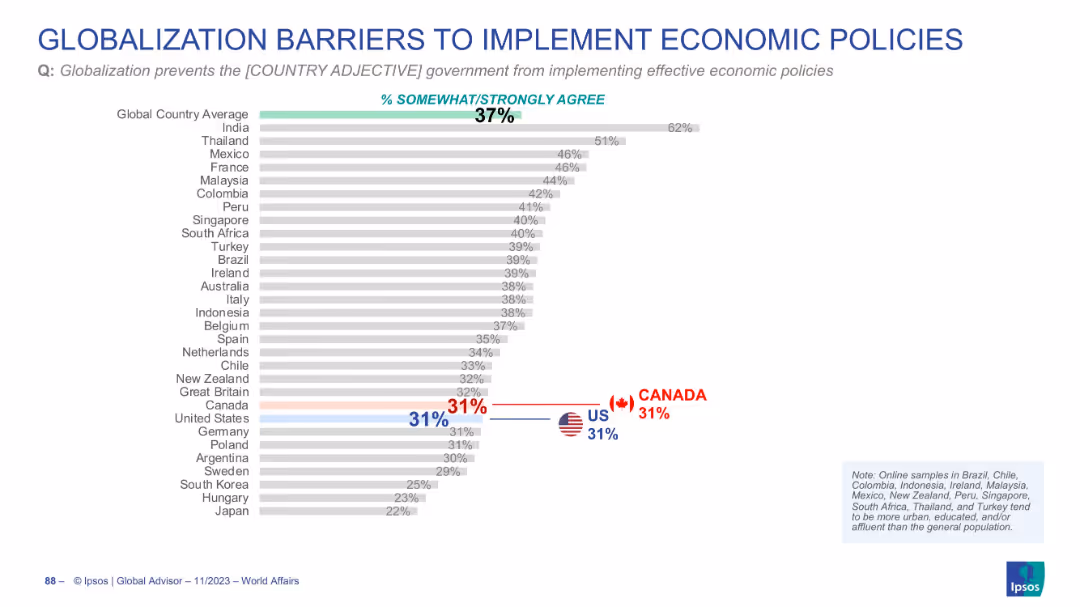
Horizontal bar chart showing agreement with globalization limiting policy implementation
Regulatory and Compliance
Government & Public Sector
The slide reveals that 37% globally believe globalization limits effective economic policy. Canada and the US are both at 31%, below the global average.
globalization, economic policy, governance, international influence, regulation
false
Regulatory and Compliance
Government & Public Sector
Single Chart
IPSOS
Add to my slides
Remove from favorites
Contains bullet points grouped under three headers: Economy, Politics, and Society, explaining the multi-faceted impacts of globalization.
Market Analysis and Trends
Professional Services
Explains how globalization influences various sectors including economy, politics, and societal structures, emphasizing the interconnected nature of global impacts.
globalization, economy, politics, society, trade
false
Market Analysis and Trends
Professional Services
Mixed Chart
Roland Berger
Add to my slides
Remove from favorites
The slide features bullet points with brief explanations aligned left, and key economic components of globalization like imports and exports, trade agreements, and cross-border investments.
Market Analysis and Trends
Financial Services
This slide provides a summary of the economic components critical to globalization trends, focusing on aspects like trade and investments, suitable for discussing global market trends and economic integration strategies.
globalization, economy, trade, investments, FDI
false
Market Analysis and Trends
Financial Services
Mixed Chart
Roland Berger
Add to my slides
Remove from favorites
The slide shows a horizontal bar chart with survey results on globalization and global citizenship feelings across different countries.
Market Analysis and Trends
Technology & Software
The slide highlights global survey results indicating people's positive attitudes towards globalization and global citizenship.
Globalization, global citizenship, survey, public opinion, international trends
false
Market Analysis and Trends
Technology & Software
Mixed Chart
IPSOS
Add to my slides
Remove from favorites
The slide presents a vertical bar chart showing the percentage of people who agree that globalization is good for their country across various markets.
Market Analysis and Trends
Technology & Software
The slide displays survey data reflecting global opinions on the benefits of globalization in most markets.
Globalization, global opinion, survey, public opinion, market analysis
false
Market Analysis and Trends
Technology & Software
Multiple Chart
IPSOS
Add to my slides
Remove from favorites
The slide has two sections: the left side contains a detailed text block about the global consumer goods industry with a circular infographic. The right side discusses emerging consumer markets with an image of people working on a project. Trend assessment and impact on industry bars are included.
Industry Overview
Consumer Goods
Provides an overview of the global consumer goods industry, discussing the impact of globalization, supply chains, and economic factors. Highlights emerging consumer markets and the opportunities and challenges they present for businesses.
Globalization, Markets, Consumer Goods, Trends, Industry
false
Industry Overview
Consumer Goods
Mixed Chart
Deloitte
Add to my slides
Remove from favorites
Displays a bar chart showing the percentage of international migrants in different regions over time.
Strategic Planning
Professional Services
Discusses the impact of globalization on international migration, emphasizing its significance in socio-political debates and policies.
globalization, migration, international, socio-political impact, migration trends
false
Strategic Planning
Professional Services
Mixed Chart
Roland Berger
Add to my slides
Remove from favorites
Two scatter plots: one comparing Trade Openness Index to years until 25% adoption in the US, and the other relating GII to internet adoption rates. Text discusses the influence of globalization on adoption rates.
Technology and Digital Transformation
Technology & Software
The slide examines the relationship between globalization, network effects, and technology adoption. It highlights how higher trade openness and innovation indices correlate with faster technology adoption, emphasizing the role of global interactions and network effects in accelerating the diffusion of innovations.
Globalization, Network Effects, Adoption, Trade Openness Index
false
Technology and Digital Transformation
Technology & Software
Multiple Chart
Roland Berger
Add to my slides
Remove from favorites
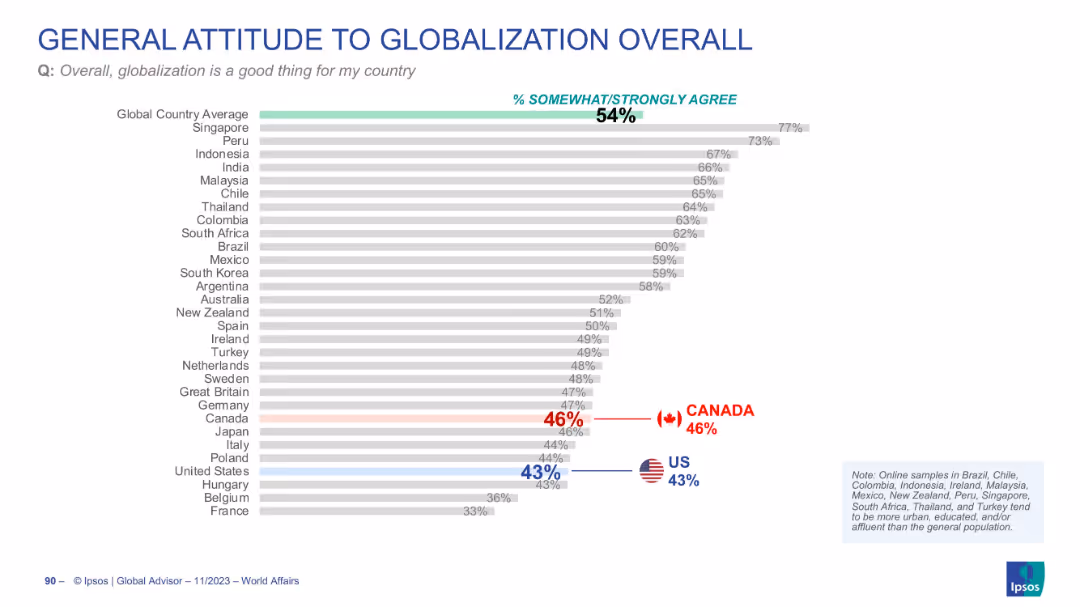
Horizontal bar chart comparing overall sentiment toward globalization by country
Market Analysis and Trends
Government & Public Sector
This slide displays general favorability toward globalization. The global average is 54%, while the US (43%) and Canada (46%) are notably below it.
globalization, public sentiment, economic integration, national outlook, global trade
false
Market Analysis and Trends
Government & Public Sector
Single Chart
IPSOS
Add to my slides
Remove from favorites
Includes a world map with trade corridors and a list of cross-border needs with accompanying icons. Blue and grey color scheme.
Financial Performance
Financial Services
Analyzes the globalization of financial services, showing trade corridors and cross-border market opportunities along with services like payments and foreign exchange.
Globalization, Trade, Financial Services, Market Opportunities, Cross-Border
false
Financial Performance
Financial Services
Diagram
JP Morgan
Add to my slides
Remove from favorites
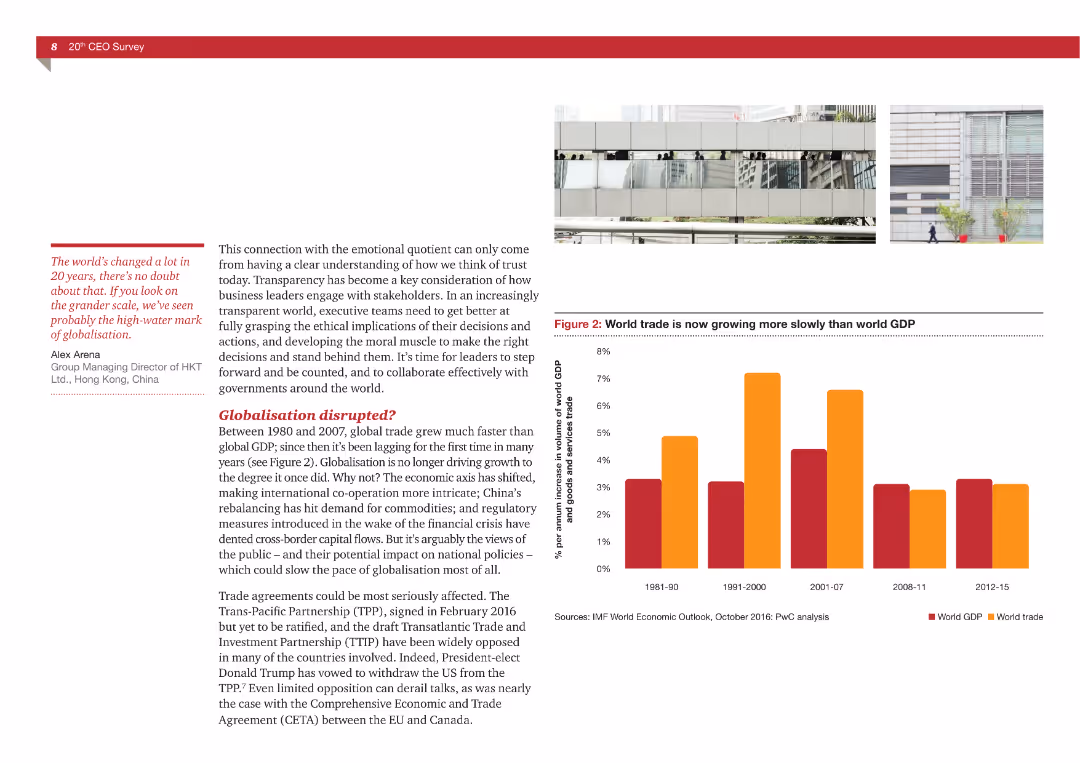
A mix of text and a bar chart comparing world trade growth to global GDP growth over different periods.
Market Analysis and Trends
Professional Services
The slide explores changes in global trade patterns and their implications for globalization, using data from IMF and PwC analysis.
globalization, trade, GDP, economic trends, disruption
false
Market Analysis and Trends
Professional Services
Mixed Chart
PwC/Strategy&
Add to my slides
Remove from favorites
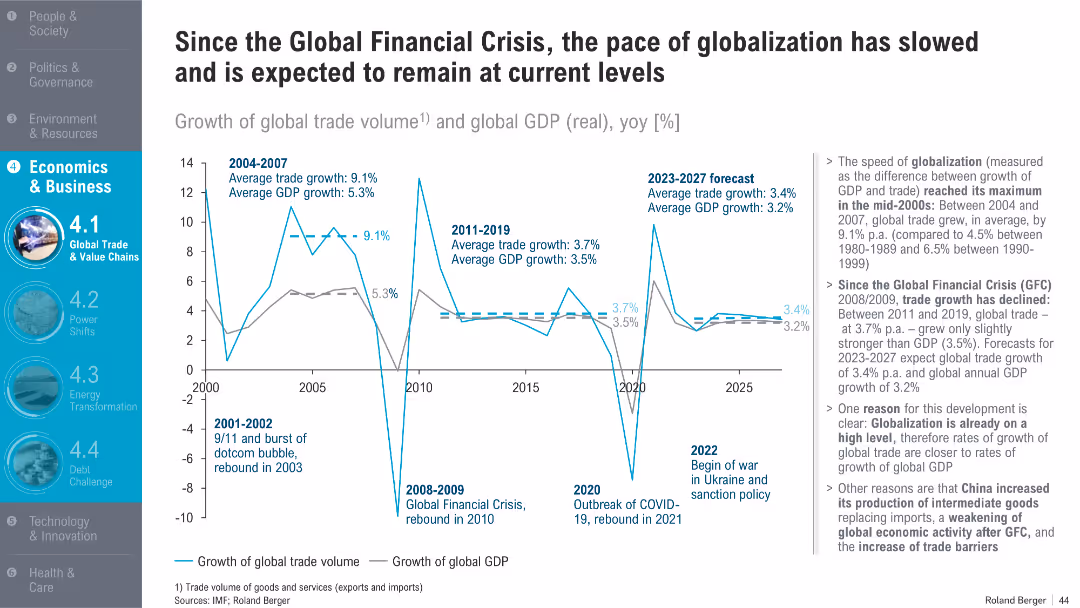
Dual-line graph of trade volume and GDP growth from 2000–2025 with annotated events; textual summary on the right
Market Analysis and Trends
Financial Services
This slide shows a decline in the pace of globalization since the 2008 financial crisis, with global trade growing at a slower rate than before. It attributes the trend to factors like economic maturity, trade barriers, and geopolitical tensions.
globalization, trade volume, GDP growth, financial crisis, economic trends, 2023 forecast
false
Market Analysis and Trends
Financial Services
Mixed Chart
Roland Berger
Add to my slides
Remove from favorites
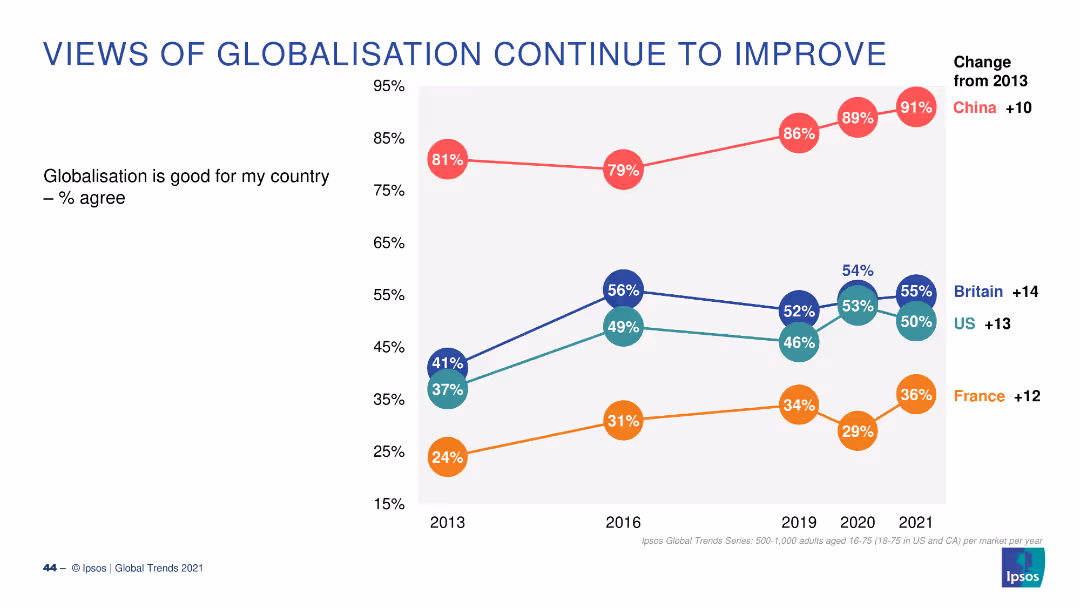
A line chart showing the percentage of people who think globalization is good for their country, with trends from 2013 to 2021 for China, Britain, the US, and France.
Market Analysis and Trends
Technology & Software
The slide tracks the positive trend in views on globalization from 2013 to 2021, highlighting increasing support in China, Britain, the US, and France.
globalization, trends, positive views, countries, survey
false
Market Analysis and Trends
Technology & Software
Single Chart
IPSOS
Add to my slides
Remove from favorites
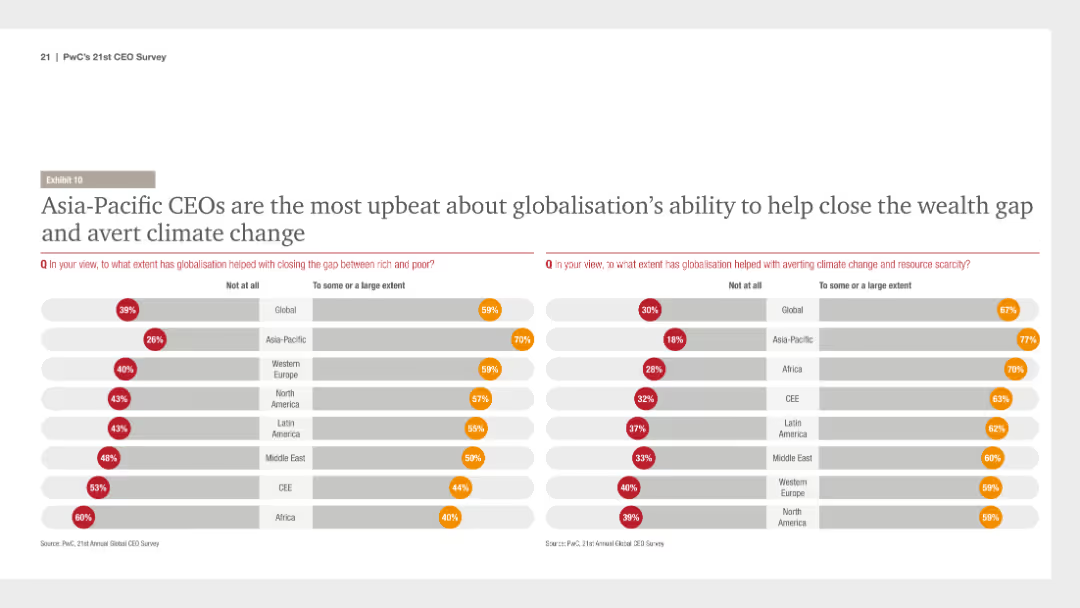
This slide includes comparative charts showing regional differences in CEO optimism about globalization's impact on wealth gap reduction and climate change aversion, with regions listed in bar charts.
Market Analysis and Trends
Financial Services
It emphasizes that Asia-Pacific CEOs are particularly positive about globalization's role in closing the wealth gap and addressing climate change, compared to other regions.
globalization, wealth gap, climate change, regional comparison, CEO optimism, PwC, CEO Survey, 2018, Asia-Pacific, comparative slide
false
Market Analysis and Trends
Financial Services
Multiple Chart
PwC/Strategy&
Add to my slides
Remove from favorites
Showcases quotes from global leaders on globalization, arranged in two columns for proponents and opponents.
Organizational Structure and Change
Professional Services
Presents contrasting viewpoints on globalization from world leaders, highlighting their perspectives on economic and social impacts.
globalization, world leaders, economic impact, social impact, global policy
false
Organizational Structure and Change
Professional Services
Mixed Chart
Roland Berger
Add to my slides
Remove from favorites
Contains pie charts and a sector diagram to showcase sales distribution and operating margins by business group. Rich in visual data and structured layout.
Competitive Landscape
Transportation & Logistics
Highlights Faurecia's global leadership and sales figures across different business groups, demonstrating its strong market position and development potential within the automotive sector.
global leadership, sales, market position, automotive, development
false
Competitive Landscape
Transportation & Logistics
Multiple Chart
Deutsche Bank
Add to my slides
Remove from favorites
Features a column chart displaying various segments of the global luxury market in 2017, with clear labeling of market sizes and growth percentages. The design is minimalistic with a focus on the data presentation, offering a quick overview of the luxury market landscape. The layout is organized to facilitate easy comparison between segments, including luxury cars, hospitality, and fine art.
Market Analysis and Trends
Consumer Goods
Provides an overview of the global luxury market’s performance in 2017, breaking down revenue by segments such as personal luxury goods and luxury experiences. Useful for market analysis in luxury retail and strategic planning.
global luxury market, 2017 performance, market segments, growth analysis, retail strategy
false
Market Analysis and Trends
Consumer Goods
Single Chart
Bain
Add to my slides
Remove from favorites
The slide presents a world map background with icons and text boxes displaying key company facts, such as founding year, manufacturing locations, and financial figures. It uses a clean layout with a gray and white color scheme.
Industry Overview
Industrial & Manufacturing
The slide provides an overview of Stoneridge's global presence and key financial metrics, aiming to establish the company's market position and growth potential. It’s suitable for presenting to stakeholders interested in company growth and strategic directions.
global, manufacturing, financial, growth, Stoneridge
false
Industry Overview
Industrial & Manufacturing
Graphic
Deutsche Bank
Add to my slides
Remove from favorites
A text section on the left and two pie charts on the right represent the global market size and IBKR's international customer distribution.
Market Analysis and Trends
Financial Services
The slide communicates Interactive Brokers' global reach in terms of customer distribution and market potential, using pie charts to showcase demographic and financial data.
Global Market, Interactive Brokers, Customer Distribution, Pie Charts, Addressable Market, Demographics, Financial Assets, International
false
Market Analysis and Trends
Financial Services
Multiple Chart
Goldman Sachs
Add to my slides
Remove from favorites
Slide includes multiple column charts displaying sector-specific data.
Market Analysis and Trends
Consumer Goods
Provides a comprehensive overview of the global luxury market in 2019, highlighting growth across various sectors like personal luxury goods and fine dining.
global market, luxury sectors, 2019, growth
false
Market Analysis and Trends
Consumer Goods
Single Chart
Bain
Add to my slides
Remove from favorites
Slide contains column charts and text boxes, using a consistent blue and teal color scheme. There's an emphasis on financial data presentation with clear labels and defined sections.
Market Analysis and Trends
Financial Services
The slide analyzes Goldman Sachs’ performance in global markets, showing a consistent track record and highlighting strategic growth directions. It is suitable for presentations aiming to discuss past performance and future strategic initiatives.
global markets, CAGR, Goldman Sachs, strategic growth, financial performance, revenues
false
Market Analysis and Trends
Financial Services
Mixed Chart
Goldman Sachs
Add to my slides
Remove from favorites
The slide includes a left text block and two column charts on the right, contrasting CEO priorities between different countries.
Strategic Planning
Professional Services
Discusses the nuanced global views of CEOs regarding trade conflicts and their impact on market growth, highlighting shifting priorities towards various economies using column charts.
global markets, CEO survey, trade conflict, economy, growth
false
Strategic Planning
Professional Services
Multiple Chart
PwC/Strategy&
Add to my slides
Remove from favorites
The slide shows a left section with key strategic priorities and a right section with column chart depicting market share distribution. The design includes blue headers and footers, with the page number at the bottom right.
Competitive Landscape
Financial Services
This slide focuses on the presenter's client-centric approach in global markets, emphasizing strategic priorities and share gains. It includes bar graphs comparing market share over time, useful for presentations on competitive strategy, market analysis, and investment insights in the financial services sector, illustrating how the presenter has strengthened its position in global markets through client-focused strategies and share gains.
Global Markets, Client Focus, Share Gains, Strategy, Competition, Market Analysis
false
Competitive Landscape
Financial Services
Mixed Chart
Goldman Sachs
Add to my slides
Remove from favorites
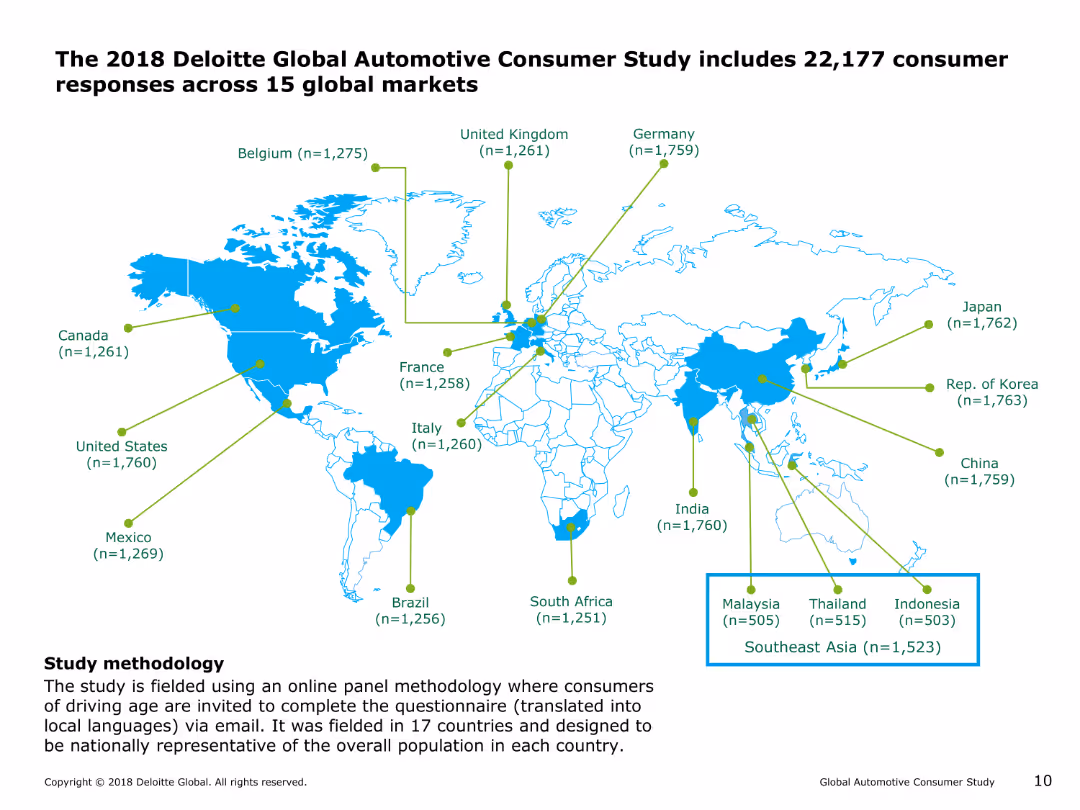
The slide features a world map highlighting the sample sizes of respondents from various countries participating in the 2018 Deloitte Global Automotive Consumer Study.
Market Analysis and Trends
Professional Services
This slide provides an overview of the 2018 Deloitte Global Automotive Consumer Study, including the number of respondents from each of the 15 global markets covered in the study. The study methodology is also briefly described.
global markets, consumer study, world map, market analysis, Deloitte, sample size, professional services, automotive industry
false
Market Analysis and Trends
Professional Services
Graphic
Deloitte
Add to my slides
Remove from favorites
Comprises column chart and textual content for financial data presentation.
Financial Performance
Financial Services
Detailed financial results of FICC and equities, along with net revenues, expenses, and earnings.
Global, Markets, FICC, Equities, Financial, Revenue, Bar Charts, Operating, Earnings, Equity, Analysis
false
Financial Performance
Financial Services
Mixed Chart
Goldman Sachs
Add to my slides
Remove from favorites
Slide includes financial results tables and a column chart showing net revenues from FICC and equities. The layout is data-heavy with a clear distinction between the segments. Blue and grey bars represent the different revenue streams.
Market Analysis and Trends
Financial Services
Analyzes the financial results in global markets, presenting year-over-year and year-to-date comparisons. Useful for evaluating market trends, and understanding performance in FICC and equities for strategic decision-making.
Global Markets, FICC, Equities, Net Revenue
false
Market Analysis and Trends
Financial Services
Mixed Chart
Goldman Sachs
Add to my slides
Remove from favorites
Features dual columns with headers, column charts displaying quarterly revenues, and bullet points summarizing highlights. Design is clean with a blue and grey color scheme, promoting readability of complex data.
Risk Assessment and Management
Financial Services
This slide emphasizes stable earnings through client focus in global markets, presented with FICC and equities quarterly revenues. It's likely used for illustrating risk management effectiveness and market positioning.
global markets, FICC, equities, quarterly revenues, market share, risk management, earnings stability, revenue volatility, financial presentation, investment strategy
false
Risk Assessment and Management
Financial Services
Multiple Chart
Goldman Sachs
Add to my slides
Remove from favorites
The slide is packed with horizontal column chart and textual analysis focusing on FICC net revenues, using a consistent color coding for easy comparison and comprehension. The color scheme involves shades of blue and gray.
Financial Performance
Financial Services
Reviews the financial performance within the FICC segment of global markets, comparing revenue changes over quarters and highlighting key factors influencing those changes.
global markets, FICC, revenue analysis, financial intermediation, financing
false
Financial Performance
Financial Services
Mixed Chart
Goldman Sachs
Add to my slides
Remove from favorites
Multiple pie charts, column charts showing financial data.
Strategic Planning
Financial Services
Reviews global market performance and strategies with financial targets and distribution by geography.
Global Markets, Financial Data, Performance, Strategy, Distribution, Growth
false
Strategic Planning
Financial Services
Multiple Chart
Barclays
Add to my slides
Remove from favorites
Contains multiple column charts, a dense table, and textual analysis. The design is consistent with corporate branding, using shades of blue and gray.
Financial Performance
Financial Services
Shows the financial results and market performance for global markets, with a focus on FICC and equities, suitable for financial analysis and market review.
Global, Markets, Financial, Performance, FICC, Equities, Analysis, Review, Results, Market
false
Financial Performance
Financial Services
Mixed Chart
Goldman Sachs
Add to my slides
Remove from favorites
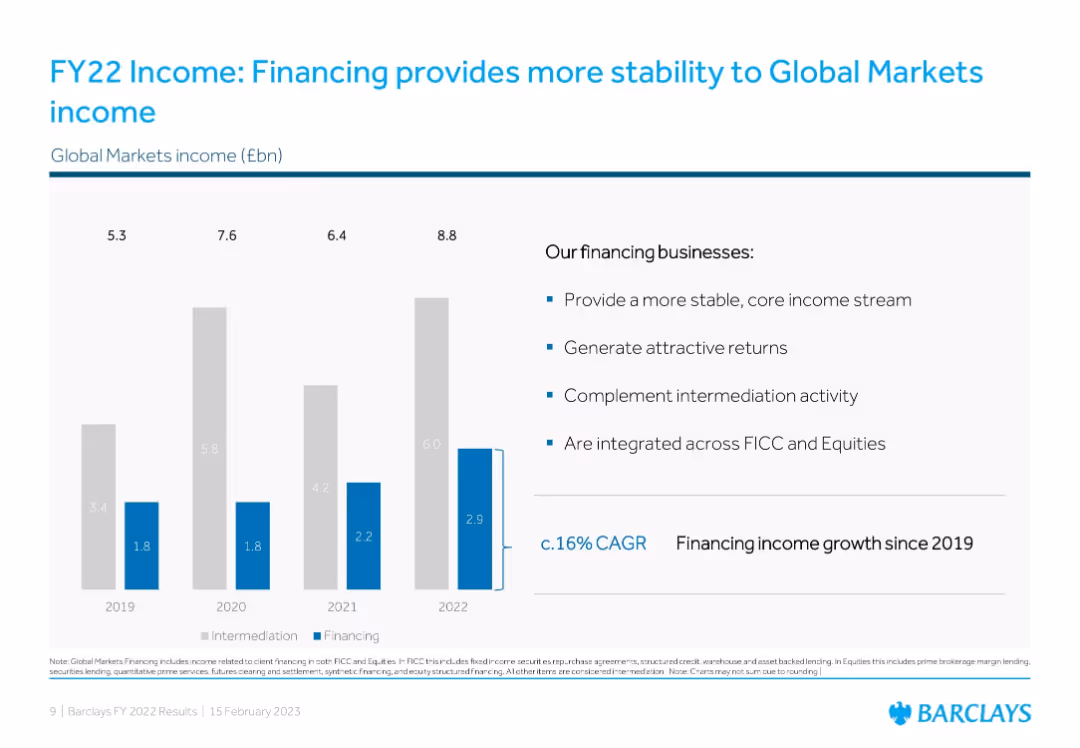
Stacked bar chart (2019–2022) with bullet insights on financing benefits
Market Analysis and Trends
Financial Services
Analyzes growth in Global Markets income from 2019 to 2022, with a focus on stable income streams from financing activities. The slide emphasizes consistent income and strategic integration of financing with intermediation functions.
Global Markets, Financing, Intermediation, Barclays, Income Stability, CAGR, Trends
false
Market Analysis and Trends
Financial Services
Mixed Chart
Barclays
Add to my slides
Remove from favorites
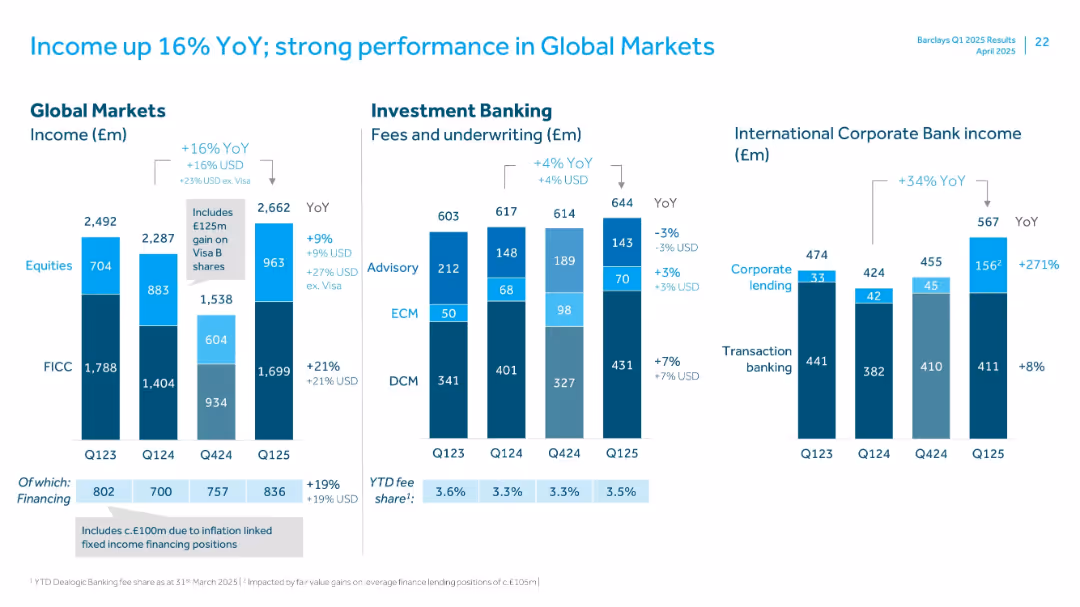
Detailed bar charts with segmented income by business lines including Global Markets and Investment Banking
Financial Performance
Financial Services
Illustrates strong income growth in Global Markets and Investment Banking with a 16% YoY rise. Highlights income sources (equities, FICC, advisory, ECM, DCM) and strong gains in International Corporate Bank.
Global Markets, YoY Income, Investment Banking, FICC, ECM, ICB, Equities, Q125
false
Financial Performance
Financial Services
Multiple Chart
Barclays
Add to my slides
Remove from favorites
The slide includes a world map highlighting key locations, regional split percentages, and a summary table with the number of partners, consultants, experts, and hubs.
Human Resources and Talent Management
Industrial & Manufacturing
This slide outlines the global presence of a community of metals experts, detailing the regional distribution of expertise and key core locations.
Global, metals experts, regional, distribution, organizational, community, presence, expertise, locations
false
Human Resources and Talent Management
Industrial & Manufacturing
Multiple Chart
BCG
Add to my slides
Remove from favorites
This slide features a world map indicating the company's global presence with specific locations marked. There's a notable emphasis on the company's international reach, complemented by minimal text.
Market Analysis and Trends
Financial Services
The slide visually represents the company's extensive global network, indicating sales within 100 countries and the locations of various facilities. It is used to demonstrate the company's market reach and international operations.
global, mining, business network, market presence, international sales
false
Market Analysis and Trends
Financial Services
Graphic
Morgan Stanley
Add to my slides
Remove from favorites
Contains a global map pinpointing currently operating mines with an overlay of exploration budgets by country, presented as a pie chart.
Investment Analysis
Industrial & Manufacturing
Highlights global mining operations and investment focus, indicating areas with potential for exploration and investment. Useful for discussions on market expansion and resource management.
global mining, exploration budgets, investment analysis, pie chart, map, resource management, market expansion
false
Investment Analysis
Industrial & Manufacturing
Mixed Chart
McKinsey
Add to my slides
Remove from favorites
A bar chart comparing global customers and a line chart detailing mobile app downloads by quarter, showcasing growth trends.
Market Analysis and Trends
Financial Services
The slide provides a comparative analysis of global customer base and app download metrics, emphasizing the company's competitive position and market share growth within the mobile app space.
global, mobile apps, growth, market share, financial platforms
false
Market Analysis and Trends
Financial Services
Multiple Chart
Barclays
Add to my slides
Remove from favorites
Text-heavy layout with statistical callouts and minimal icons, focusing on the global mobility of women.
Technology and Digital Transformation
Professional Services
Explains the unmet demand for female international mobility, challenges in developing inclusive global mobility programs, and the representation of women in leadership.
Global Mobility, Female Demand, Leadership, Inclusivity
false
Technology and Digital Transformation
Professional Services
Boxed
PwC/Strategy&
Add to my slides
Remove from favorites
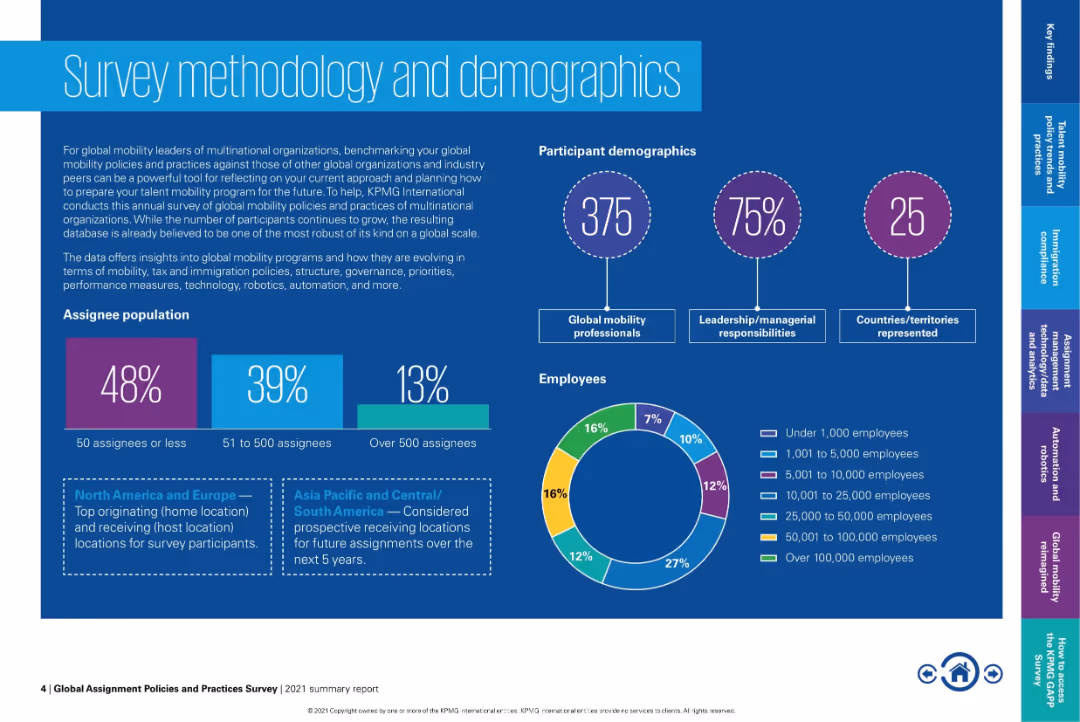
Highly visual layout with pie and bar charts displaying participant demographics, assignee populations, and employee distribution. Dark background with vibrant accents.
Human Resources and Talent Management
Professional Services
This slide presents demographic and methodology details of a global mobility survey. It covers participant roles, regional assignments, company size, and global coverage. Visuals include charts for employee size distribution and assignee population segmentation.
global mobility, HR survey, demographics, assignment trends, international assignees, workforce, survey participants, employee size
false
Human Resources and Talent Management
Professional Services
Multiple Chart
KPMG
Add to my slides
Remove from favorites
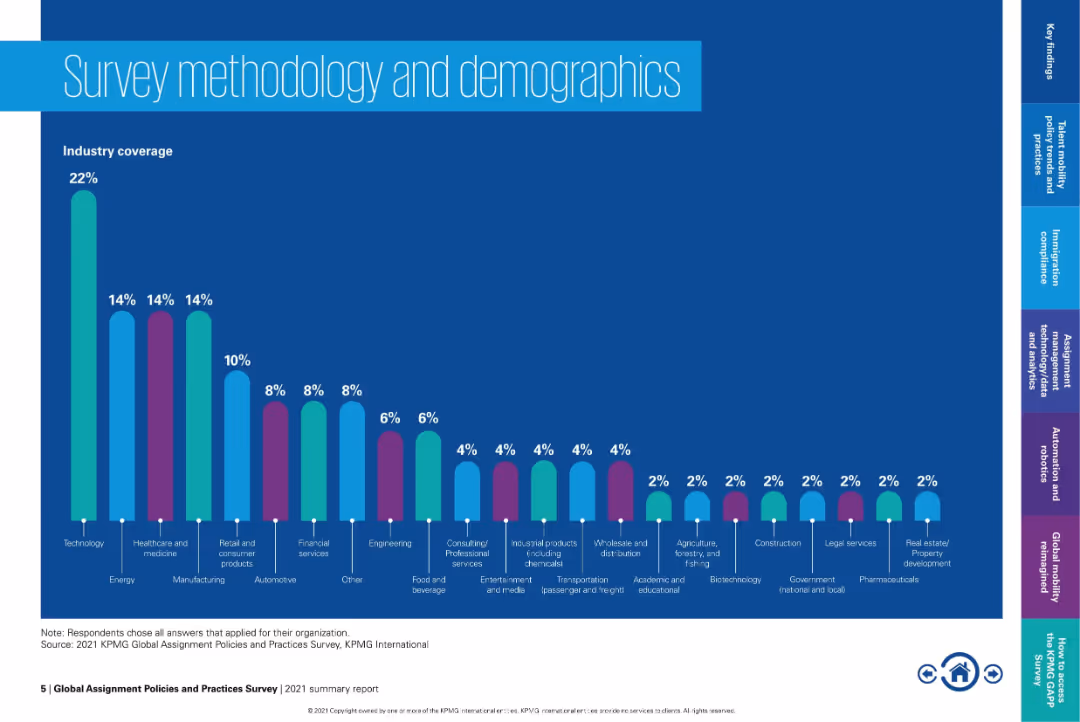
Full-width bar chart showing industry coverage percentages from a global mobility survey. Colorful, minimalist design on a dark blue background.
Human Resources and Talent Management
Professional Services
This slide continues the demographic overview of the global survey, showcasing industry participation distribution. Technology leads, followed by healthcare, energy, and retail. Visual format supports easy comparison across industries.
global mobility, industry analysis, survey results, workforce planning, talent mobility, demographics, industry representation, HR
false
Human Resources and Talent Management
Professional Services
Single Chart
KPMG
Add to my slides
Remove from favorites
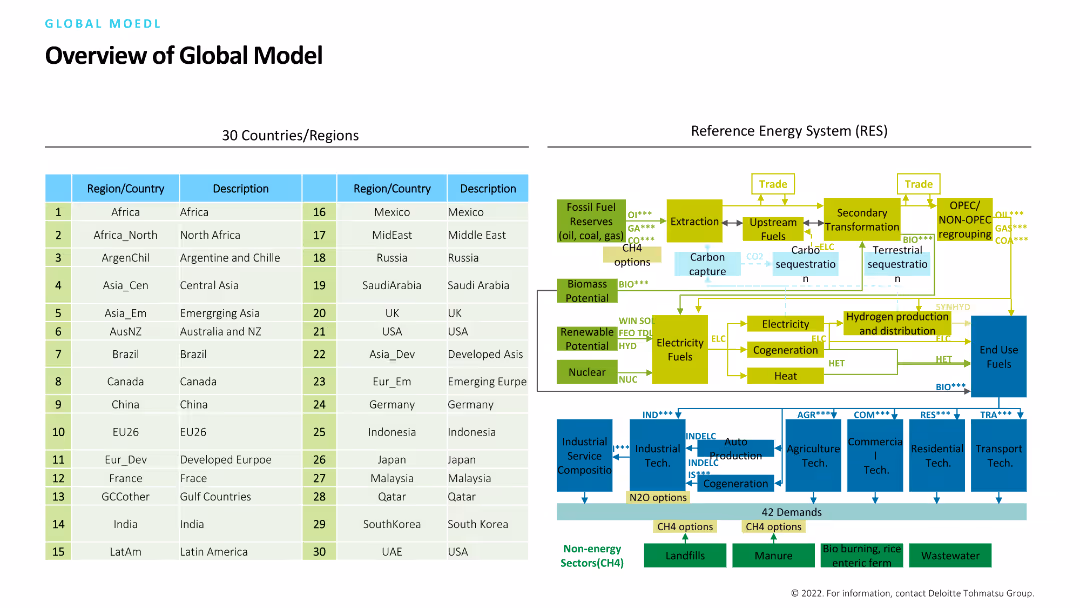
The slide is divided into two sections: a table listing 30 countries/regions with descriptions, and a complex flow diagram illustrating the reference energy system (RES), including fossil fuel reserves, renewable potential, and more.
Strategic Planning
Industrial & Manufacturing
The slide provides a comprehensive overview of a global model, detailing regions and their energy systems. It's intended for strategic planning in the energy and manufacturing sectors, showing resource and energy flows.
Global model, energy system, regions, strategic planning, reference energy system
false
Strategic Planning
Industrial & Manufacturing
Header Horizontal
Deloitte
Add to my slides
Remove from favorites
Features two major logos at the top, three columns with text and graphics representing global locations, transactions, and contact information.
Client Case Studies
Professional Services
Highlights a consultancy's global reach and expertise in automation, with emphasis on M&A advisory services.
Global Network, Automation, Expertise, M&A Advisory, Consulting, Global Reach
false
Client Case Studies
Professional Services
Uncategorized
LEK
Add to my slides
Remove from favorites
World map highlighting global presence, pie chart of regional revenue split, and key textual data points.
Industry Overview
Financial Services
Highlights the global reach and financial footing of the bank, detailing employee numbers and loan book value, aimed at investors and market analysts.
global network, banking, market presence, 2022
false
Industry Overview
Financial Services
Mixed Chart
Deutsche Bank
Add to my slides
Remove from favorites
Previous
Next
You don't have any favorites yet.
Please wait loading your favorites slides...
Create a FREE account to continue browsing
Receive Instant Access to 1,000+ slides from companies like McKinsey, Google, and Goldman Sachs
First Name
Last Name
Email
Password
I agree to all
Terms & Privacy Policy
Thank you! Your submission has been received!
Oops! Something went wrong while submitting the form.
Have an account?
Sign in
Upgrade to PRO to Save slides
Advanced Search and Filters
Access to 15,000+ slides
Access to Category Pages
Save/Bookmark Slides
PowerPoint Template Library
Pick a Plan
MONTHLY
$12/month
Billed every month, Cancel anytime.
YEARLY
$9/year
Billed $108 annually, Cancel anytime.
Checkout for $12/month
Checkout for $108/yr
Secured by Stripe | AES-256 bit encryption