My Account
My Slides
Search by Category
Companies
Slide Type
Use Case
Industry
Pricing
Templates
View All Templates
Download Template Slides
✦ AI
AI Prompt Library
AI Search
Feedback
Login
Logout
Get Started
Browse all Slides
Browse all Slides
Create a FREE Account
Instant access to 1,000+ real slides from top companies like McKinsey, BCG, Goldman Sachs, Google and many more!
First Name
Last Name
Email
Password
I agree to all
Terms & Privacy Policy
Thank you! Your submission has been received!
Oops! Something went wrong while submitting the form.
Have an account?
Sign in
Saved Slides
Total No. of slides saved
0
↻ Refresh
✖ Clear all
Features a world map pinpointing BCG experts worldwide with photos, names, and regional connections highlighted by lines, indicating the spread and expertise areas of the network.
Industry Overview
Professional Services
Showcases BCG's global network of experts ready to discuss key outcomes in luxury market consumer insights, emphasizing international expertise and reach.
global network, BCG, consumer insights, luxury market, experts, world map, international expertise
false
Industry Overview
Professional Services
Graphic
BCG
Add to my slides
Remove from favorites
A slide with two sections: a map highlighting global reach and a side panel outlining execution priorities. It includes numerical data and textual information in bullet points.
Market Analysis and Trends
Financial Services
The slide provides an overview of the firm's global network, including revenues, offices, employees, and prioritizes strategic growth areas such as advisory services and corporate footprint.
Global Network, Client Relationships, Revenues, Execution Priorities
false
Market Analysis and Trends
Financial Services
Table
Goldman Sachs
Add to my slides
Remove from favorites
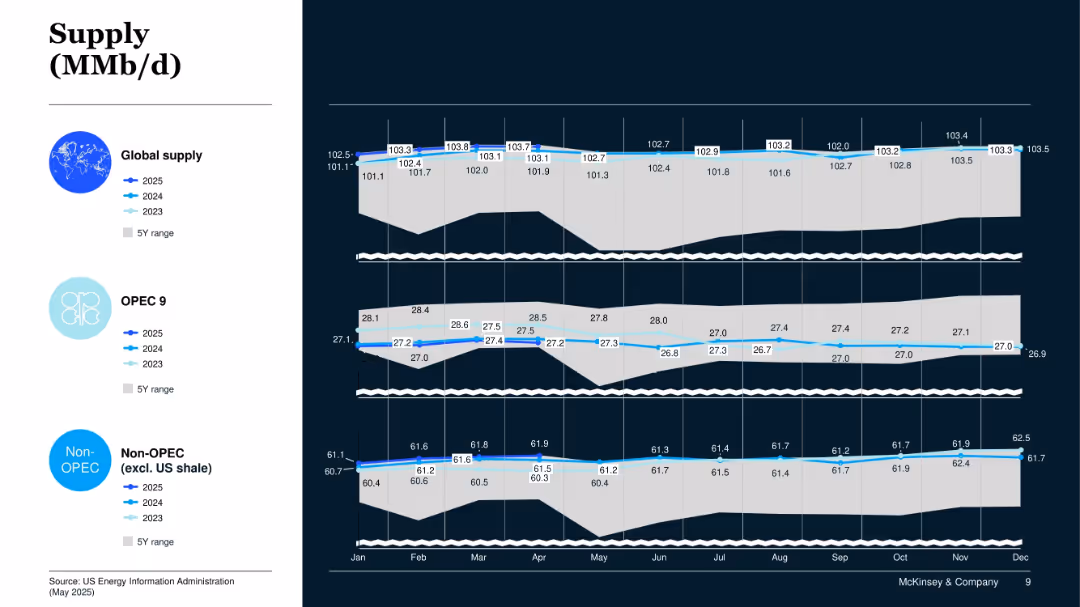
Three-panel line chart showing 2023–2025 global oil supply by global total, OPEC 9, and Non-OPEC; includes 5Y range.
Operational Efficiency
Energy & Utilities
This slide tracks supply trends from 2023 to 2025, focusing on global, OPEC 9, and Non-OPEC sources. It shows moderate growth in global output driven mainly by Non-OPEC sources.
Global Oil Supply, OPEC, Non-OPEC, Supply Trends, Production Forecast
false
Operational Efficiency
Energy & Utilities
Mixed Chart
McKinsey
Add to my slides
Remove from favorites
A world map highlights key locations with markers. An inset magnifies the Singapore region, showing more detail with labeled yard locations.
Strategic Planning
Energy & Utilities
The slide demonstrates Seatruim's global presence, highlighting its worldwide yards and the strategic position of Singapore in the company's operations. It could be used to emphasize the company's expansive global operations and strategic locations.
Global, Operations, Reach, Yards, Singapore
false
Strategic Planning
Energy & Utilities
Graphic
Morgan Stanley
Add to my slides
Remove from favorites
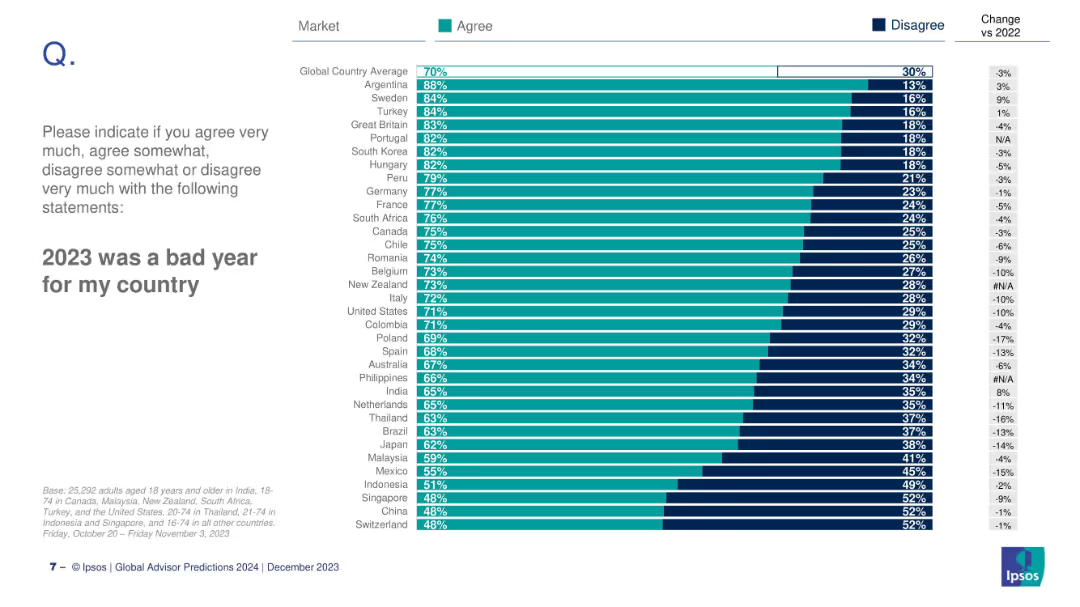
Horizontal bar chart showing country-level agreement with the statement, ranked by agreement level, with % change vs 2022.
Market Analysis and Trends
Professional Services
This slide provides a country-level breakdown of the percentage of people agreeing that 2023 was a bad year for their country. Argentina ranks highest at 88%, and Japan lowest at 30%.
global opinion, country ranking, 2023, bad year, Ipsos, sentiment, international comparison, bar chart
false
Market Analysis and Trends
Professional Services
Mixed Chart
IPSOS
Add to my slides
Remove from favorites
Icons and bullet points outlining key milestones and future outlooks in product innovation for global payments, including virtual accounts and real-time payments, with a timeline flow on the bottom.
Product and Service Analysis
Financial Services
This slide details recent innovations in global payment products, timelines for rollouts, and future market expansion goals, suitable for product strategy and market analysis discussions.
Global Payments, Innovation, Market Expansion, Virtual Account, API
false
Product and Service Analysis
Financial Services
Table
JP Morgan
Add to my slides
Remove from favorites
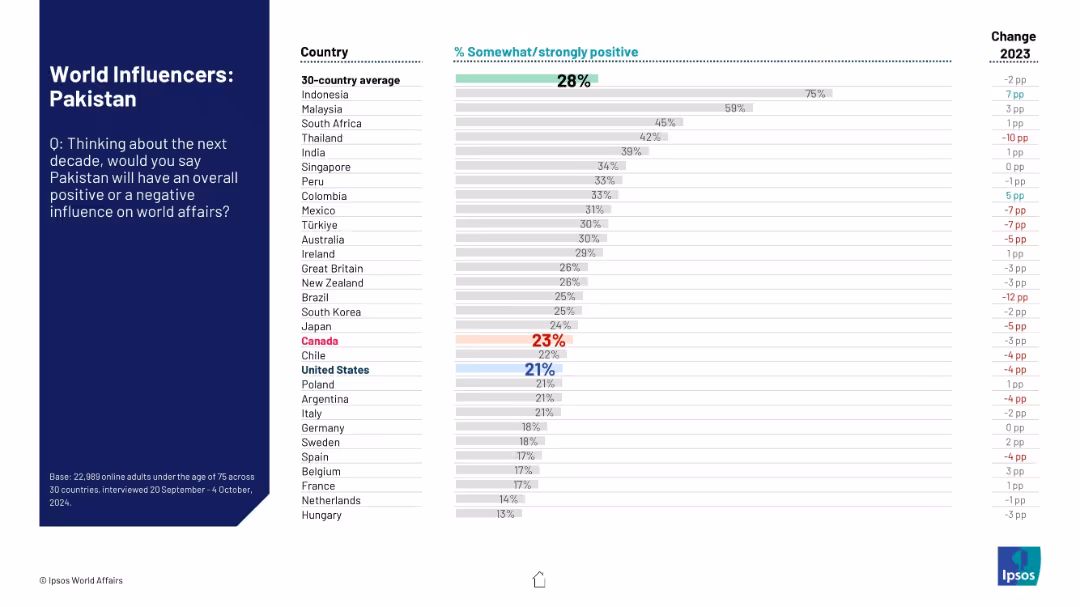
Split layout with dark blue question panel on the left and ranked horizontal bar chart on the right; shows positive perception data across countries with % change from 2023.
Market Analysis and Trends
Government & Public Sector
This slide displays international perceptions of Pakistan's influence on world affairs over the next decade. A 30-country average is shown, with comparative rankings and year-on-year change, highlighting regional sentiment.
global perception, Pakistan, influence, international opinion, Ipsos, world affairs, trends, survey, sentiment shift, geopolitical
false
Market Analysis and Trends
Government & Public Sector
Mixed Chart
IPSOS
Add to my slides
Remove from favorites
Features column charts and lists comparing regions (North America, Europe, Asia) with their prioritized actions for 2023, emphasizing differences in approach to EVP enhancement and supply chain actions.
Market Analysis and Trends
Financial Services
The slide contrasts how different regions prioritize actions against global phenomena for 2023, such as layoffs, enhancing EVP, and innovations in supply chain management, highlighting regional strategies to address economic uncertainties.
global phenomena, layoffs, EVP enhancement, supply chain, regional strategies
false
Market Analysis and Trends
Financial Services
Multiple Chart
BCG
Add to my slides
Remove from favorites
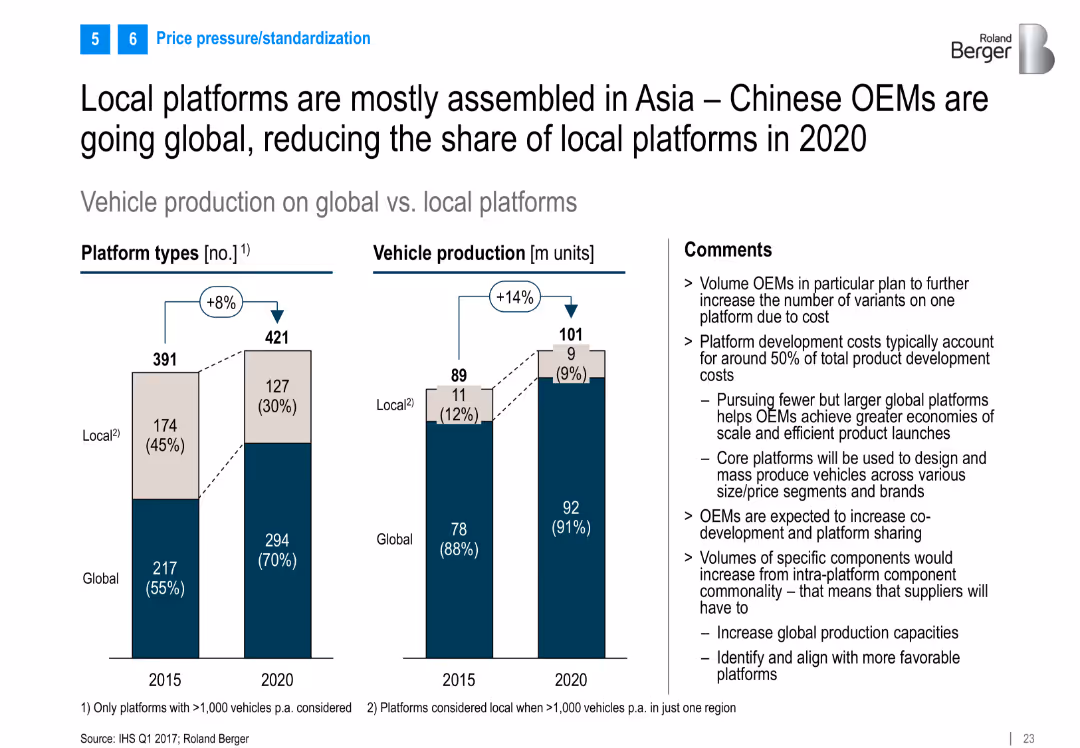
Dual bar charts comparing global vs. local platform types and vehicle production in 2015 vs. 2020; supported by commentary on platform strategies
Operational Efficiency
Industrial & Manufacturing
Analyzes the shift toward global vehicle platforms, especially by Chinese OEMs. Highlights economies of scale and reduced share of local platforms, with implications for co-development and supplier alignment.
global platforms, local platforms, OEM strategy, vehicle production, Asia, China, platform sharing
false
Operational Efficiency
Industrial & Manufacturing
Multiple Chart
Roland Berger
Add to my slides
Remove from favorites
The slide illustrates global reach with a world map marking the number of bankers and offices, alongside text detailing rankings and service areas in the Americas, EMEA, and APAC regions with a professional and straightforward layout.
Operational Efficiency
Financial Services
This slide underlines the global footprint of Goldman Sachs and its leading position in various banking services, likely used in corporate presentations to showcase operational scale and efficiency to stakeholders or potential partners.
Global presence, banking, M&A, leadership, Goldman Sachs
false
Operational Efficiency
Financial Services
Graphic
Goldman Sachs
Add to my slides
Remove from favorites
An updated world map from slide 2933, now indicating growth with more markers and comparative data from 1990 to 2019. Same minimal design but with more data points.
Industry Overview
Financial Services
Showcases significant growth in international presence over 29 years with data on revenues, headcount, and offices to depict expansion success.
Global presence, development, business growth, headcount
false
Industry Overview
Financial Services
Graphic
Goldman Sachs
Add to my slides
Remove from favorites
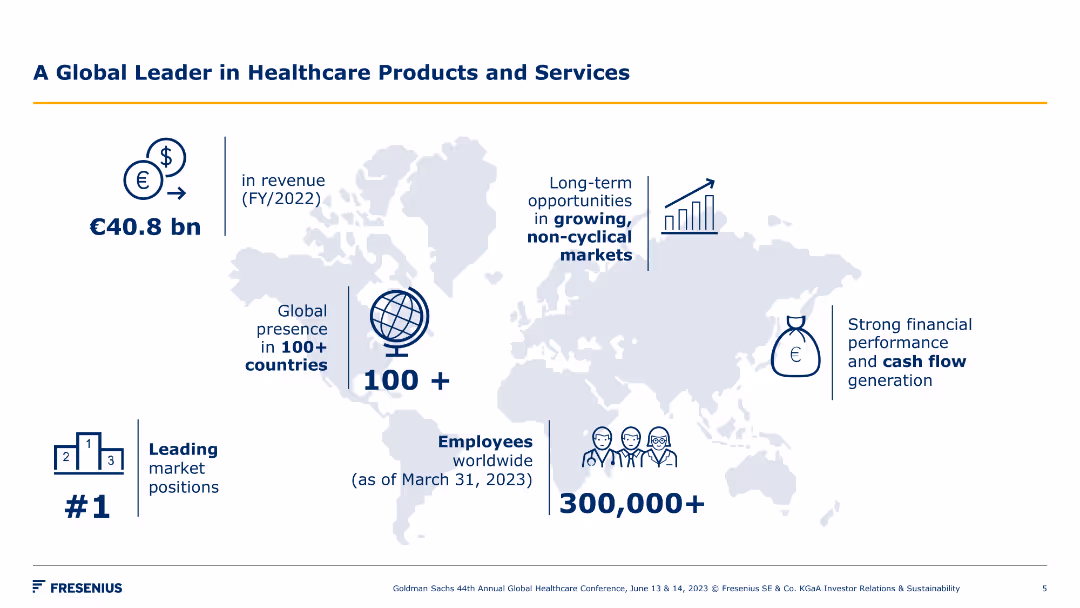
A map showing global presence, financial performance metrics, and key achievements. Simple icons and text highlight revenue, employee count, and market presence.
Industry Overview
Healthcare & Pharmaceuticals
This slide highlights Fresenius' global leadership in healthcare products and services, showcasing revenue, market presence, employee count, and financial performance.
global presence, healthcare, revenue, market, employees, performance, financial, leadership, products, services
false
Industry Overview
Healthcare & Pharmaceuticals
Graphic
Goldman Sachs
Add to my slides
Remove from favorites
The slide features textual information alongside a centered world map highlighting global presence. There are statistics and a list format used to showcase the bank's leadership and assets under management.
Organizational Structure and Change
Financial Services
Highlights the bank's global network and leadership in the financial industry, with a focus on its status in Germany and worldwide assets, emphasizing its market position and extensive client base.
global presence, market leadership, financial industry, assets management, global network
false
Organizational Structure and Change
Financial Services
Diagram
Deutsche Bank
Add to my slides
Remove from favorites
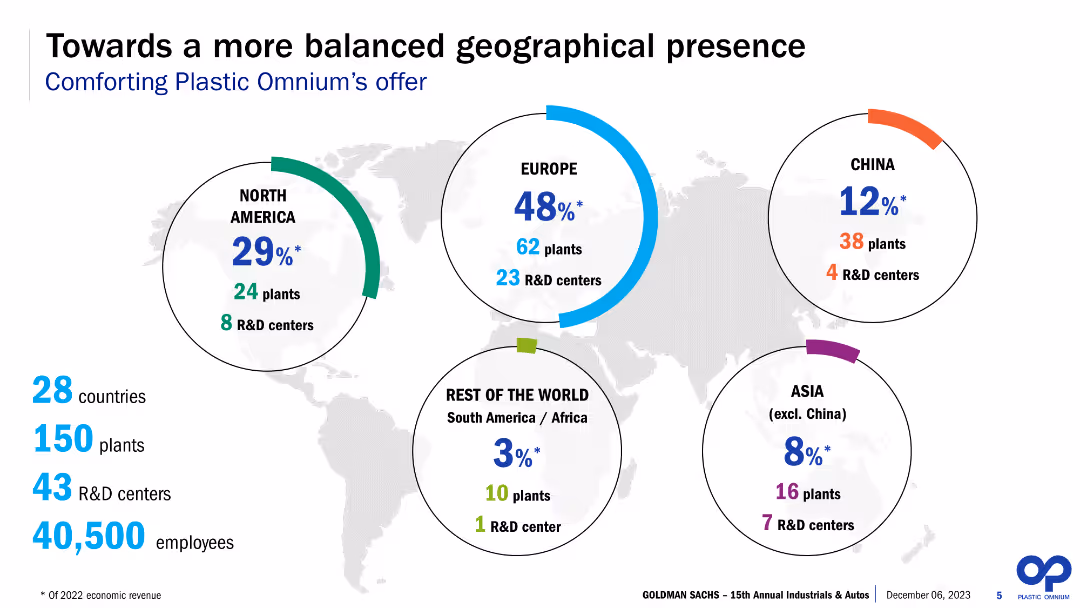
The slide features a world map with circular infographics representing various regions. It includes percentages, numbers of plants, and R&D centers across North America, Europe, China, Asia (excluding China), and the rest of the world. Text and numerical data are prominently displayed.
Strategic Planning
Industrial & Manufacturing
The slide presents Plastic Omnium’s geographical presence with detailed breakdowns of plants and R&D centers across different regions. It highlights the percentage of economic revenue each region represents, aiming to demonstrate the company’s balanced global footprint.
Global presence, plants, R&D centers, revenue, geographical distribution, Plastic Omnium, strategic planning, manufacturing, regional analysis, balanced presence
false
Strategic Planning
Industrial & Manufacturing
Multiple Chart
Goldman Sachs
Add to my slides
Remove from favorites
A world map highlights global office locations with blue dots. Key figures about the company's size and scope are presented in an easy-to-read format on the side.
Industry Overview
Professional Services
Introduces Alvarez & Marsal, detailing its global presence and core figures such as office locations, number of employees, and industries served. This slide is designed to give a snapshot of the firm's worldwide operations and industry reach.
global presence, professional services, employees, offices, industries
false
Industry Overview
Professional Services
Graphic
Alvarez & Marsal
Add to my slides
Remove from favorites
This slide presents a global map highlighting Seadrill’s operational and office locations worldwide. Each location is marked with icons representing different types of rigs or offices, color-coded for clarity. The map is accompanied by bullet points summarizing key statistics, such as the total number of employees and office locations. The layout is spacious and well-organized, making it easy to identify key information quickly.
Strategic Planning
Energy & Utilities
The slide illustrates Seadrill's global operational footprint, emphasizing its extensive reach and strategic positioning in 24 countries. This would be particularly relevant in discussions about market expansion, investor presentations, or internal strategy meetings, showcasing Seadrill’s strength and capability in global operations. It provides a visual representation of the company's scale and the geographical diversity of its assets and personnel, underscoring its role as a major player in the global energy sector.
global presence, Seadrill, operations, map, employees, offices, rigs, international, strategic positioning, energy sector
false
Strategic Planning
Energy & Utilities
Graphic
Barclays
Add to my slides
Remove from favorites
This slide contains a world map highlighting project team presence across various global cities. Below the map are three key points about the firm's capabilities, including team size, office locations, and client base. The slide uses a mix of icons and text.
Industry Overview
Professional Services
The slide presents an overview of L.E.K. Consulting’s global presence, highlighting their offices, team size, and client relationships, emphasizing their global strategy and market knowledge.
global presence, strategy, consulting, offices, team
false
Industry Overview
Professional Services
Graphic
LEK
Add to my slides
Remove from favorites
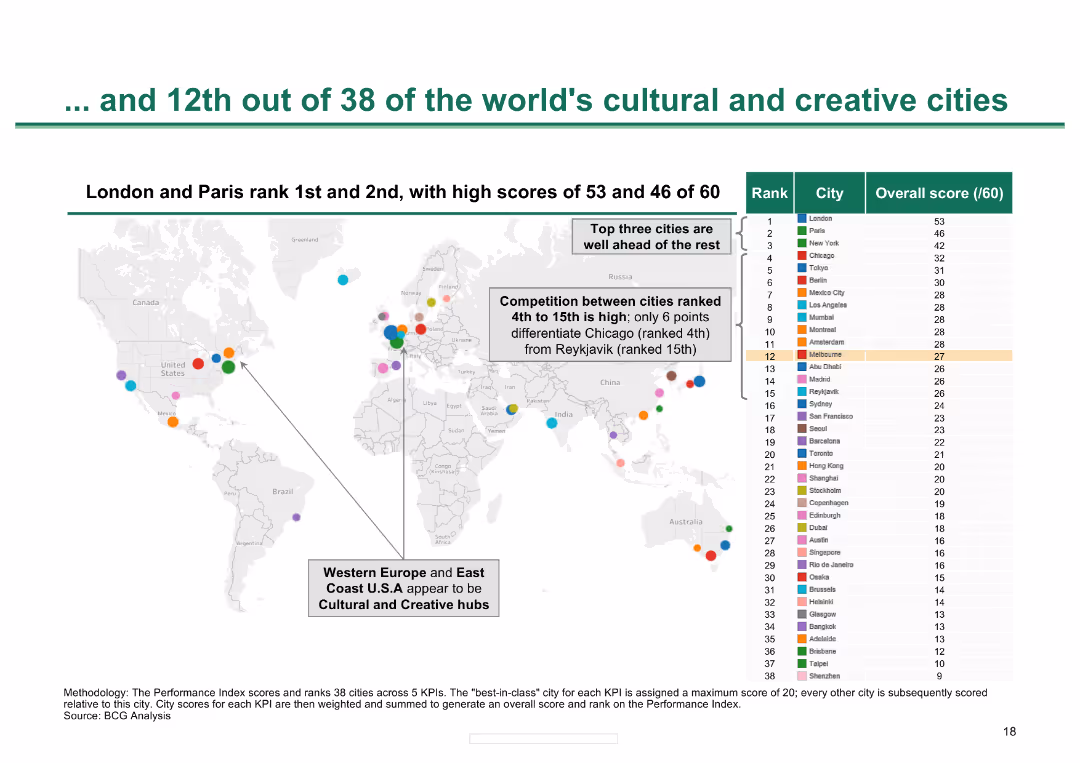
World map with various cities marked, ranking chart on the right; vibrant colors
Market Analysis and Trends
Hospitality & Tourism
Highlights the global ranking of Melbourne among cultural cities, with a focus on competition and scores
Global ranking, cultural cities, competition, world map, performance index
false
Market Analysis and Trends
Hospitality & Tourism
Graphic
BCG
Add to my slides
Remove from favorites
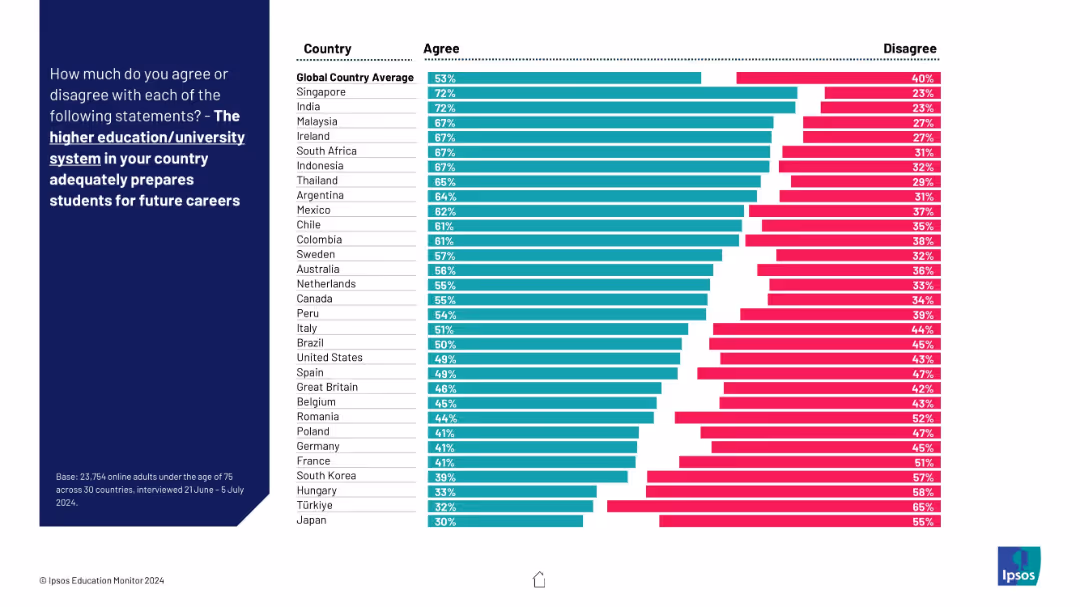
Ranked horizontal bar chart by country showing agree/disagree percentages. Global average benchmarked at top. Countries arranged highest to lowest in agreement.
Market Analysis and Trends
Education & Training
The chart ranks 30 countries by agreement levels on how well their higher education systems prepare students for careers. Singapore and India rank highest, while Hungary and Japan rank lowest.
global ranking, higher education, country comparison, future careers, university preparation
false
Market Analysis and Trends
Education & Training
Mixed Chart
IPSOS
Add to my slides
Remove from favorites
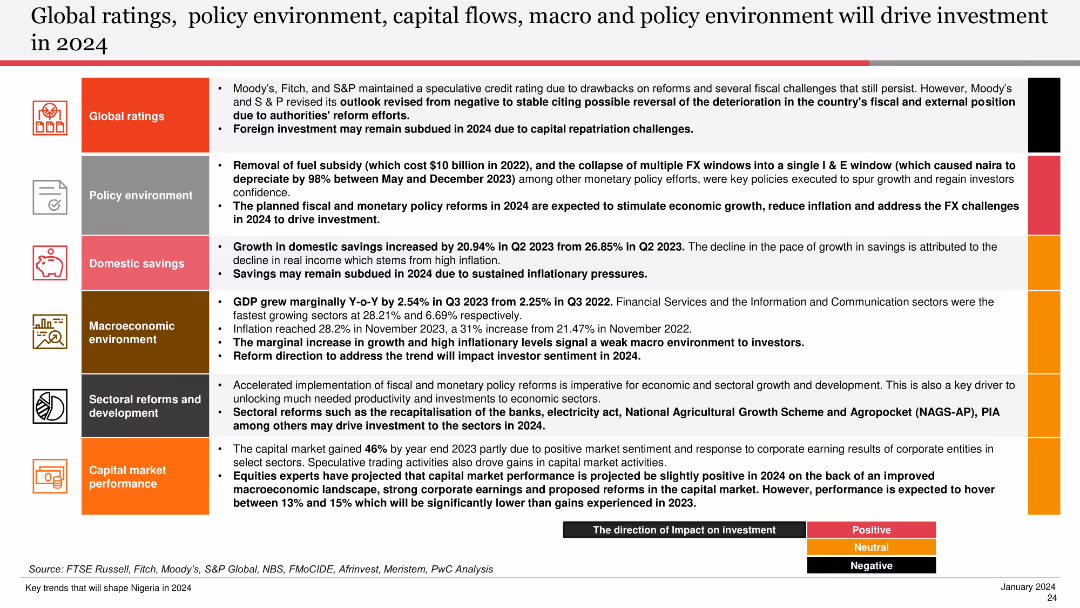
The slide features a well-structured layout with icons, bullet points, and color-coded sections to denote different categories such as global ratings, policy environment, domestic savings, macroeconomic environment, sectoral reforms, and capital market performance.
Market Analysis and Trends
Financial Services
The slide discusses the factors influencing investment in 2024, including global ratings, policy changes, domestic savings, and sectoral reforms. It highlights various economic indicators and trends that are expected to drive investment in the coming year.
global ratings, policy environment, capital flows, macroeconomic environment, investment trends
false
Market Analysis and Trends
Financial Services
Table
PwC/Strategy&
Add to my slides
Remove from favorites
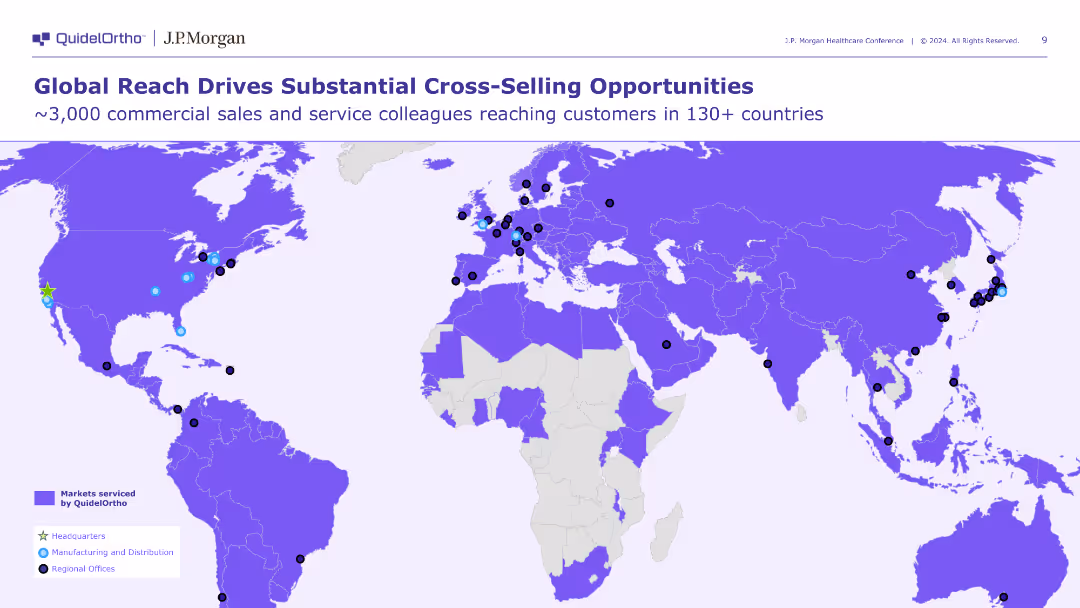
This slide features a world map highlighting the global reach of QuidelOrtho's commercial sales and service teams, with different colors indicating various types of offices and facilities.
Strategic Planning
Healthcare & Pharmaceuticals
The slide emphasizes QuidelOrtho's extensive global reach and the cross-selling opportunities available through their commercial sales and service network spanning over 130 countries.
global reach, cross-selling, international
false
Strategic Planning
Healthcare & Pharmaceuticals
Graphic
JP Morgan
Add to my slides
Remove from favorites
Pie charts breakdown of Unilever's 2021 turnover by product category. Pie charts showing market distribution and user base. Vibrant blue and red colors.
Industry Overview
Consumer Goods
Summary of Unilever’s global reach and turnover in 2021, highlighting its market distribution between developed and emerging markets and its extensive user base.
Global Reach, Turnover, Market Distribution, Developed Markets, Emerging Markets
false
Industry Overview
Consumer Goods
Multiple Chart
Deutsche Bank
Add to my slides
Remove from favorites
Geographic regions with icons representing RMs, CBV, and market growth.
Market Analysis and Trends
Financial Services
Provides an overview of Credit Suisse's wealth management division across various global regions, highlighting market growth.
global regions, market growth, wealth management, regional analysis, client base
false
Market Analysis and Trends
Financial Services
Graphic
Credit Suisse
Add to my slides
Remove from favorites
This slide includes stacked bar charts showing mining production by location and a bar chart displaying agricultural trade balances by region over time.
Market Analysis and Trends
Financial Services
The slide provides a global overview of key resource distribution, including mining production and agricultural trade balances, useful for understanding resource management and economic dependencies.
global resources, mining production, agricultural trade, resource management, economic dependencies, trade balances
false
Market Analysis and Trends
Financial Services
Multiple Chart
JP Morgan
Add to my slides
Remove from favorites
Title slide with a large background image, presentation title, and date, set for an introductory slide.
Industry Overview
Professional Services
Introduces a series on global restart dynamics, indicating it's the start of a discussion on COVID-19's impact.
Global Restart, COVID-19, Pandemic, Key Dynamics, Perspectives Series
false
Industry Overview
Professional Services
Title
BCG
Add to my slides
Remove from favorites
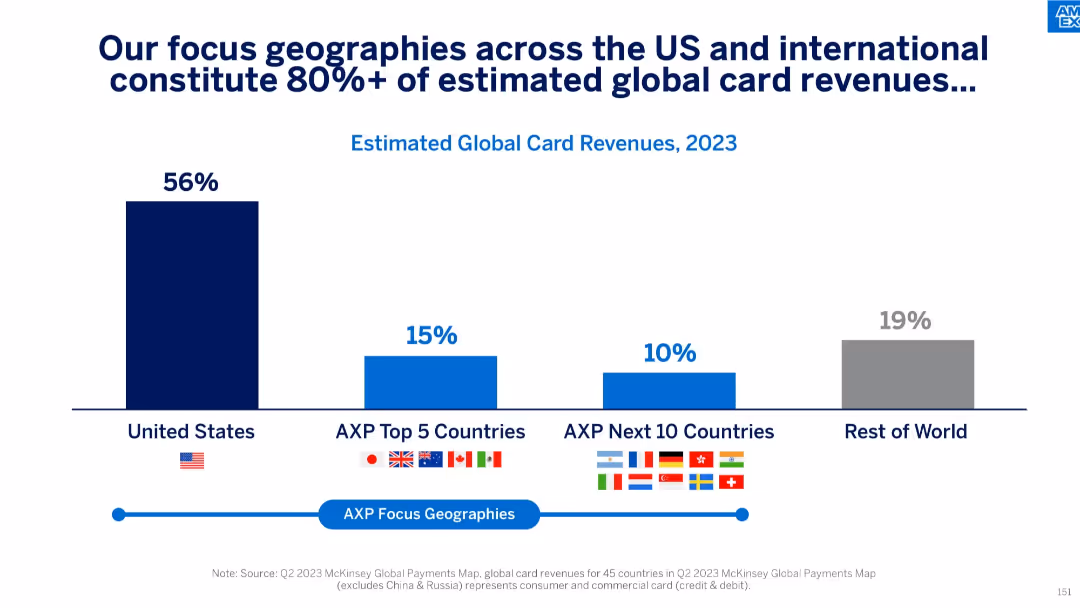
Bar chart illustrating revenue concentration in the U.S., top 5 countries, next 10 countries, and rest of world based on 2023 data.
Customer and Market Segmentation
Financial Services
This slide shows that more than 80% of global card revenues come from a focused set of geographies, with the U.S. contributing 56%, and top 15 countries adding another 25%. It implies strategic prioritization of these regions for business concentration and growth.
global revenue, market segmentation, geography focus, international markets, card revenues, US market, revenue distribution
false
Customer and Market Segmentation
Financial Services
Single Chart
McKinsey
Add to my slides
Remove from favorites
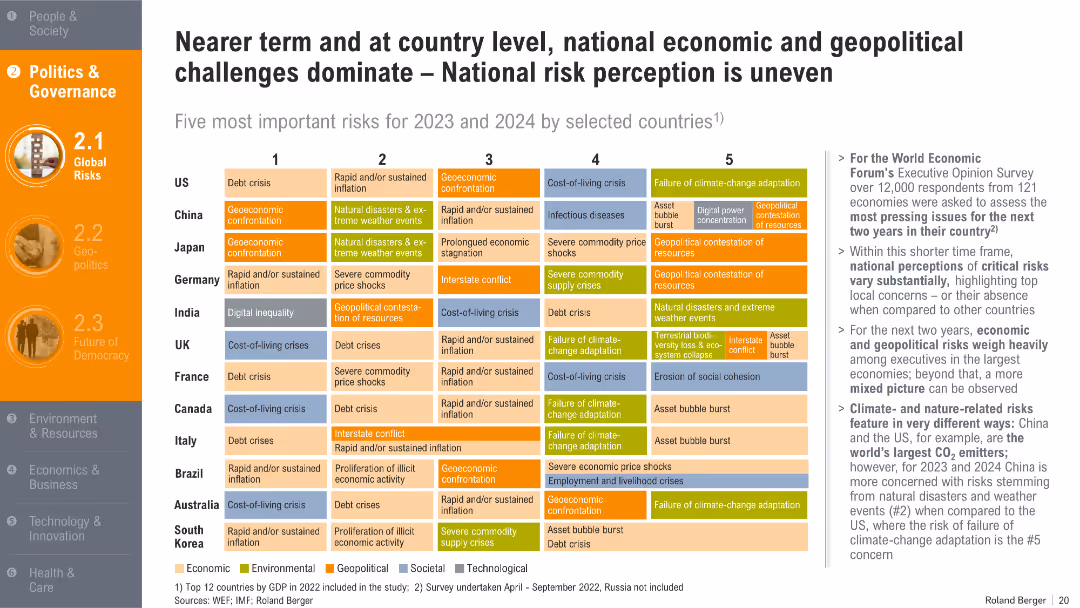
Table with color-coded boxes ranking top 5 risks across countries; risk categories include economic, geopolitical, and environmental.
Risk Assessment and Management
Professional Services
This slide highlights the top perceived risks in leading economies for 2023–2024, showing varied national concerns with emphasis on inflation, debt, and climate risks. It derives data from the World Economic Forum survey.
global risks, debt, inflation, climate adaptation, geopolitical conflict, WEF, economic outlook
false
Risk Assessment and Management
Professional Services
Mixed Chart
Roland Berger
Add to my slides
Remove from favorites
Uses a world map and pie charts to present global sales distribution, product categories, and company resources.
Industry Overview
Consumer Goods
Summarizes the global sales footprint of a consumer goods company, showing regional sales distribution and product diversification.
global, sales, consumer goods, distribution, products, company, diversification, markets
false
Industry Overview
Consumer Goods
Multiple Chart
Deutsche Bank
Add to my slides
Remove from favorites
The slide shows bar graphs indicating the increase in invested assets in USD billions for Switzerland, EMEA, APAC, and Americas from 2022 to 2023. Text on the right outlines medium-term priorities for staying close to clients, leveraging regional scale, and institutionalizing growth in the US.
Market Analysis and Trends
Financial Services
The slide highlights the growth in invested assets across various regions and outlines medium-term priorities for global wealth management. It focuses on client engagement, regional integration, and US market expansion. This slide can be used to present regional growth strategies and priorities to stakeholders.
global scale, footprint, invested assets, regional growth, priorities
false
Market Analysis and Trends
Financial Services
Multiple Chart
UBS
Add to my slides
Remove from favorites
An image with network visualizations complements the textual information which includes key metrics regarding the firm's global technological reach.
Technology and Digital Transformation
Technology & Software
This slide aims to illustrate the firm's expansive technological capabilities and global customer reach through significant figures.
global scale, technology, digital customers, data storage, network visualization, JPMorgan
false
Technology and Digital Transformation
Technology & Software
Text Only
JP Morgan
Add to my slides
Remove from favorites
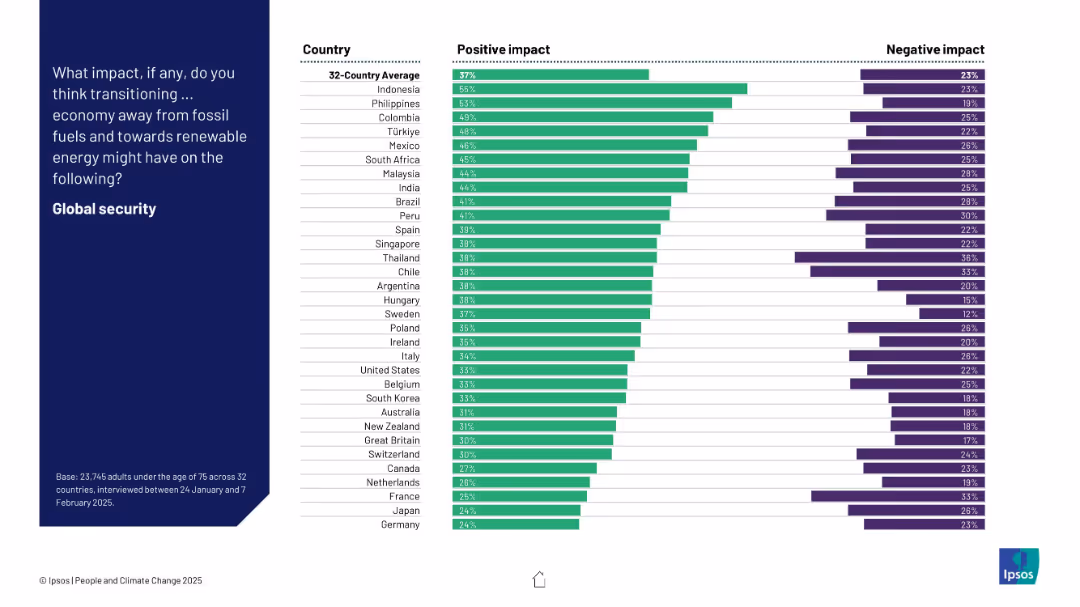
Bar chart comparing 32 countries’ responses; green bars for positive impact, purple bars for negative; left-aligned question prompt.
Market Analysis and Trends
Environmental Services & Sustainability
This slide shows public perception across 32 countries on the impact of transitioning from fossil fuels to renewable energy on global security. It visualizes both positive and negative perceptions.
global security, renewable energy, fossil fuels, climate transition, public opinion, Ipsos, global survey, sustainability, energy policy, bar chart
false
Market Analysis and Trends
Environmental Services & Sustainability
Mixed Chart
IPSOS
Add to my slides
Remove from favorites
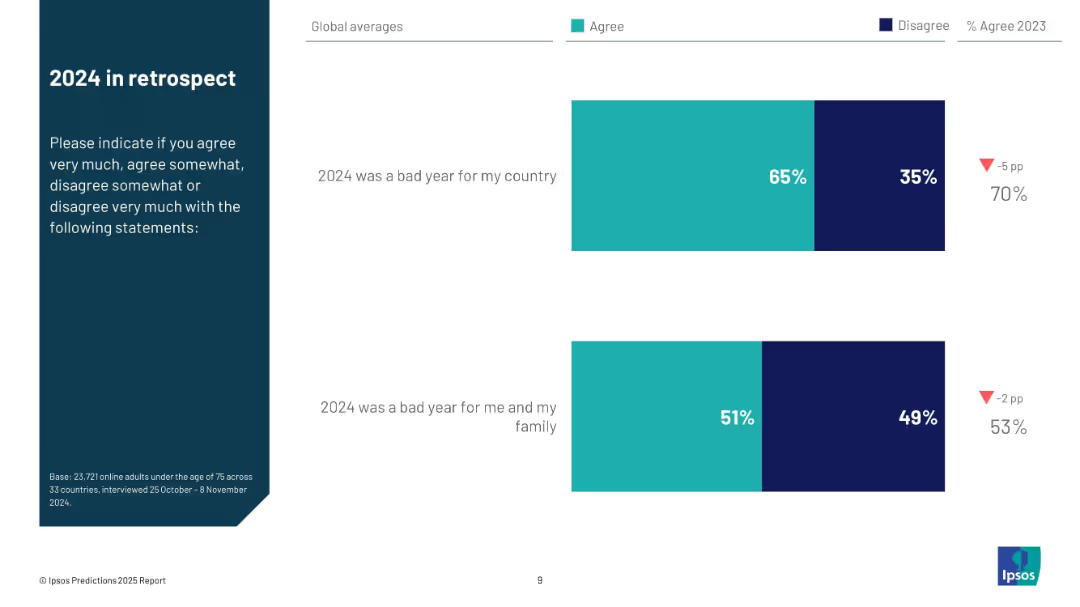
Two horizontal bar graphs comparing agreement and disagreement with two statements, with bold numerical overlays; left side features descriptive prompt on dark blue.
Performance Metrics and KPIs
Professional Services
This slide presents global averages for two statements: 65% agreed 2024 was a bad year for their country, and 51% said the same for themselves and their families. Trends reflect a decline from previous years, providing insight into perceived national and personal hardships.
global sentiment, 2024 review, personal hardship, national conditions, survey, public opinion
false
Performance Metrics and KPIs
Professional Services
Mixed Chart
IPSOS
Add to my slides
Remove from favorites
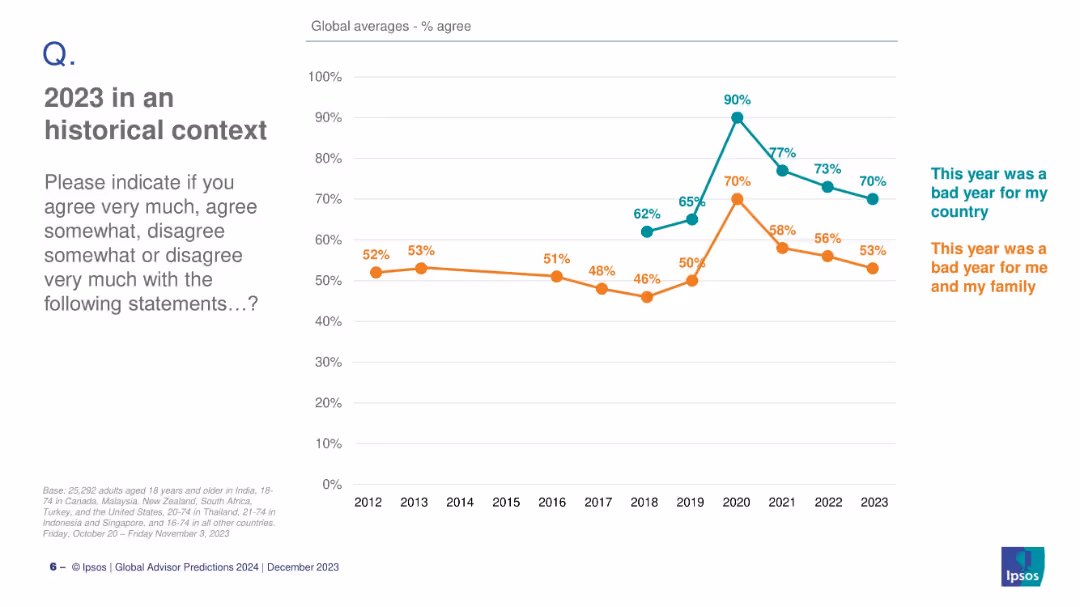
Dual-line chart comparing annual global agreement on two statements (bad year for country vs. for family); minimal text on left.
Market Analysis and Trends
Professional Services
This slide presents a historical trend (2012–2023) of global sentiment, showing how people rated the year negatively for their country and for their families, with peak discontent in 2020.
global sentiment, bad year, family, country, trend, 2023, historical, Ipsos, perceptions, public opinion
false
Market Analysis and Trends
Professional Services
Mixed Chart
IPSOS
Add to my slides
Remove from favorites
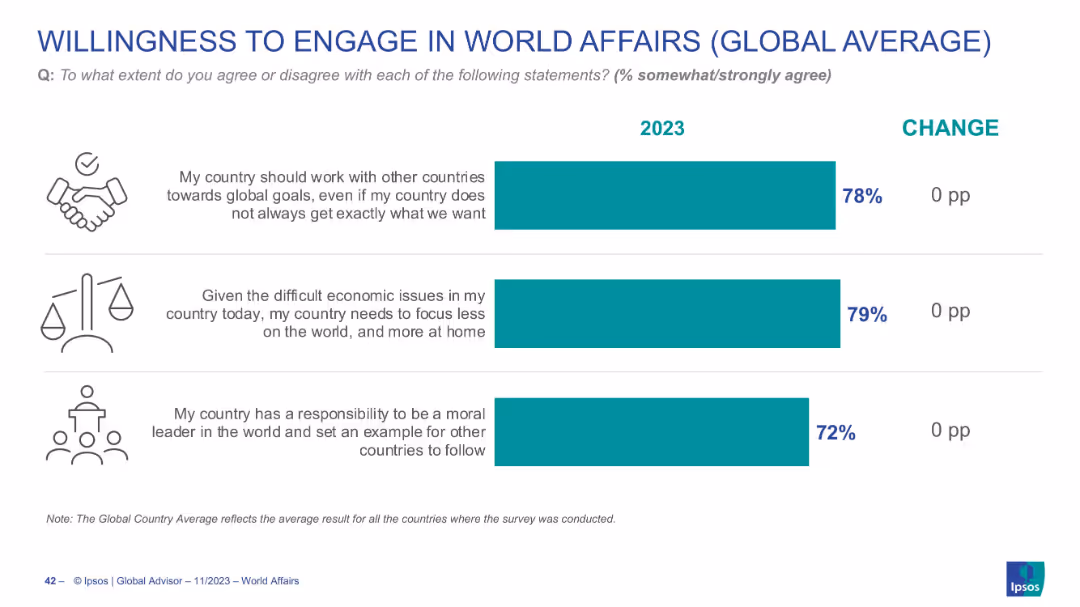
Visual icons with horizontal bar graphs for three topics: cooperation, economic inward focus, and moral leadership
Strategic Planning
Government & Public Sector
Displays global average agreement for three international engagement themes: cooperation (78%), domestic focus (79%), and moral leadership (72%), reflecting overall geopolitical sentiment across countries.
global sentiment, cooperation, economy, leadership, engagement, policy trends
false
Strategic Planning
Government & Public Sector
Single Chart
IPSOS
Add to my slides
Remove from favorites
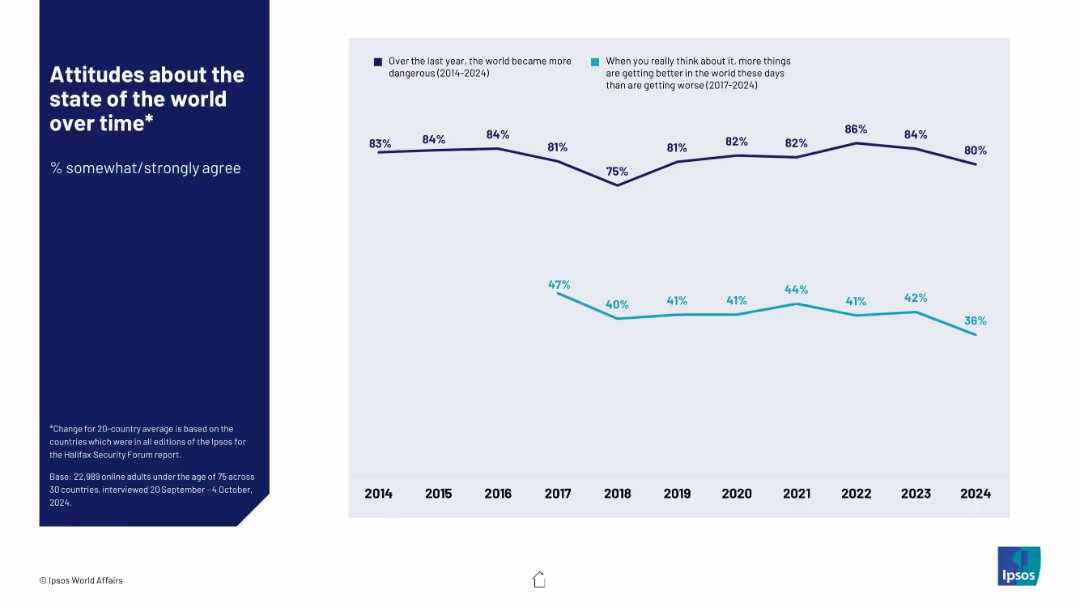
Line chart tracking two metrics (dangerous world vs. things getting better) over 10 years; simple layout with bold left-side text.
Market Analysis and Trends
Government & Public Sector
This slide tracks global attitudes from 2014–2024. The majority consistently perceive the world as becoming more dangerous, with percentages hovering around 80%. Conversely, optimism about the world improving has declined significantly, dropping to 36% in 2024.
global sentiment, perception trends, world danger, optimism, pessimism, historical data, public opinion, Ipsos, 10-year trend, safety
false
Market Analysis and Trends
Government & Public Sector
Mixed Chart
IPSOS
Add to my slides
Remove from favorites
Uses a combination of bullet points and icons in a structured layout. Blue and white color scheme is maintained for clarity and visual consistency.
Operational Efficiency
Professional Services
Outlines the services offered by Alvarez & Marsal globally, including performance improvement, corporate restructuring, and more. The slide serves as an overview of the firm’s capabilities across various business sectors.
global services, restructuring, performance improvement, corporate advisory
false
Operational Efficiency
Professional Services
Header Vertical
Alvarez & Marsal
Add to my slides
Remove from favorites
Color-coded mekko chart representing global spend on various services like professional, financial, and construction. Each service type is highlighted with its spend in trillions, some sections marked for requiring more active governance.
Market Analysis and Trends
Professional Services
Explores global expenditure on different services, emphasizing areas like professional and financial services with significant spending, and noting sectors needing active governance like construction.
Global, Services, Spend, Analysis, Governance
false
Market Analysis and Trends
Professional Services
Single Chart
Kearney
Add to my slides
Remove from favorites
This slide presents a structured overview with text and icons detailing the acquisition of Global Shares and its potential impact across different business lines. The visual elements include icons, small text sections, and a diagram that maps out the integration process and expected benefits across market segments.
Market Analysis and Trends
Financial Services
Discussing the acquisition of Global Shares, the slide outlines the potential for client base growth and cross-sector integration. Useful in strategic business development sessions or discussing market expansion strategies.
global shares, acquisition, market growth, cross-sector, strategy
false
Market Analysis and Trends
Financial Services
Header Vertical
JP Morgan
Add to my slides
Remove from favorites
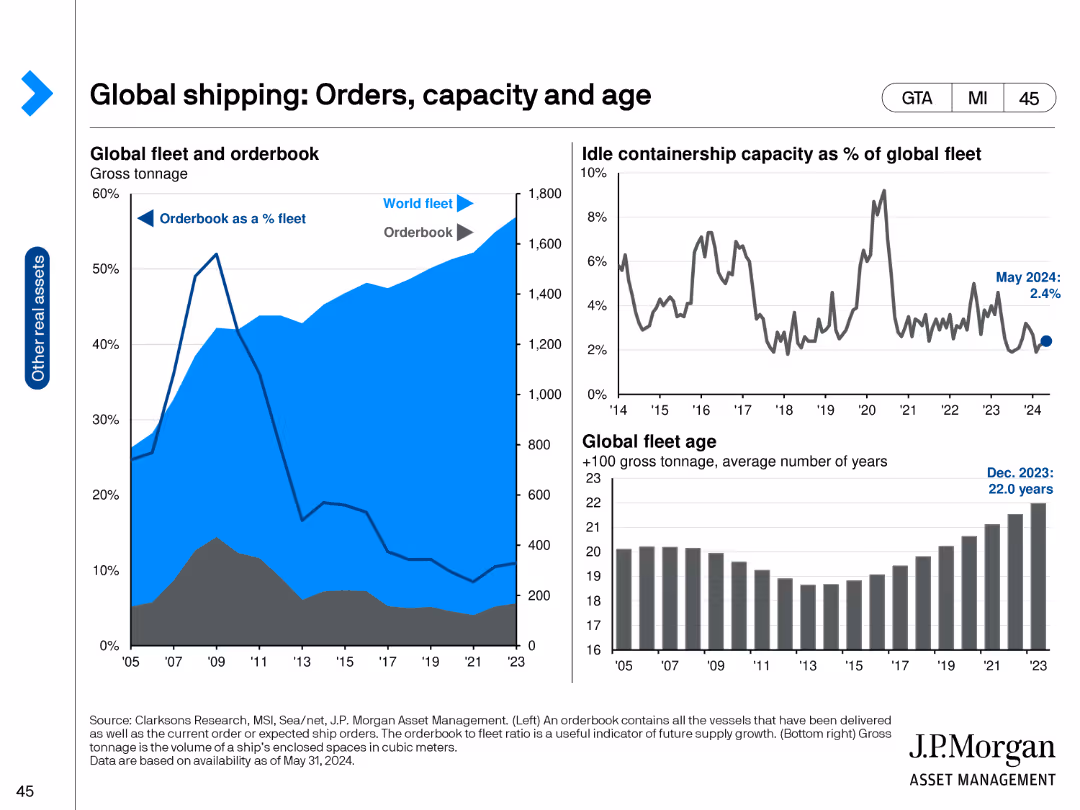
The slide contains three charts: a line chart on the left showing the orderbook as a percentage of the global fleet from 2005 to 2023, a line chart in the middle depicting the idle containership capacity as a percentage of the global fleet from 2014 to 2024, and a bar chart on the right showing the global fleet age from 2005 to 2023.
Market Analysis and Trends
Transportation & Logistics
This slide provides a comprehensive overview of the global shipping industry, focusing on orderbooks, idle capacity, and fleet age. It is intended to highlight the current state and future trends in shipping capacity and fleet management.
Global shipping, orderbook, fleet capacity, containerships, fleet age, shipping trends, maritime industry
false
Market Analysis and Trends
Transportation & Logistics
Multiple Chart
JP Morgan
Add to my slides
Remove from favorites
Black background with blue text boxes and white headers displaying statistics about the COVID-19 spread.
Market Analysis and Trends
Healthcare & Pharmaceuticals
Shows the acceleration of the global spread of COVID-19, including statistics on cases, deaths, and countries affected as of a specific date.
global spread, statistics, COVID-19, cases, deaths
false
Market Analysis and Trends
Healthcare & Pharmaceuticals
Table
McKinsey
Add to my slides
Remove from favorites
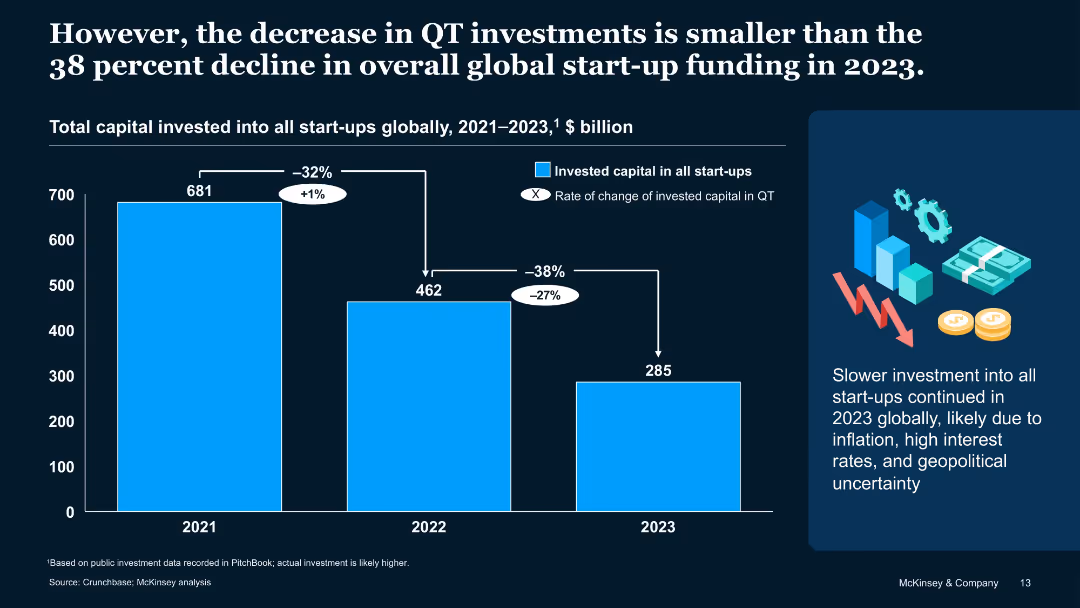
Bar chart comparison with annotation arrows and descriptive sidebar
Investment Analysis
Artificial Intelligence
Compares QT funding decline to broader startup ecosystem, showing QT's 27% drop is lower than the global 38% drop. Discusses macroeconomic reasons for slowdowns like inflation and geopolitical instability.
Global startup trends, QT comparison, 2023 investments, funding decline
false
Investment Analysis
Artificial Intelligence
Mixed Chart
McKinsey
Add to my slides
Remove from favorites
Features a central graphic with text sections around it, discussing various strategic aspects. The slide utilizes corporate colors and a clean layout for emphasis.
Strategic Planning
Financial Services
Explains the bank's strategic positioning as a global financial partner, focusing on client relationships and product offerings, suitable for discussions on long-term growth strategies.
global, strategic, growth, financial, banking, client, relationships, products, planning, services
false
Strategic Planning
Financial Services
Framework
Deutsche Bank
Add to my slides
Remove from favorites
Includes world maps colored by region to represent international expansion, complemented by key data points about market coverage and investment banking capabilities.
Strategic Planning
Financial Services
Explores JPMorgan’s strategy to compete globally by leveraging its platform and capabilities in foreign markets, focusing on the value of foreign investments and cross-border payments.
Global Strategy, International, Banking, Investment, Market Coverage, Payments
false
Strategic Planning
Financial Services
Header Vertical
JP Morgan
Add to my slides
Remove from favorites
This slide features line charts showing U.S. goods imports by country, a bar chart showing global manufacturing wages, and a column chart displaying inward foreign direct investment by country.
Market Analysis and Trends
Financial Services
The slide examines global supply chain dynamics, including U.S. import sources, manufacturing wages, and foreign direct investment patterns, providing insights into global trade and economic reorganization.
global supply chain, U.S. imports, manufacturing wages, foreign direct investment, global trade, economic reorganization
false
Market Analysis and Trends
Financial Services
Multiple Chart
JP Morgan
Add to my slides
Remove from favorites
This world map slide highlights specific countries like the USA, China, India, and Japan with red pins, indicating a focus on these regions for the survey. It provides a clear global comparison context.
Industry Overview
Professional Services
Offers a global overview of the countries prioritized in the survey, marking them as critical for understanding varying cultural attitudes across different regions.
global survey, cultural study, USA, China, India, Japan
false
Industry Overview
Professional Services
Graphic
PwC/Strategy&
Add to my slides
Remove from favorites
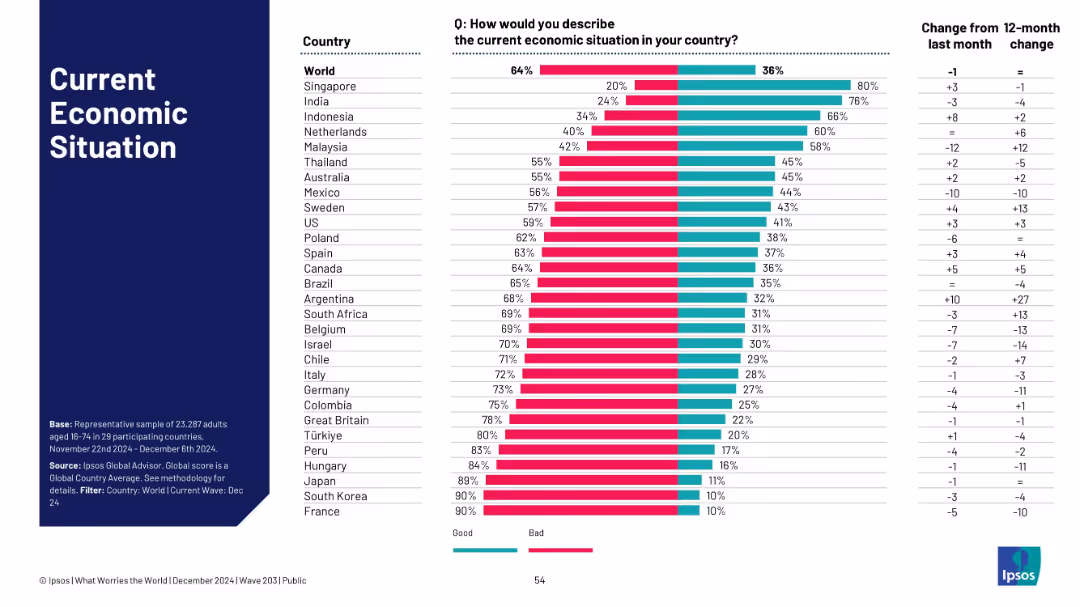
Horizontal bar chart comparing perceptions of economic situation across countries; sidebar left-aligned with bold text.
Market Analysis and Trends
Financial Services
This slide displays a global comparison of how people view their country’s economic situation (good vs. bad) with change metrics over one month and one year.
global survey, economy perception, bar chart, Ipsos, trend analysis, public opinion, global average, change metrics, economic outlook, 2024 data
false
Market Analysis and Trends
Financial Services
Single Chart
IPSOS
Add to my slides
Remove from favorites
World map, pie charts, and statistics about companies participating in SHoP assessment.
Technology and Digital Transformation
Professional Services
Presents a global survey of over 100 companies, highlighting industry participation and regional distribution.
global, survey, industry, participation, SHoP, assessment
false
Technology and Digital Transformation
Professional Services
Multiple Chart
BCG
Add to my slides
Remove from favorites
Map visualization with icons and text describing a global survey of companies across various industries and regions.
Strategic Planning
Professional Services
Discusses the methodology behind a global survey aimed at evaluating company resilience across multiple regions and industries. It details the number of participants and the framework used in the survey.
global survey, methodology, industry analysis, resilience, market research
false
Strategic Planning
Professional Services
Graphic
Accenture
Add to my slides
Remove from favorites
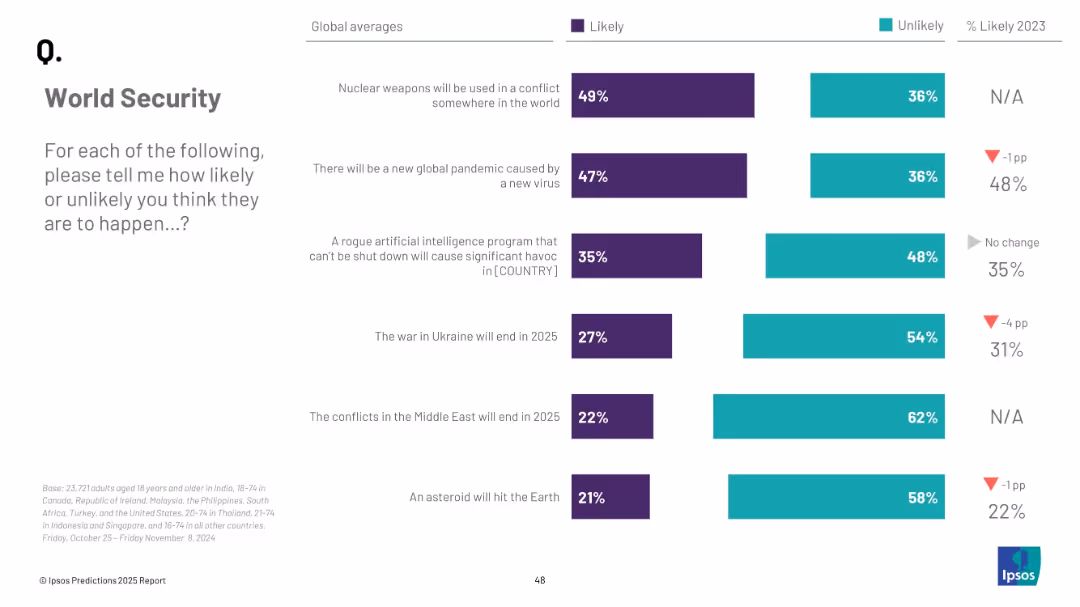
Vertical list with bar graphs; no country breakdown—only global averages; purple = “Likely”, teal = “Unlikely”; change from 2023 indicated
Risk Assessment and Management
Government & Public Sector
The slide outlines global perceptions on six security risks, including nuclear conflict and pandemics. It shows current likelihoods and their change from 2023, emphasizing concern over nuclear threats.
global threats, security, pandemic, nuclear war, AI, asteroid, Ipsos, public opinion, world risk
false
Risk Assessment and Management
Government & Public Sector
Mixed Chart
IPSOS
Add to my slides
Remove from favorites
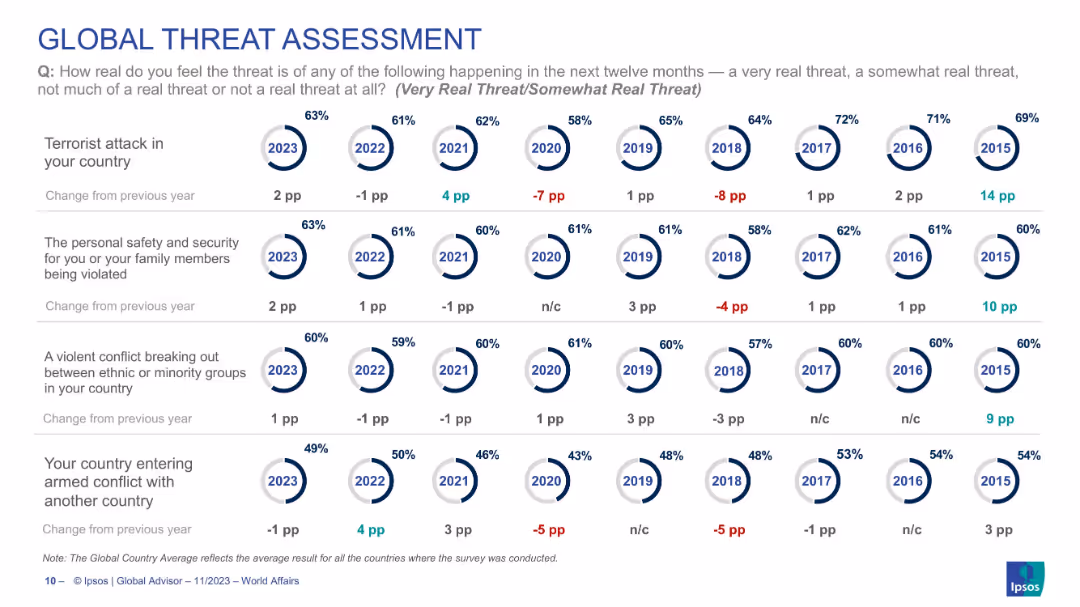
Continuation of previous slide with circular year-wise visuals across 4 more threat categories, laid out similarly.
Risk Assessment and Management
Government & Public Sector
Continues global threat analysis with four more risk types: terrorist attacks, personal safety, ethnic conflict, and armed conflict. Circular indicators and point changes show sentiment shifts over time. Data shows moderate concern levels for terrorism and rising concern for ethnic group conflicts in 2023.
global threats, terrorism, ethnic conflict, security, personal safety, armed conflict, global opinion, trend perception
false
Risk Assessment and Management
Government & Public Sector
Single Chart
IPSOS
Add to my slides
Remove from favorites
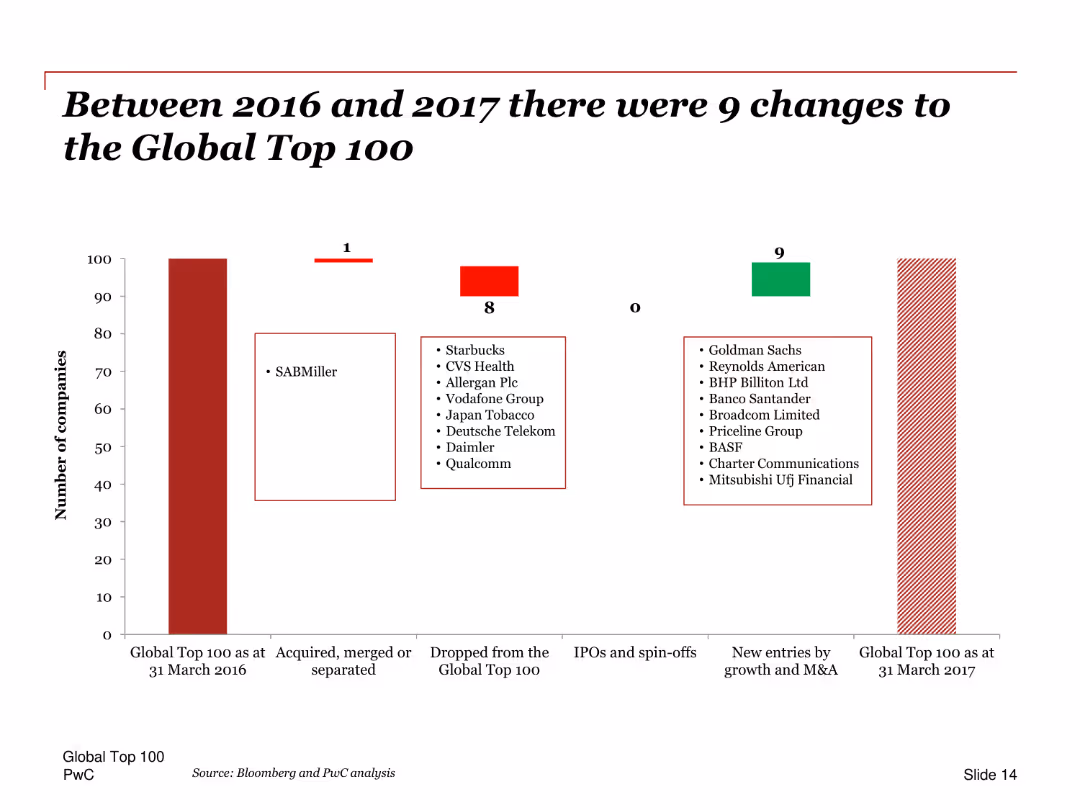
A column chart showing changes in the Global Top 100 companies between 2016 and 2017. Includes a list of companies that entered and exited the list, and those that were acquired or merged.
Competitive Landscape
Financial Services
This slide illustrates the changes in the Global Top 100 companies from 2016 to 2017, including companies that were acquired, merged, or separated, as well as new entries and exits. It provides a comprehensive overview of the dynamic shifts in the top companies.
Global Top 100, changes, 2016, 2017, acquisitions, mergers, exits, entries, column chart
false
Competitive Landscape
Financial Services
Single Chart
PwC/Strategy&
Add to my slides
Remove from favorites
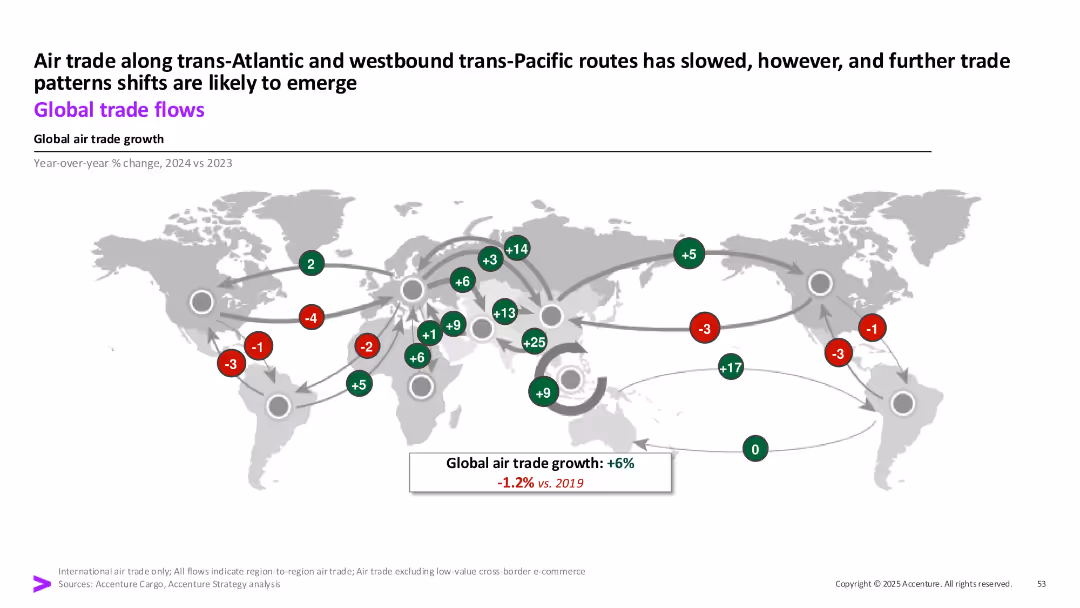
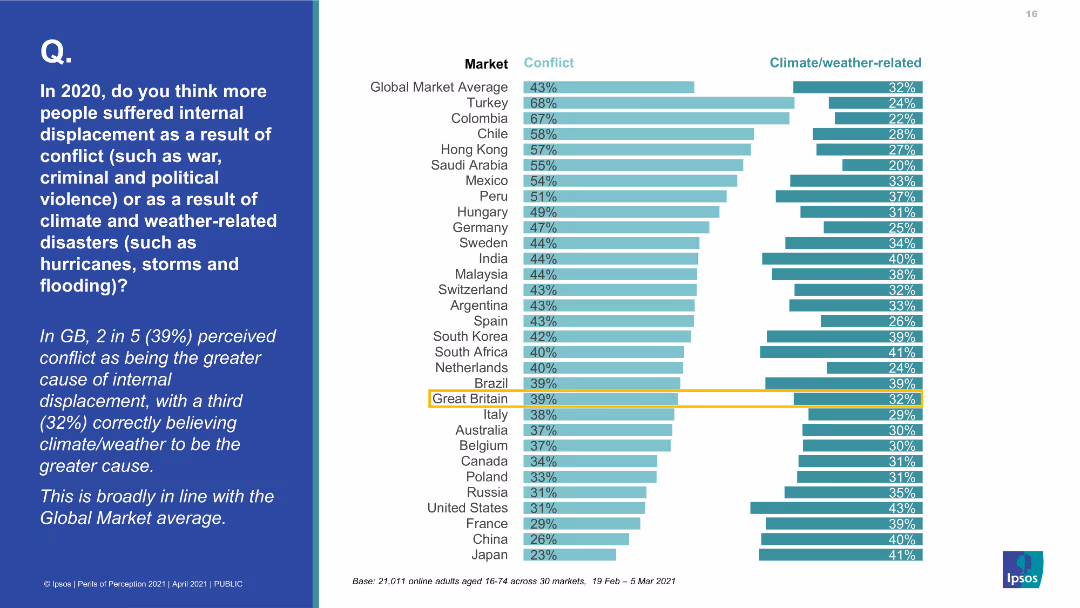
World map with directional arrows showing YoY changes in air trade routes between regions, with green/red indicators of growth or decline.
Competitive Landscape
Transportation & Logistics
This slide visualizes shifts in global air trade flows between major regions. While some routes show strong growth, others—especially trans-Atlantic and trans-Pacific—have slowed. The data highlights evolving global trade dynamics.
global trade, air cargo, trade routes, transportation, logistics, 2024, regional flows
false
Competitive Landscape
Transportation & Logistics
Uncategorized
Accenture
Add to my slides
Remove from favorites
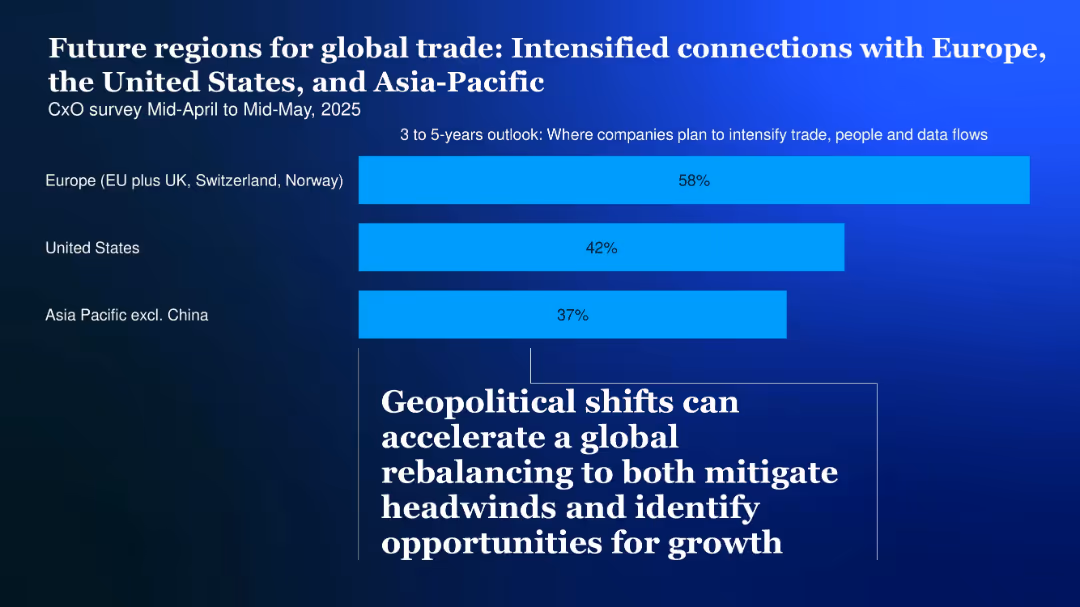
Bar chart with horizontal bars for three regions on a blue background, with supporting headline and subheadline text
Market Analysis and Trends
Transportation & Logistics
Companies plan to intensify trade, data, and personnel flows in Europe, the US, and Asia Pacific (excl. China), reflecting shifting global trade preferences.
Global trade, CxO, regions, Europe, US, Asia-Pacific, flows, 2025, intensification
false
Market Analysis and Trends
Transportation & Logistics
Single Chart
McKinsey
Add to my slides
Remove from favorites
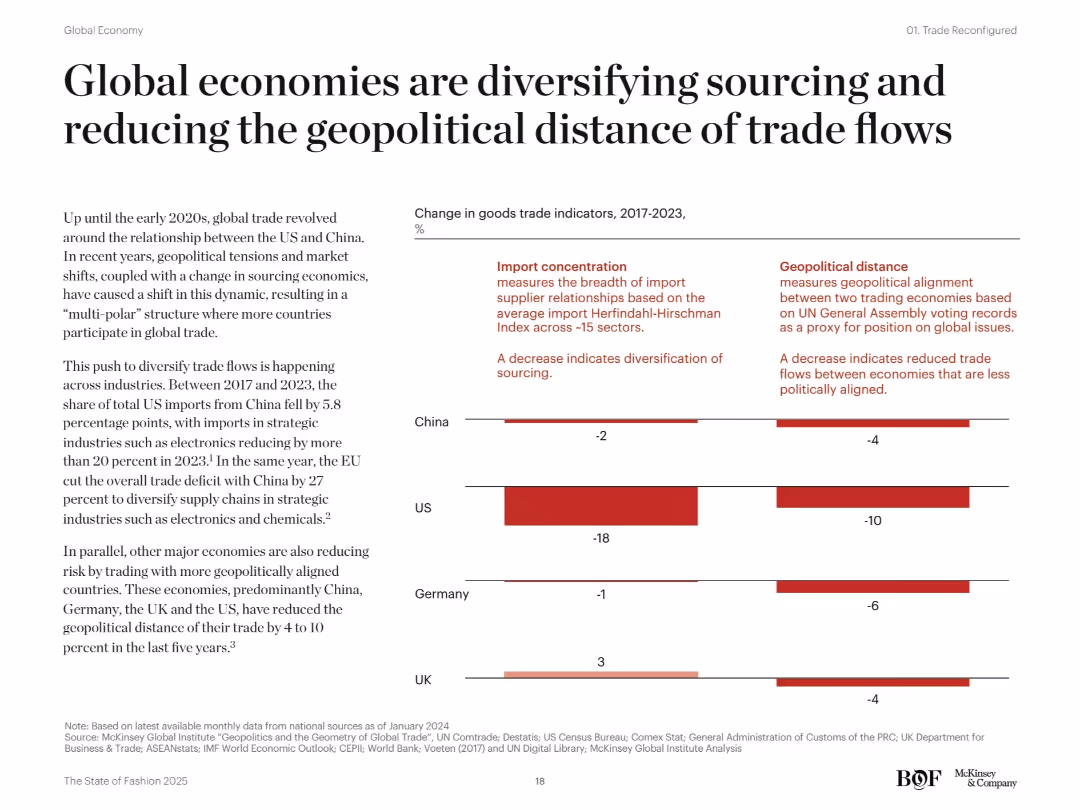
Two-column layout with left-aligned narrative text and a right-side bar chart comparing trade changes across countries (China, US, Germany, UK). Red color-coded bars and labeled metrics.
Market Analysis and Trends
Professional Services
The slide discusses the shift from US-China centric trade to a more diversified and geopolitically aligned global trade structure from 2017 to 2023. It highlights reduced import concentration and geopolitical distance in major economies, emphasizing strategic diversification in sourcing, especially for electronics and chemicals.
global trade, geopolitical distance, import concentration, China, US, EU, diversification, strategic sourcing, supply chain, trade flows
false
Market Analysis and Trends
Professional Services
Mixed Chart
McKinsey
Add to my slides
Remove from favorites
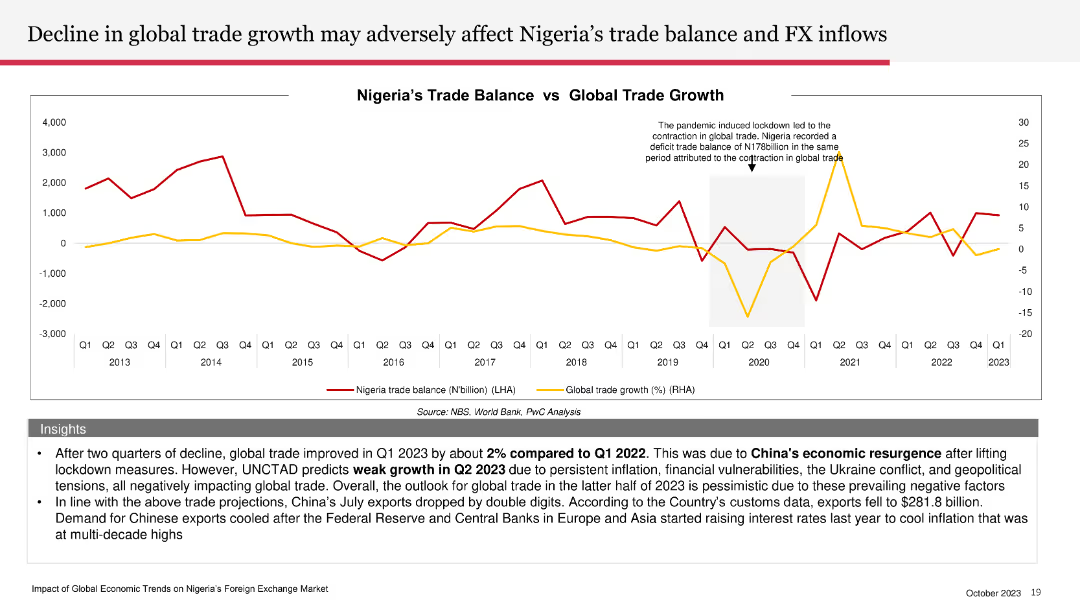
The slide includes a line chart comparing Nigeria’s trade balance with global trade growth over several years, with distinct lines for each.
Market Analysis and Trends
Financial Services
The slide discusses the potential negative impact of declining global trade growth on Nigeria’s trade balance and foreign exchange inflows.
global trade growth, trade balance, Nigeria, FX inflows, economic impact
false
Market Analysis and Trends
Financial Services
Mixed Chart
PwC/Strategy&
Add to my slides
Remove from favorites
Contains two line graphs depicting the Global Trade Volume Index and Global Industrial Production Index. These charts illustrate trends over three decades, emphasizing recent spikes and recoveries.
Market Analysis and Trends
Financial Services
Analyzes the resilience and recovery of global trade and industrial production post-2020, offering insights into the durability and response of global markets to recent economic shocks. This information is valuable for stakeholders planning long-term investments and market strategies.
global trade, industrial production, economic analysis, market resilience, recovery
false
Market Analysis and Trends
Financial Services
Multiple Chart
Deloitte
Add to my slides
Remove from favorites
A column chart illustrating exports, imports, and FDIs as a share of GDP/domestic investment for various countries. The chart uses different colors to represent exports, imports, and FDIs. Accompanied by bullet points discussing the alignment with China's digital strategy.
Strategic Planning
Technology & Software
Discusses China's influence on global trade and investment through technology standards, highlighting the impact on exports, imports, and foreign direct investments (FDIs).
Global trade, investment, technology standards, China, exports, imports, FDIs, digital strategy, McKinsey report
false
Strategic Planning
Technology & Software
Mixed Chart
EY
Add to my slides
Remove from favorites
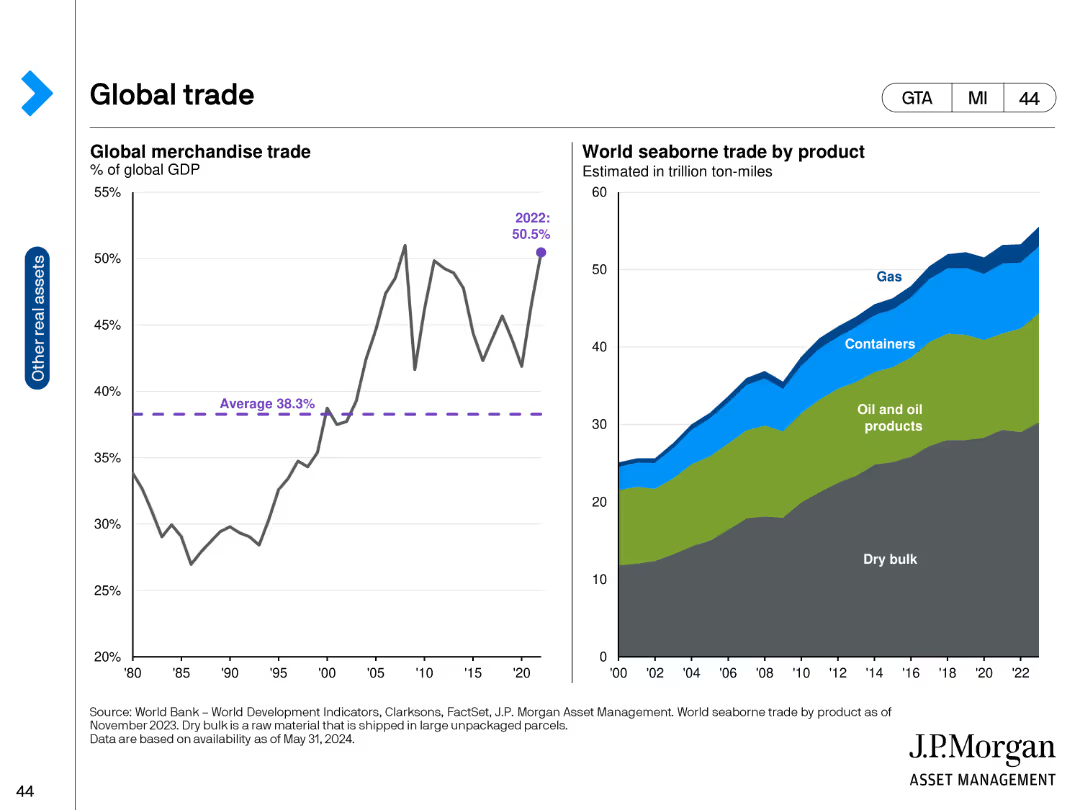
The slide features two line charts. The left chart shows the global merchandise trade as a percentage of global GDP from 1980 to 2022. The right chart presents the world seaborne trade by product from 2000 to 2022, with different product types represented by distinct colors. The line charts provide a clear visual of trade trends over time.
Market Analysis and Trends
Transportation & Logistics
This slide analyzes global trade trends, showing the percentage of global GDP accounted for by merchandise trade and the distribution of seaborne trade by product type. It is useful for understanding global trade dynamics and the relative importance of different goods in international trade.
Global trade, merchandise trade, seaborne trade, GDP, trade trends, international trade, product distribution
false
Market Analysis and Trends
Transportation & Logistics
Multiple Chart
JP Morgan
Add to my slides
Remove from favorites
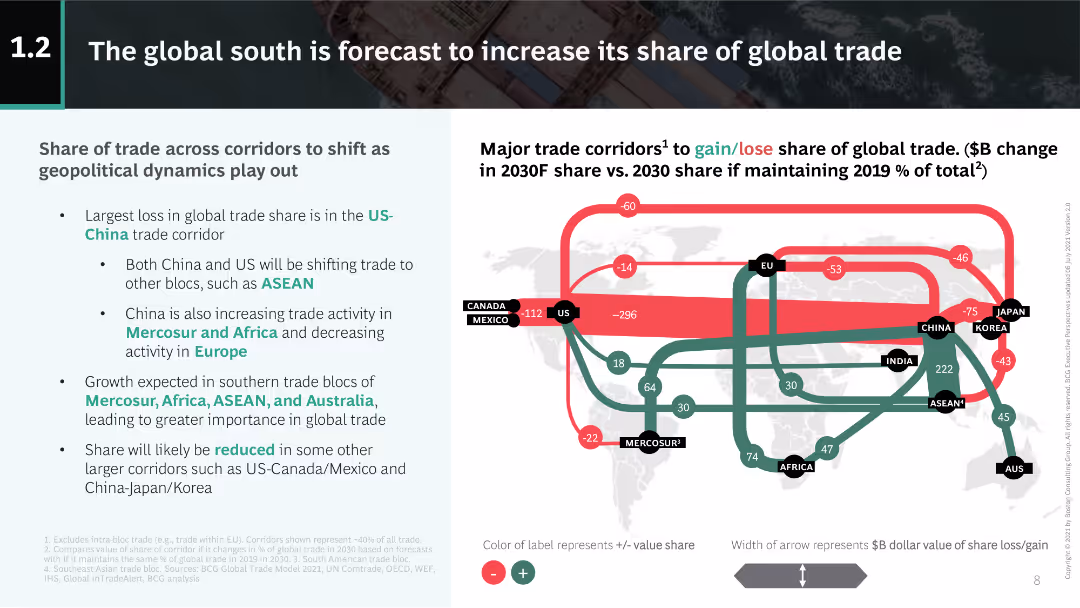
This slide features a colored flowchart illustrating trade share changes among regions. Text explanations are included on the left side of the slide, making it moderately complex.
Market Analysis and Trends
Transportation & Logistics
The slide explains shifts in global trade shares, particularly noting the losses in the US-China corridor and growth in other regions such as ASEAN and Mercosur.
global trade, share, US-China, ASEAN, Mercosur
false
Market Analysis and Trends
Transportation & Logistics
Boxed
BCG
Add to my slides
Remove from favorites
Displays a world map illustrating major global drybulk trade routes with lines and symbols representing different commodities.
Market Analysis and Trends
Transportation & Logistics
Analyzes the global trade routes for drybulk commodities, highlighting strategic locations and trade volumes which are essential for logistic and strategic planning in the shipping industry.
global trade, shipping routes, logistics, drybulk commodities
false
Market Analysis and Trends
Transportation & Logistics
Graphic
Deutsche Bank
Add to my slides
Remove from favorites
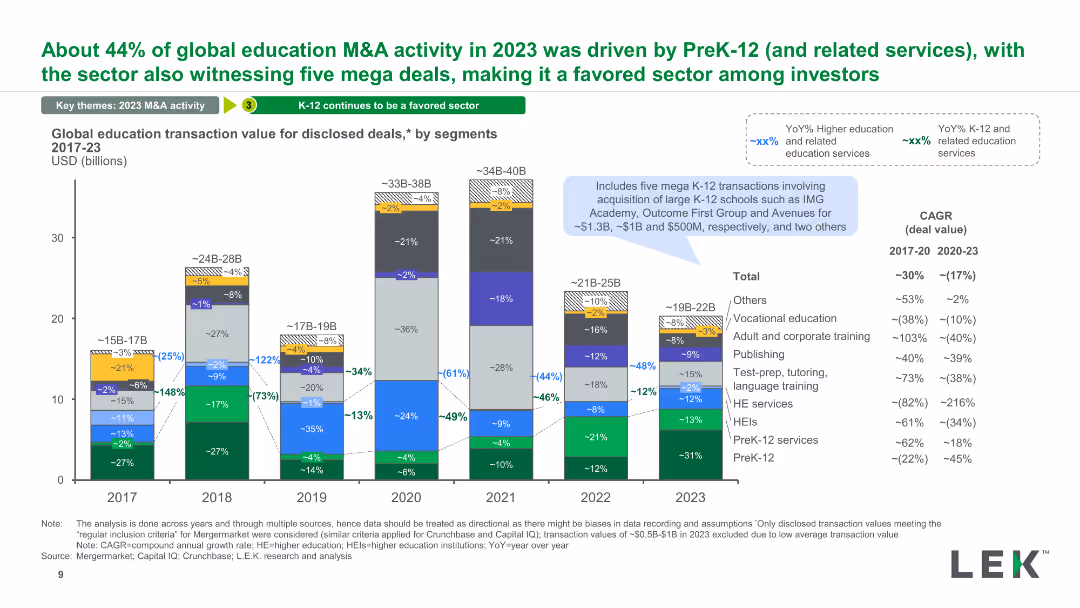
A stacked column chart illustrating the global education transaction value for disclosed deals, segmented by various educational sectors from 2017 to 2023. It uses color-coding to differentiate segments.
Market Analysis and Trends
Education & Training
The slide provides a breakdown of global education transaction values across different segments, highlighting major transactions and trends in various educational services, including K-12 and higher education.
global transaction, education segments, disclosed deals, K-12, higher education
false
Market Analysis and Trends
Education & Training
Single Chart
LEK
Add to my slides
Remove from favorites
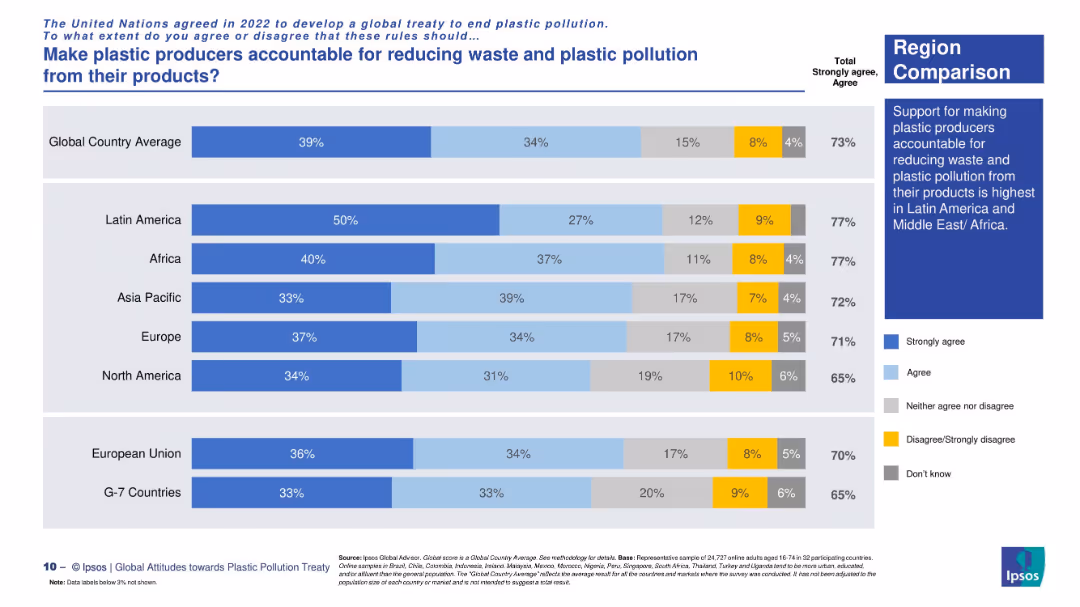
Regional horizontal stacked bar chart with consistent labeling and explanatory sidebar.
Regulatory and Compliance
Environmental Services & Sustainability
This slide aggregates regional support for producer accountability under a plastic treaty. Latin America and Africa show the highest support (77%), while North America and G7 countries lag behind.
global treaty, regional opinion, plastic regulation, corporate responsibility, Ipsos survey, accountability measures, environmental consensus
false
Regulatory and Compliance
Environmental Services & Sustainability
Mixed Chart
IPSOS
Add to my slides
Remove from favorites
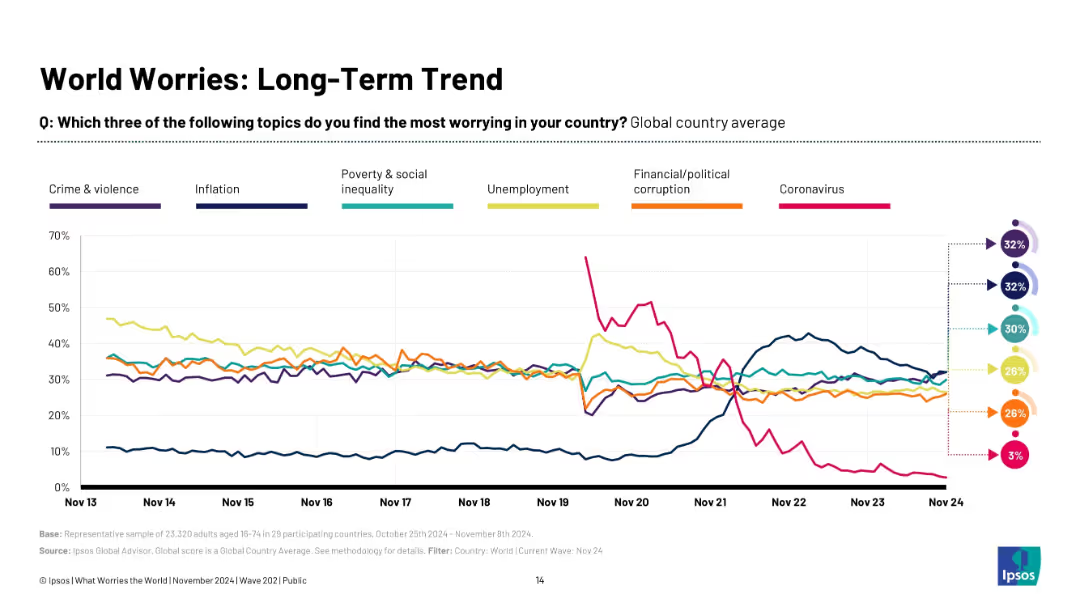
Multi-line graph with six colored trend lines tracking key global concerns over 10+ years.
Market Analysis and Trends
Professional Services
This slide visualizes long-term concern trends globally, showing the rise and fall of key issues such as crime, inflation, inequality, corruption, unemployment, and Covid-19. It captures the evolution of global anxieties and contextualizes present concerns within a longer historical frame.
global trends, concern evolution, long-term tracking, Ipsos, crime, inflation, unemployment, Covid-19
false
Market Analysis and Trends
Professional Services
Multiple Chart
IPSOS
Add to my slides
Remove from favorites
Lists pros and cons in energy, water, and food sectors with bullet points.
Strategic Planning
Environmental Services & Sustainability
Summarizes global trends and challenges in energy, water, and food.
global trends, energy, water, food, resources, challenges, opportunities
false
Strategic Planning
Environmental Services & Sustainability
Table
Roland Berger
Add to my slides
Remove from favorites
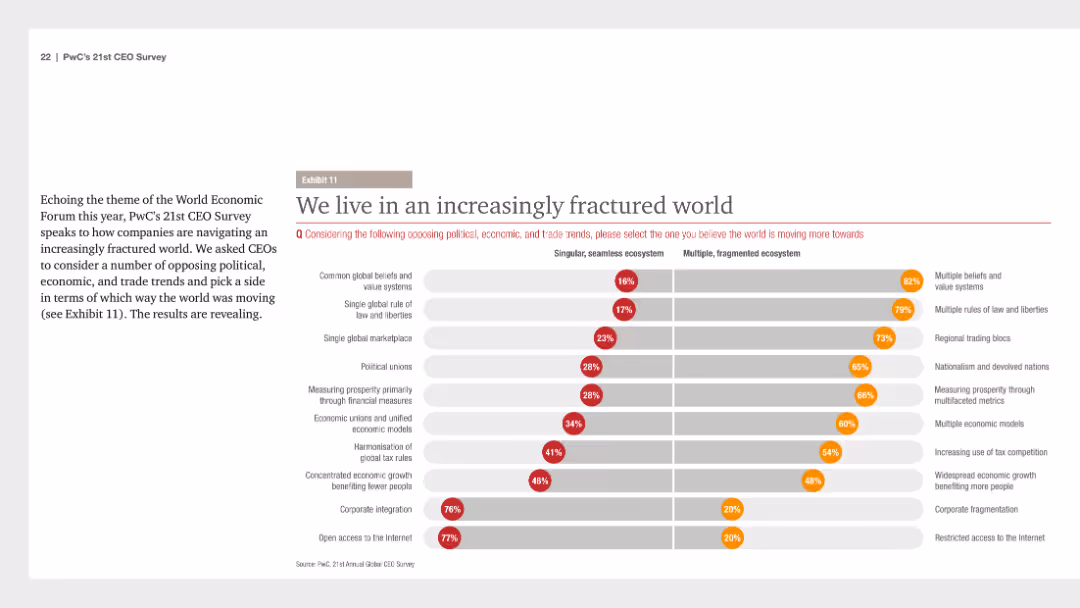
The slide uses a comparative layout to show the shift in global political, economic, and trade trends, with bar charts indicating the percentage of CEOs supporting different viewpoints.
Market Analysis and Trends
Financial Services
It outlines the increasing fragmentation in global trends, with a significant majority of CEOs perceiving the world as moving towards multiple, fragmented ecosystems rather than singular, seamless ones.
global trends, fragmentation, political, economic, trade, CEO viewpoints, PwC, CEO Survey, comparative slide, 2018
false
Market Analysis and Trends
Financial Services
Mixed Chart
PwC/Strategy&
Add to my slides
Remove from favorites
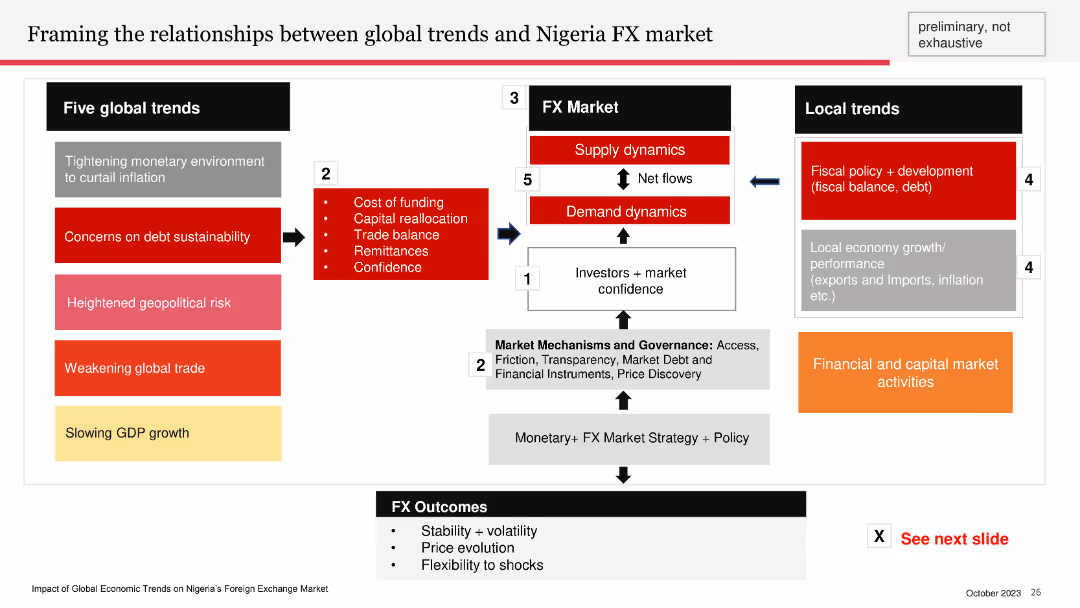
Flow diagram showing the relationships between global trends, the FX market, and local trends in Nigeria. Includes sections on global trends, FX market dynamics, and local trends.
Market Analysis and Trends
Financial Services
The slide frames the impact of global trends like inflation and geopolitical risk on Nigeria's FX market. It details the supply and demand dynamics, fiscal policy, and financial market activities influencing Nigeria's foreign exchange outcomes.
global trends, FX market, Nigeria, supply dynamics, demand dynamics
false
Market Analysis and Trends
Financial Services
Diagram
PwC/Strategy&
Add to my slides
Remove from favorites
Five vertical blocks showing different global trends related to jobs lost, recruiting, retraining, flexible models, and societal impact, with percentage data and flags.
Market Analysis and Trends
Professional Services
Analyzes various global trends in the talent market, covering job loss, recruitment, retraining, flexible working models, and societal impact of diversity and climate views.
global trends, job loss, recruitment, retraining, flexibility, societal impact, COVID-19, workforce, diversity, climate views
false
Market Analysis and Trends
Professional Services
Pillar
BCG
Add to my slides
Remove from favorites
Slide includes a line graph and column charts illustrating global print and digital news circulation from 2013 to 2018.
Market Analysis and Trends
Media & Entertainment
Discusses global trends in news consumption, focusing on the rise of digital subscriptions and the stability of print circulation.
global trends, news consumption, digital subscriptions, print circulation, rise, stability, media market, circulation data, comparison
false
Market Analysis and Trends
Media & Entertainment
Mixed Chart
Accenture
Add to my slides
Remove from favorites
Map layout with labeled regions indicating specific global uncertainties. Uses dashed lines and callout text to highlight issues in different geographic areas.
Risk Assessment and Management
Financial Services
Identifies global uncertainties affecting the financial landscape, including the war in Ukraine, recession in the Eurozone, big tech headwinds in the US, and China’s rebound.
global uncertainties, risk, financial impact, regions, analysis
false
Risk Assessment and Management
Financial Services
Graphic
IPSOS
Add to my slides
Remove from favorites
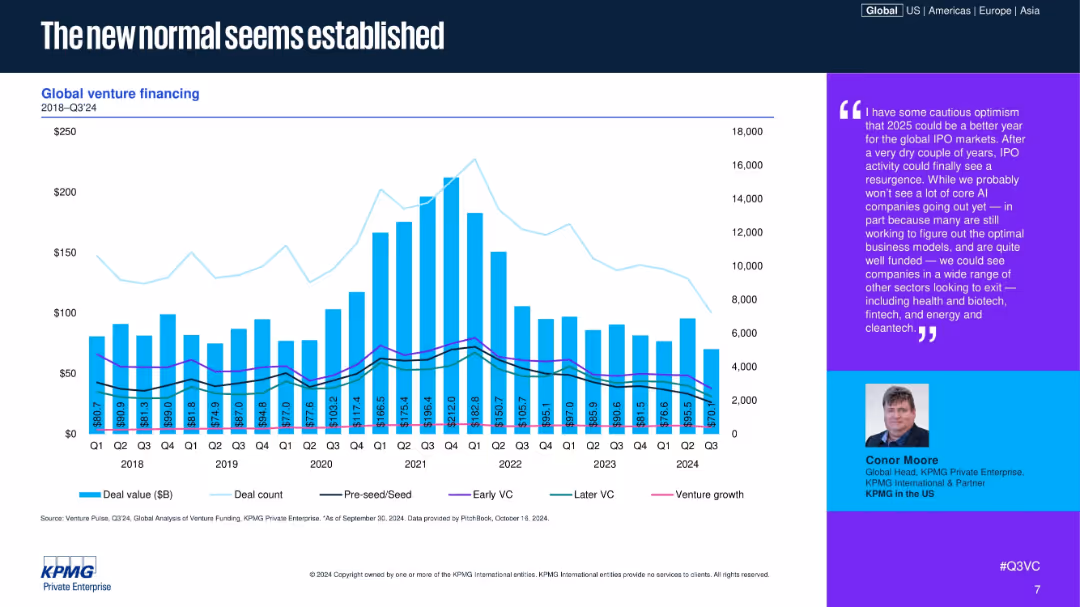
A single global bar and line chart tracking deal value, count, and deal stages in venture funding.
Market Analysis and Trends
Financial Services
The chart covers global venture funding from 2018 to Q3 2024, showing a peak around 2021 followed by normalization. The breakdown includes Pre-seed to Venture Growth, indicating stabilizing patterns in deal count and investment level.
Global, Venture, VC, Funding, Trends, Normalization, Pre-seed
false
Market Analysis and Trends
Financial Services
Mixed Chart
KPMG
Add to my slides
Remove from favorites
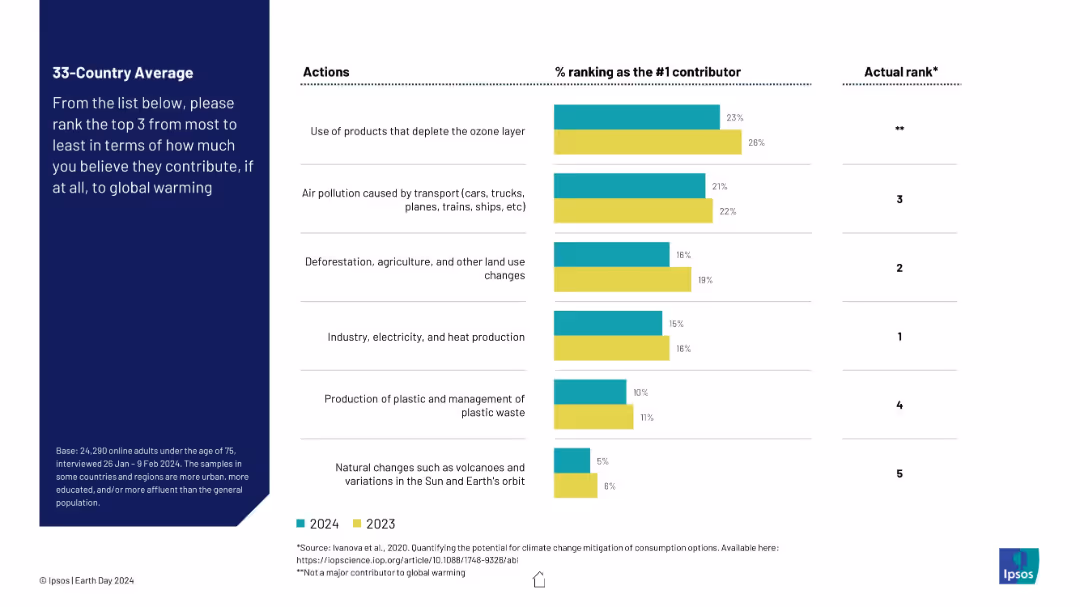
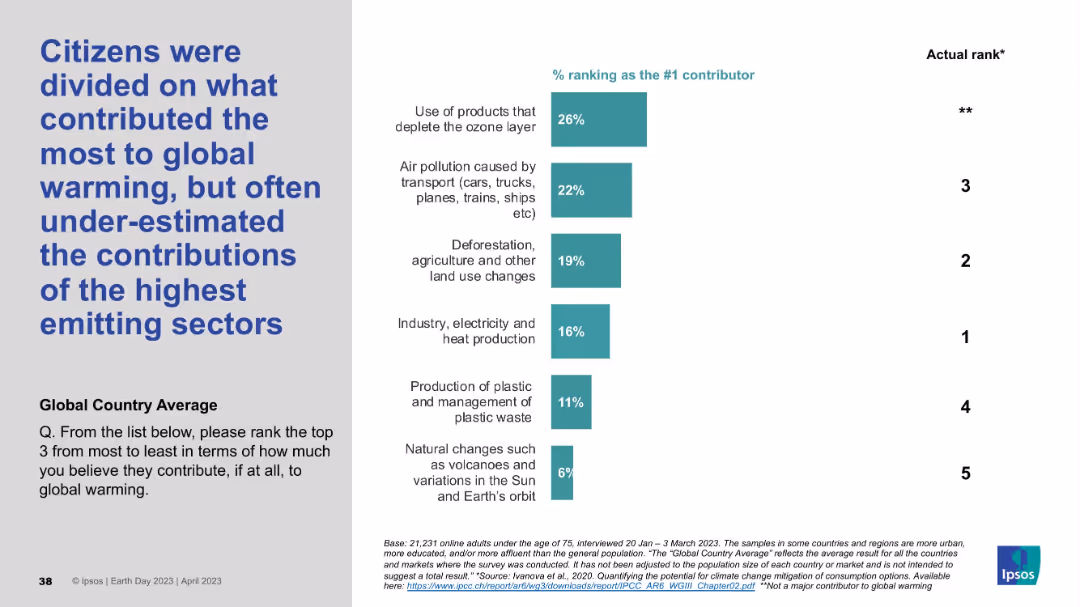
Side-by-side vertical bar chart with 2023 and 2024 data for top-ranked contributors to global warming and their actual scientific ranking. Layout includes a left sidebar with explanation text and right column with “Actual Rank.”
Market Analysis and Trends
Environmental Services & Sustainability
This slide displays discrepancies between public opinion and scientific consensus on major contributors to global warming. While the ozone layer is wrongly perceived as most harmful, industry and deforestation are more impactful but ranked lower by respondents.
global warming, climate change, public perception, air pollution, deforestation, ozone layer, emissions, science communication, misconceptions
false
Market Analysis and Trends
Environmental Services & Sustainability
Mixed Chart
IPSOS
Add to my slides
Remove from favorites
This slide has two columns with text on the left and a table on the right. The table uses shades of gray and purple to highlight different temperatures' impacts.
Market Analysis and Trends
Environmental Services & Sustainability
Discusses the key consequences of +1.5°C and +2.0°C global warming by 2100 on various factors such as sea level rise, biodiversity losses, and coral reef decline.
Global warming, ecosystems, biodiversity, sea level, temperature
false
Market Analysis and Trends
Environmental Services & Sustainability
Table
Kearney
Add to my slides
Remove from favorites
The slide contains a line chart showing global temperature anomalies against pre-industrial levels and a bar chart depicting the global energy mix by country for 2022.
Market Analysis and Trends
Environmental Services & Sustainability
It provides insights into the impact of global warming by displaying temperature anomalies and the energy consumption mix of different countries, related to climate policy targets.
global warming, energy consumption, temperature anomalies, climate change, energy mix, sustainability, country comparison, J.P. Morgan, environmental impact, energy policy
false
Market Analysis and Trends
Environmental Services & Sustainability
Multiple Chart
JP Morgan
Add to my slides
Remove from favorites
The slide contains a column chart showing the global temperature anomaly from 1900 to 2023 on the left, and a pie chart on the right depicting global greenhouse gas emissions by source in 2019. The column chart has vertical bars representing temperature changes, while the pie chart is color-coded to show different emission sources. Overall layout is balanced with equal emphasis on both charts.
Market Analysis and Trends
Environmental Services & Sustainability
This slide analyzes the historical global temperature anomaly and the distribution of global greenhouse gas emissions by various sources in 2019. It is intended to illustrate the impact of different sectors on climate change and highlight the increasing trend in global temperatures over the years.
Global warming, greenhouse gases, temperature anomaly, emissions, climate change, data visualization, environmental impact
false
Market Analysis and Trends
Environmental Services & Sustainability
Multiple Chart
JP Morgan
Add to my slides
Remove from favorites
Left-aligned title with vertical bar chart on the right showing perceived top contributors to global warming versus actual ranks.
Market Analysis and Trends
Environmental Services & Sustainability
This slide highlights public misconceptions about the main contributors to global warming. The most frequently chosen contributors (e.g., ozone-depleting products) differ from the actual top emitters like industry and electricity. Perception vs. reality is emphasized.
global warming, perception gap, emissions, climate change, public opinion, misconceptions, top contributors, Ipsos, sustainability
false
Market Analysis and Trends
Environmental Services & Sustainability
Mixed Chart
IPSOS
Add to my slides
Remove from favorites
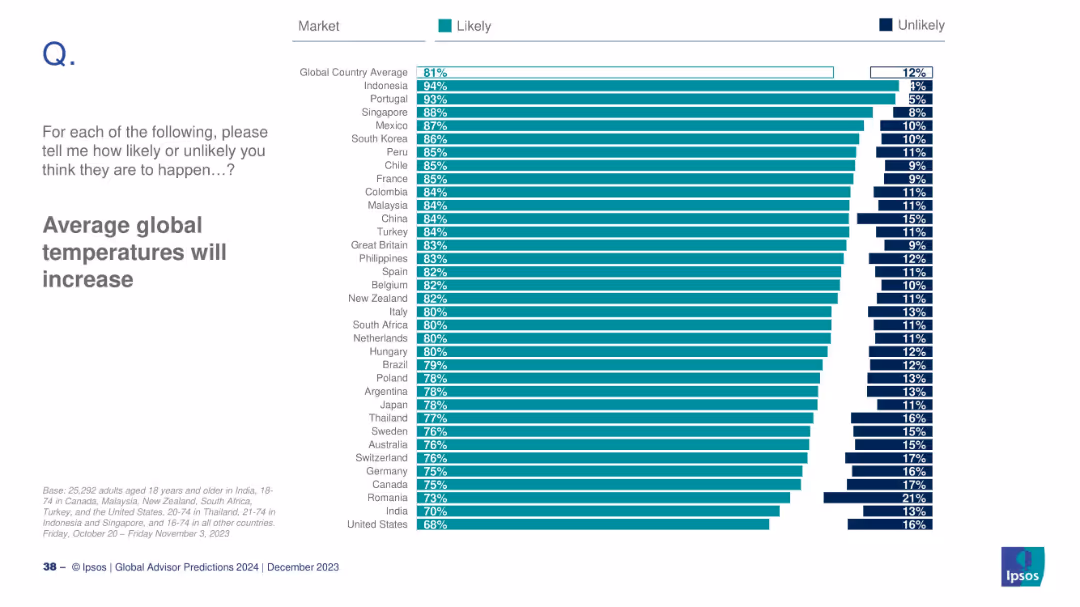
Bar chart by country showing how likely respondents believe in global temperature rise.
Market Analysis and Trends
Environmental Services & Sustainability
This slide ranks countries by belief in rising global temperatures. Indonesia, Portugal, and Singapore lead with the strongest concerns. Overall, 81% globally expect temperature increases, showing strong consensus across markets.
global warming, temperature, climate perception, Ipsos, environmental concern, 2024
false
Market Analysis and Trends
Environmental Services & Sustainability
Mixed Chart
IPSOS
Add to my slides
Remove from favorites
A bar chart for Great Britain, showing the average response to the number of warmest years since 2015, with a significant portion unsure. Accompanying text provides the actual data.
Market Analysis and Trends
Environmental Services & Sustainability
This slide shows how the public in Great Britain significantly underestimates the number of warmest years since 2015, with a majority being unsure or incorrect, compared to the actual data provided by the World Meteorological Organization.
global warming, temperature records, public awareness, Great Britain, World Meteorological Organization, survey response, actual data
false
Market Analysis and Trends
Environmental Services & Sustainability
Mixed Chart
IPSOS
Add to my slides
Remove from favorites
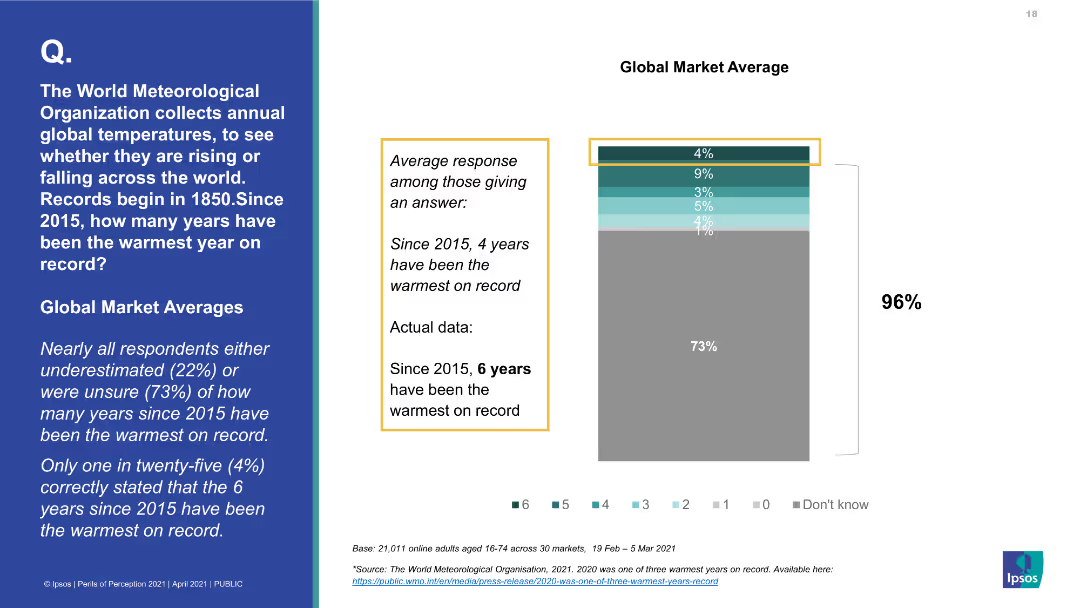
A bar chart showing the global market average response to the number of warmest years since 2015, with a significant majority being unsure. Accompanying text provides the actual data.
Market Analysis and Trends
Environmental Services & Sustainability
The slide reveals the widespread lack of awareness regarding the number of warmest years since 2015, contrasting survey responses with the actual data, highlighting a significant underestimation by the public.
global warming, temperature records, public awareness, World Meteorological Organization, survey response, actual data
false
Market Analysis and Trends
Environmental Services & Sustainability
Multiple Chart
IPSOS
Add to my slides
Remove from favorites
Line chart displaying the rise in global temperatures over time, with annotations for significant years.
Risk Assessment and Management
Environmental Services & Sustainability
Examines the progression of global warming, providing critical data for environmental risk management and policy development.
global warming, temperature rise, climate data, environmental risk, policy development
false
Risk Assessment and Management
Environmental Services & Sustainability
Single Chart
BCG
Add to my slides
Remove from favorites
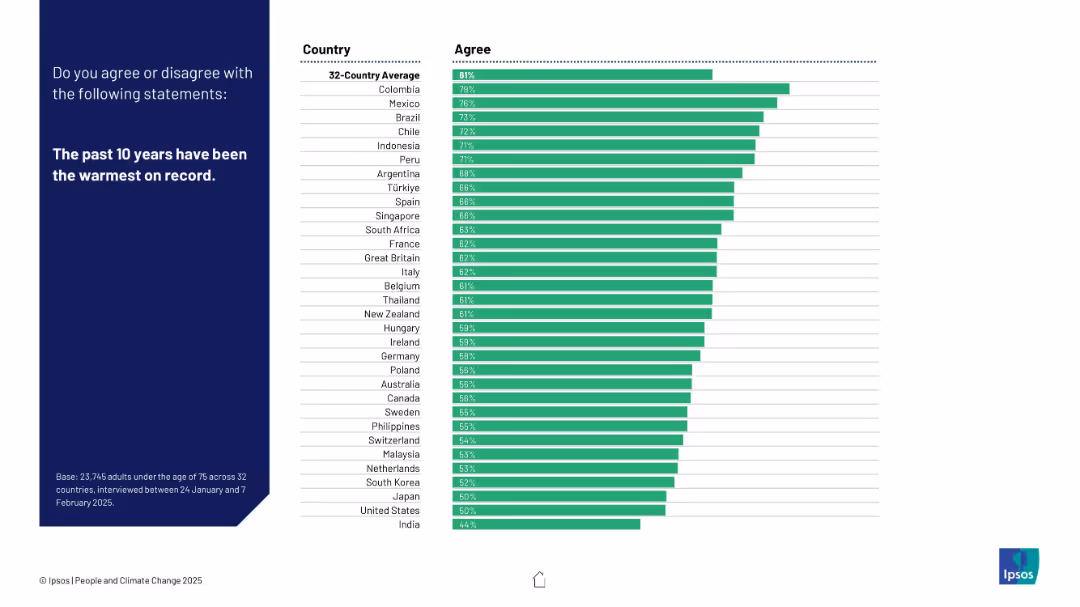
Green-colored bar chart ranked by agreement; includes 32 countries; consistent layout style; clean visual format.
Market Analysis and Trends
Environmental Services & Sustainability
Gauges public acknowledgment of recent climate warming. Colombia, Mexico, and Brazil lead in agreement. The slide supports awareness levels of global warming facts across different populations.
global warming, temperature trends, public awareness, Ipsos, climate evidence, warming recognition
false
Market Analysis and Trends
Environmental Services & Sustainability
Mixed Chart
IPSOS
Add to my slides
Remove from favorites
Column charts and tables showing profit before tax and other financial metrics by region for Global Wealth Management.
Financial Performance
Financial Services
Reviews the regional performance of Global Wealth Management for Q3 2022, focusing on profit and cost metrics.
Global Wealth Management, regions, financial performance, UBS, 3Q22, profit, cost/income ratio, invested assets
false
Financial Performance
Financial Services
Multiple Chart
UBS
Add to my slides
Remove from favorites
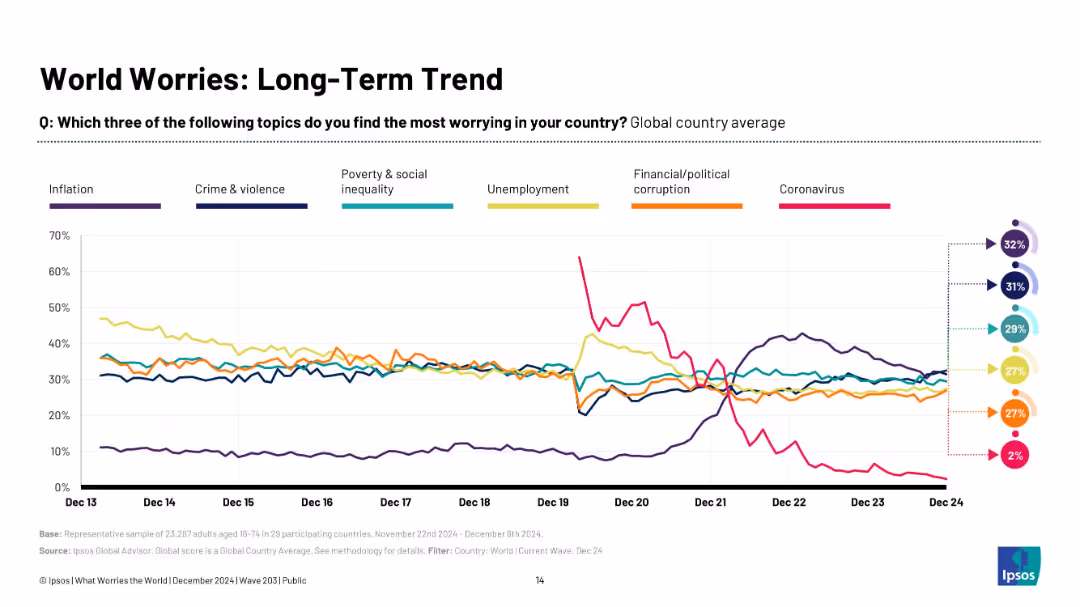
Line graph with colored trend lines tracking the percentage of global concern for various issues from Dec 2013 to Dec 2024, with a legend and summary percentages.
Market Analysis and Trends
Government & Public Sector
This slide presents long-term trends in global public concerns such as inflation, crime, poverty, unemployment, corruption, and coronavirus. It shows that inflation and crime now top the list, while concern about COVID-19 has plummeted.
global worries, trends, inflation, crime, poverty, unemployment, Ipsos, COVID-19, public opinion
false
Market Analysis and Trends
Government & Public Sector
Multiple Chart
IPSOS
Add to my slides
Remove from favorites
The slide features text, survey results in bar charts, and an image depicting the integration of local and global communication strategies.
Strategic Planning
Professional Services
Explores the balance between global messaging and local execution, emphasizing the importance of local commitment and the autonomy of communication teams.
Glocal strategy, local communication, global strategy, survey results, balance
false
Strategic Planning
Professional Services
Multiple Chart
IPSOS
Add to my slides
Remove from favorites
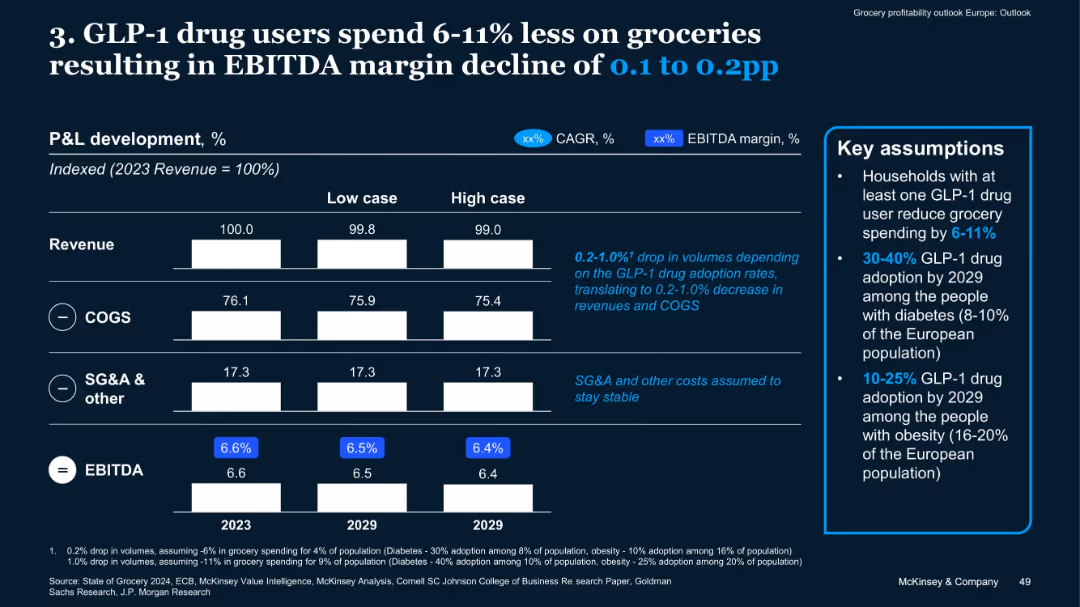
Revenue/EBITDA breakdown for 2023 vs 2029 (low/high case); supporting assumptions in sidebar
Market Analysis and Trends
Healthcare & Pharmaceuticals
GLP-1 drug adoption may reduce grocery spending by 6–11%, causing a 0.1 to 0.2pp EBITDA decline. It includes assumptions about drug adoption rates among diabetic and obese populations, and stable SG&A costs.
GLP-1, Drug Adoption, Grocery Spending, Diabetes, Obesity, Consumer Health
false
Market Analysis and Trends
Healthcare & Pharmaceuticals
Mixed Chart
McKinsey
Add to my slides
Remove from favorites
The slide is divided into three sections with headers 'Strategy alignment', 'Personal development', and 'Shared purpose'. Each section has its own icon and a brief explanatory text.
Strategic Planning
Professional Services
The slide details a 3-pronged approach to goal setting within an organization, including the alignment of strategy, personal development, and a shared purpose. It is likely used in the context of human resources and organizational strategy sessions.
Goal Setting, Strategy, Personal Development, Organizational
false
Strategic Planning
Professional Services
Diagram
Kearney
Add to my slides
Remove from favorites
Slide shows a timeline from pre-kickoff planning to becoming a public company post-IPO. Uses icons and a linear path with timeline checkpoints.
Strategic Planning
Financial Services
Provides a timeline of the various stages involved in a company going public, including the key activities at each stage.
going public, IPO, timeline, process overview, strategic planning, public company
false
Strategic Planning
Financial Services
Linear Flow
PwC/Strategy&
Add to my slides
Remove from favorites
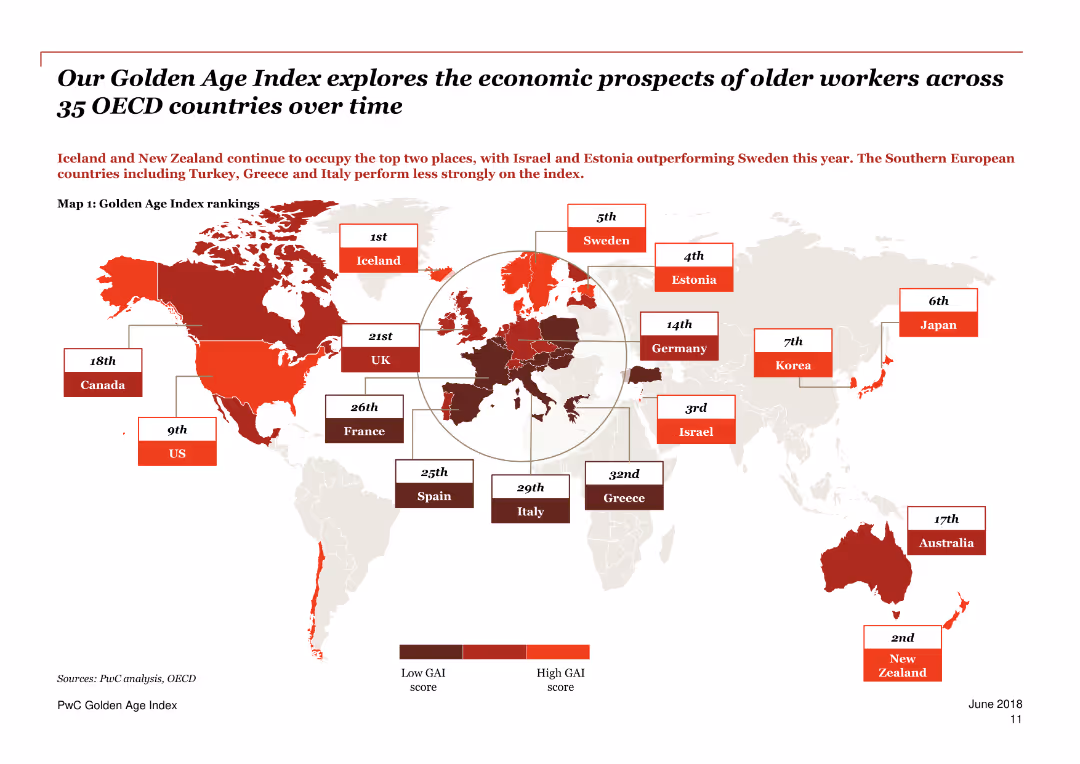
A world map highlighting countries in various shades of red indicating their Golden Age Index rankings.
Market Analysis and Trends
Government & Public Sector
The slide explores the economic prospects of older workers across 35 OECD countries over time, with Iceland and New Zealand leading the rankings.
Golden Age Index, older workers, OECD, economic prospects, rankings, countries, map, trends, employment, analysis
false
Market Analysis and Trends
Government & Public Sector
Graphic
PwC/Strategy&
Add to my slides
Remove from favorites
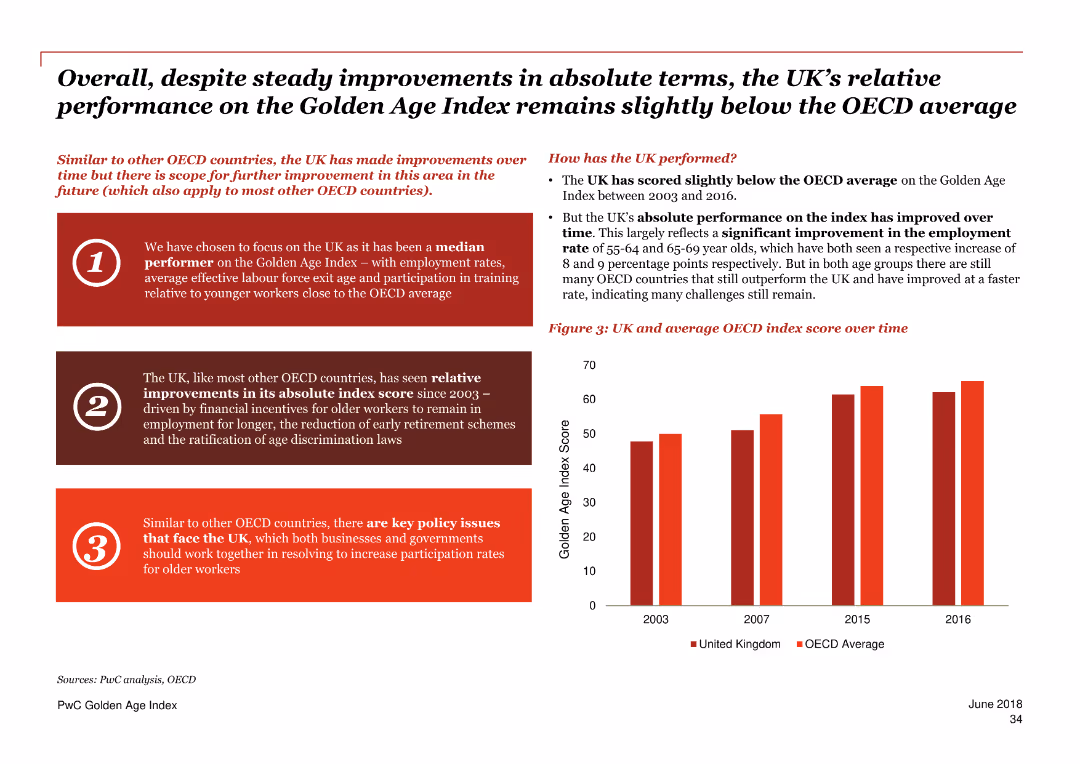
This slide includes a column chart comparing the UK’s Golden Age Index score over time to the OECD average. Text sections highlight the UK’s relative performance and key policy issues.
Performance Metrics and KPIs
Government & Public Sector
The slide reviews the UK’s performance on the Golden Age Index, showing steady improvements but remaining below the OECD average. It discusses factors driving these trends and key policy issues to enhance participation rates for older workers.
Golden Age Index, UK performance, OECD, employment, older workers, policy issues, index score, trends
false
Performance Metrics and KPIs
Government & Public Sector
Mixed Chart
PwC/Strategy&
Add to my slides
Remove from favorites
A diamond-shaped quadrant with four segments shows Goldman Sachs services, juxtaposed with Orsted’s services on the right.
Organizational Structure and Change
Financial Services
Describes Goldman Sachs' comprehensive service structure and how it supports a local client with global capabilities through different services.
Goldman Sachs, Global Markets, Asset Management, Investment Banking, Client Services, Orsted, Financing, Advising
false
Organizational Structure and Change
Financial Services
Header Vertical
Goldman Sachs
Add to my slides
Remove from favorites
Lists three strategic focal points: Growing businesses, diversifying services, and increasing efficiency, each with sub-points.
Strategic Planning
Financial Services
Presents a coherent global strategy for Goldman Sachs, focusing on business growth, product diversification, and operational efficiency.
Goldman Sachs, Global Strategy, Business Growth, Product Diversification, Operational Efficiency, Digital Investment
false
Strategic Planning
Financial Services
Header Horizontal
Goldman Sachs
Add to my slides
Remove from favorites
A table with rows for different financial services and columns showing rankings in EMEA, Asia Pacific, and Latin America.
Market Analysis and Trends
Financial Services
Highlights Goldman Sachs' rankings across various financial services sectors globally, emphasizing its leading market position.
Goldman Sachs, Investment Banking, Global Markets, EMEA, Asia Pacific, Latin America, Market Position
false
Market Analysis and Trends
Financial Services
Table
Goldman Sachs
Add to my slides
Remove from favorites
The slide features a circular arrow diagram with three sections around a central rectangle labeled 'Goldman Sachs'. The sections are titled 'Culture of Risk Management', 'Process and Structural Oversight', and 'Continuous Improvement'.
Risk Assessment and Management
Financial Services
This slide presents the risk management strategy at Goldman Sachs, focusing on the continuous cycle of culture, process oversight, and improvement. It's suitable for discussions on corporate risk policies and institutional culture of risk.
Goldman Sachs, Risk Management, Culture, Process Oversight, Continuous Improvement
false
Risk Assessment and Management
Financial Services
Linear Flow
Goldman Sachs
Add to my slides
Remove from favorites
The slide has three blue rectangular boxes with financial target metrics like ROE/ROTE, Efficiency Ratio, and CET1 Ratio, featuring percentage values.
Financial Performance
Financial Services
This slide presents Goldman Sachs' financial targets, highlighting ROE/ROTE, Efficiency Ratio, and CET1 Ratio as measures of their commitment to generating returns.
Goldman Sachs, ROE, ROTE, Efficiency, CET1 Ratio, Financial Targets, Value Driving, Business Growth
false
Financial Performance
Financial Services
Table
Goldman Sachs
Add to my slides
Remove from favorites
This slide features a hybrid internal-external framework with icons and a sequence of diamond shapes indicating services.
Operational Efficiency
Financial Services
The slide showcases Goldman Sachs' services spanning risk, analytics, payments, data, custody, clearing, and advice.
Goldman Sachs, services, internal-external, platform, finance
false
Operational Efficiency
Financial Services
Diagram
Goldman Sachs
Add to my slides
Remove from favorites
This slide includes a dual chart layout with a line chart on the left comparing gold and real rates, and a line chart on the right showing the change in central bank gold holdings by region.
Investment Analysis
Financial Services
The slide analyzes the relationship between gold prices and real interest rates, and tracks the accumulation of gold by central banks over time.
gold prices, real rates, central banks, investment, financial trends
false
Investment Analysis
Financial Services
Multiple Chart
JP Morgan
Add to my slides
Remove from favorites
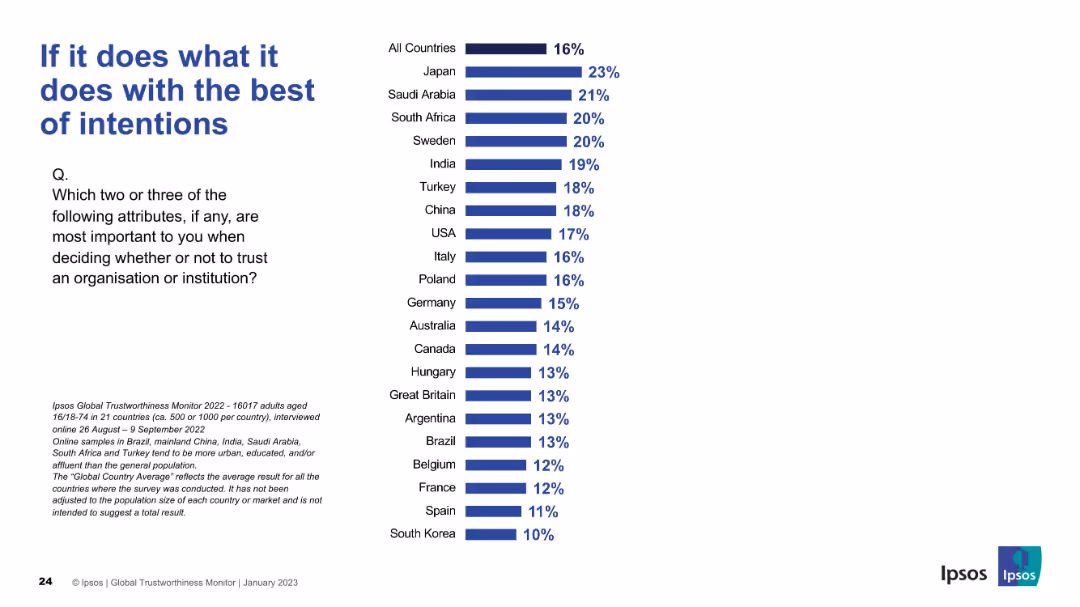
Similar layout to previous slides with vertical country ranking bar chart. Clear, clean visual emphasis.
Market Analysis and Trends
Professional Services
Analyzes the role of good intentions in earning trust. Japan leads with 23%, while South Korea and several European countries rank lower.
good intentions, ethics, international comparison, trust indicator, Ipsos, rankings
false
Market Analysis and Trends
Professional Services
Mixed Chart
IPSOS
Add to my slides
Remove from favorites
Two sets of column charts detailing negative goodwill and purchase price adjustments, including PPA adjustments.
Mergers and Acquisitions
Financial Services
Explains the negative goodwill and purchase price allocation adjustments for the acquisition of Credit Suisse, including financial impacts and fair value adjustments.
goodwill, purchase price, PPA, adjustments, Credit Suisse
false
Mergers and Acquisitions
Financial Services
Multiple Chart
UBS
Add to my slides
Remove from favorites
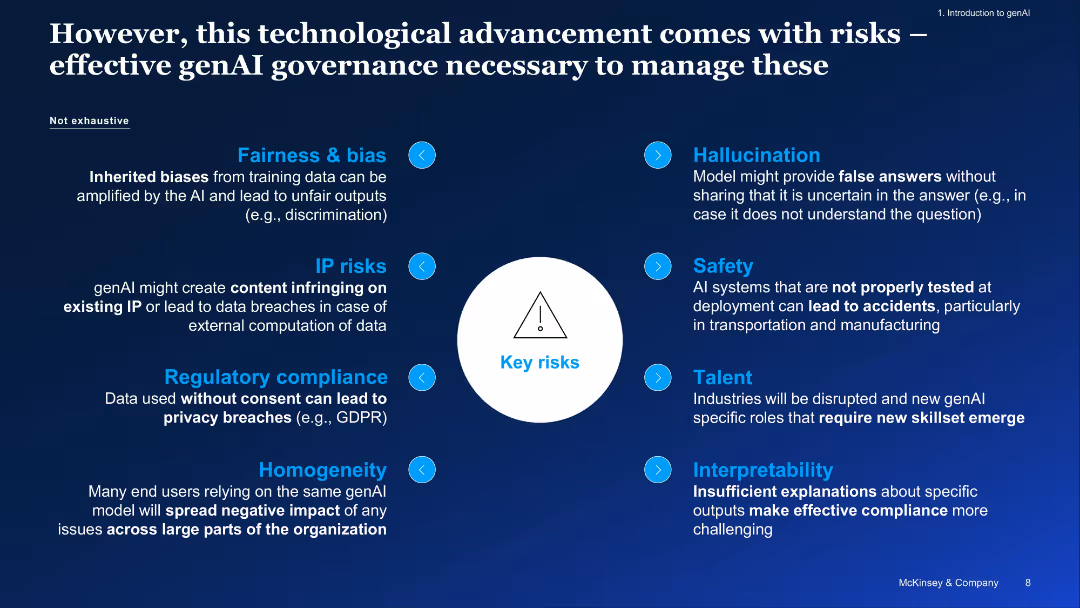
Dark blue slide with a central risk icon and radial layout of risk categories, labeled left and right
Risk Assessment and Management
Artificial Intelligence
This slide highlights key risks associated with generative AI adoption, including fairness, hallucinations, IP concerns, regulatory compliance, safety, and talent challenges. It underscores the importance of establishing governance to manage these risks effectively.
governance, AI risk, compliance, fairness, hallucination, safety, bias, talent, IP risk
false
Risk Assessment and Management
Artificial Intelligence
Diagram
McKinsey
Add to my slides
Remove from favorites
Includes pie charts and lists detailing the structure, experience, and tenure of the Barclays PLC Board.
Organizational Structure and Change
Financial Services
Provides detailed information on the governance structure of Barclays, including board composition and member experience.
governance, board, structure, experience, tenure, financial services, compliance, leadership
false
Organizational Structure and Change
Financial Services
Multiple Chart
Barclays
Add to my slides
Remove from favorites
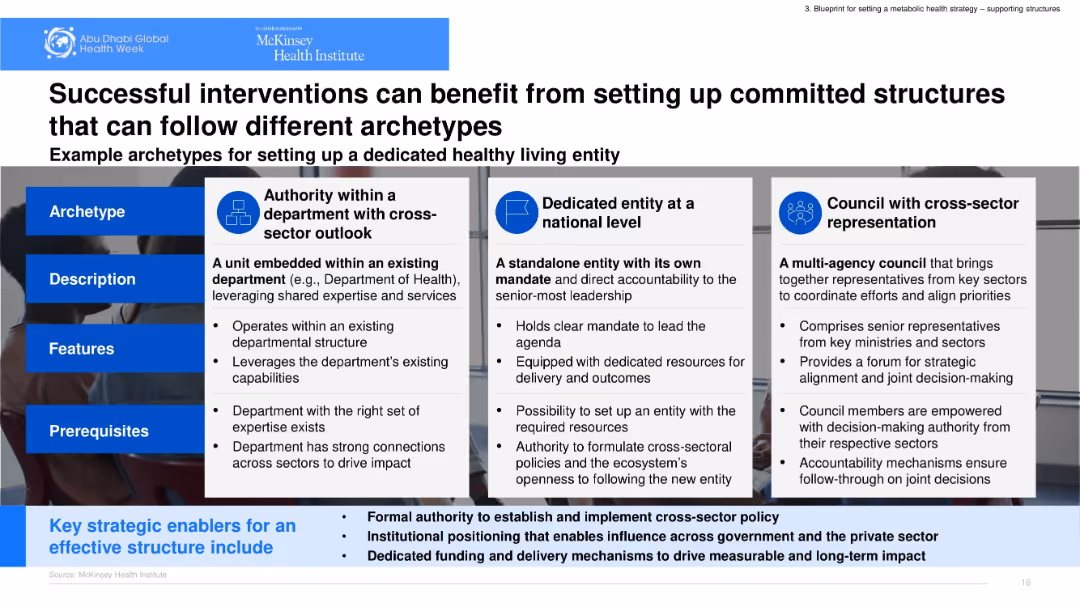
Matrix layout with three archetype models shown in adjacent columns. Each column includes description, features, and prerequisites. Icons and bold headers support structure.
Organizational Structure and Change
Government & Public Sector
Outlines three governance archetypes to support healthy living: departmental authority, national entity, and cross-sector council. It emphasizes structural roles, prerequisites, and institutional mandates to ensure effective implementation and accountability.
governance, cross-sector, archetypes, department, council
false
Organizational Structure and Change
Government & Public Sector
Table
McKinsey
Add to my slides
Remove from favorites
Previous
Next
You don't have any favorites yet.
Please wait loading your favorites slides...
Create a FREE account to continue browsing
Receive Instant Access to 1,000+ slides from companies like McKinsey, Google, and Goldman Sachs
First Name
Last Name
Email
Password
I agree to all
Terms & Privacy Policy
Thank you! Your submission has been received!
Oops! Something went wrong while submitting the form.
Have an account?
Sign in
Upgrade to PRO to Save slides
Advanced Search and Filters
Access to 15,000+ slides
Access to Category Pages
Save/Bookmark Slides
PowerPoint Template Library
Pick a Plan
MONTHLY
$12/month
Billed every month, Cancel anytime.
YEARLY
$9/year
Billed $108 annually, Cancel anytime.
Checkout for $12/month
Checkout for $108/yr
Secured by Stripe | AES-256 bit encryption