My Account
My Slides
Search by Category
Companies
Slide Type
Use Case
Industry
Pricing
Templates
View All Templates
Download Template Slides
✦ AI
AI Prompt Library
AI Search
Feedback
Login
Logout
Get Started
Browse all Slides
Browse all Slides
Create a FREE Account
Instant access to 1,000+ real slides from top companies like McKinsey, BCG, Goldman Sachs, Google and many more!
First Name
Last Name
Email
Password
I agree to all
Terms & Privacy Policy
Thank you! Your submission has been received!
Oops! Something went wrong while submitting the form.
Have an account?
Sign in
Saved Slides
Total No. of slides saved
0
↻ Refresh
✖ Clear all
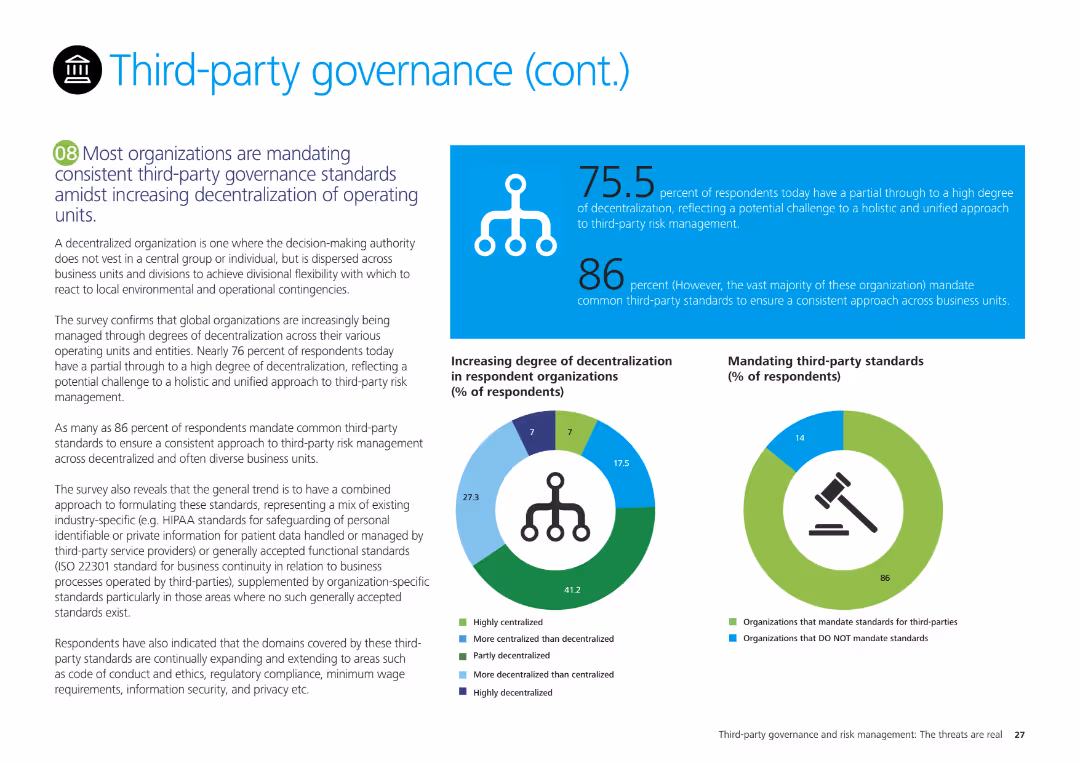
Text content with small charts showing the degree of decentralization and mandating third-party standards. Moderate visual density with explanatory text boxes.
Regulatory and Compliance
Professional Services
The slide explains third-party governance standards amidst decentralization, highlighting survey results on decentralization degrees and mandating third-party standards.
governance, decentralization, standards, third-party, survey
false
Regulatory and Compliance
Professional Services
Multiple Chart
Deloitte
Add to my slides
Remove from favorites
Contains a matrix layout showing data on board composition regarding gender, alongside another section on independent chairmen percentages.
Organizational Structure and Change
Professional Services
Discusses corporate governance trends, particularly in diversity and independent leadership roles within companies. Useful for governance workshops and board training sessions.
governance, diversity, leadership, boards
false
Organizational Structure and Change
Professional Services
Mixed Chart
PwC/Strategy&
Add to my slides
Remove from favorites
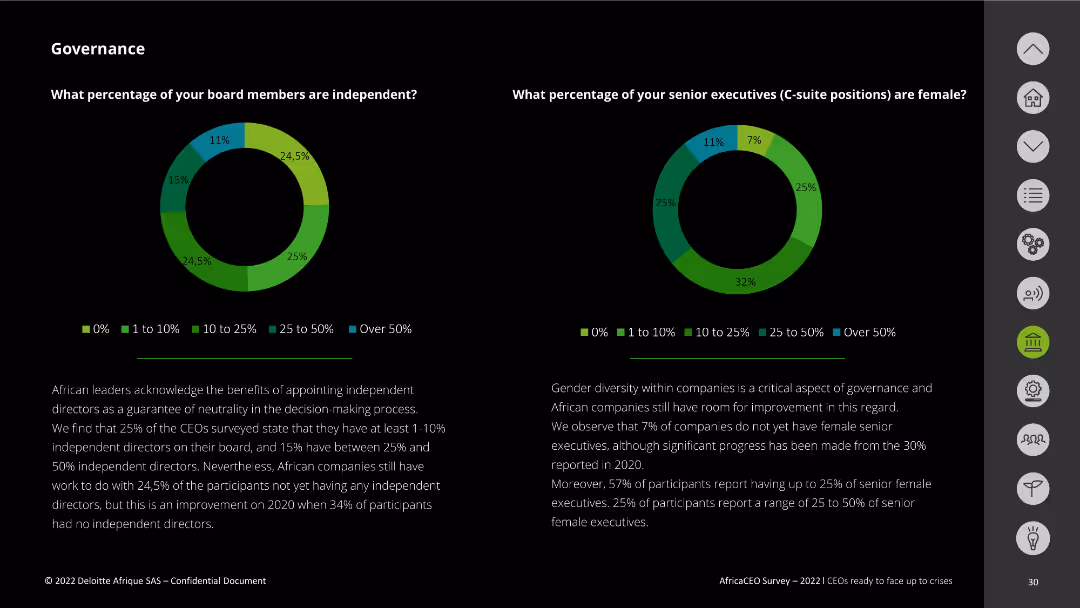
The slide features two pie charts showing the percentage of independent board members and senior female executives in companies. The charts are color-coded with a legend.
Organizational Structure and Change
Professional Services
This slide presents survey results on corporate governance, focusing on the percentage of independent board members and senior female executives in companies. It emphasizes the need for gender diversity and independent decision-making.
governance, independent directors, female executives, corporate diversity, survey
false
Organizational Structure and Change
Professional Services
Multiple Chart
Deloitte
Add to my slides
Remove from favorites
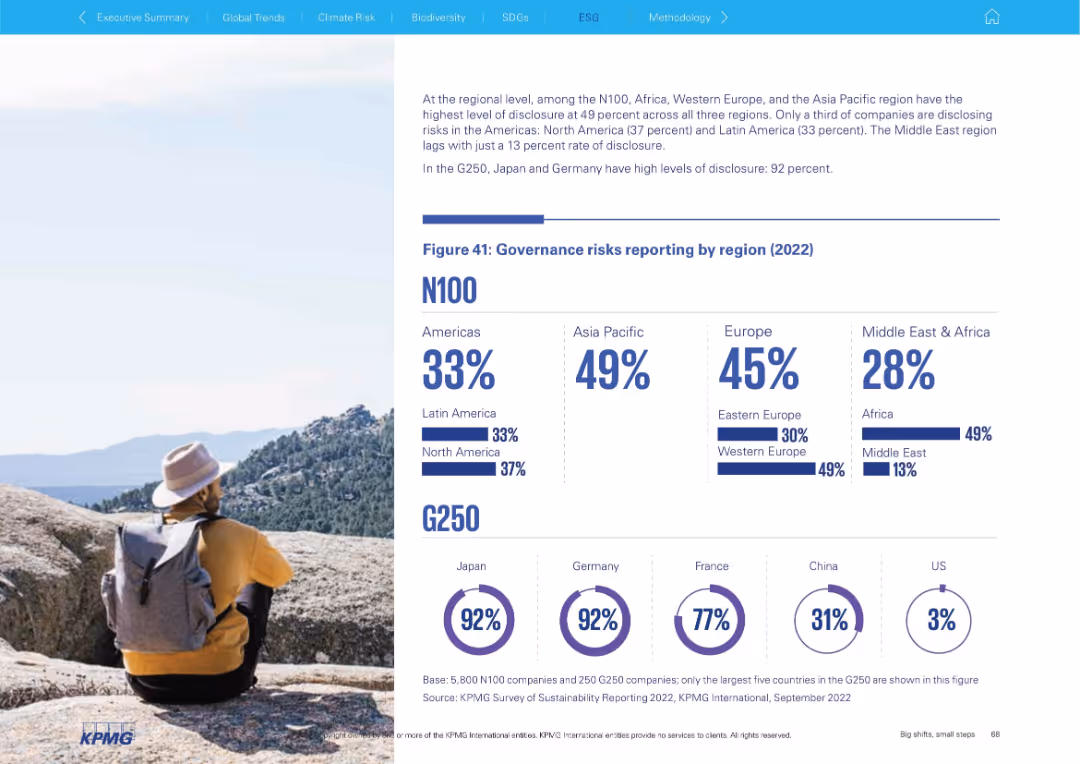
Scenic background photo with governance risk percentages broken down by region and bar graphs for regional comparisons.
Risk Assessment and Management
Professional Services
This slide offers regional insight into governance risk disclosure. Asia Pacific and Europe lead in N100 reporting, while Japan and Germany top G250 reporting. The Middle East lags, especially in N100.
governance, regional breakdown, corporate risk, Asia Pacific, Europe, G250, N100, disclosure rates
false
Risk Assessment and Management
Professional Services
Multiple Chart
KPMG
Add to my slides
Remove from favorites
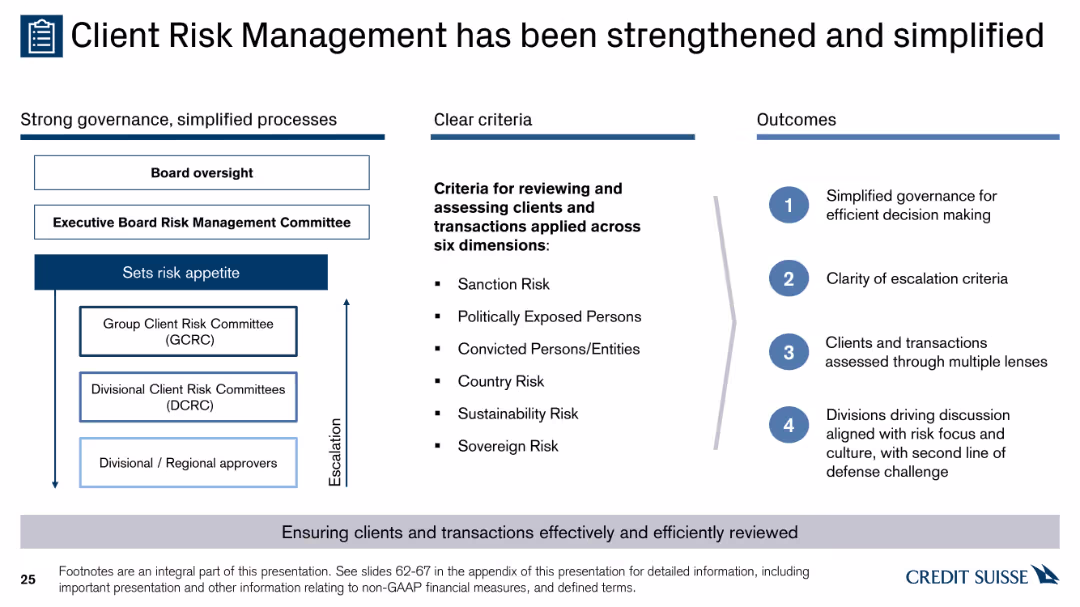
A diagram with three columns showing governance structure, criteria for reviewing clients and transactions, and outcomes. Contains text, bullet points, and arrows for escalation.
Risk Assessment and Management
Financial Services
The slide explains the enhanced and simplified client risk management process, detailing governance structures, risk criteria, and the expected outcomes for effective decision making.
governance, risk, criteria, outcomes, escalation
false
Risk Assessment and Management
Financial Services
Header Horizontal
Credit Suisse
Add to my slides
Remove from favorites
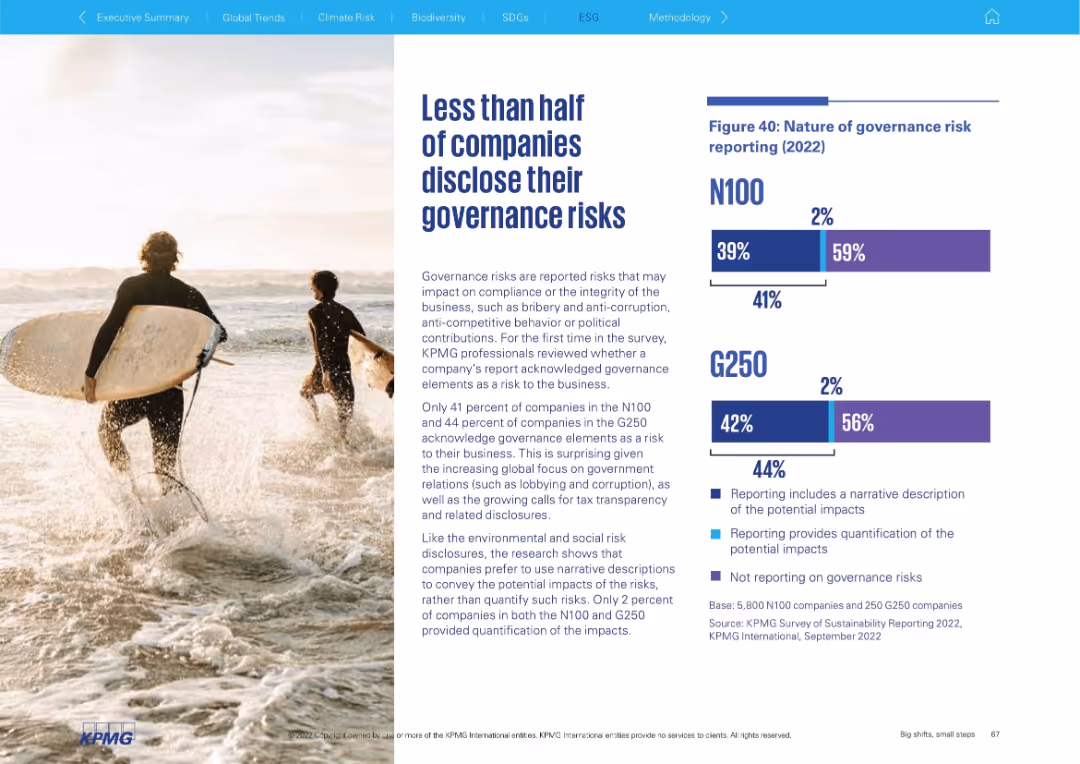
Mixed layout with a photo background on the left and governance risk reporting data on the right, including bars and stacked percentages.
Risk Assessment and Management
Professional Services
The slide reveals that under half of companies disclose governance risks like corruption or anti-competitive behavior. Most reporting is narrative-based, with very little quantification. Comparisons are made between N100 and G250.
governance risk, ESG, compliance, integrity, N100, G250, corporate behavior, anti-corruption, disclosure
false
Risk Assessment and Management
Professional Services
Mixed Chart
KPMG
Add to my slides
Remove from favorites
Line charts showing trends in institutional quality scores over time.
Regulatory and Compliance
Government & Public Sector
Examines the role of quality governance in enhancing business confidence and reducing corruption in South Africa.
Governance, Service Delivery, Corruption, Institutional Quality, South Africa
false
Regulatory and Compliance
Government & Public Sector
Mixed Chart
PwC/Strategy&
Add to my slides
Remove from favorites
Features multiple charts depicting different governance models across a continuum of integration.
Strategic Planning
Professional Services
Highlights the impact of operational governance choices on organizational structure and financial management.
governance, structure, operational, integration, financial
false
Strategic Planning
Professional Services
Table
Deloitte
Add to my slides
Remove from favorites
The slide features a hierarchical chart with two main columns differentiated by color. On the left, a blue column lists the supervisory board's structure, and on the right, a darker blue column outlines the general partners' responsibilities.
Organizational Structure and Change
Industrial & Manufacturing
This slide illustrates the governance structure of Michelin, detailing the roles and relationships between the supervisory board and general partners. It can be used to explain company management and oversight practices.
Governance, Structure, Roles, Oversight, Partners, Liability, Management
false
Organizational Structure and Change
Industrial & Manufacturing
Diagram
Morgan Stanley
Add to my slides
Remove from favorites
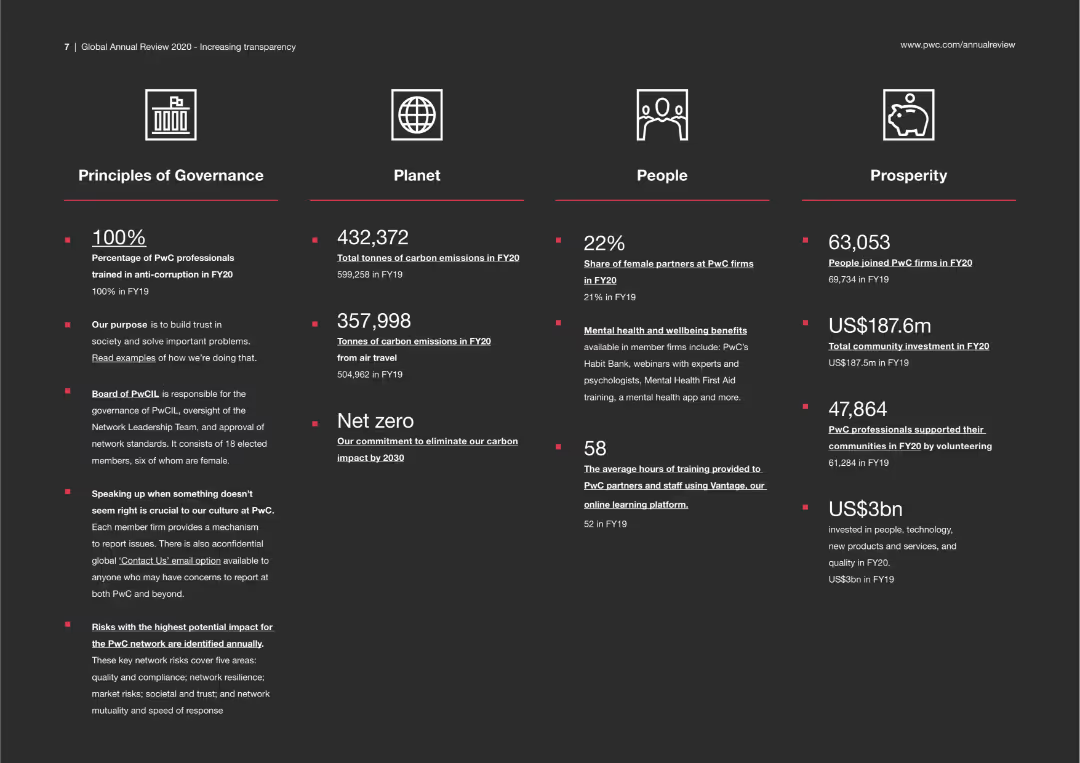
This slide is divided into four sections, each with a heading and bullet points detailing principles and statistics related to governance, environmental impact, diversity, and community investment.
Human Resources and Talent Management
Professional Services
The slide presents PwC's commitments and achievements in governance, environmental sustainability, diversity, and community engagement, emphasizing transparency and corporate responsibility.
Governance, sustainability, diversity, community investment, transparency
false
Human Resources and Talent Management
Professional Services
Pillar
PwC/Strategy&
Add to my slides
Remove from favorites
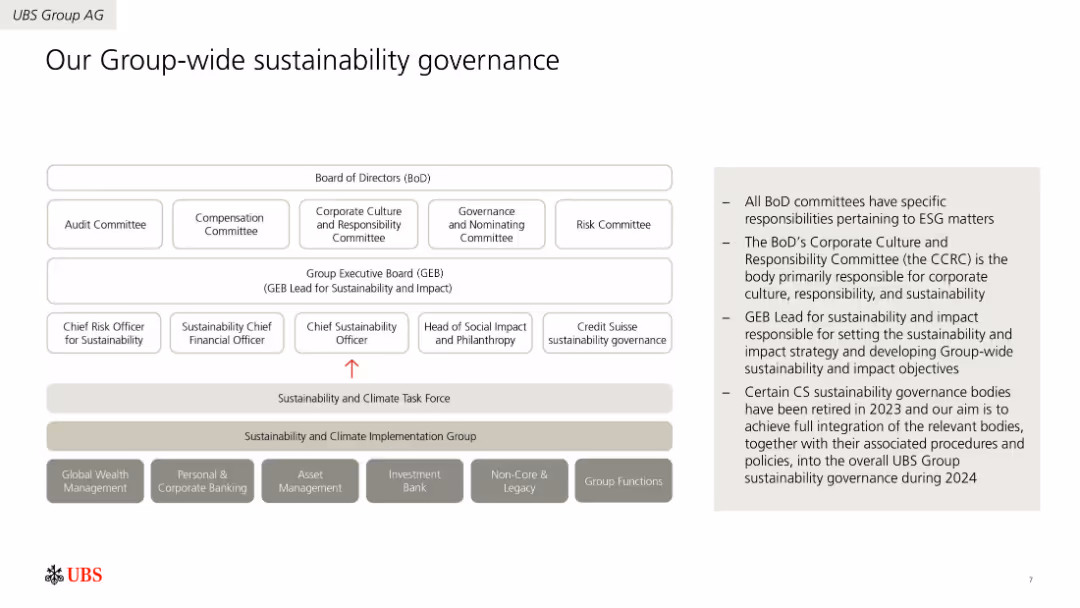
Organizational chart depicting the sustainability governance structure at UBS. Includes boxes for different committees and roles, along with brief descriptions of their responsibilities.
Regulatory and Compliance
Environmental Services & Sustainability
Describes UBS's sustainability governance framework, detailing the roles and responsibilities of various committees and executives. Emphasizes the integration of sustainability into corporate governance.
Governance, Sustainability, Structure, Committees, Responsibilities, Regulatory
false
Regulatory and Compliance
Environmental Services & Sustainability
Diagram
UBS
Add to my slides
Remove from favorites
This slide has two parts: the upper part features a bar graph comparing governance effectiveness between Australia, the US, China, and the EU; the lower part includes two maps highlighting Australia's free trade agreements in North and South America and the Asia-Pacific region. The maps are colored in purple to denote countries with active trade agreements. Annotations provide additional context on the importance of these agreements.
Competitive Landscape
Energy & Utilities
Explains Australia's strong governance and the strategic benefit of its widespread free trade agreements, positioning Australia as a reliable partner for diversifying supply chains internationally.
governance, trade agreements, reliability, export markets, Australia, diversification, Asia-Pacific, North America, free trade, global strategy
false
Competitive Landscape
Energy & Utilities
Mixed Chart
Accenture
Add to my slides
Remove from favorites
Bar chart layout with rankings of countries by agreement; left-aligned text box; includes historical agreement data columns.
Market Analysis and Trends
Government & Public Sector
Evaluates whether people believe their governments would be failing them by not acting on climate change. Rankings highlight varying public trust and urgency perception across countries.
government action, climate change, public trust, global survey, Ipsos, agreement levels, cross-country comparison, environmental urgency
false
Market Analysis and Trends
Government & Public Sector
Mixed Chart
IPSOS
Add to my slides
Remove from favorites
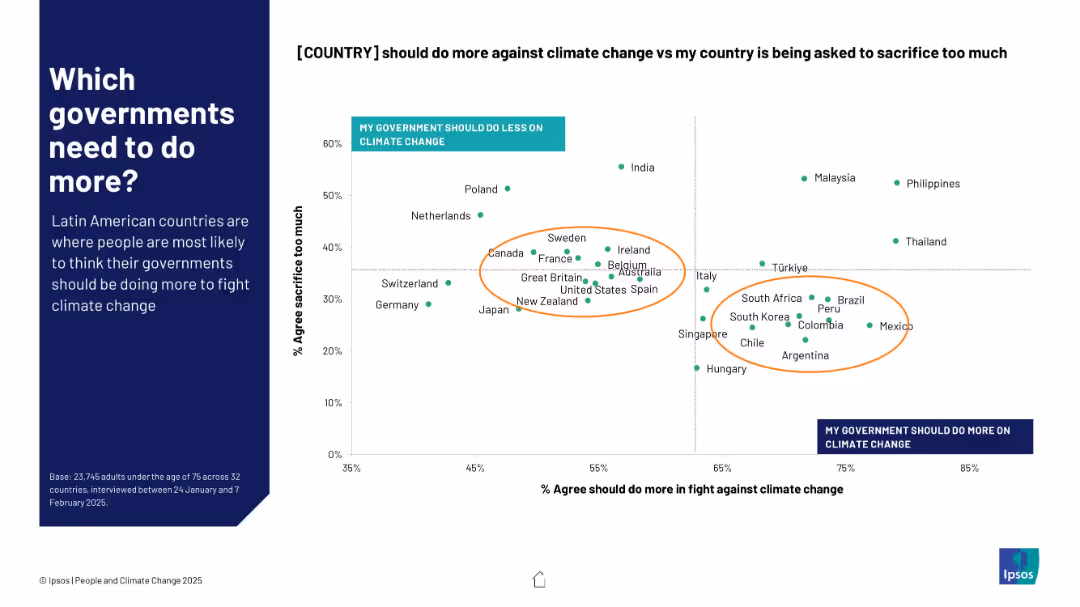
Scatterplot chart on right side shows correlation between views on government action and public sacrifice; annotated orange ellipses highlight country clusters
Regulatory and Compliance
Government & Public Sector
This slide examines the balance between public sentiment on whether their governments should do more on climate change vs. perceptions of national sacrifice. Latin American nations cluster around high dissatisfaction with government efforts.
government action, climate policy, perception, Latin America, scatterplot, Ipsos, responsibility, climate sacrifice, public opinion
false
Regulatory and Compliance
Government & Public Sector
Mixed Chart
IPSOS
Add to my slides
Remove from favorites
The slide includes two line charts: one depicting government bond yields for various countries, and the other showing inflation expectations over time for the same regions.
Market Analysis and Trends
Financial Services
The slide provides an analysis of government bond yields and inflation expectations, comparing data across multiple countries including Australia, US, UK, Germany, and Japan.
government bonds, bond yields, inflation expectations, financial markets, comparative analysis, Australia, US, UK, Germany, Japan
false
Market Analysis and Trends
Financial Services
Multiple Chart
JP Morgan
Add to my slides
Remove from favorites
Two column charts depict historical returns from government bonds during market shocks, comparing different countries. The background is white with 'Fixed Income' highlighted in blue.
Investment Analysis
Financial Services
The slide provides a historical comparison of government bond returns during economic shocks, potentially guiding investment decisions during times of market volatility. It is crucial for investors or policymakers analyzing diversification and risk management strategies.
Government Bonds, Returns, Shocks, Fixed Income, Diversification, Risk
false
Investment Analysis
Financial Services
Multiple Chart
JP Morgan
Add to my slides
Remove from favorites
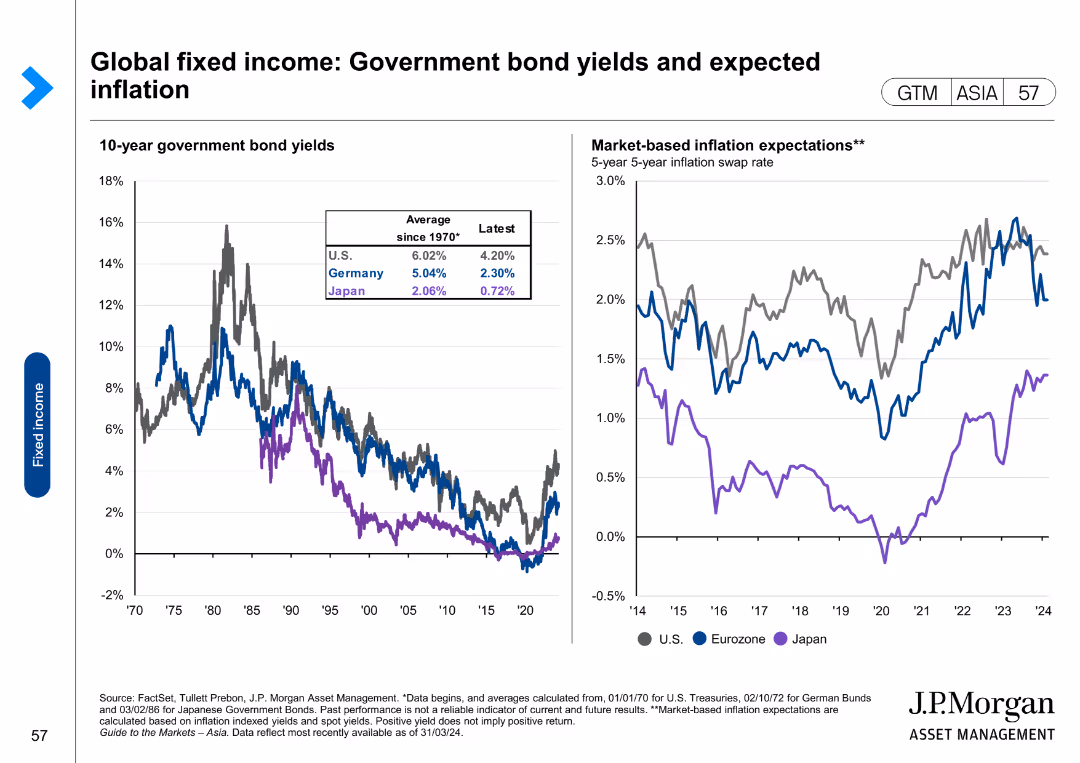
The slide includes two line charts. The first chart shows 10-year government bond yields for the U.S., Germany, and Japan over time. The second chart shows market-based inflation expectations for the same regions.
Financial Performance
Financial Services
This slide examines government bond yields and expected inflation for the U.S., Germany, and Japan, providing insights into fixed income performance and economic expectations.
Government bonds, yields, expected inflation, U.S., Germany, Japan, fixed income, financial performance
false
Financial Performance
Financial Services
Multiple Chart
JP Morgan
Add to my slides
Remove from favorites
This slide uses a dual-column chart to compare the past and projected revenue against expenditures over several fiscal years, displayed in a clear, linear format with red for expenses and grey for revenues. Each year is labeled at the base, and the values are shown at the top of each column, providing a quick visual assessment of fiscal balance.
Financial Performance
Government & Public Sector
This slide compares historical and projected government revenue and expenditures, illustrating fiscal trends and budgetary balances over time. It is typically used in budget presentations to policymakers or the public to discuss financial management and planning, showcasing how revenue covers or falls short of expenses.
government budget, fiscal trends, revenue, expenditure, projections
false
Financial Performance
Government & Public Sector
Single Chart
PwC/Strategy&
Add to my slides
Remove from favorites
This slide features a pie chart depicting budget income sources and a series of column charts showing budget income projections from 2021-22 to 2026-27. The layout includes textual information and visual elements such as icons representing various types of income, neatly aligned with corresponding data. The slide also includes the Isle of Man Government logo.
Financial Performance
Government & Public Sector
The slide presents the Isle of Man's government budget projections for 2022-23, focusing on income tax contributions to the total treasury income. It highlights that income tax is projected to make up 25.93% of total treasury income. It's useful for discussions on government revenue composition and financial planning.
Government, Budget, Income Tax, Projections, Treasury, Financial Planning, Pie Chart
false
Financial Performance
Government & Public Sector
Mixed Chart
PwC/Strategy&
Add to my slides
Remove from favorites
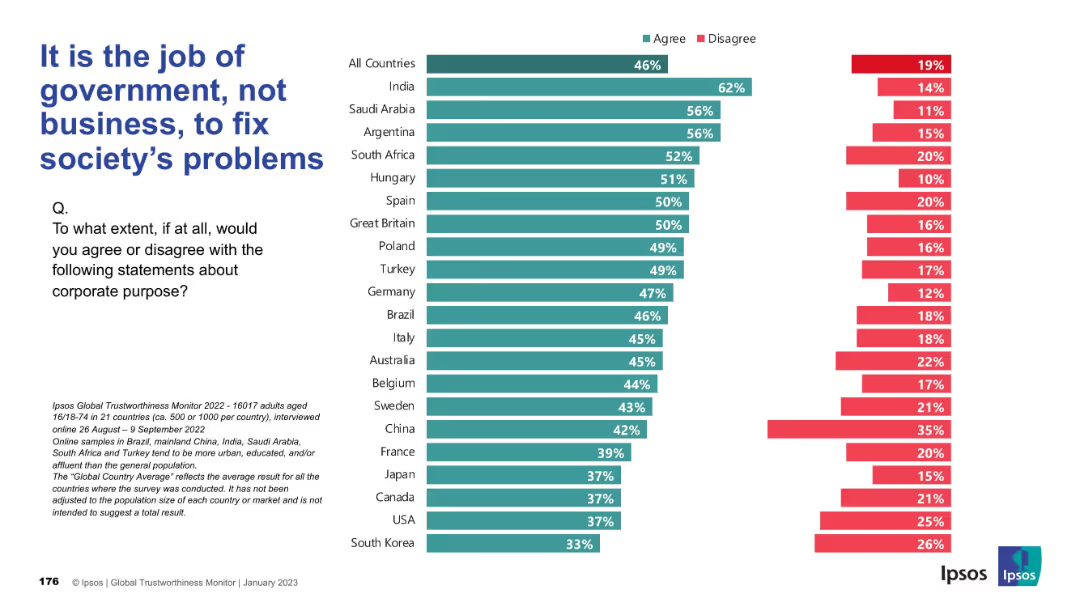
Bar chart layout, left-aligned title and survey question, horizontal bars comparing "Agree" vs "Disagree" percentages across countries
Market Analysis and Trends
Professional Services
This slide shows international survey results on whether people believe it is the government’s responsibility rather than businesses’ to solve societal issues. India has the highest agreement (62%), while South Korea has the lowest (33%).
government, business, responsibility, corporate purpose, Ipsos, survey, public opinion, agreement, disagreement, country comparison
false
Market Analysis and Trends
Professional Services
Mixed Chart
IPSOS
Add to my slides
Remove from favorites
Horizontal bar chart ranking countries by agreement level with the statement. Green for agree, purple for disagree. Includes change from previous years.
Regulatory and Compliance
Environmental Services & Sustainability
This slide compares perceptions of government clarity on climate action plans. China, India, and Indonesia top agreement scores, while European countries show skepticism. Right-side column notes yearly change in agreement.
government climate plans, public perception, country ranking, Ipsos, sustainability, Earth Day, regulatory clarity, trend data
false
Regulatory and Compliance
Environmental Services & Sustainability
Mixed Chart
IPSOS
Add to my slides
Remove from favorites
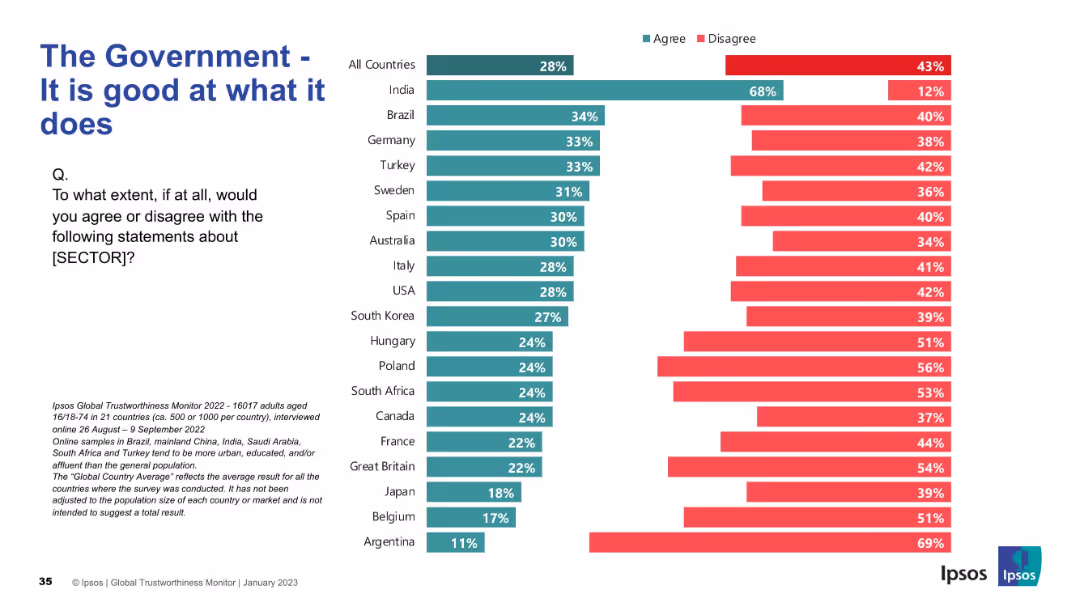
Split bar chart (green for agree, red for disagree) by country; centered layout
Strategic Planning
Government & Public Sector
This slide displays public opinion on governmental competency, with responses split into "agree" and "disagree" categories across 21 countries. India shows the most agreement.
government, competency, trust, public sector, Ipsos, survey, agree/disagree, effectiveness, administration, comparison
false
Strategic Planning
Government & Public Sector
Mixed Chart
IPSOS
Add to my slides
Remove from favorites
The slide shows two bar charts: one depicting real GDP year-over-year change by political party, and another showing S&P 500 calendar year returns by political party.
Market Analysis and Trends
Financial Services
This slide provides an analysis of economic and market performance under different government configurations, suggesting that both fare well regardless of the political party in power.
Government Configurations, GDP, S&P 500, Market Performance, Political Party
false
Market Analysis and Trends
Financial Services
Multiple Chart
JP Morgan
Add to my slides
Remove from favorites
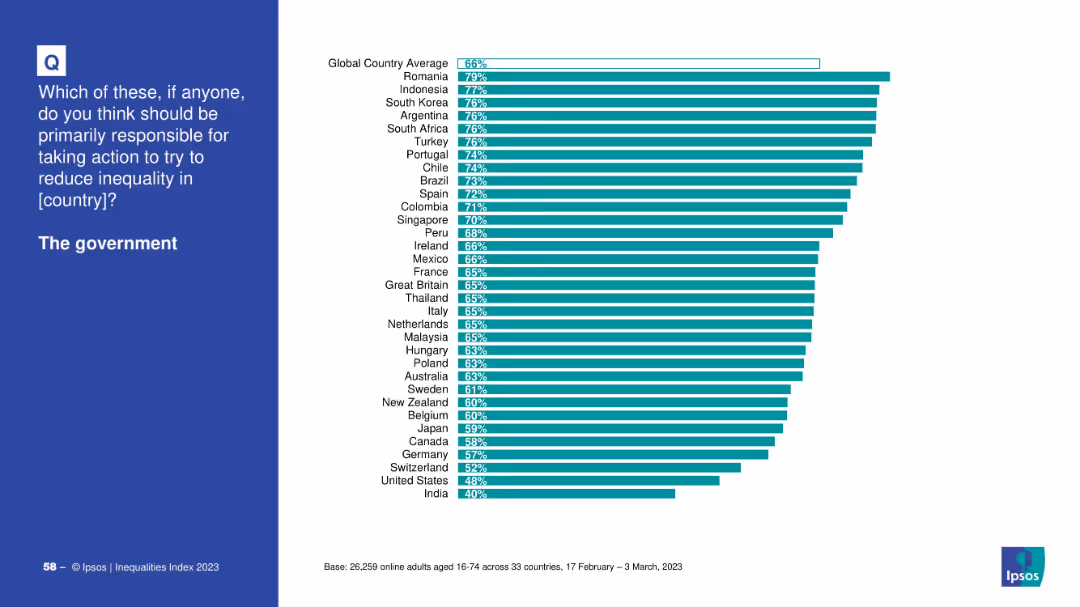
Bar chart ranking countries by % choosing “the government” as primarily responsible.
Market Analysis and Trends
Government & Public Sector
This chart presents country-by-country data on views about government responsibility for inequality. Romania, Indonesia, and South Korea top the list, with India and the U.S. lowest.
government, country data, inequality, Ipsos, bar chart, Romania, responsibility, public opinion
false
Market Analysis and Trends
Government & Public Sector
Mixed Chart
IPSOS
Add to my slides
Remove from favorites
Two line charts are presented: one showing government debt as a percentage of GDP and the other illustrating government interest payments as a percentage of GDP for the US, Eurozone, and UK.
Risk Assessment and Management
Government & Public Sector
The slide examines government debt levels and interest payment trends, useful for assessing fiscal sustainability and debt risk in major economies.
Government debt, interest payments, fiscal sustainability, GDP, risk management
false
Risk Assessment and Management
Government & Public Sector
Multiple Chart
JP Morgan
Add to my slides
Remove from favorites
The slide includes icons and bullet points discussing government support for digital initiatives across various infrastructural areas.
Regulatory and Compliance
Technology & Software
Analyzes the government's proactive role in digital growth, vital for understanding public sector strategies and digital economy compliance.
Government, digital initiatives, infrastructure, regulatory, compliance, strategy, public sector, digital growth
false
Regulatory and Compliance
Technology & Software
Header Vertical
Kearney
Add to my slides
Remove from favorites
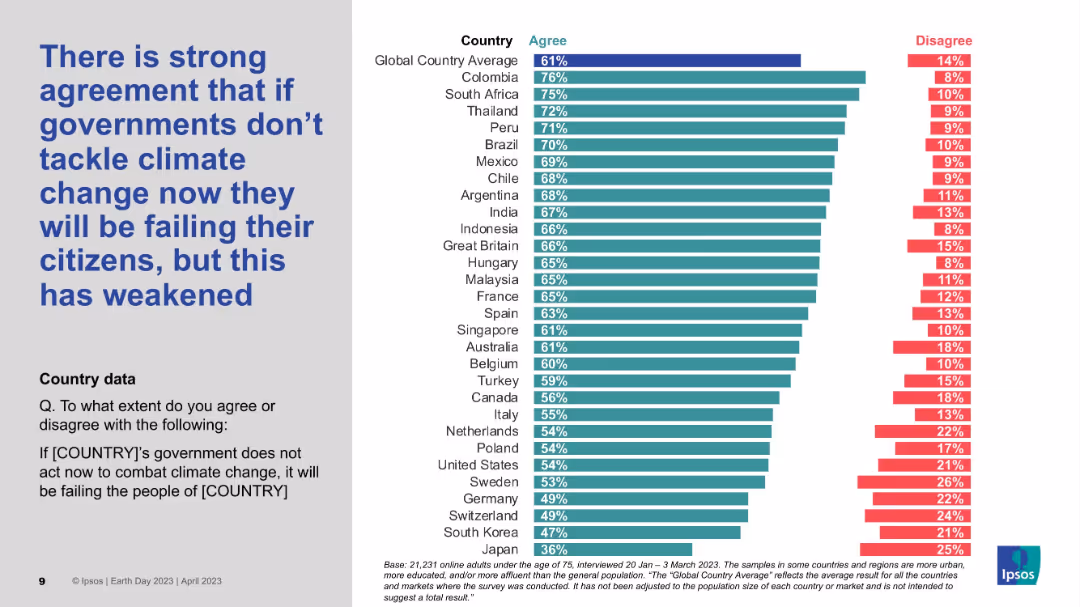
Bar chart ranked by country; agree/disagree split shown; left title in blue on grey.
Risk Assessment and Management
Government & Public Sector
The slide presents strong international agreement that governments failing to act on climate change are failing their citizens. It also highlights a weakening sentiment compared to previous years. Colombia and South Africa top the agreement scale.
Government failure, Climate urgency, Global views, Disagreement, Country comparison
false
Risk Assessment and Management
Government & Public Sector
Mixed Chart
IPSOS
Add to my slides
Remove from favorites
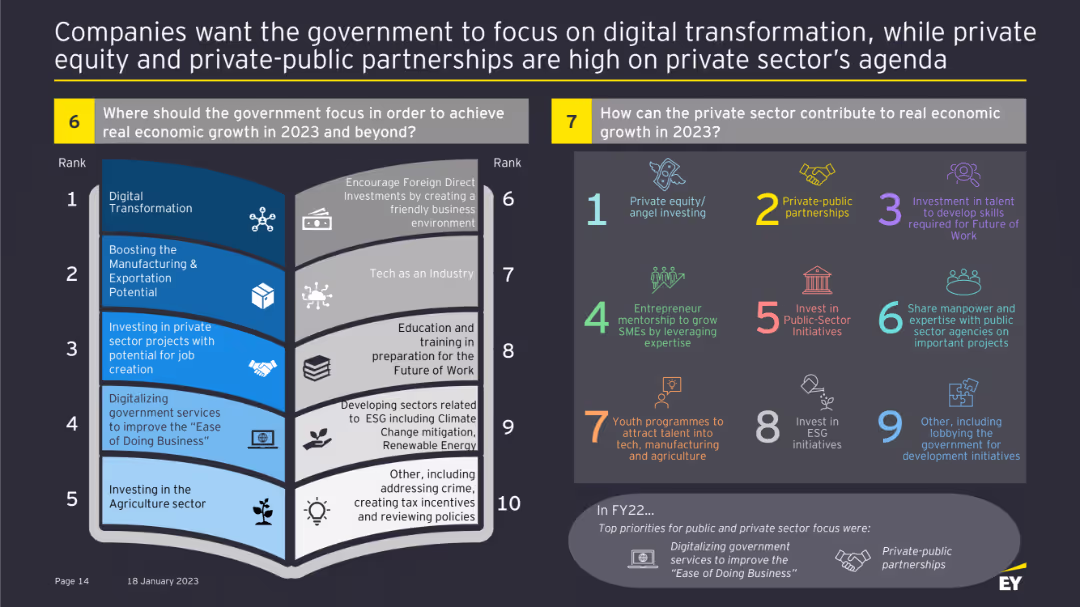
Two panels with ranked lists on where the government should focus for economic growth and how the private sector can contribute.
Strategic Planning
Government & Public Sector
This slide identifies key areas for government focus to achieve economic growth and outlines how the private sector can support these goals through various initiatives.
Government focus, private sector, economic growth, initiatives, digital transformation, investment, partnerships
false
Strategic Planning
Government & Public Sector
Header Horizontal
EY
Add to my slides
Remove from favorites
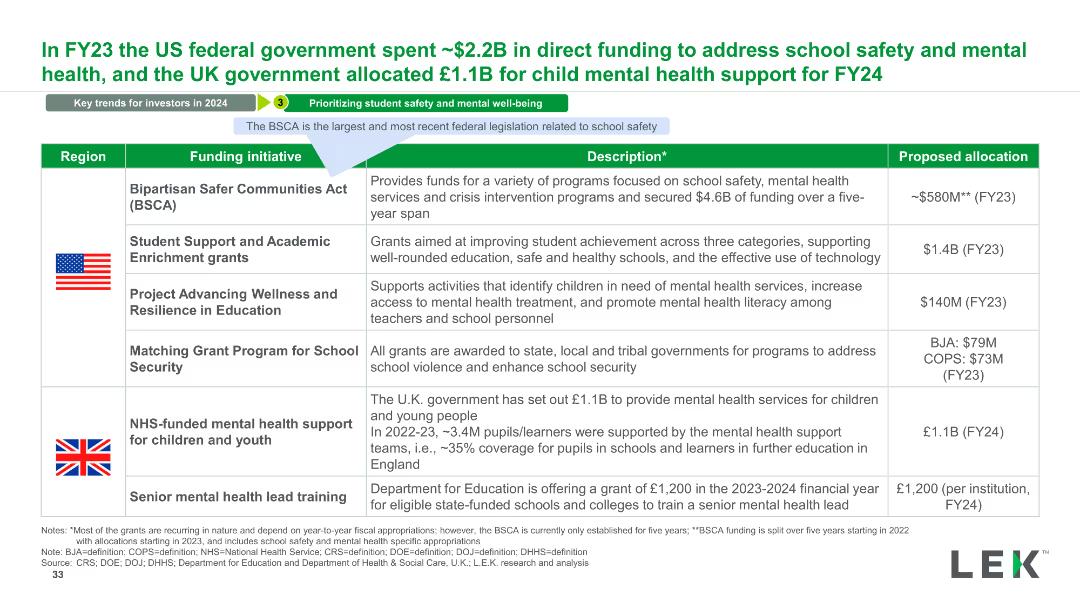
The slide features a table with columns for Region, Funding Initiative, Description, and Proposed Allocation. It includes flags for the US and UK and descriptions of funding initiatives.
Regulatory and Compliance
Government & Public Sector
This slide details government funding initiatives for school safety and mental health in the US and UK, outlining specific programs and their proposed budgets.
Government, Funding, Safety, Mental Health, School, Initiatives, US, UK, Budget, Support
false
Regulatory and Compliance
Government & Public Sector
Table
LEK
Add to my slides
Remove from favorites
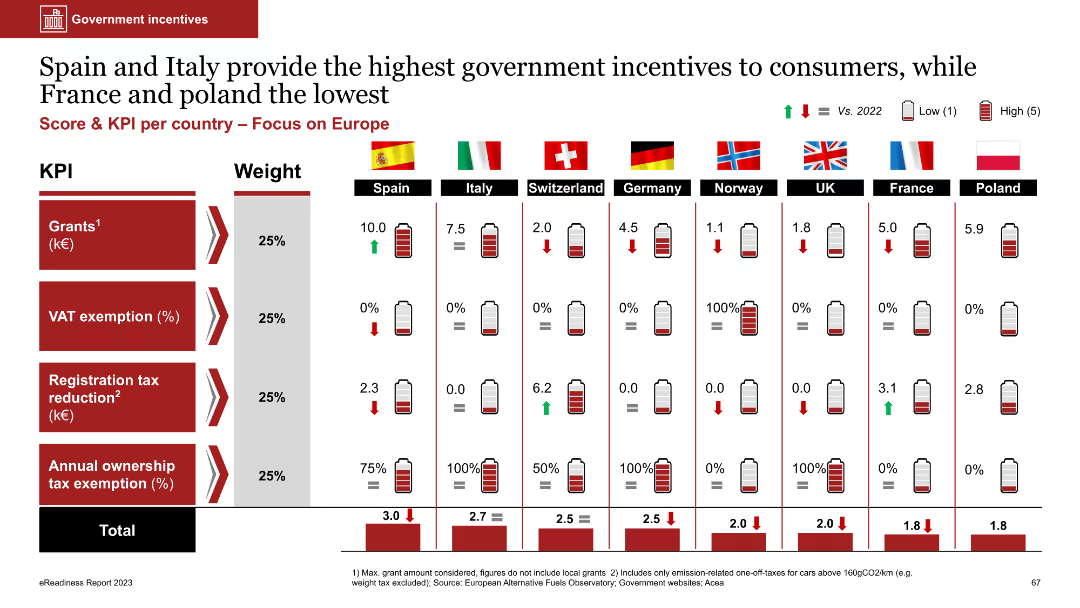
The slide includes a table with bar charts showing government incentives for EVs in various European countries. Metrics include grants, VAT exemption, and tax reductions, each weighted differently.
Regulatory and Compliance
Transportation & Logistics
The slide compares government incentives for EVs across European countries, highlighting Spain and Italy as offering the most incentives. It aims to illustrate the impact of government policies on EV adoption.
government incentives, EVs, Europe, grants, tax exemptions
false
Regulatory and Compliance
Transportation & Logistics
Multiple Chart
PwC/Strategy&
Add to my slides
Remove from favorites
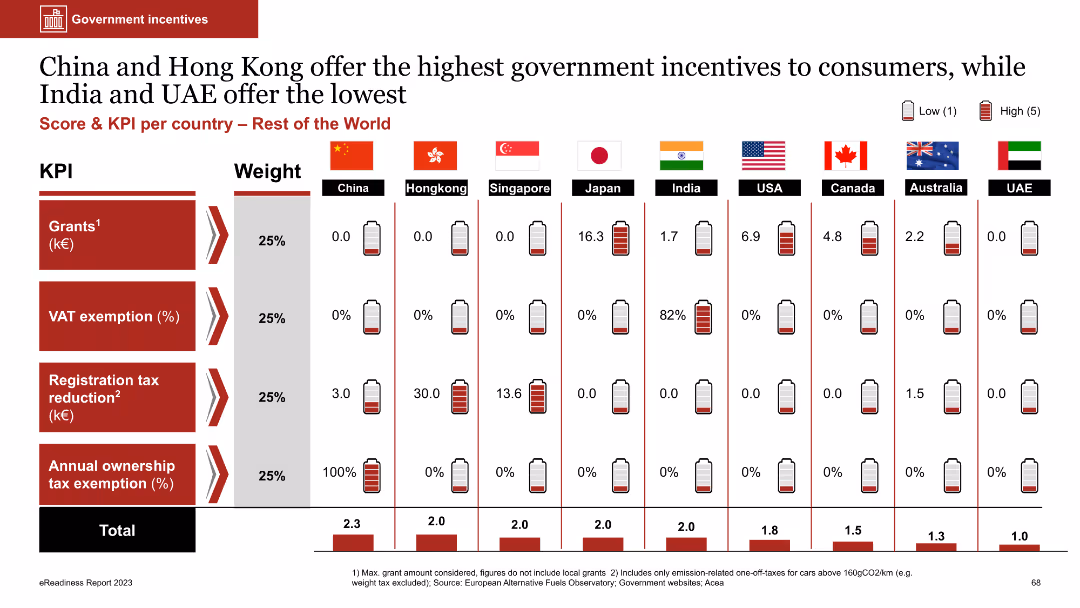
Column chart comparing government incentives across countries; dense with numerical data and battery icons
Market Analysis and Trends
Government & Public Sector
The slide compares government incentives for consumers across various countries using KPIs like grants, VAT exemptions, and tax reductions. China and Hong Kong offer the highest incentives, while India and UAE offer the lowest
government incentives, grants, VAT exemption, tax reduction, comparative analysis
false
Market Analysis and Trends
Government & Public Sector
Multiple Chart
PwC/Strategy&
Add to my slides
Remove from favorites
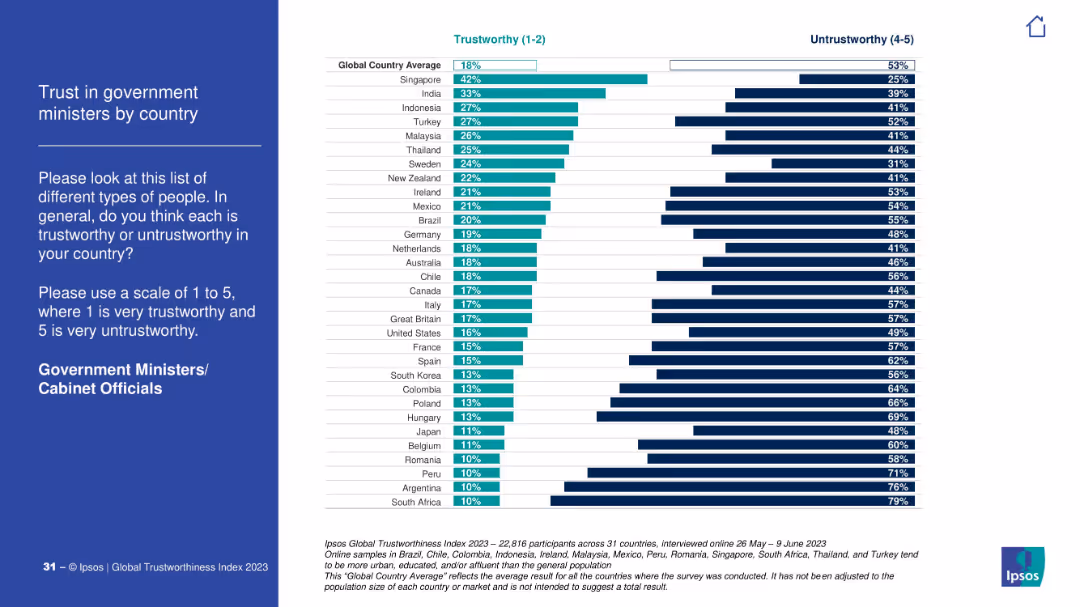
Blue sidebar and full bar graph breakdown of trust in government ministers. Includes both trustworthy and untrustworthy measures.
Risk Assessment and Management
Government & Public Sector
This slide compares trust in government ministers globally. Singapore has the highest trust, while South Africa and Argentina score lowest with overwhelming distrust.
government, ministers, cabinet, trust, political perception, Ipsos, global analysis
false
Risk Assessment and Management
Government & Public Sector
Mixed Chart
IPSOS
Add to my slides
Remove from favorites
The slide displays a bar chart with horizontal bars indicating survey responses about government performance during the pandemic. The chart is accompanied by text on the left, providing an overview and interpretation of the results.
Regulatory and Compliance
Government & Public Sector
This slide presents survey results on Millennials' and Gen Z's perceptions of their national governments' handling of the COVID-19 pandemic. It shows mixed reviews, highlighting areas where governments performed well and areas needing improvement. The data can inform policy adjustments and public communication strategies.
Government, Pandemic, Response, Millennials, Gen Z
false
Regulatory and Compliance
Government & Public Sector
Mixed Chart
Deloitte
Add to my slides
Remove from favorites
The slide includes a column chart displaying support for various government policies to improve internet trust.
Regulatory and Compliance
Government & Public Sector
The slide presents public opinion on different government policies aimed at enhancing internet trust.
government policies, internet trust, public opinion, regulation, cybersecurity, data protection
false
Regulatory and Compliance
Government & Public Sector
Single Chart
IPSOS
Add to my slides
Remove from favorites
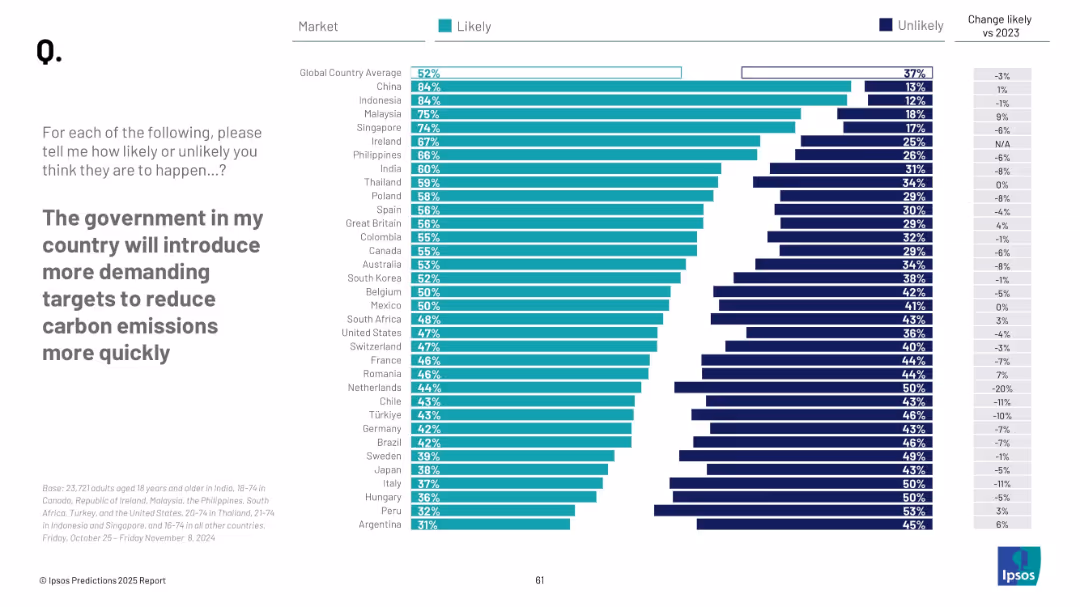
Horizontal bar chart with countries ranked; teal and navy bars; focus on environmental policy
Regulatory and Compliance
Environmental Services & Sustainability
This slide explores public opinion on whether governments will enforce stricter carbon reduction policies in 2025. It compares optimism across countries, highlighting shifts in expectation from 2023.
government policy, carbon emissions, climate regulation, environmental action, public perception, 2025
false
Regulatory and Compliance
Environmental Services & Sustainability
Mixed Chart
IPSOS
Add to my slides
Remove from favorites
Includes a column chart listing additional governmental priorities as perceived by the public and a bar graph showing concerns about public debt from 2022 to 2023.
Strategic Planning
Government & Public Sector
Highlights additional public priorities for government commitment beyond existing reforms and tracks public sentiment regarding national debt over two years.
government priorities, public debt, public opinion, fiscal policy, national budget, government commitment, debt concerns, economic strategy, policy development
false
Strategic Planning
Government & Public Sector
Multiple Chart
Bain
Add to my slides
Remove from favorites
Featuring a split layout with text on the left, this slide emphasizes the need for comprehensive government and private-sector collaboration. Icons and text on the right segment highlight roles and collaboration efforts in areas like "Digital infrastructure" and "Consumer education."
Strategic Planning
Technology & Software
This slide discusses strategies for a comprehensive approach to digital economy potential through government and private sector collaboration, covering connectivity, regulation, talent, and capital access. The layout aims to inform about collaborative roles and tasks necessary for a robust digital infrastructure.
government, private sector, collaboration, strategy, digital, infrastructure
false
Strategic Planning
Technology & Software
Header Vertical
Kearney
Add to my slides
Remove from favorites
Multiple line charts showing the excise duty for various alcoholic beverages and cigarettes from 2017/18 to 2024/25.
Regulatory and Compliance
Government & Public Sector
Details changes in tax levies on alcohol and cigarettes, reflecting government regulatory measures.
Government, Public Sector, Alcohol, Cigarettes, Tax, Duty, Excise, Regulatory, Compliance
false
Regulatory and Compliance
Government & Public Sector
Single Chart
PwC/Strategy&
Add to my slides
Remove from favorites
Line chart with annotations for actual and projected expenditure rates from 2018/19 to 2023/24.
Financial Performance
Government & Public Sector
Shows the consistency and changes in government spending efficiency over six fiscal years.
Government, Public Sector, Expenditure, Efficiency, Spending, Financial, Rate, Actuals, Projections
false
Financial Performance
Government & Public Sector
Single Chart
PwC/Strategy&
Add to my slides
Remove from favorites
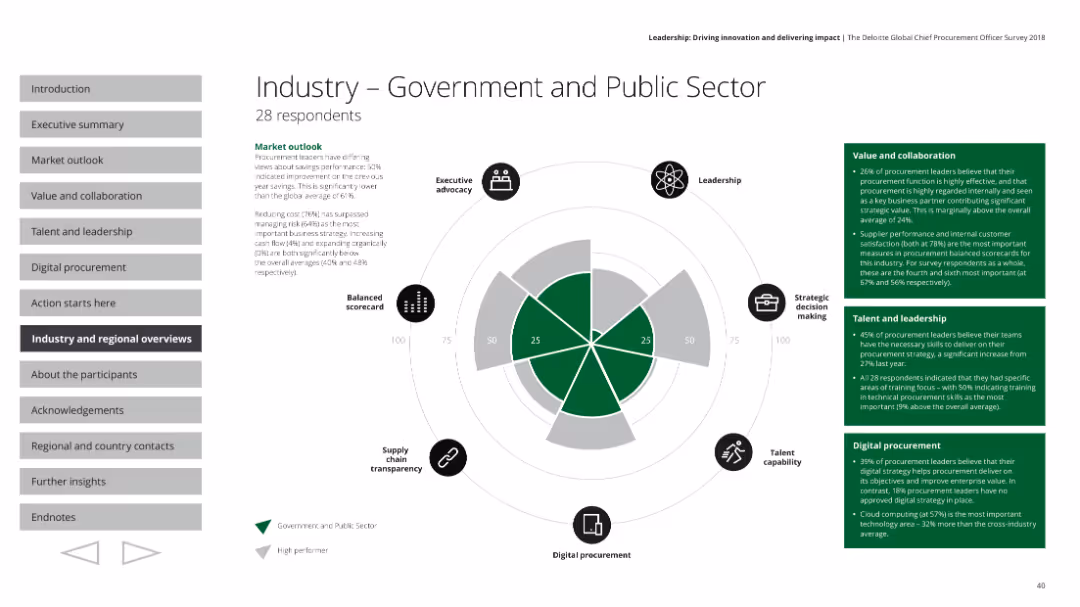
The slide features a radar chart, text boxes with survey results, and small icons indicating various aspects of performance.
Industry Overview
Government & Public Sector
This slide provides an overview of the government and public sector's procurement performance based on a survey. It covers executive advocacy, leadership, strategic decision making, talent capability, digital procurement, and supply chain transparency, with detailed market outlook and specific metrics on value, collaboration, talent, and leadership.
Government, public sector, procurement, radar chart, performance
false
Industry Overview
Government & Public Sector
Mixed Chart
Deloitte
Add to my slides
Remove from favorites
The slide features a four-column layout with textual information on the left and various bubble charts on the right, visually representing data on AI utilization across different business processes. Each chart is marked with a percentage, indicating the level of AI integration.
Industry Overview
Government & Public Sector
This slide discusses the potential of AI to improve operations in government and public services, with specific examples from the Air Force and other agencies. It explains how AI can predict performance and safety issues, and how it assists humans before performance degrades. Additionally, it lists different operational areas where AI is currently used, like customer experience and operations finance.
Government, Public Services, AI, Innovation, Performance, Safety, Operations, Finance, Customer Experience
false
Industry Overview
Government & Public Sector
Multiple Chart
Deloitte
Add to my slides
Remove from favorites
Displays two sets of column charts; one assessing priority reforms for Macron's agenda and another on public confidence in the government's ability to implement these reforms before the next elections.
Strategic Planning
Government & Public Sector
Investigates which government reforms should be prioritized and public confidence in the French government's execution abilities as elections approach.
government reforms, public confidence, French politics, Macron, election strategy, policy implementation, political priorities, public opinion, strategic planning
false
Strategic Planning
Government & Public Sector
Multiple Chart
Bain
Add to my slides
Remove from favorites
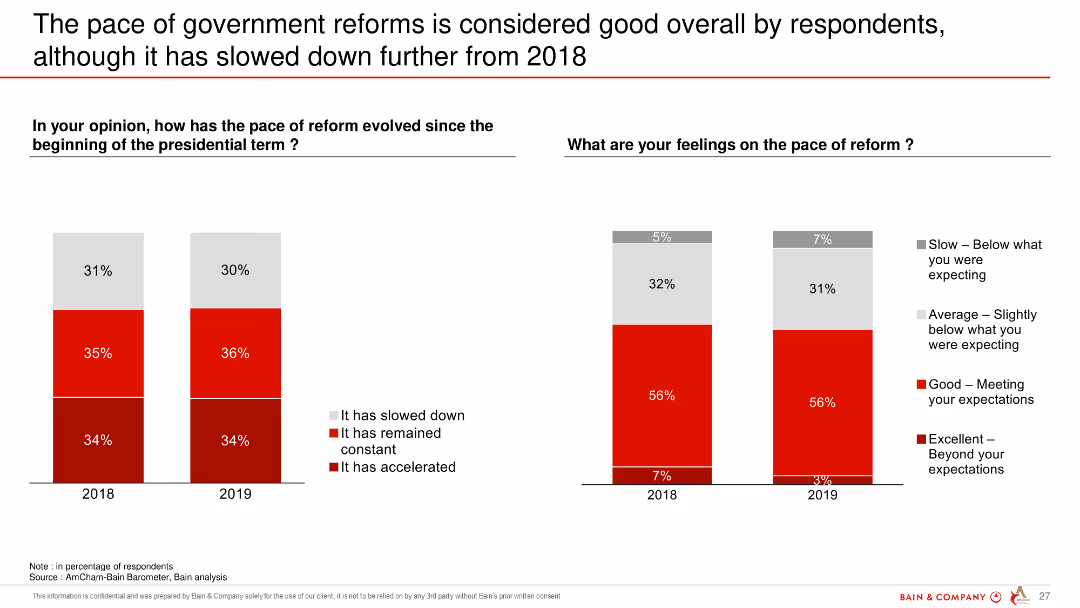
The slide contains two column charts comparing the pace of government reforms and respondents' feelings on the pace over two years (2018 and 2019). The bars show varying levels of satisfaction.
Regulatory and Compliance
Government & Public Sector
This slide shows that respondents generally perceive government reforms positively, but there is a slight decline in satisfaction from 2018 to 2019.
government reforms, satisfaction, survey, comparison, 2018, 2019, pace of reform
false
Regulatory and Compliance
Government & Public Sector
Multiple Chart
Bain
Add to my slides
Remove from favorites
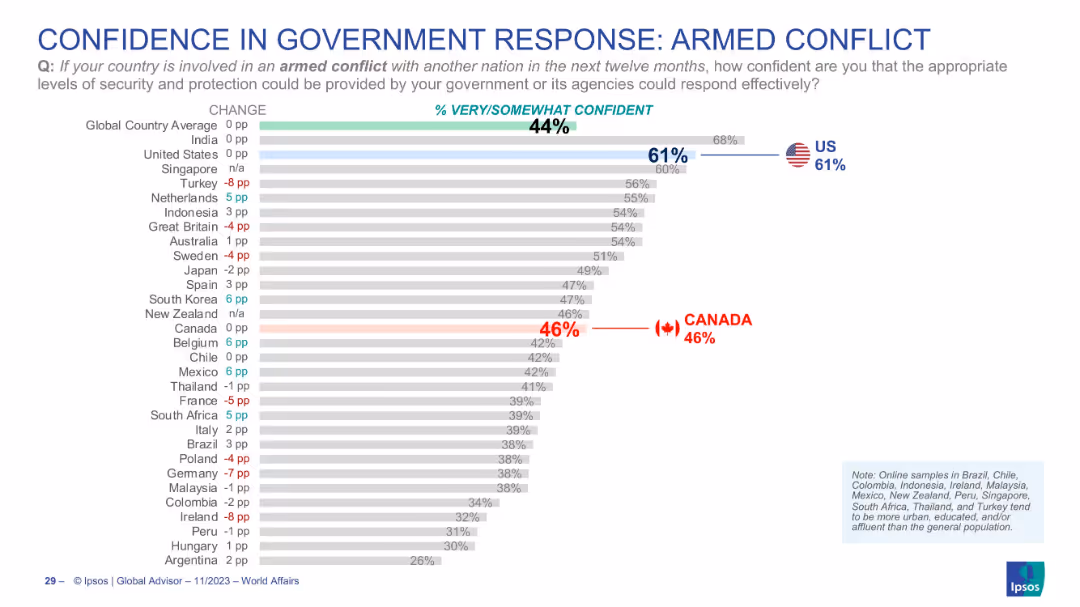
Horizontal bar chart with country comparisons, color-coded bars, U.S. and Canada highlighted with flags and bold text
Risk Assessment and Management
Government & Public Sector
This slide presents a comparative view of public confidence across countries in their government's ability to respond effectively to an armed conflict. The U.S. and Canada figures are emphasized, showing 61% and 46% confidence respectively.
government response, armed conflict, public confidence, country ranking, security, Canada, US, Ipsos, survey, perception
false
Risk Assessment and Management
Government & Public Sector
Single Chart
IPSOS
Add to my slides
Remove from favorites
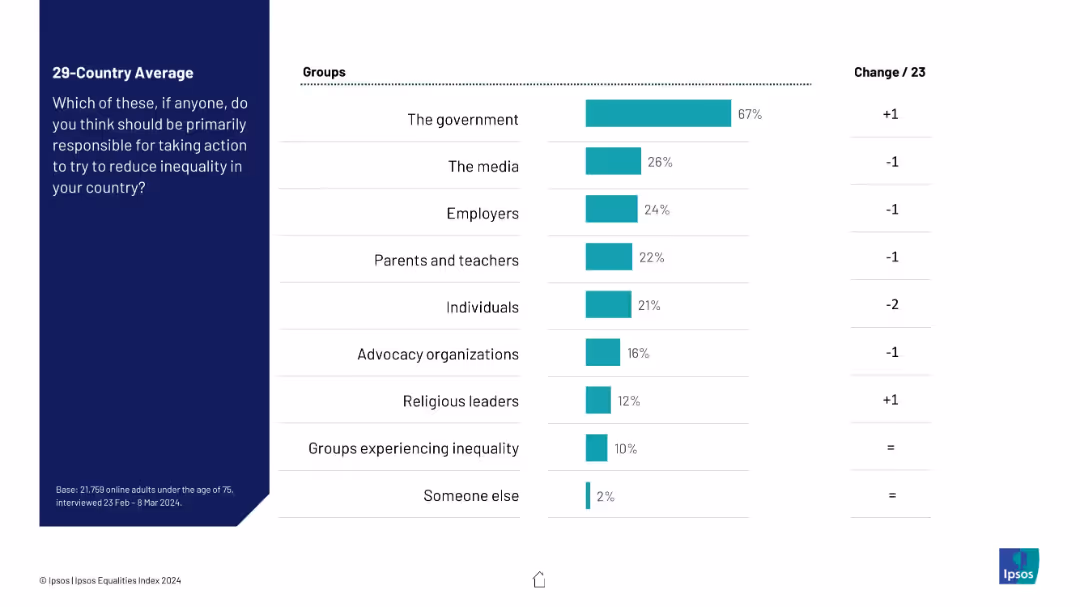
Bar chart with solid teal bars showing different groups and their responsibility percentages. Right-aligned bars with a “Change from 2023” column. Simple, grid-like layout.
Strategic Planning
Government & Public Sector
This slide presents public opinion on which entities should take the lead in reducing inequality, with a strong majority assigning responsibility to the government (67%). Other actors like media, employers, and advocacy groups have significantly lower perceived responsibility. Change from previous year is minimal.
government responsibility, inequality, policy, media, employers, advocacy, survey, Ipsos, change
false
Strategic Planning
Government & Public Sector
Mixed Chart
IPSOS
Add to my slides
Remove from favorites
The slide features a structured list of recommendations for government involvement in supporting start-ups, including talent development, fiscal incentives, funding and exit options, and start-up facilitation, with examples from various countries.
Strategic Planning
Government & Public Sector
This slide presents recommendations for government roles in supporting start-ups, suggesting actions like providing tax incentives, setting up VC funds, and developing a start-up ecosystem, with international examples.
government role, start-ups, recommendations, talent development, fiscal incentives, funding, start-up facilitation
false
Strategic Planning
Government & Public Sector
Table
Kearney
Add to my slides
Remove from favorites
This slide displays multiple column charts comparing expenditures in various government sectors between two fiscal years, highlighting percentage changes.
Regulatory and Compliance
Government & Public Sector
Analyzes year-on-year changes in government spending across different sectors, providing insights into budget allocation shifts.
Government spending, budget analysis, fiscal years, comparison
false
Regulatory and Compliance
Government & Public Sector
Single Chart
PwC/Strategy&
Add to my slides
Remove from favorites
Features a detailed column chart split into multiple segments representing different funding areas under the IIJA and IRA, accompanied by a list of key incentives such as tax credits for clean energy and transportation.
Regulatory and Compliance
Government & Public Sector
Provides a detailed overview of the financial specifics under the IIJA and IRA, highlighting key investment areas and incentives for promoting clean energy and infrastructure projects.
government spending, clean energy, infrastructure, tax incentives, IIJA, IRA
false
Regulatory and Compliance
Government & Public Sector
Mixed Chart
BCG
Add to my slides
Remove from favorites
This slide presents a stacked column chart detailing government expenditure by subdivision over several years. It includes categories such as personnel and capital assets.
Regulatory and Compliance
Government & Public Sector
Analyzes trends in government spending across various categories over time, highlighting changes in expenditure.
Government spending, trends, expenditure, fiscal year, budget
false
Regulatory and Compliance
Government & Public Sector
Single Chart
PwC/Strategy&
Add to my slides
Remove from favorites
Lists eight domains where the state supports hydrogen industry development, each represented with an icon and a brief description, including strategy, infrastructure, and R&D.
Regulatory and Compliance
Government & Public Sector
Details the support mechanisms the Chilean government provides for the hydrogen industry, covering strategic vision, regulatory frameworks, and incentives, aiming to foster industry growth and sustainability.
government, support, hydrogen, infrastructure
false
Regulatory and Compliance
Government & Public Sector
Table
McKinsey
Add to my slides
Remove from favorites
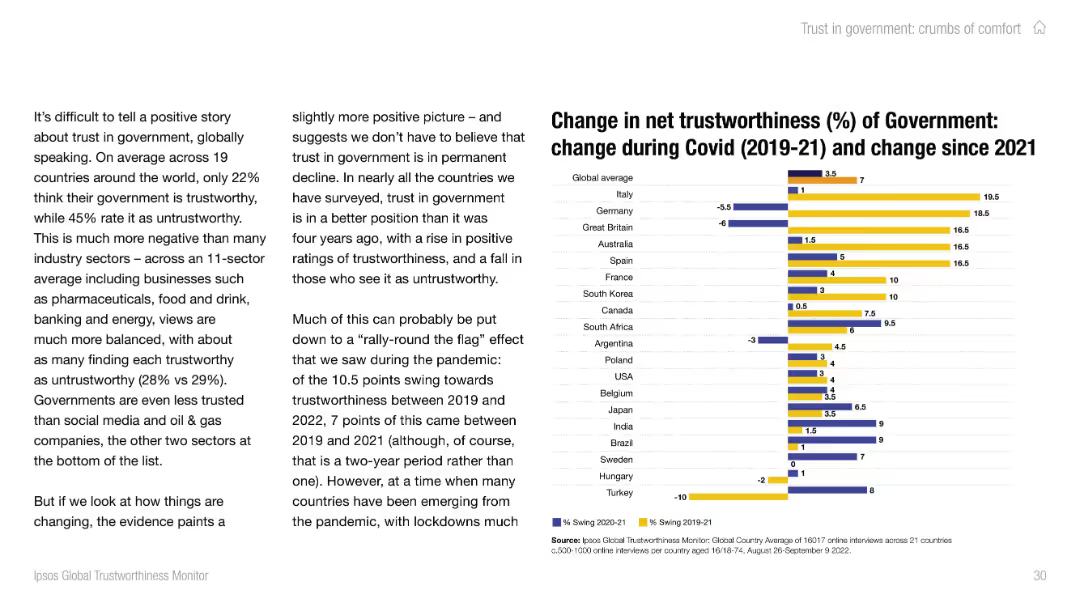
Left-aligned text with dual-bar chart on the right showing trust change during Covid and since 2021. Uses yellow and blue bars with global average reference.
Risk Assessment and Management
Government & Public Sector
This slide tracks how trust in government shifted during and after Covid. While trust initially rose during the pandemic, it has declined in some countries post-2021. The data shows varying national trajectories and a fragile trust recovery.
government, trust, covid, perception, Ipsos, pandemic, regulation, trends
false
Risk Assessment and Management
Government & Public Sector
Mixed Chart
IPSOS
Add to my slides
Remove from favorites
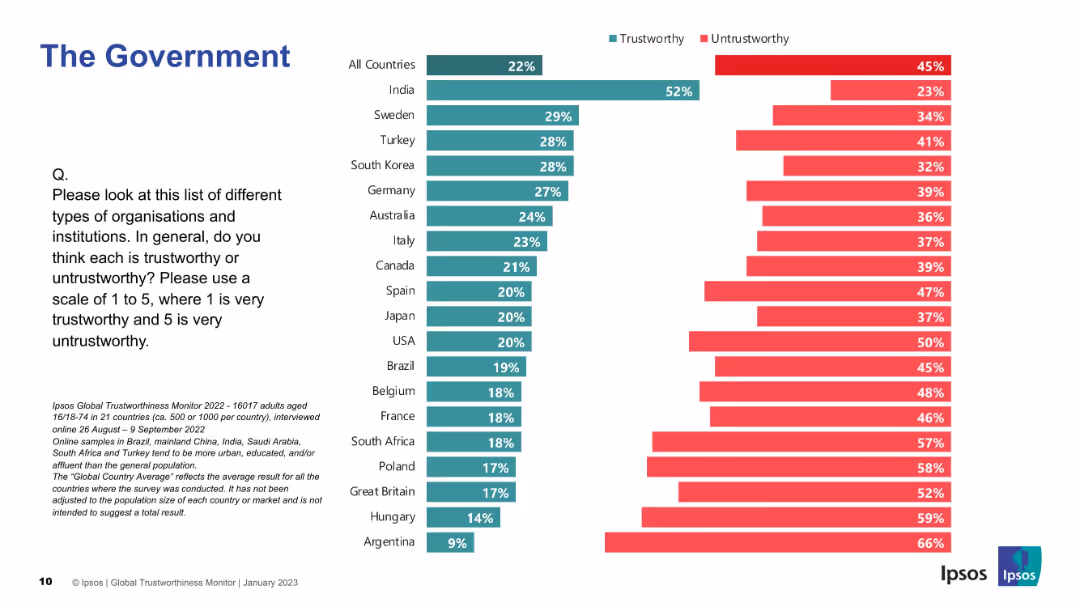
Bar chart comparing trust vs distrust in government by country; left-aligned question, bars on right.
Regulatory and Compliance
Government & Public Sector
This slide illustrates international perceptions of government trustworthiness. India is the most trusting, while Argentina is the least. The global average shows more distrust than trust toward government institutions.
government trust, public sector, country comparison, distrust, perception, Ipsos, regulatory confidence, global view
false
Regulatory and Compliance
Government & Public Sector
Mixed Chart
IPSOS
Add to my slides
Remove from favorites
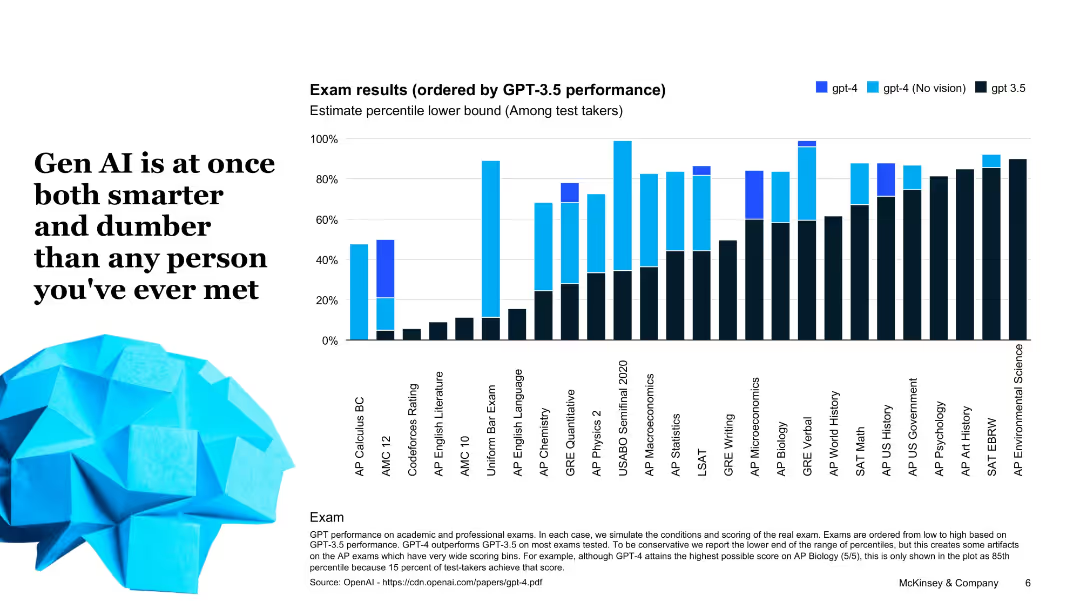
Bar chart comparing GPT-4 and GPT-3.5 performance across standardized tests; bold headline and image of a polygonal human face.
Performance Metrics and KPIs
Artificial Intelligence
This slide presents AI exam performance data, highlighting that GPT-4 outperforms GPT-3.5 in many academic benchmarks, but with varying results depending on subject, showcasing its uneven intelligence profile.
GPT-4, GPT-3.5, AI performance, standardized tests, exam results, metrics, benchmark
false
Performance Metrics and KPIs
Artificial Intelligence
Single Chart
McKinsey
Add to my slides
Remove from favorites
Contains lists, a block of text defining GPT, and a highlight on the Internet as a GPT. Purple accents are used throughout the slide.
Industry Overview
Technology & Software
Explores the concept of General Purpose Technologies (GPTs) and positions the internet as a critical GPT, highlighting its broad economic impacts.
GPT, internet, technology, economic impact, innovation, broadband, 21st century, utility
false
Industry Overview
Technology & Software
Header Vertical
Accenture
Add to my slides
Remove from favorites
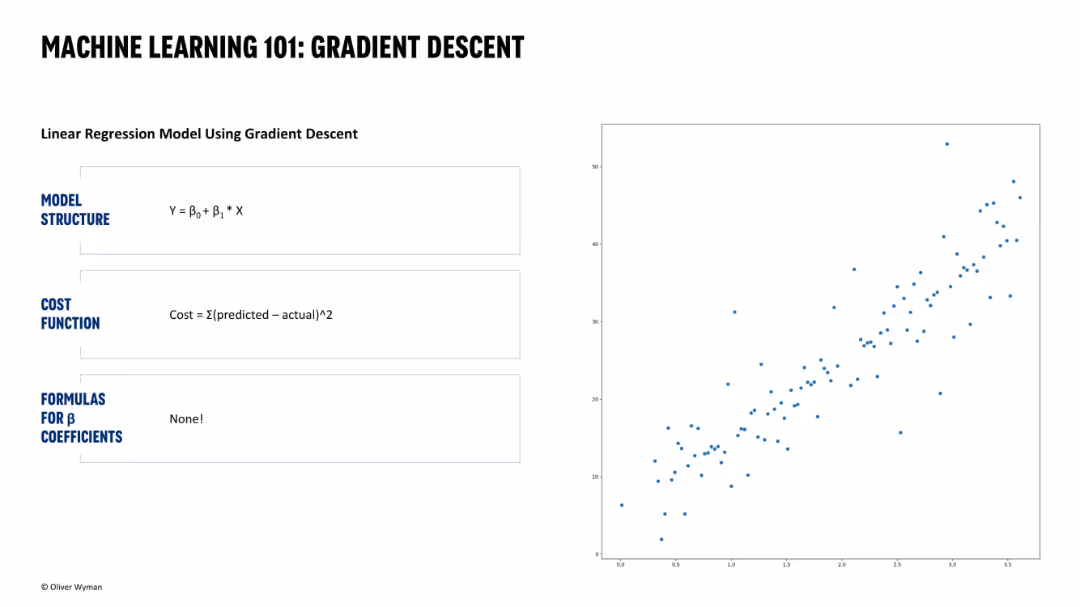
Similar layout to Slide 16331. Left panel shows model structure and cost function with "None!" under formulas. Scatter plot on the right shows data without regression line.
Technology and Digital Transformation
Artificial Intelligence
Introduces the gradient descent method for linear regression. It contrasts traditional analytical formulas by not requiring explicit coefficient formulas and visually represents raw data distribution.
gradient descent, linear regression, cost function, machine learning, no formulas, model structure, predictive analysis, data visualization, scatter plot
false
Technology and Digital Transformation
Artificial Intelligence
Single Chart
Oliver Wyman
Add to my slides
Remove from favorites
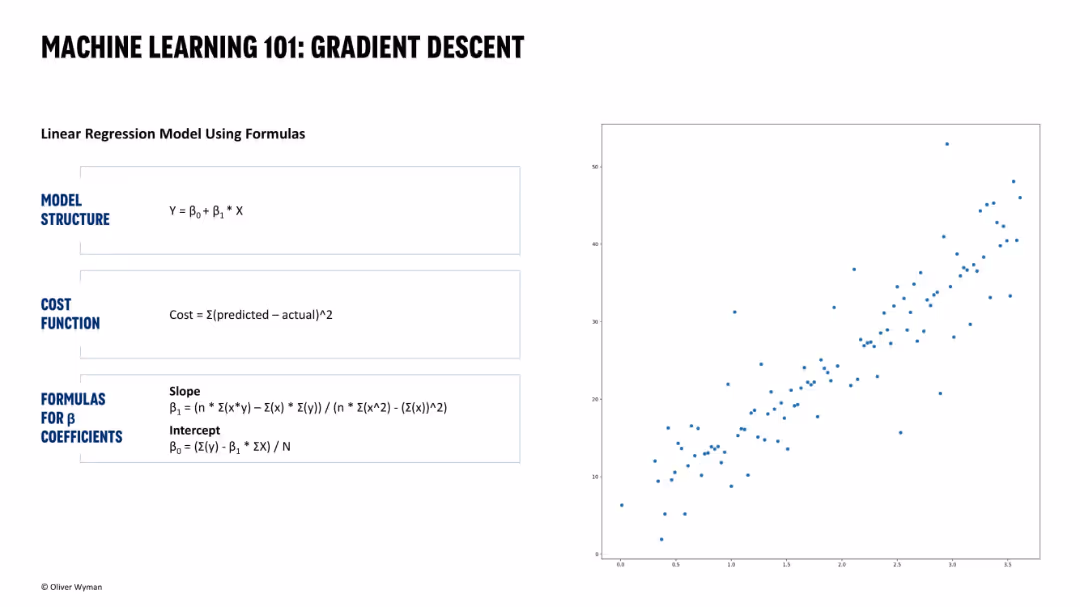
Left half shows linear regression formulas and cost function breakdown; right half displays a raw scatterplot. Simple and clean black-and-blue academic-style layout.
Technology and Digital Transformation
Artificial Intelligence
This introductory slide explains gradient descent using a linear regression example. It defines the model equation, cost function, and formulas for computing coefficients. A raw scatterplot helps visualize the data points the model is intended to fit. This slide is foundational and educative in nature.
gradient descent, machine learning, regression, cost function, linear model, scatterplot, formula
false
Technology and Digital Transformation
Artificial Intelligence
Single Chart
Oliver Wyman
Add to my slides
Remove from favorites
This slide includes tables comparing ownership structure, geographic footprint, port terminals, and recent investments of three major bulk handlers.
Competitive Landscape
Agriculture & Food Production
The slide compares three major bulk handlers in the grain industry, detailing their ownership, geographic reach, port terminal capacities, and recent investments.
Grain, Bulk Handlers, Comparison, Investment, Port
false
Competitive Landscape
Agriculture & Food Production
Multiple Chart
LEK
Add to my slides
Remove from favorites
This slide contains a comparative table with two columns, comparing grain and cement supply chains with metrics such as size, growth, and supply chain costs.
Market Analysis and Trends
Agriculture & Food Production
The slide compares the grain and cement supply chains based on various metrics to show why they were selected for review, highlighting key differences.
Grain, Cement, Supply Chain, Comparison, Metrics
false
Market Analysis and Trends
Agriculture & Food Production
Multiple Chart
LEK
Add to my slides
Remove from favorites
Column charts showing bulk shipments of grain by port and volume of grain loaded by state. Text discusses distribution across ports and container vs. bulk shipments.
Operational Efficiency
Transportation & Logistics
The slide provides an analysis of grain export logistics in Australia, detailing the distribution of bulk and container shipments across various ports and states.
grain exports, logistics, ports, bulk shipments, container shipments
false
Operational Efficiency
Transportation & Logistics
Multiple Chart
LEK
Add to my slides
Remove from favorites
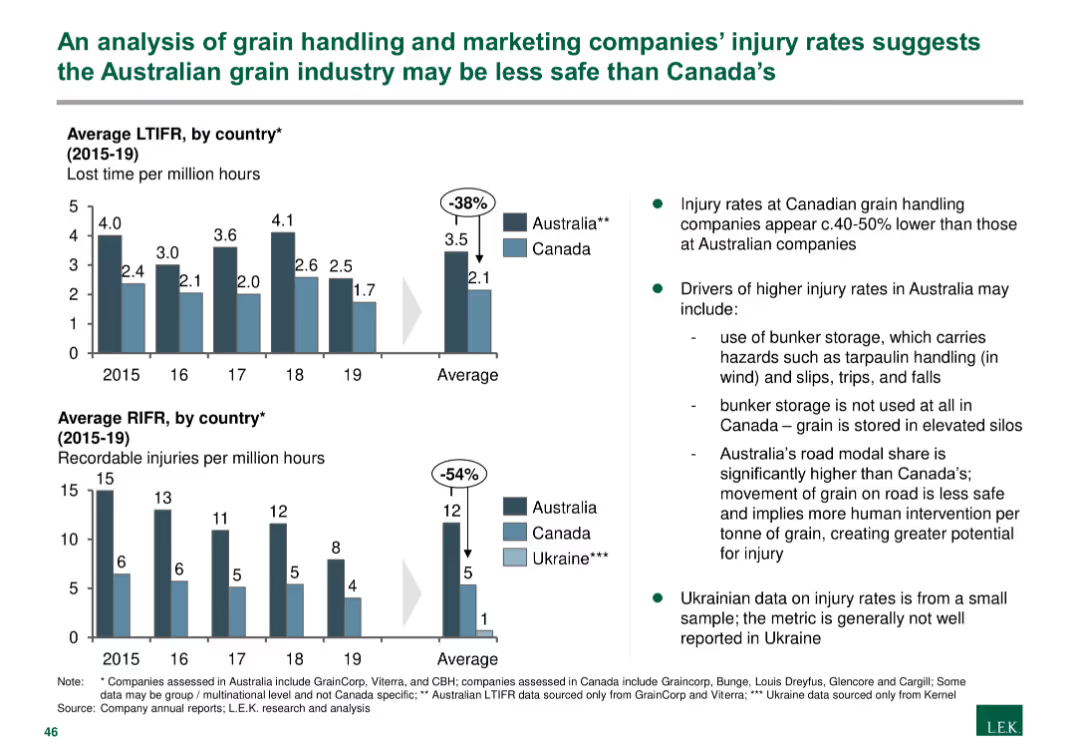
The slide presents column charts comparing lost time injury frequency rates (LTIFR) and recordable injury frequency rates (RIFR) in Australia, Canada, and Ukraine.
Risk Assessment and Management
Agriculture & Food Production
The slide analyzes safety metrics in the grain handling industry, showing that injury rates in Australia are higher than in Canada, with detailed notes on contributing factors and implications for safety management.
Grain handling, injury rates, safety, Australia, Canada, Ukraine, risk assessment, agriculture, food production
false
Risk Assessment and Management
Agriculture & Food Production
Multiple Chart
LEK
Add to my slides
Remove from favorites
The slide contains a timeline showing changes in ownership among major companies handling Australian grain, with different colored bars for handlers, marketers, and port operators.
Competitive Landscape
Agriculture & Food Production
This slide presents a timeline of the grain industry’s changes over ten years, highlighting consolidation among bulk handlers and new market entrants in rail and ports.
Grain, Industry, Timeline, Consolidation, Ownership
false
Competitive Landscape
Agriculture & Food Production
Diagram
LEK
Add to my slides
Remove from favorites
Diagram showing the flow of grain through various stages, from on-farm storage to domestic processing and export, with accompanying text explaining modal shares.
Operational Efficiency
Transportation & Logistics
The slide explains the different paths grain takes within Australia, from storage to domestic processing or export, and the modal shares of transport methods.
grain path, storage, domestic processing, export, modal shares
false
Operational Efficiency
Transportation & Logistics
Diagram
LEK
Add to my slides
Remove from favorites
This slide presents a table with performance indicators for Australia's grain supply chain, using color coding to highlight areas of strength and weakness.
Operational Efficiency
Agriculture & Food Production
The slide evaluates the efficiency of Australia's grain supply chain, identifying areas where it meets or exceeds benchmarks, as well as areas needing improvement, particularly in rail and port operations.
Grain supply chain, Australia, performance indicators, rail efficiency, port efficiency, benchmarking, operational efficiency, agriculture
false
Operational Efficiency
Agriculture & Food Production
Table
LEK
Add to my slides
Remove from favorites
Features a world map with export impacts and column charts detailing grain trade forecasts, focusing on geographic and quarterly variations.
Market Analysis and Trends
Transportation & Logistics
Discusses global grain trade dynamics influenced by geopolitical and environmental factors, with detailed forecasts and regional analysis.
grain trade, global market, export forecasts, geopolitical impact, environmental factors
false
Market Analysis and Trends
Transportation & Logistics
Multiple Chart
Deutsche Bank
Add to my slides
Remove from favorites
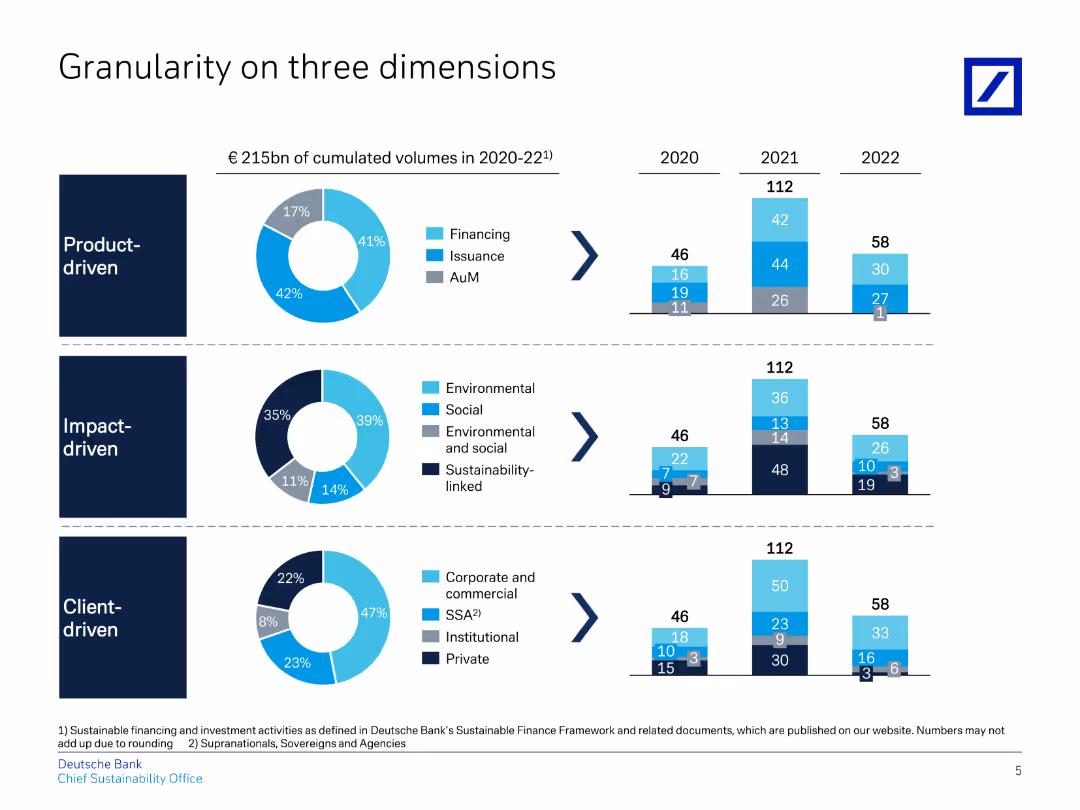
The slide includes three sections: product-driven, impact-driven, and client-driven, each with a pie chart and a column chart.
Market Analysis and Trends
Financial Services
Provides a detailed breakdown of cumulated volumes across different dimensions: product, impact, and client, with visual data.
granularity, product, impact, client, volumes
false
Market Analysis and Trends
Financial Services
Multiple Chart
Deutsche Bank
Add to my slides
Remove from favorites
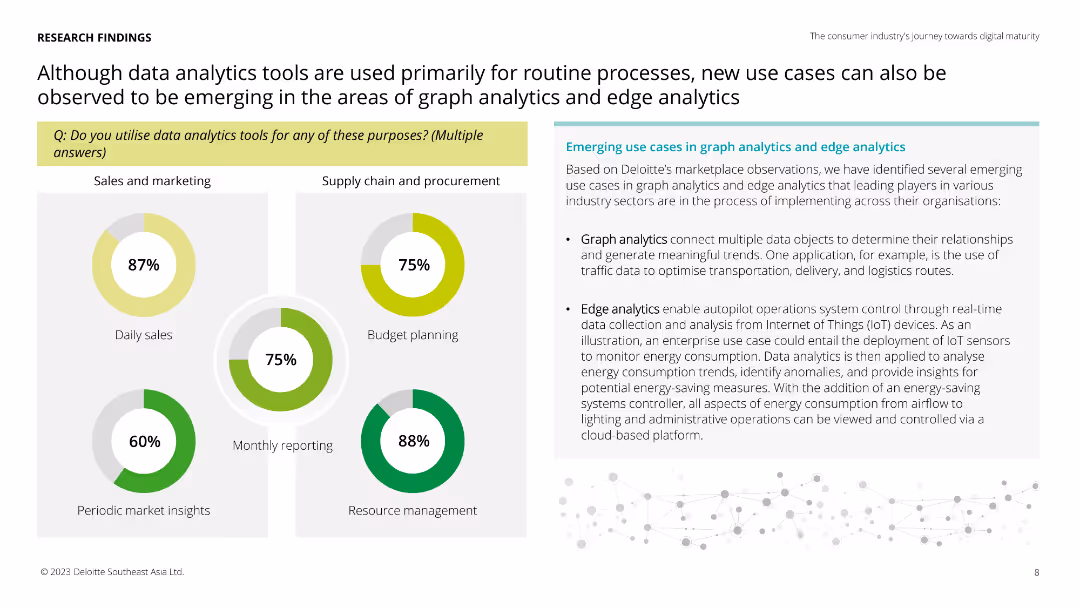
Circular charts showing the usage of data analytics tools for various purposes and descriptions of emerging use cases in graph analytics and edge analytics.
Technology and Digital Transformation
Technology & Software
The slide discusses new use cases in graph and edge analytics, highlighting their applications in sales, marketing, and supply chain management. Useful for identifying innovative uses of data analytics technologies.
graph analytics, edge analytics, use cases, applications
false
Technology and Digital Transformation
Technology & Software
Multiple Chart
Deloitte
Add to my slides
Remove from favorites
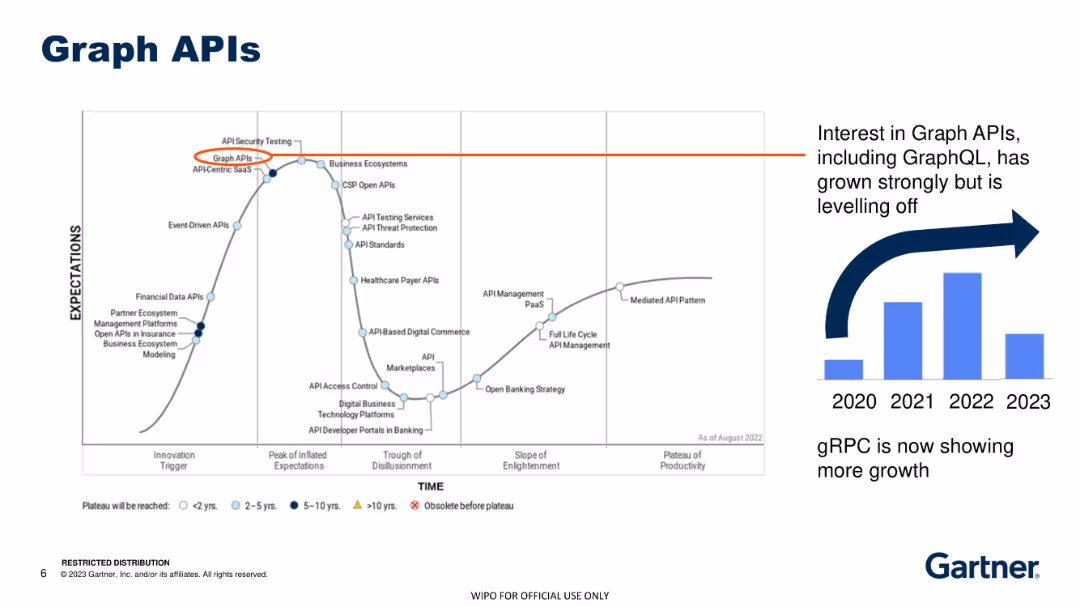
Line graph illustrating the adoption trends for Graph APIs, highlighting steady growth until 2023, with a secondary graph comparing the rise of gRPC.
Technology and Digital Transformation
Technology & Software
The slide examines the interest in Graph APIs and their adoption trends over recent years, noting the shift towards gRPC as the newer growth trend.
Graph APIs, gRPC, adoption trends, technology
false
Technology and Digital Transformation
Technology & Software
Multiple Chart
Gartner
Add to my slides
Remove from favorites
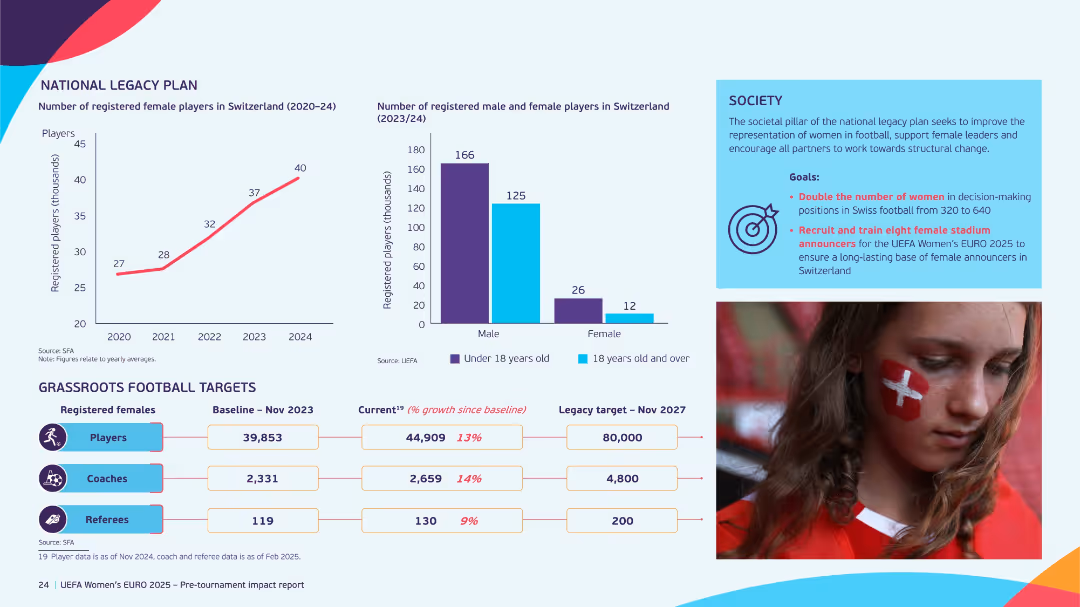
Blue-accented layout with two graphs on registered players, grassroots targets in tabular format, and a large image of a female fan.
Strategic Planning
Education & Training
The slide presents the goals of the Swiss national legacy plan for women’s football, focusing on player registration growth, grassroots targets, and societal change. It aims to double women's leadership roles and expand participation through clear metrics and timelines.
grassroots, women in football, legacy plan, registration growth, targets, youth development
false
Strategic Planning
Education & Training
Multiple Chart
EY
Add to my slides
Remove from favorites
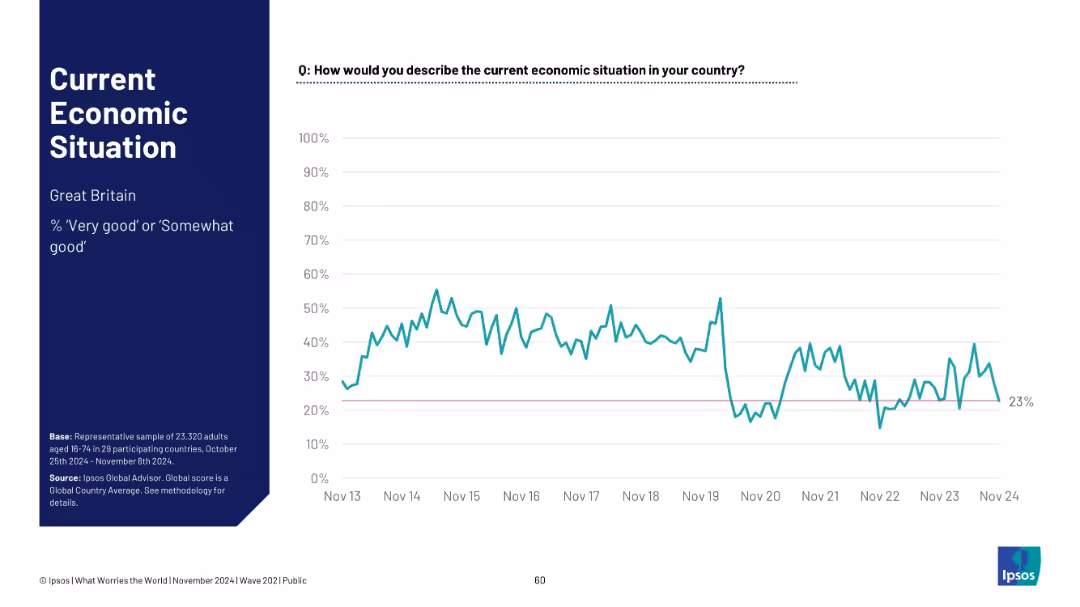
Layout mirrors previous slides; data for Great Britain. Title and summary left; sentiment trend graph right
Market Analysis and Trends
Government & Public Sector
Economic sentiment in Great Britain currently stands at 23%. The line graph shows significant fluctuation, with a major dip around 2020 and partial recovery in recent years.
Great Britain, economy perception, public sentiment, Ipsos report, economic evaluation, trend chart, UK economy
false
Market Analysis and Trends
Government & Public Sector
Single Chart
IPSOS
Add to my slides
Remove from favorites
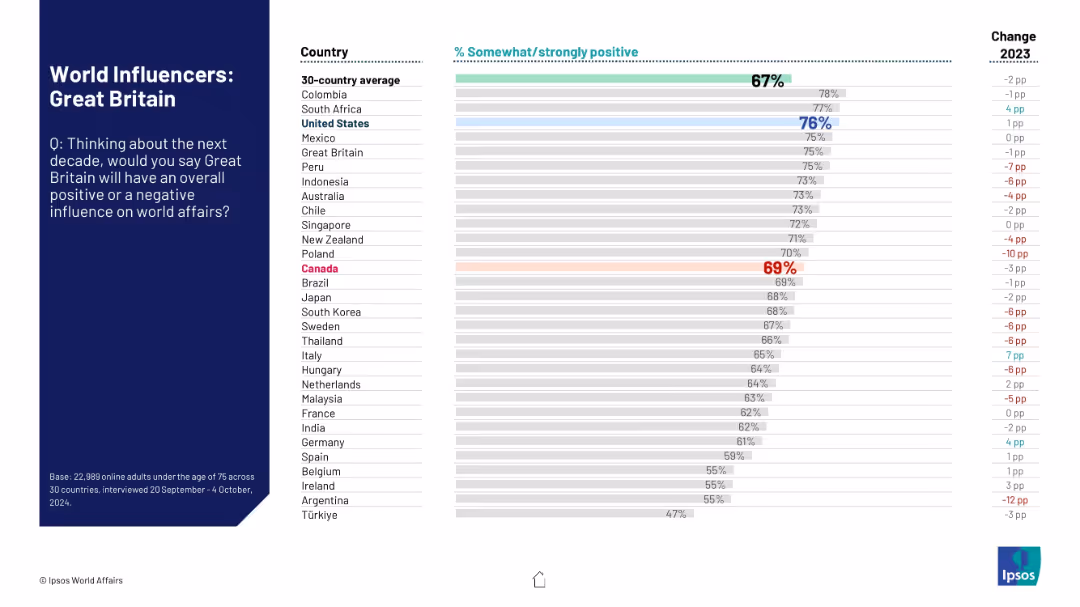
Split layout with dark blue title section on the left and a horizontal bar graph with country rankings on right.
Market Analysis and Trends
Government & Public Sector
The slide shows global perceptions of Great Britain's future influence on world affairs over the next decade. It includes a comparison across 30 countries, showing the percentage of people who view the UK's influence positively.
Great Britain, perception, influence, global opinion, Ipsos, bar chart, public opinion, international relations, positive impact, 2024 survey
false
Market Analysis and Trends
Government & Public Sector
Mixed Chart
IPSOS
Add to my slides
Remove from favorites
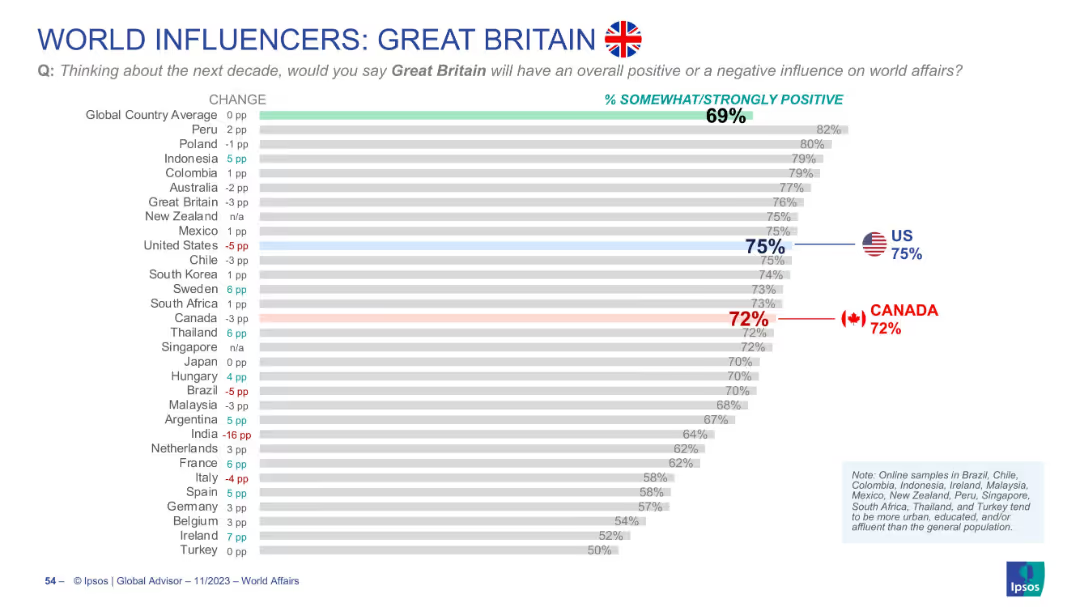
Horizontal bar chart showing international perceptions of the UK’s global influence
Market Analysis and Trends
Government & Public Sector
Surveys global sentiment toward Great Britain’s influence. The global average is 69%. Canada rates it 72%, U.S. at 75%. Results show small shifts in opinion across countries.
Great Britain, UK, global sentiment, Canada opinion, US opinion, Ipsos, bar chart, soft power, international views
false
Market Analysis and Trends
Government & Public Sector
Single Chart
IPSOS
Add to my slides
Remove from favorites
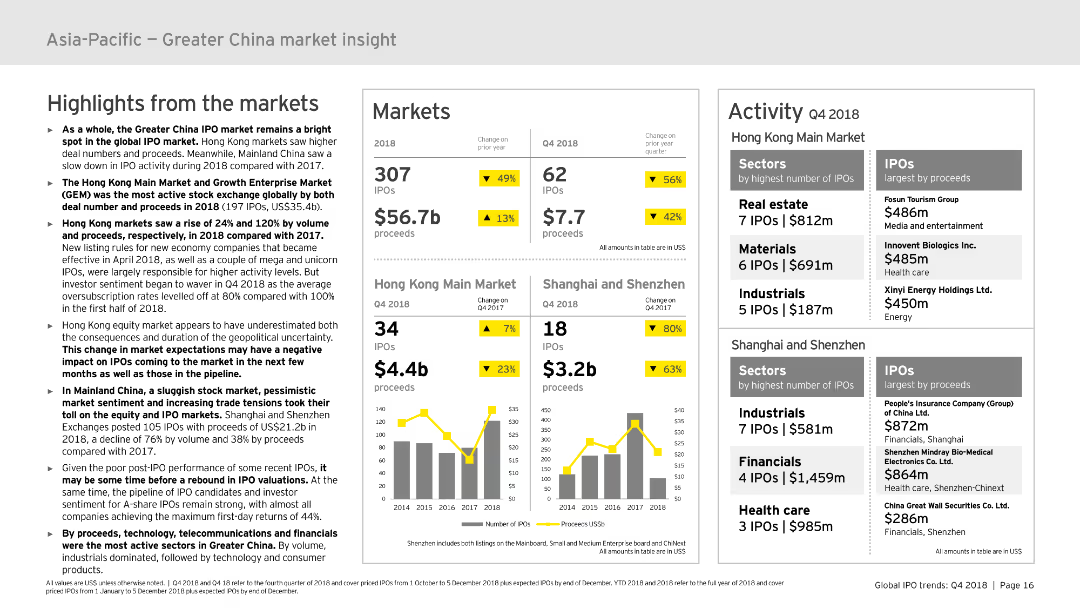
The slide includes several sections: highlights from the market, markets, and activity. It uses column charts and data tables to present detailed information on IPO activities and proceeds within the Greater China region. The visual complexity is moderate, ensuring clarity and effective communication of data.
Market Analysis and Trends
Financial Services
Provides an overview of the Greater China IPO market in 2018, covering key highlights, market performance, and detailed activity data for Hong Kong and Mainland China. Useful for market analysis and strategic planning.
Greater China, IPO, market insight, Hong Kong, Mainland China
false
Market Analysis and Trends
Financial Services
Multiple Chart
EY
Add to my slides
Remove from favorites
The slide features a pie chart and a bar graph depicting the likelihood of employees seeking new employment within the next 12 months, segmented by age group. The design is straightforward with a clear visual hierarchy that directs attention to the key data points.
Human Resources and Talent Management
Professional Services
This slide presents data from a global workforce survey, highlighting the ongoing trend of the Great Resignation and its impact on employee retention across different age groups. It's particularly relevant for human resources discussions on strategies to improve employee retention and engagement.
Great Resignation, Employee Retention, Workforce, Age Groups, Survey Data, Pie Chart
false
Human Resources and Talent Management
Professional Services
Multiple Chart
PwC/Strategy&
Add to my slides
Remove from favorites
The slide includes three donut charts representing the impact of the Great Resignation on different experience levels across total, hedge fund, and private equity sectors. An image on the left shows a meeting setting. The charts use shades of orange and red.
Human Resources and Talent Management
Financial Services
The slide discusses how the Great Resignation has most affected employees with 4-10 years of experience and highlights concerns about employee turnover rates among managers and investors.
Great Resignation, employee turnover, talent management, hedge fund, private equity
false
Human Resources and Talent Management
Financial Services
Multiple Chart
EY
Add to my slides
Remove from favorites
Slide includes bar charts with detailed percentages, showing the impact of the Great Resignation across various company sizes and revenue brackets.
Human Resources and Talent Management
Professional Services
Evaluates the extent of employee resignations within marketing teams across different sectors, useful for HR strategy and workforce planning.
Great Resignation, marketing departments, HR, employee turnover, sector analysis
false
Human Resources and Talent Management
Professional Services
Multiple Chart
Deloitte
Add to my slides
Remove from favorites
The slide features an aerial image of an industrial site with large storage tanks. Overlaid is a pie chart showing how respondents’ perceptions of Greece have changed, with five segments in the chart.
Market Analysis and Trends
Real Estate & Construction
The slide provides data on how perceptions of Greece as a business location have improved, with a majority of respondents reporting a positive change in the last year.
Greece, attractiveness, perception, business location, industrial
false
Market Analysis and Trends
Real Estate & Construction
Mixed Chart
EY
Add to my slides
Remove from favorites
Column charts showing NPE ratios, NPE volumes, and loan loss provisions for top Greek banks.
Risk Assessment and Management
Financial Services
Details the progress of Greek banks in managing NPEs and loan loss provisions, focusing on financial stability and risk reduction.
Greece, banks, NPE, risk, management
false
Risk Assessment and Management
Financial Services
Multiple Chart
Deloitte
Add to my slides
Remove from favorites
Left side features a text list with associated percentages, indicating priorities. The right side shows an image of people in a discussion.
Strategic Planning
Government & Public Sector
Survey results showing where respondents believe Greece should focus to maintain its competitive position, including education, reducing taxes, and innovation support.
Greece, competitiveness, education, innovation, strategic priorities
false
Strategic Planning
Government & Public Sector
Mixed Chart
EY
Add to my slides
Remove from favorites
Left page includes a textual analysis with bullet points, while the right page features a vertical bar chart with percentages comparing perceptions among tech companies and the total sample.
Strategic Planning
Government & Public Sector
Discusses how Greece can enhance its image as a destination for investment, focusing on technology and innovation, with supporting survey data.
Greece, investment, technology, innovation, strategic image
false
Strategic Planning
Government & Public Sector
Mixed Chart
EY
Add to my slides
Remove from favorites
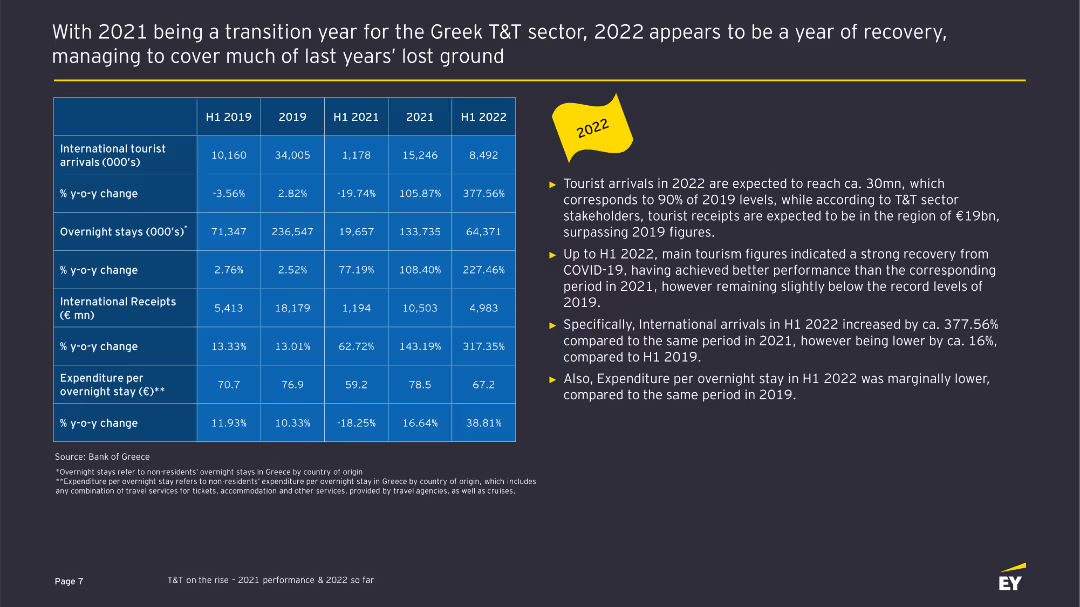
The slide includes a table comparing various metrics for international tourist arrivals, overnight stays, and receipts from 2019 to H1 2022. On the right, key highlights are listed in bullet points.
Financial Performance
Hospitality & Tourism
This slide provides a detailed comparison of the Greek tourism sector's performance metrics across different periods, highlighting recovery and trends.
Greek tourism, performance metrics, financial performance, sector analysis, tourism recovery
false
Financial Performance
Hospitality & Tourism
Table
EY
Add to my slides
Remove from favorites
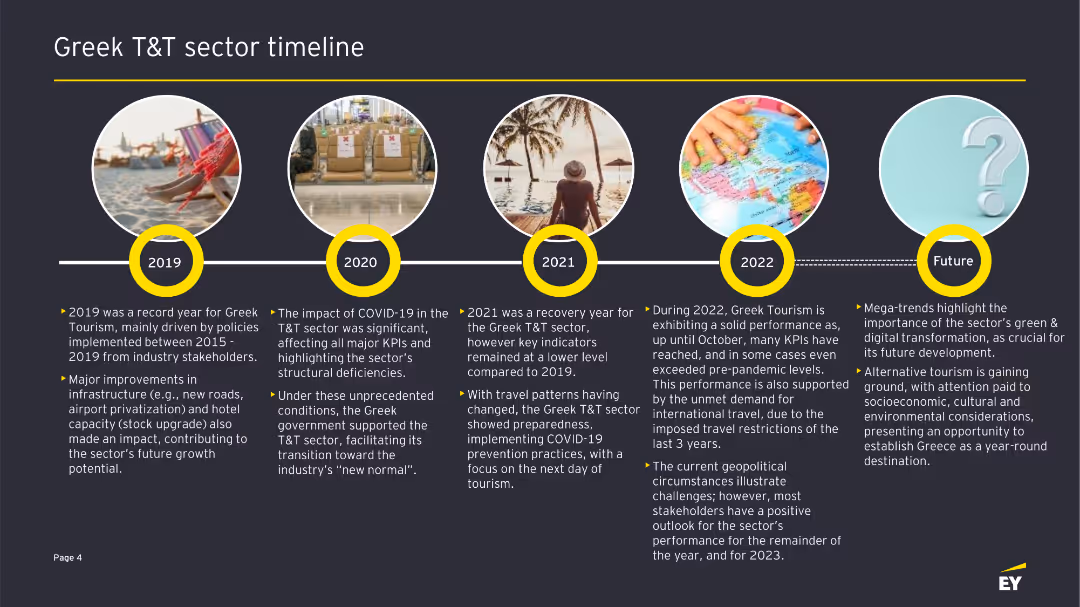
The slide displays a horizontal timeline with circular images and text boxes beneath each year from 2019 to the future, highlighting key events and trends in Greek tourism.
Strategic Planning
Hospitality & Tourism
This slide presents a timeline of significant events and trends in the Greek tourism and travel sector from 2019 to future projections.
Greek tourism, timeline, strategic planning, sector trends, travel industry
false
Strategic Planning
Hospitality & Tourism
Linear Flow
EY
Add to my slides
Remove from favorites
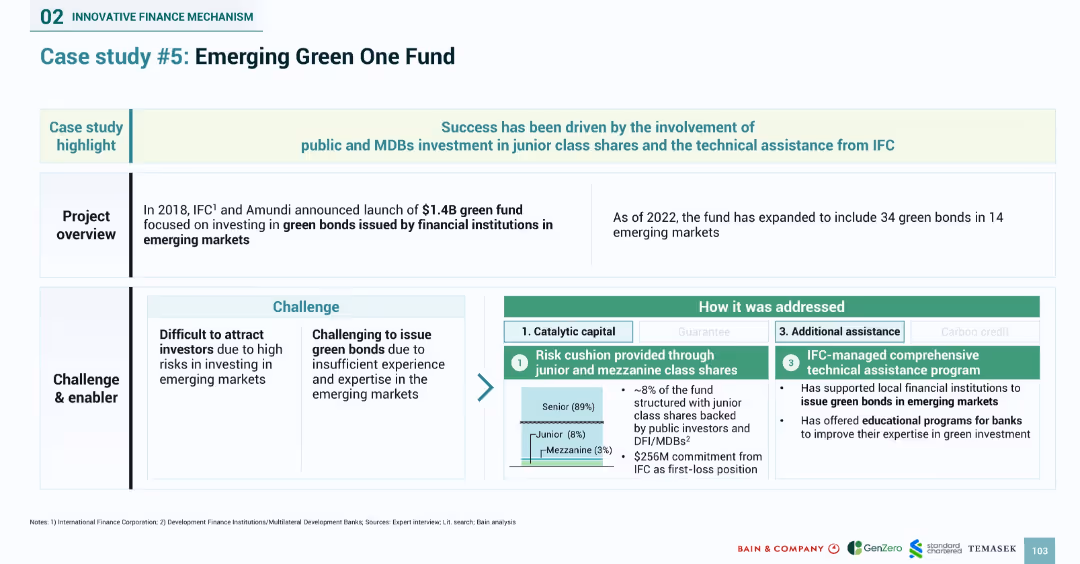
Structured case layout with challenges on the left, solutions on the right, and a fund composition pie chart in center. Color-coded risk mitigation methods.
Investment Analysis
Financial Services
Details the 2018 launch of a $1.4B green bond fund by IFC and Amundi targeting emerging markets. The case focuses on using junior and mezzanine shares to de-risk investments and outlines how technical assistance has enabled local institutions to issue green bonds. Describes the expanded reach of the fund and the IFC’s educational support programs.
green bonds, IFC, Amundi, emerging markets, junior equity, catalytic capital, technical assistance, risk cushion
false
Investment Analysis
Financial Services
Mixed Chart
Bain
Add to my slides
Remove from favorites
A text section with bullet points next to a pie chart illustrating the 2021 allocations by impact theme. The text outlines the framework and strategic objectives of green bond issuance, with an emphasis on alignment with climate transition and inclusive growth themes.
Regulatory and Compliance
Environmental Services & Sustainability
Details the company's commitment to sustainability through the issuance of green bonds, aligned with strategic themes such as clean energy and community support. It also outlines the annual impact and reporting strategy, illustrating the distribution of investments across various sustainability initiatives.
green bonds, sustainability, impact investment, climate transition, inclusive growth, pie chart
false
Regulatory and Compliance
Environmental Services & Sustainability
Mixed Chart
Goldman Sachs
Add to my slides
Remove from favorites
Shows a column chart depicting the growth of green bond activity from 2014 to 2019 YTD, along with text highlights about sustainable transition bonds and IPO activity.
Strategic Planning
Financial Services
The slide focuses on the growth of green bonds and sustainable finance initiatives, showcasing significant increases in green bond activity and strategic ESG goals.
Green Bonds, Sustainable Finance, ESG, Growth, IPO Activity
false
Strategic Planning
Financial Services
Mixed Chart
Credit Suisse
Add to my slides
Remove from favorites
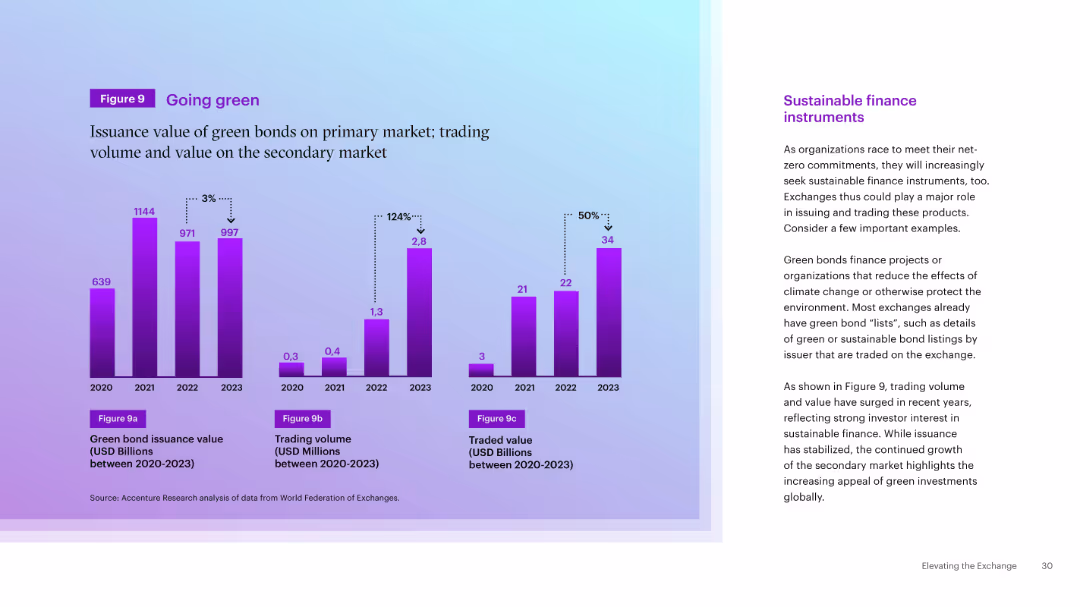
Triple bar chart showing green bond issuance, trading volume, and value from 2020–2023. Right-side explanatory text on sustainable finance.
Market Analysis and Trends
Financial Services
This slide visualizes the increasing issuance and trading of green bonds, reinforcing the rise of sustainable finance instruments. It shows a significant boost in trading value and volume, suggesting growing investor interest and exchange opportunity in ESG areas.
Green Bonds, Sustainable Finance, Trading, Market Trends, ESG, Exchanges, Environmental, Volume, Value
false
Market Analysis and Trends
Financial Services
Mixed Chart
Accenture
Add to my slides
Remove from favorites
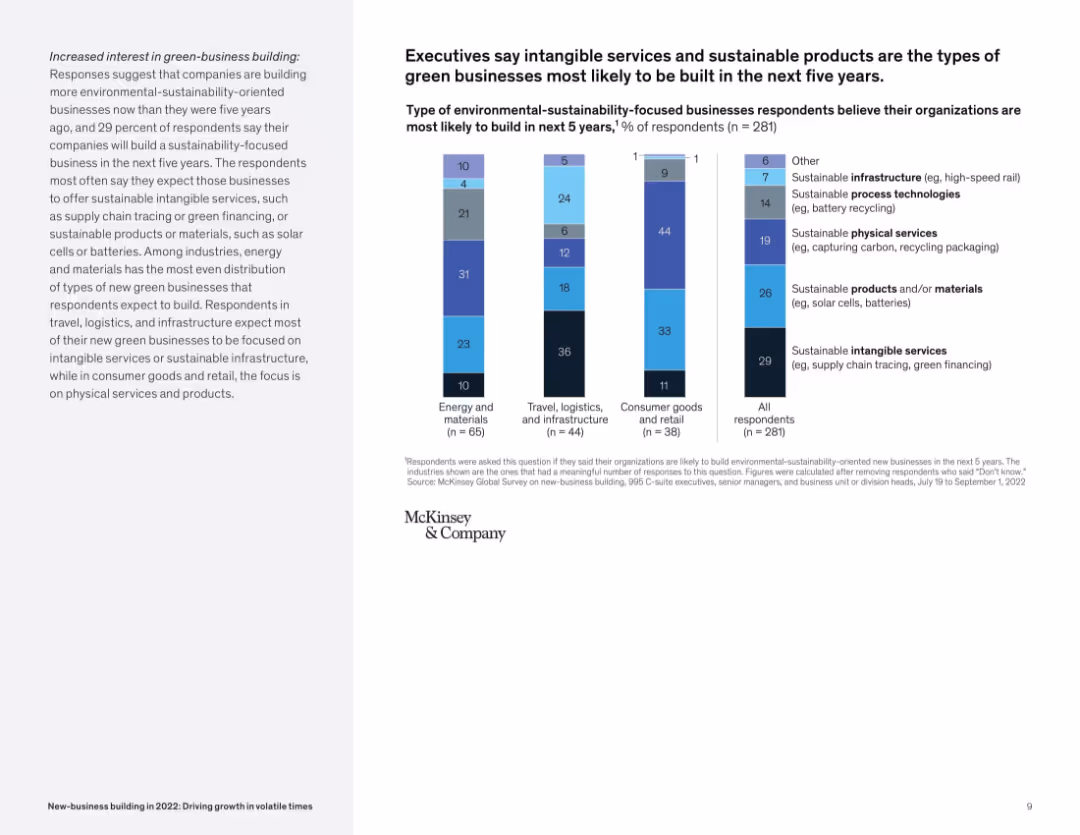
Vertical stacked bar chart of green-business types by industry, with explanatory sidebar; straightforward visual structure.
Market Analysis and Trends
Environmental Services & Sustainability
This slide focuses on expected green-business types in the next five years. Intangible services like green financing and sustainable products such as batteries are most likely to be built. It shows distinct preferences across industries.
green business, sustainability, new-business, renewable products, services, industry focus, environment
false
Market Analysis and Trends
Environmental Services & Sustainability
Mixed Chart
McKinsey
Add to my slides
Remove from favorites
Combines column headers and callouts with specific quotes from industry leaders, using green tones to emphasize 'green' capital.
Investment Analysis
Energy & Utilities
Analyzes trends in green capital deployment in Southeast Asia, discussing the landscape of sustainable investments and challenges in funding.
green capital, investment trends, SEA, sustainable investments, funding challenges
false
Investment Analysis
Energy & Utilities
Header Horizontal
Bain
Add to my slides
Remove from favorites
Showcases column chart and quotes within a visual narrative, using green tones to emphasize the thematic focus on 'green' investments.
Investment Analysis
Financial Services
Discusses the acceleration of green capital in Southeast Asia, identifying patterns and challenges in investment scalability.
green capital, SEA, investment trends, scalability, capital flow
false
Investment Analysis
Financial Services
Mixed Chart
Bain
Add to my slides
Remove from favorites
Column chart comparing the proportion of prominent and practical green consumers in different regions: APAC, LATAM, MEA.
Customer and Market Segmentation
Consumer Goods
The slide presents data on the prevalence of prominent versus practical green consumers across various regions, suggesting market strategies.
green consumers, APAC, LATAM, MEA, market strategy, segmentation, consumer behavior
false
Customer and Market Segmentation
Consumer Goods
Mixed Chart
Accenture
Add to my slides
Remove from favorites
The slide has a gradient background with white text and demographic data visualization
Market Analysis and Trends
Environmental Services & Sustainability
It presents research on consumer attitudes towards green consumption and eco-friendly offerings
Green Consumption, Eco-Friendly, Consumer Attitudes, Survey, Innovation
false
Market Analysis and Trends
Environmental Services & Sustainability
Pillar
Accenture
Add to my slides
Remove from favorites
The slide juxtaposes text with images of diverse ecosystems and landscapes, employing a balanced layout. Portrays headers that succinctly present data points and summaries.
Strategic Planning
Environmental Services & Sustainability
Summarizes key challenges and actions necessary to scale the green economy, highlighting incentives, risk levers, and the importance of regional collaboration and financial strategies in SEA.
Green economy, decarbonization, SEA, financial strategies, regional collaboration
false
Strategic Planning
Environmental Services & Sustainability
Text Only
Bain
Add to my slides
Remove from favorites
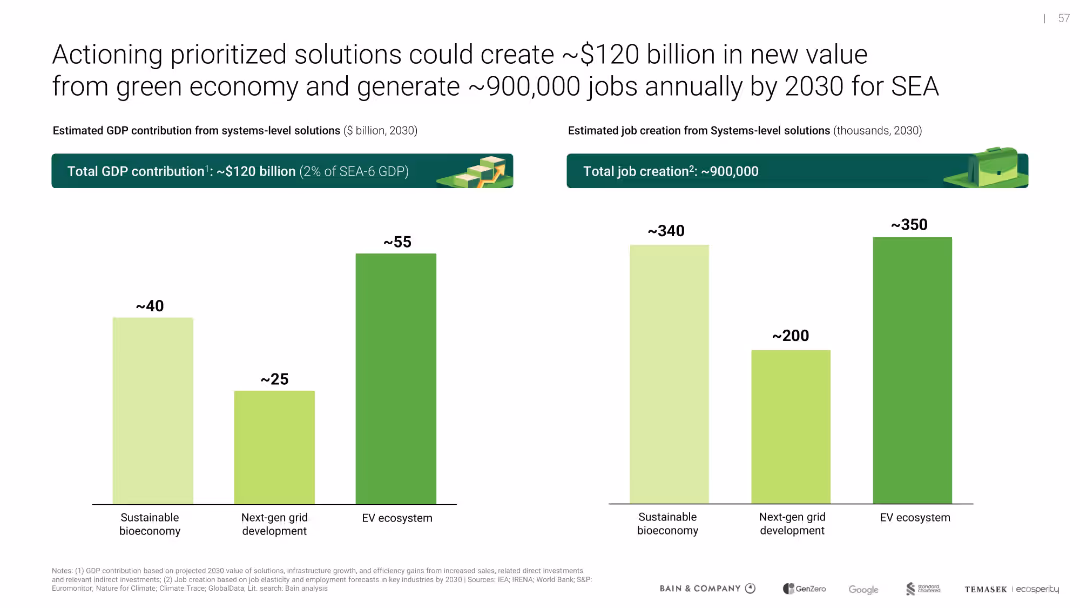
Dual bar charts showing GDP and job creation estimates, with clean green design and value labels
Investment Analysis
Environmental Services & Sustainability
Estimates the economic benefits of implementing green solutions in SEA, projecting ~$120B GDP impact and ~900K new jobs by 2030. EV ecosystem is shown as the highest contributor in both metrics.
green economy, GDP growth, job creation, EV ecosystem, economic impact, sustainability, SEA
false
Investment Analysis
Environmental Services & Sustainability
Multiple Chart
Bain
Add to my slides
Remove from favorites
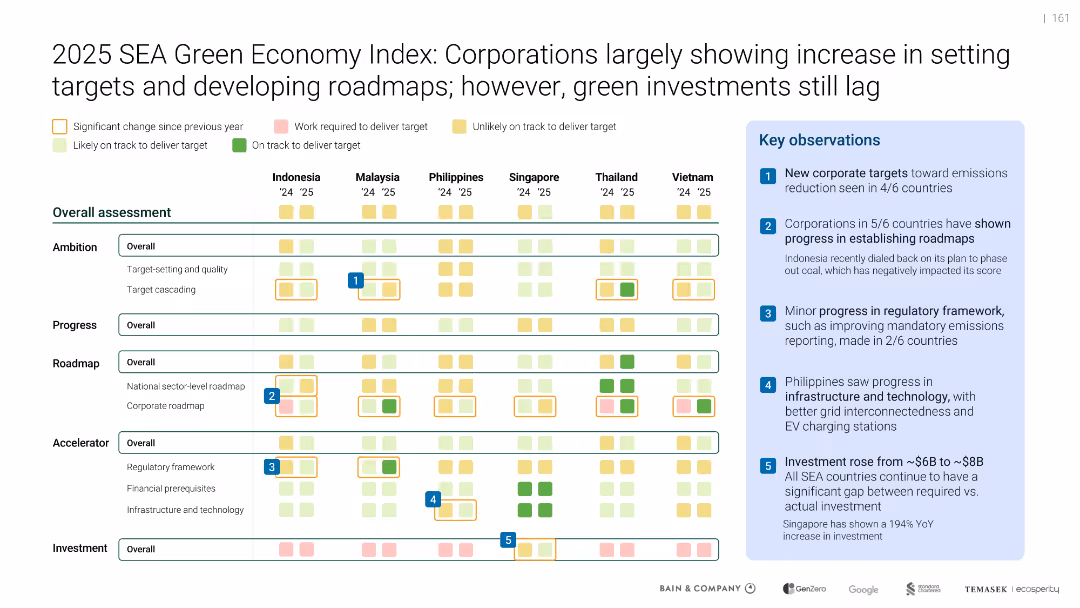
Matrix layout with colored squares indicating progress across ambition, roadmap, accelerator, and investment
Performance Metrics and KPIs
Environmental Services & Sustainability
Evaluates six SEA countries on ambition, progress, roadmaps, and enabling frameworks. Most countries improved in corporate targets and planning but still lag in green investments.
Green Economy Index, SEA countries, Corporate targets, Emissions, Roadmap, KPIs, Progress, Infrastructure
false
Performance Metrics and KPIs
Environmental Services & Sustainability
Mixed Chart
Bain
Add to my slides
Remove from favorites
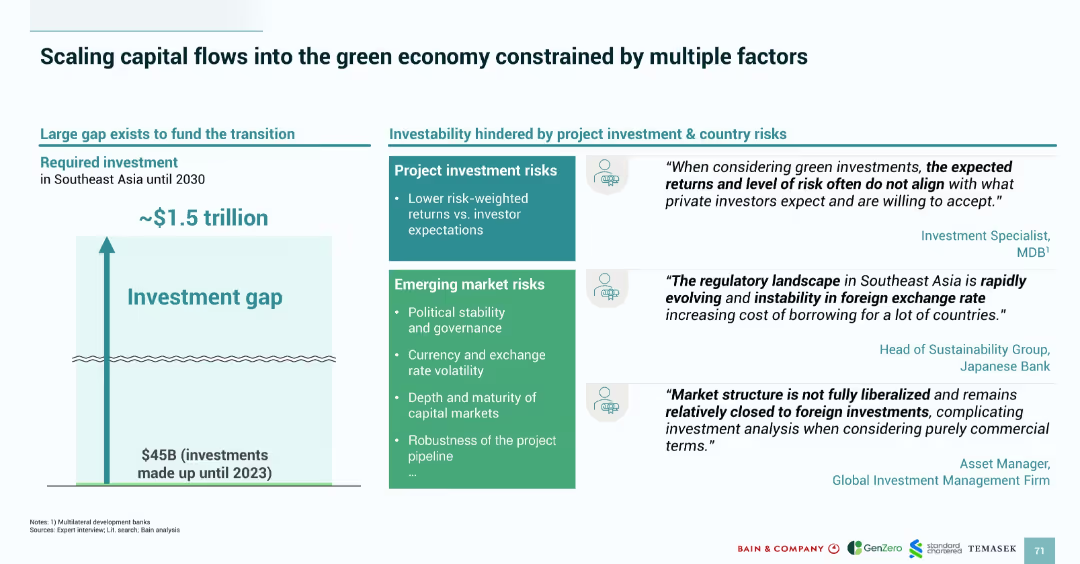
Split layout with a vertical bar graphic on the left showing a $1.5T investment gap and boxes on the right outlining project and market risks. Includes quotes from finance experts.
Investment Analysis
Financial Services
The slide addresses the investment gap (~$1.5T) required to fund Southeast Asia’s green transition and outlines risks that hinder investability—namely lower returns, political instability, currency volatility, and regulatory uncertainty. Expert quotes support the data, emphasizing challenges in attracting private sector finance due to perceived high risk.
green economy, investment gap, Southeast Asia, project risk, market risk, finance, regulation, currency, political stability
false
Investment Analysis
Financial Services
Mixed Chart
Bain
Add to my slides
Remove from favorites
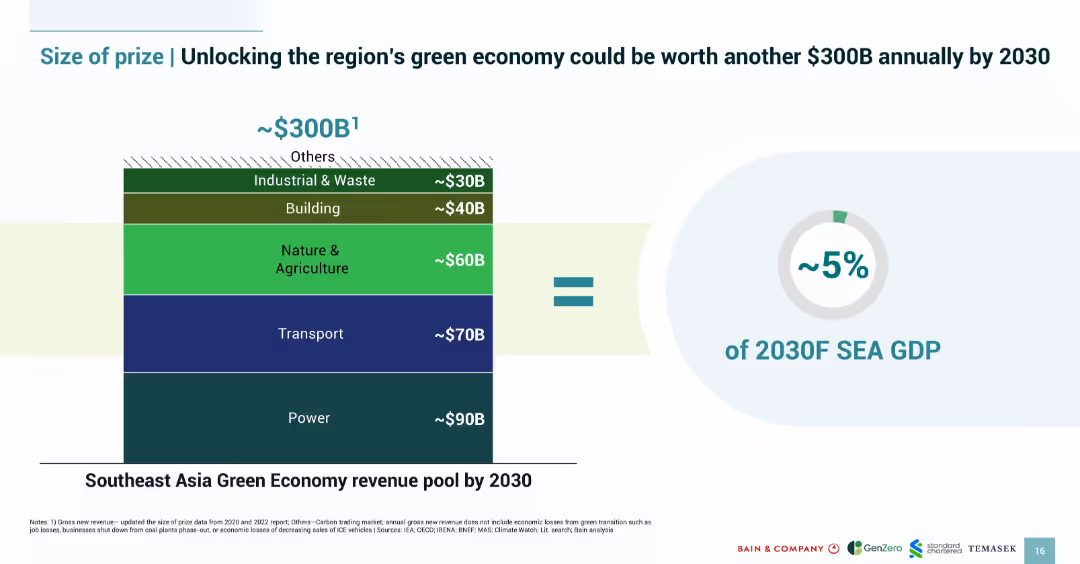
Vertical stacked bar chart with sectoral revenue pools on left, large equal sign, and GDP percentage metric on right; green color palette.
Investment Analysis
Environmental Services & Sustainability
Estimates ~$300B in annual revenue potential from Southeast Asia's green economy by 2030, equal to ~5% of projected SEA GDP. Breaks down potential across sectors like power, transport, agriculture, and buildings.
green economy, revenue pool, SEA, investment, GDP, sustainability, sectors
false
Investment Analysis
Environmental Services & Sustainability
Multiple Chart
Bain
Add to my slides
Remove from favorites
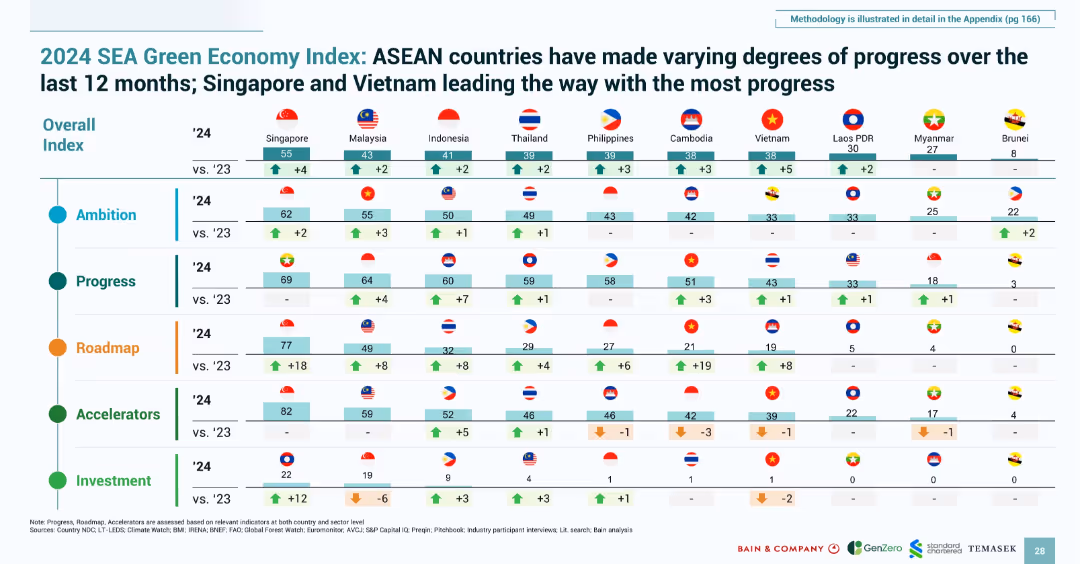
Matrix layout with country flags and numeric indicators across five pillars; structured, colorful table
Performance Metrics and KPIs
Environmental Services & Sustainability
This slide presents a comparative index of ASEAN countries’ progress across five dimensions: ambition, progress, roadmap, accelerators, and investment. Singapore and Vietnam are highlighted as leaders in green progress, based on recent gains in planning, infrastructure, and investments.
green economy, SEA index, sustainability, KPIs, ambition, investment, roadmap, ASEAN, climate
false
Performance Metrics and KPIs
Environmental Services & Sustainability
Single Chart
Bain
Add to my slides
Remove from favorites
Contains three column and icons representing different strategic areas like "Ecosystem co-innovation", "Transition support", and "Regional collaboration". It includes quotes and a brief analysis of SEA's current status in green initiatives.
Strategic Planning
Environmental Services & Sustainability
Discusses strategies for expanding the green economy in SEA through collaboration and innovation across various sectors, emphasizing the need for transition support and regional cooperation to address environmental challenges.
green economy, SEA, innovation, collaboration, sustainability
false
Strategic Planning
Environmental Services & Sustainability
Pillar
Bain
Add to my slides
Remove from favorites
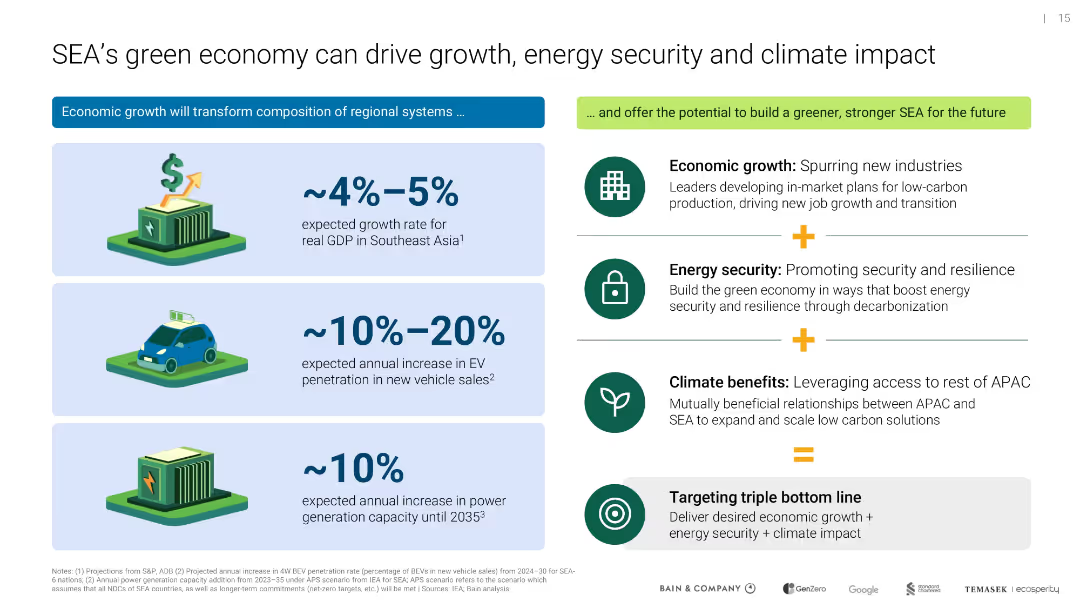
Two-column layout with graphics on left and summary points on right; bright icons and metrics highlight economic and environmental benefits
Market Analysis and Trends
Environmental Services & Sustainability
Highlights Southeast Asia’s green economy potential for GDP growth, EV adoption, and power generation, emphasizing economic, energy security, and climate benefits of regional transformation.
green economy, Southeast Asia, GDP, EV growth, energy security, climate impact
false
Market Analysis and Trends
Environmental Services & Sustainability
Table
Bain
Add to my slides
Remove from favorites
Combines text and background imagery of a forest. The slide outlines key points about the momentum in green investments and the strategic importance of 2022 for the region.
Market Analysis and Trends
Environmental Services & Sustainability
Summarizes the state of the green economy in Southeast Asia, detailing how 2022 serves as a pivotal year for enhancing public and private sector actions towards sustainable development goals, especially in the context of COP26 commitments.
green economy, Southeast Asia, sustainable development, COP26
false
Market Analysis and Trends
Environmental Services & Sustainability
Text Only
Bain
Add to my slides
Remove from favorites
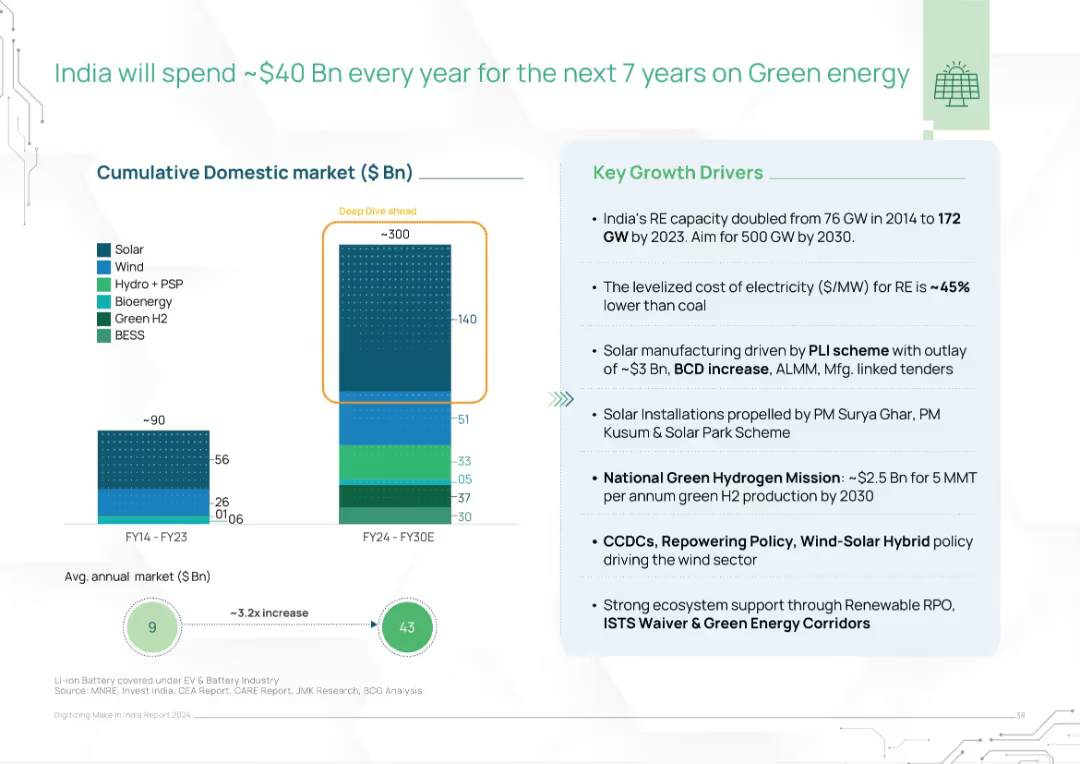
Left-aligned bar chart of projected cumulative market, right-aligned list of growth drivers, with colored segments by energy source
Market Analysis and Trends
Energy & Utilities
The slide projects India's annual green energy investment, reaching $40B/year through 2030. A bar graph illustrates historical vs. forecasted market growth by energy type. Key drivers include solar capacity expansion, cost reduction, hydrogen missions, and policy supports like PLI and repowering.
green energy, India, investment, solar, wind, hydrogen, policy, renewables, market growth, capacity
false
Market Analysis and Trends
Energy & Utilities
Mixed Chart
BCG
Add to my slides
Remove from favorites
Previous
Next
You don't have any favorites yet.
Please wait loading your favorites slides...
Create a FREE account to continue browsing
Receive Instant Access to 1,000+ slides from companies like McKinsey, Google, and Goldman Sachs
First Name
Last Name
Email
Password
I agree to all
Terms & Privacy Policy
Thank you! Your submission has been received!
Oops! Something went wrong while submitting the form.
Have an account?
Sign in
Upgrade to PRO to Save slides
Advanced Search and Filters
Access to 15,000+ slides
Access to Category Pages
Save/Bookmark Slides
PowerPoint Template Library
Pick a Plan
MONTHLY
$12/month
Billed every month, Cancel anytime.
YEARLY
$9/year
Billed $108 annually, Cancel anytime.
Checkout for $12/month
Checkout for $108/yr
Secured by Stripe | AES-256 bit encryption


![If [COUNTRY]’s government does not act now to combat climate change...](https://cdn.prod.website-files.com/654e70fb59937215cac87b19/6899c22ca99cd1f22e060a2a_RGMvda5XdEIOPFA76Mxz3sq9BprT25RMN5M0rb0xtFY.avif)


![To what extent do you agree or disagree with the following? [COUNTRY]’s government has a clear plan in place...](https://cdn.prod.website-files.com/654e70fb59937215cac87b19/6899c5c9526ac1c44abfaf47_v_gik-p2IdZsH2cu59ERVE0zp1QsmgpZfTwf2oro-f0.avif)