My Account
My Slides
Search by Category
Companies
Slide Type
Use Case
Industry
Pricing
Templates
View All Templates
Download Template Slides
✦ AI
AI Prompt Library
AI Search
Feedback
Login
Logout
Get Started
Browse all Slides
Browse all Slides
Create a FREE Account
Instant access to 1,000+ real slides from top companies like McKinsey, BCG, Goldman Sachs, Google and many more!
First Name
Last Name
Email
Password
I agree to all
Terms & Privacy Policy
Thank you! Your submission has been received!
Oops! Something went wrong while submitting the form.
Have an account?
Sign in
Saved Slides
Total No. of slides saved
0
↻ Refresh
✖ Clear all
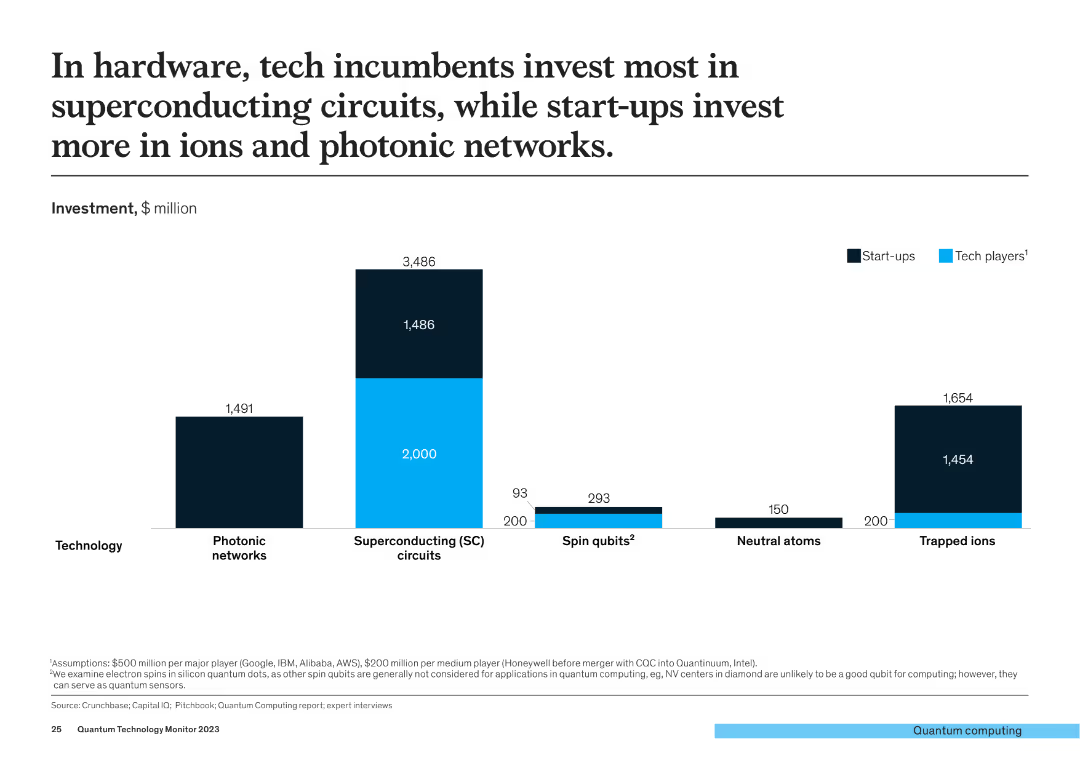
The slide contains a bar chart showing investment in different hardware technologies (Photonic networks, Superconducting circuits, Spin qubits, Neutral atoms, Trapped ions) by start-ups and tech players.
Investment Analysis
Financial Services
This slide compares investment in various hardware technologies by tech incumbents and start-ups, indicating a preference for superconducting circuits by tech players and ions and photonic networks by start-ups.
hardware, investment, tech incumbents, start-ups, superconducting circuits
false
Investment Analysis
Financial Services
Single Chart
McKinsey
Add to my slides
Remove from favorites
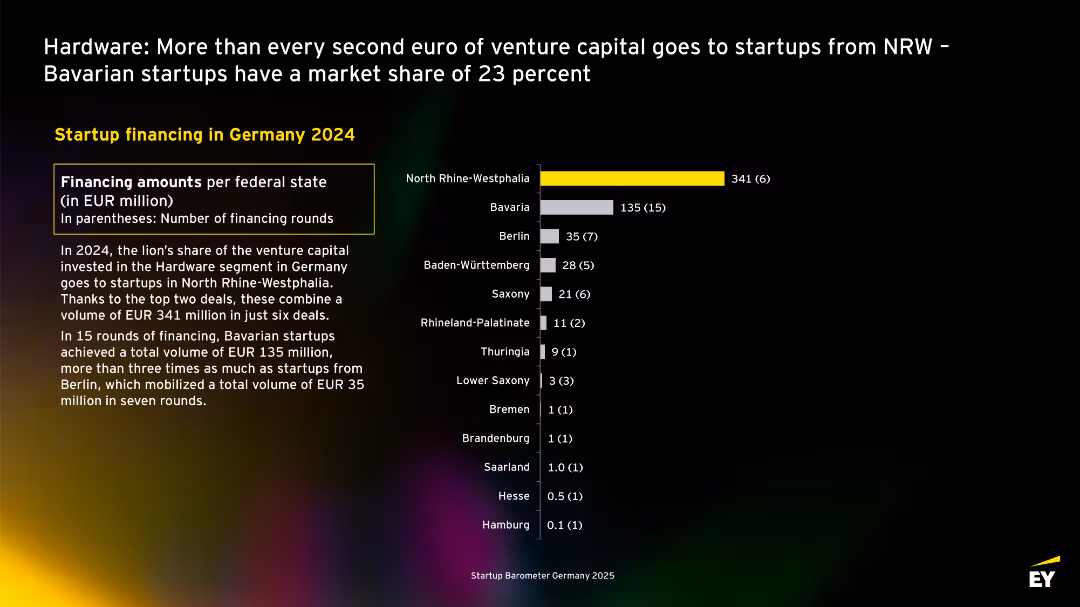
Same layout: bar chart of federal states on right, narrative and data table on left. NRW highlighted in yellow.
Investment Analysis
Technology & Software
Regional analysis of hardware startup funding shows North Rhine-Westphalia captured over half of all capital (EUR 341M). Bavaria follows distantly. The slide emphasizes regional concentration of investment.
hardware, NRW, Bavaria, startup, regional funding, 2024, venture capital, Germany
false
Investment Analysis
Technology & Software
Mixed Chart
EY
Add to my slides
Remove from favorites
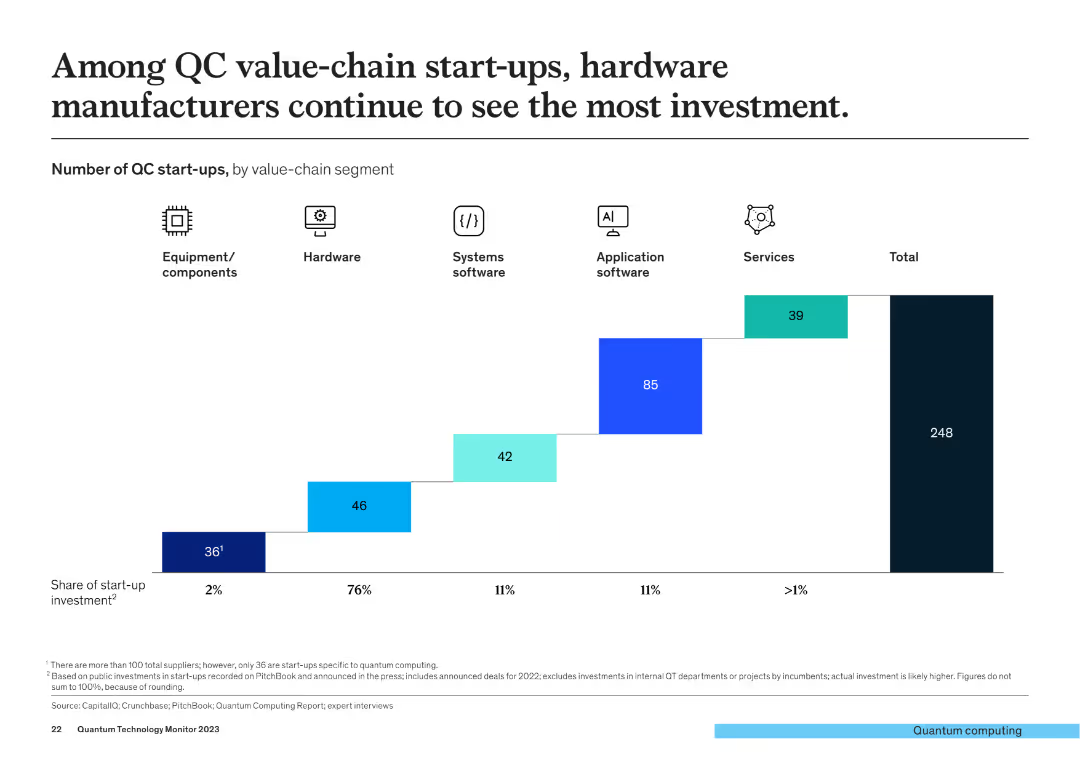
The slide features a bar chart showing the number of QC start-ups by value-chain segment (Equipment, Hardware, Systems software, Application software, Services) with the share of start-up investment indicated.
Investment Analysis
Financial Services
This slide highlights that hardware manufacturers among QC value-chain start-ups receive the most investment, with detailed segmentation of investment shares across different value-chain segments.
hardware, QC start-ups, value-chain, investment, segment analysis
false
Investment Analysis
Financial Services
Single Chart
McKinsey
Add to my slides
Remove from favorites
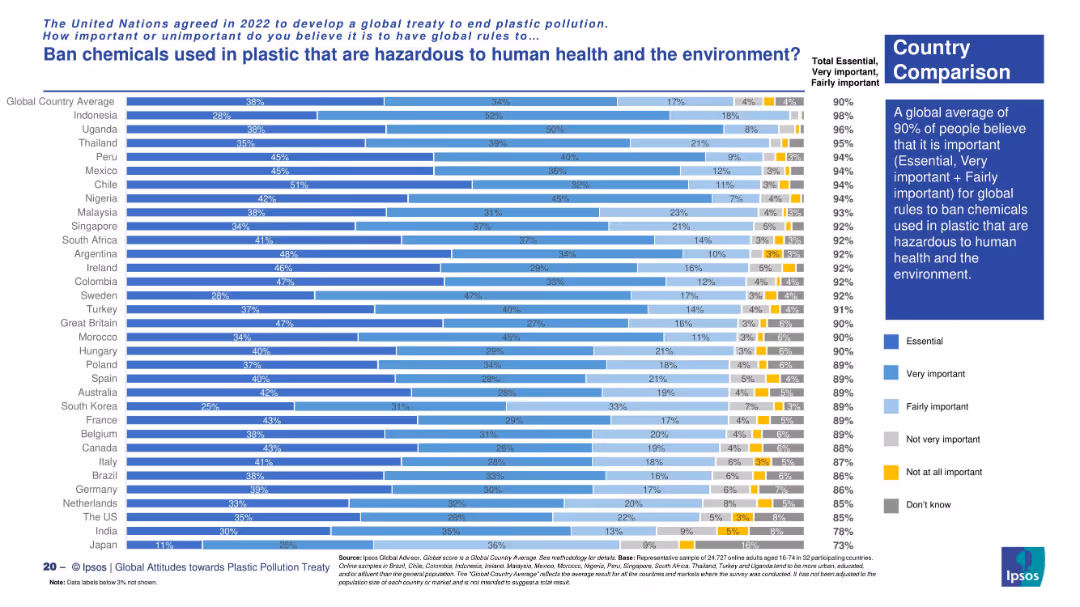
Vertical bar chart showing public opinion across countries. Uses multiple shades to represent importance levels, with a global insight box.
Risk Assessment and Management
Environmental Services & Sustainability
The chart reveals that 90% of global respondents support banning hazardous chemicals in plastics. The strongest support is seen in countries like Indonesia, Uganda, and Peru.
hazardous chemicals, plastic ban, public health, environment, UN treaty, global support, Ipsos
false
Risk Assessment and Management
Environmental Services & Sustainability
Mixed Chart
IPSOS
Add to my slides
Remove from favorites
Features a detailed process flow diagram of the H₂ value chain, highlighting upstream, midstream, and downstream opportunities for carbon fiber vessels.
Strategic Planning
Industrial & Manufacturing
The slide identifies strategic opportunities for carbon fiber vessels within the H₂ value chain, covering storage, transportation, and end-use markets.
H₂, Carbon Fiber Vessels, Value Chain, Opportunities, Storage
false
Strategic Planning
Industrial & Manufacturing
Linear Flow
Roland Berger
Add to my slides
Remove from favorites
The slide displays tables comparing cancellation policies and meal limits for HCPs across different companies.
Regulatory and Compliance
Healthcare & Pharmaceuticals
This slide provides a detailed comparison of HCP meal limits and speaker cancellation policies, crucial for compliance and event planning.
HCP, meal limits, cancellation policies, compliance, comparison
false
Regulatory and Compliance
Healthcare & Pharmaceuticals
Multiple Chart
Deloitte
Add to my slides
Remove from favorites
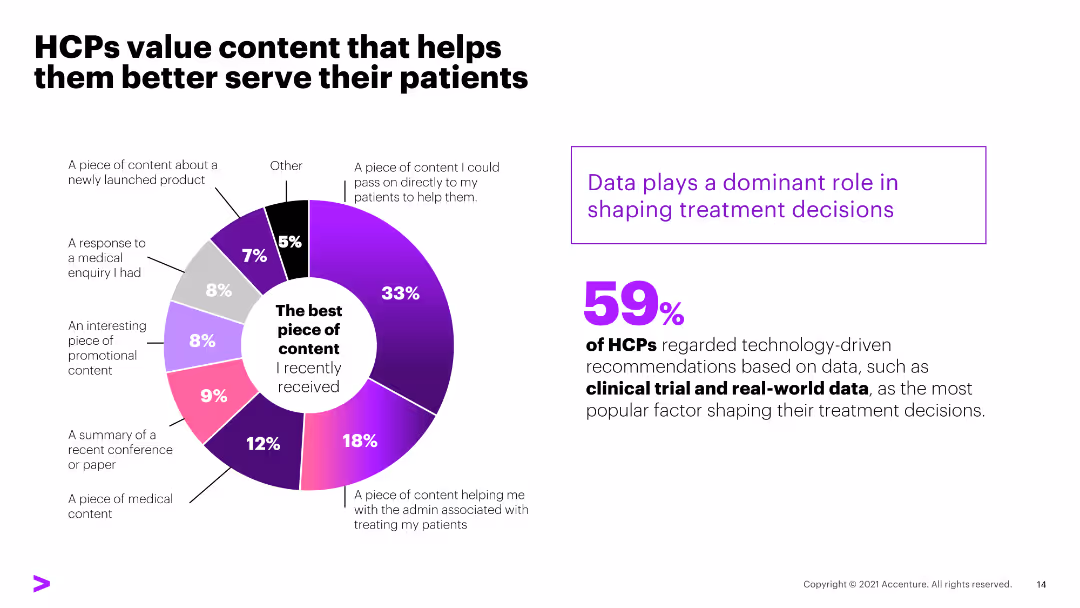
The slide features a circular chart in the center with percentages dividing different types of content valued by HCPs, and a large 59% statistic on the right in purple text.
Customer and Market Segmentation
Healthcare & Pharmaceuticals
The slide highlights that 59% of HCPs regarded technology-driven recommendations based on data, such as clinical trials and real-world data, as crucial for treatment decisions.
HCPs, content, patients, clinical data, technology
false
Customer and Market Segmentation
Healthcare & Pharmaceuticals
Mixed Chart
Accenture
Add to my slides
Remove from favorites
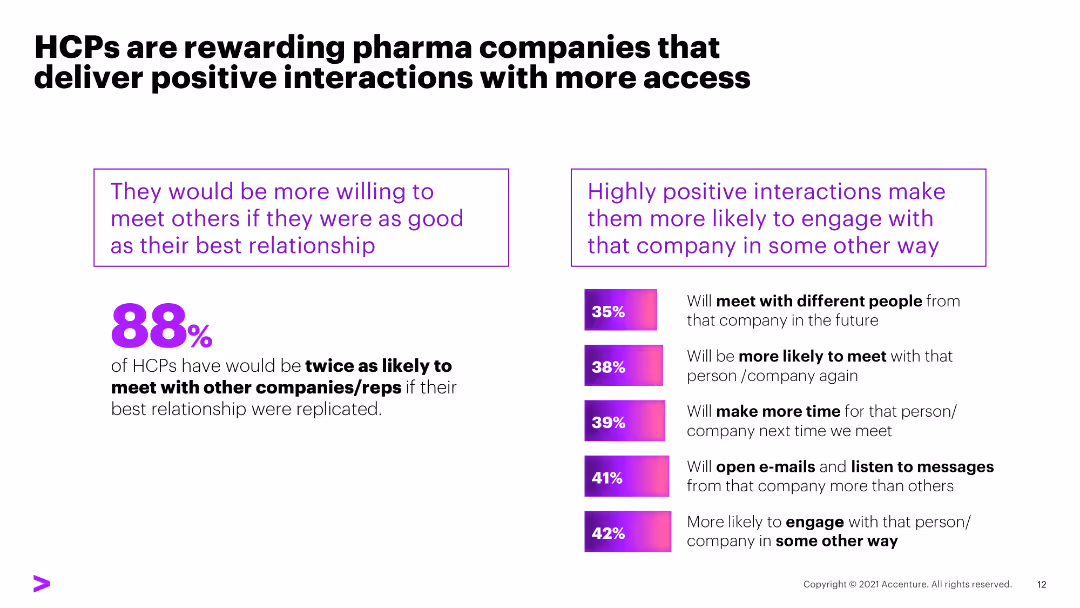
The slide contains a large statistic (88%) in bold purple text on the left and a column chart with various percentages on the right, each indicating a specific interaction behavior.
Customer and Market Segmentation
Healthcare & Pharmaceuticals
The slide shows that 88% of healthcare professionals (HCPs) would be twice as likely to meet with other companies/reps if their best relationship was replicated.
HCPs, interactions, pharma, engagement, statistics
false
Customer and Market Segmentation
Healthcare & Pharmaceuticals
Mixed Chart
Accenture
Add to my slides
Remove from favorites
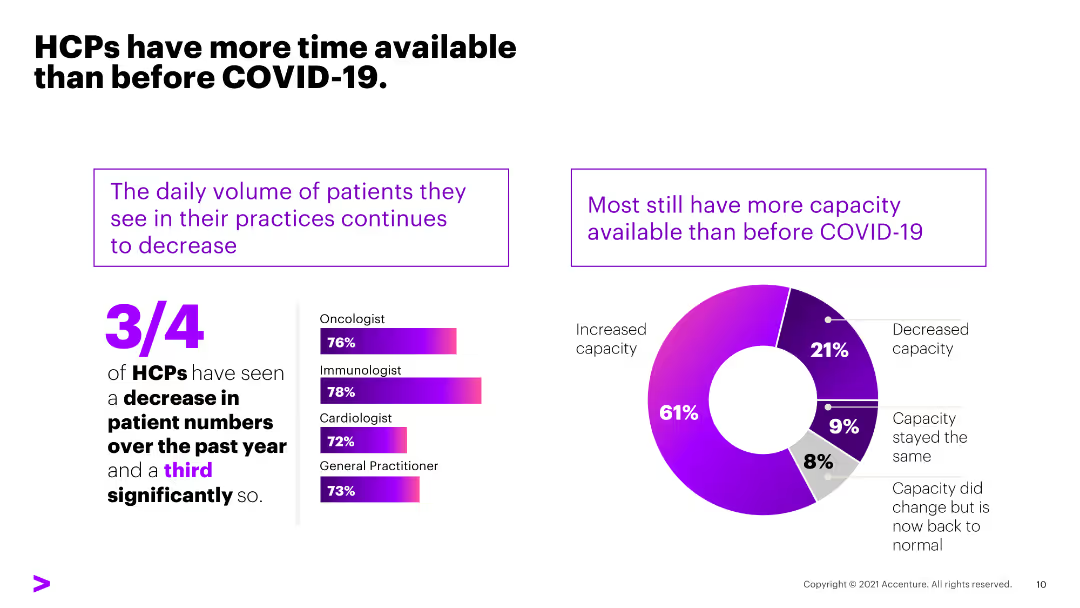
The slide has a white background with text and a donut chart on the right showing the change in patient volume. The left side contains text discussing the availability of HCPs.
Market Analysis and Trends
Healthcare & Pharmaceuticals
This slide highlights that HCPs have more available time due to a decrease in patient numbers during COVID-19, with detailed statistics on the change in patient volume by specialty.
HCPs, patient volume, COVID-19, availability, time, healthcare, decrease, capacity, specialty
false
Market Analysis and Trends
Healthcare & Pharmaceuticals
Multiple Chart
Accenture
Add to my slides
Remove from favorites
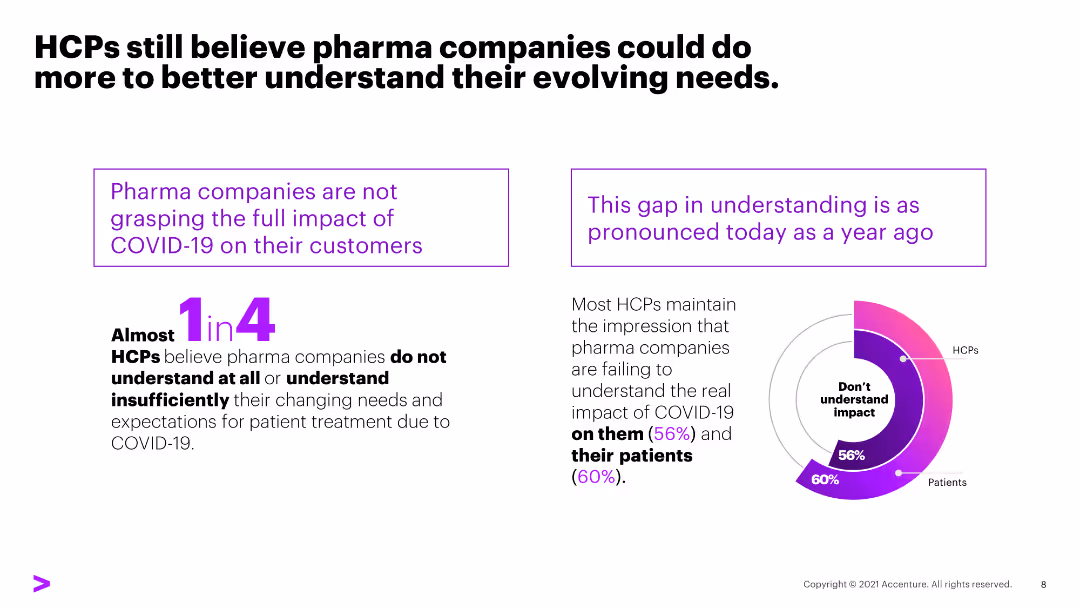
The slide has a white background with text and two key points highlighted in boxes. On the right, there's a column chart showing HCPs' perceptions of pharma companies' understanding.
Market Analysis and Trends
Healthcare & Pharmaceuticals
This slide discusses the gap in understanding the impact of COVID-19 on HCPs and their patients, highlighting the need for pharma companies to better understand evolving needs.
HCPs, pharma companies, COVID-19, understanding, patient needs, healthcare, perceptions, gap, impact
false
Market Analysis and Trends
Healthcare & Pharmaceuticals
Mixed Chart
Accenture
Add to my slides
Remove from favorites
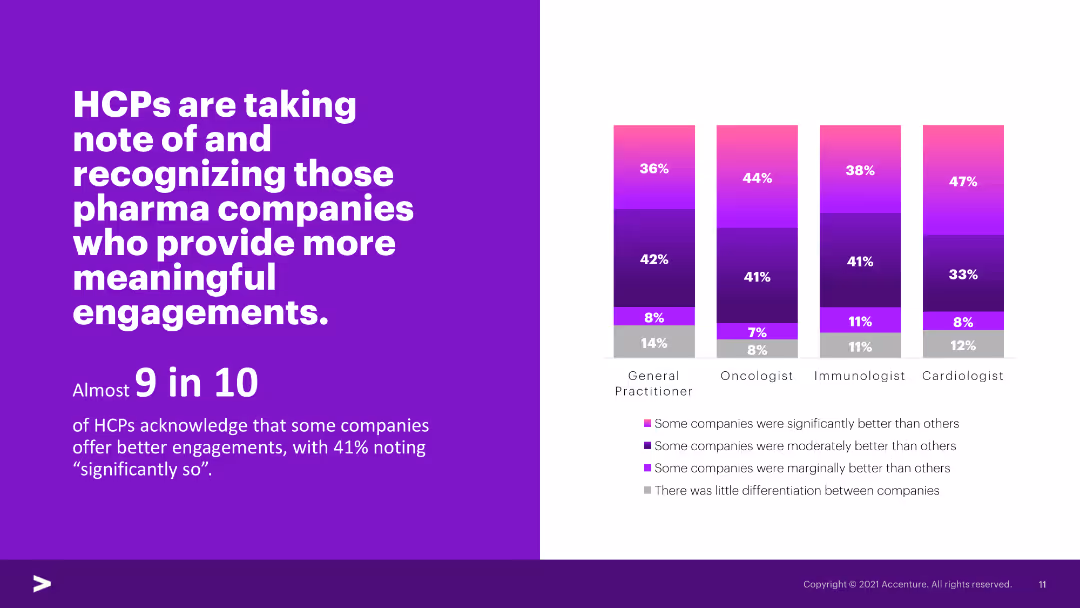
The slide has a purple background with text and a column chart on the right showing HCPs' recognition of pharma companies providing meaningful engagements.
Market Analysis and Trends
Healthcare & Pharmaceuticals
This slide indicates that almost 9 in 10 HCPs acknowledge that some pharma companies offer better engagements, with a significant percentage noting meaningful interactions.
HCPs, pharma companies, engagements, recognition, meaningful interactions, healthcare, perceptions, significant, statistics
false
Market Analysis and Trends
Healthcare & Pharmaceuticals
Mixed Chart
Accenture
Add to my slides
Remove from favorites
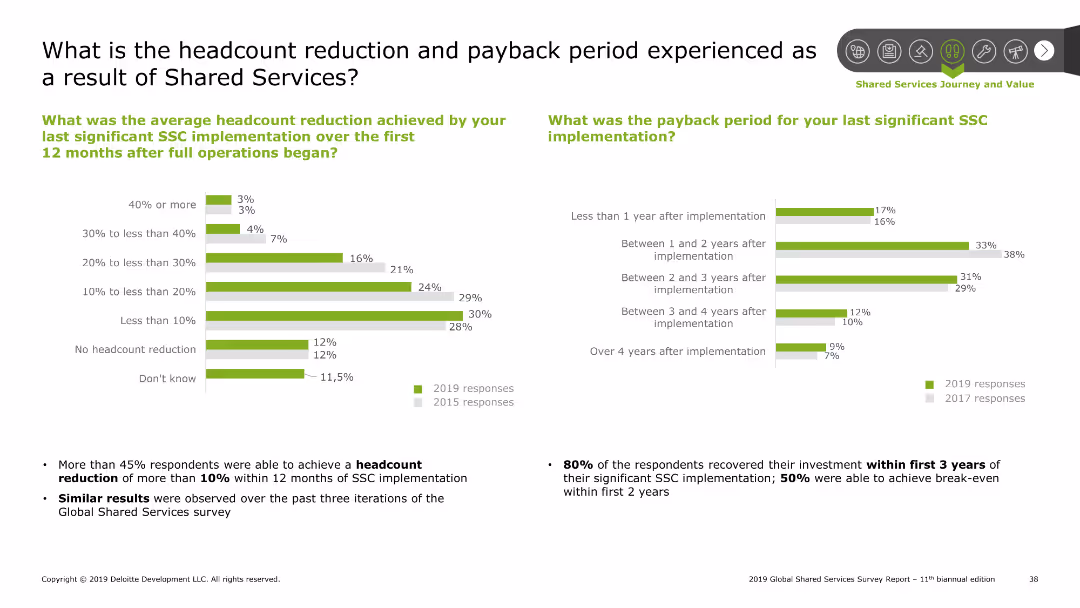
The slide has bar charts showing headcount reduction percentages and payback periods from SSC implementations.
Financial Performance
Professional Services
This slide provides data on headcount reduction and payback periods following significant shared services implementations, comparing responses from 2019 and 2017.
Headcount reduction, payback period, shared services, financial performance
false
Financial Performance
Professional Services
Multiple Chart
Deloitte
Add to my slides
Remove from favorites
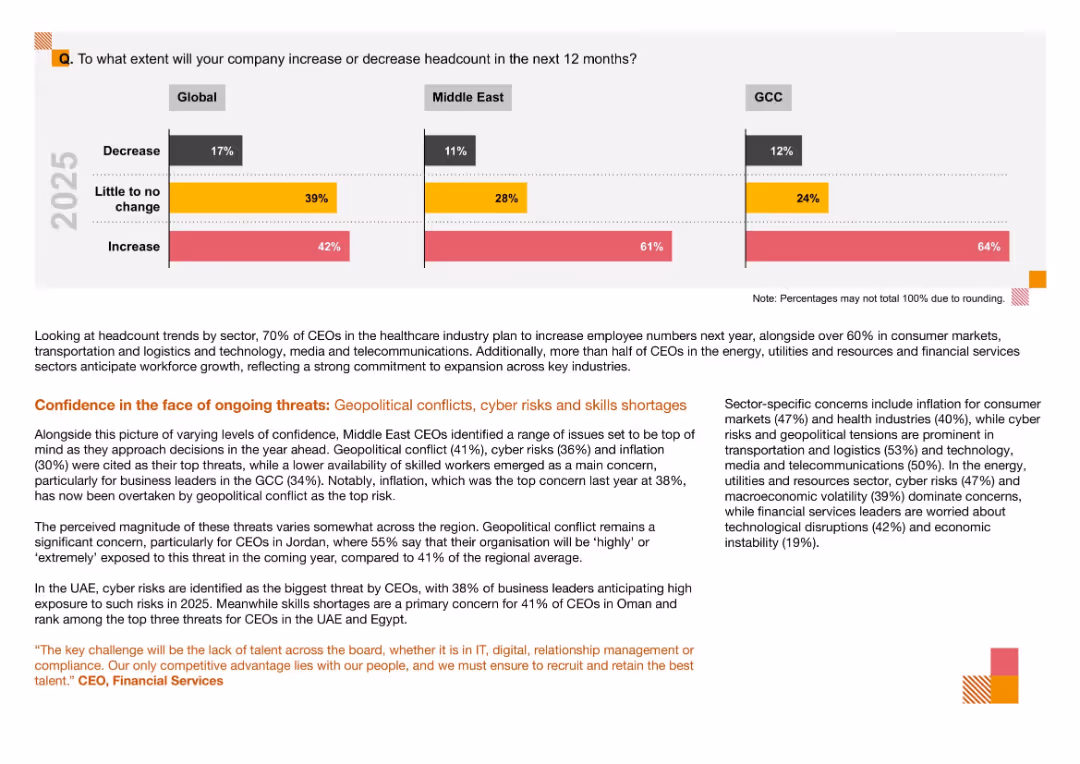
Three-bar segmented bar chart comparing Global, Middle East, and GCC regions; color-coded with text analysis below and highlights in orange and red
Human Resources and Talent Management
Financial Services
The slide shows anticipated headcount changes by region, highlighting growth expectations particularly in the GCC. It also outlines concerns like geopolitical conflict, cyber risks, and skills shortages, which shape CEO decisions on workforce planning in 2025.
Headcount, Workforce Trends, CEO Survey, Middle East, GCC, Cyber Risks, Geopolitical Conflict, Skills Shortage
false
Human Resources and Talent Management
Financial Services
Mixed Chart
PwC/Strategy&
Add to my slides
Remove from favorites
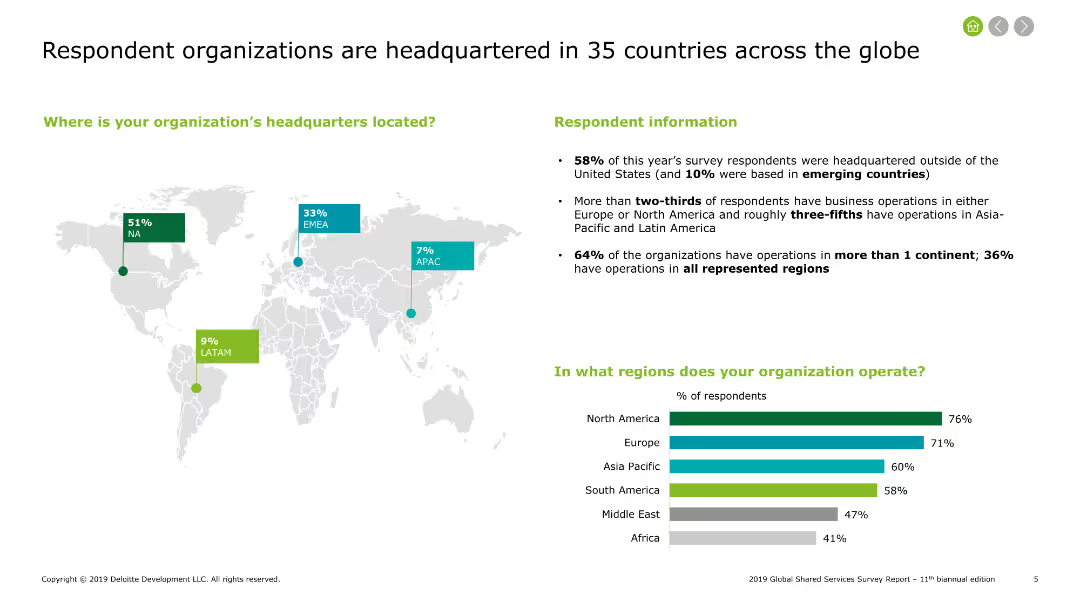
Text, a map, and charts showing locations of respondent headquarters and regions of operation, highlighting global distribution and regional coverage.
Market Analysis and Trends
Professional Services
Provides an overview of the global distribution of survey respondents' headquarters and their operational regions, emphasizing the international presence of organizations.
headquarters, global, regions, distribution, survey
false
Market Analysis and Trends
Professional Services
Mixed Chart
Deloitte
Add to my slides
Remove from favorites
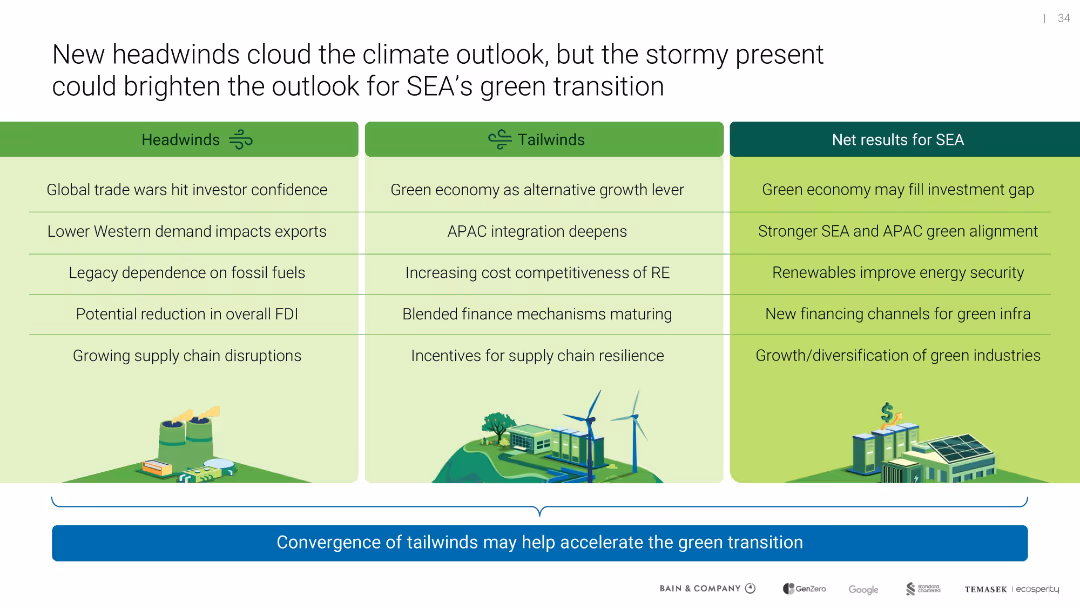
Three-column table labeled Headwinds, Tailwinds, and Net Results for SEA; icon illustrations reinforce thematic sections
Strategic Planning
Environmental Services & Sustainability
Contrasts risks and opportunities facing SEA’s green transition. Despite macroeconomic and political headwinds, tailwinds like maturing green finance and regional integration could accelerate sustainable outcomes.
headwinds, tailwinds, SEA, investment, renewables, supply chain
false
Strategic Planning
Environmental Services & Sustainability
Table
Bain
Add to my slides
Remove from favorites
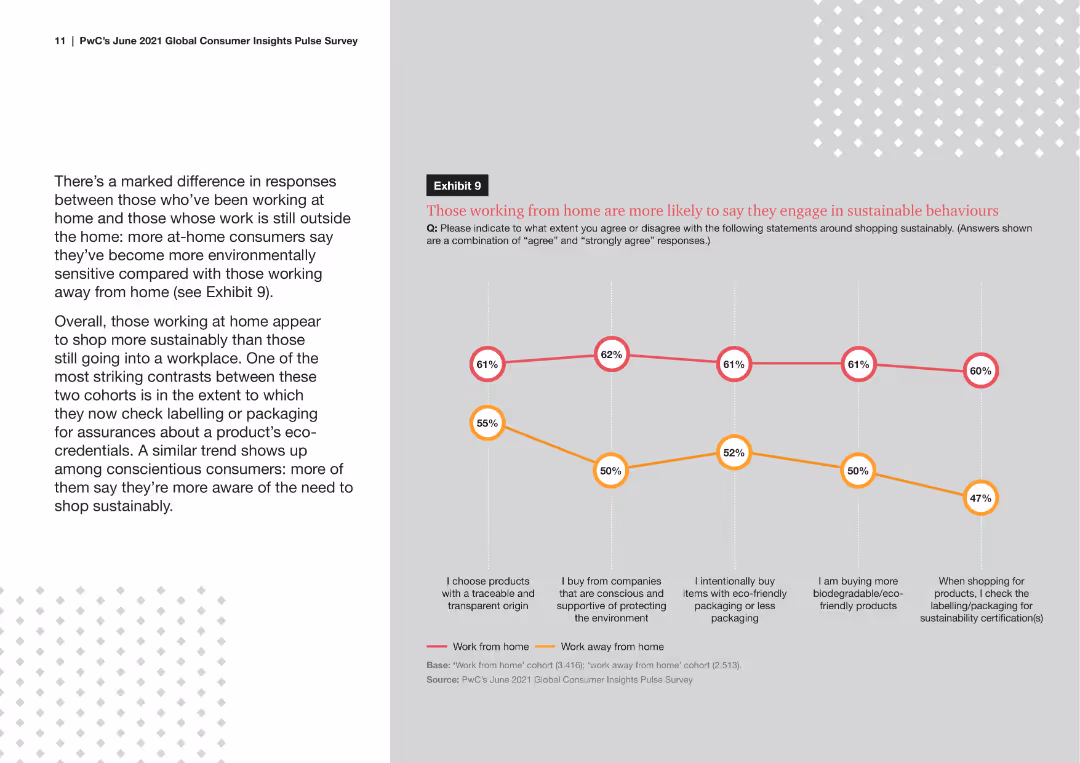
A comparative stacked column chart showing the extent to which consumers prioritize health and safety concerns over environmental concerns for single-use materials across different time periods.
Risk Assessment and Management
Environmental Services & Sustainability
The slide explores consumer attitudes towards health and safety versus environmental concerns, indicating how these priorities have changed over time and their impact on shopping habits, particularly for single-use materials.
health and safety, environmental concerns, consumer priorities, single-use materials, survey data
false
Risk Assessment and Management
Environmental Services & Sustainability
Mixed Chart
PwC/Strategy&
Add to my slides
Remove from favorites
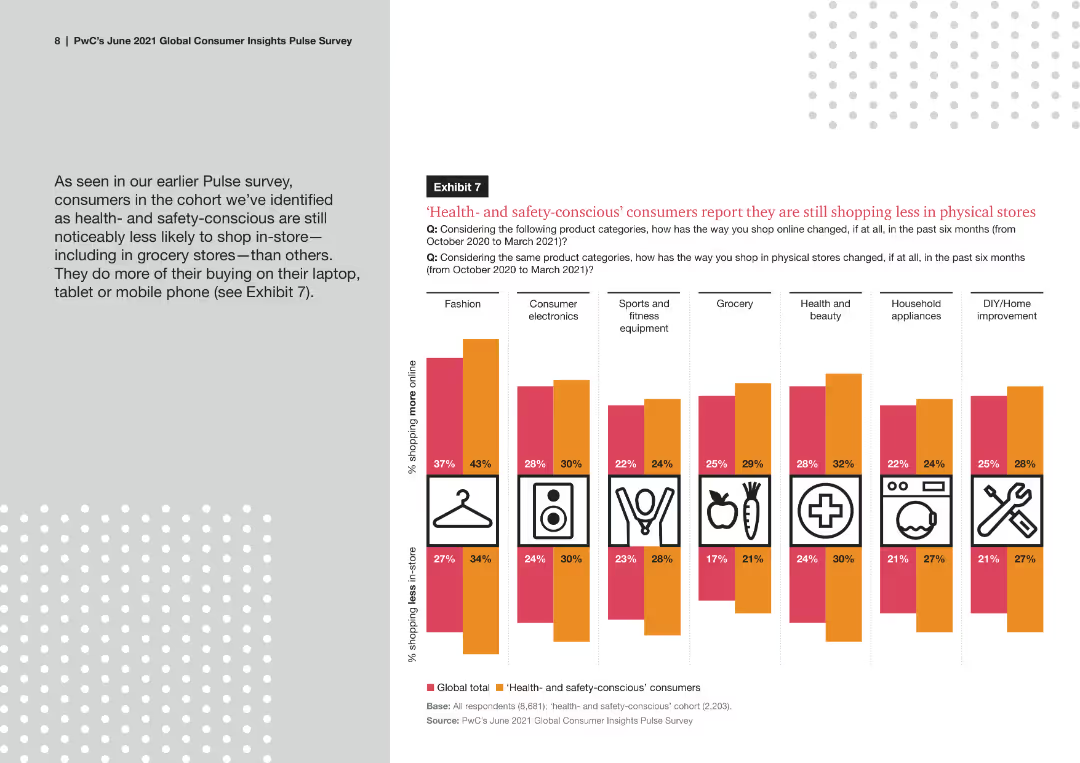
A column chart depicting regional differences in consumer concerns about health and safety when shopping in physical stores, with a comparison of the highest and lowest ranked regions for "increased health and safety."
Risk Assessment and Management
Consumer Goods
The slide provides insights into regional differences regarding consumer concerns about health and safety in physical stores, highlighting which areas rank these concerns highest and which areas rank them lowest.
health and safety, regional differences, consumer concerns, physical stores, survey data
false
Risk Assessment and Management
Consumer Goods
Mixed Chart
PwC/Strategy&
Add to my slides
Remove from favorites
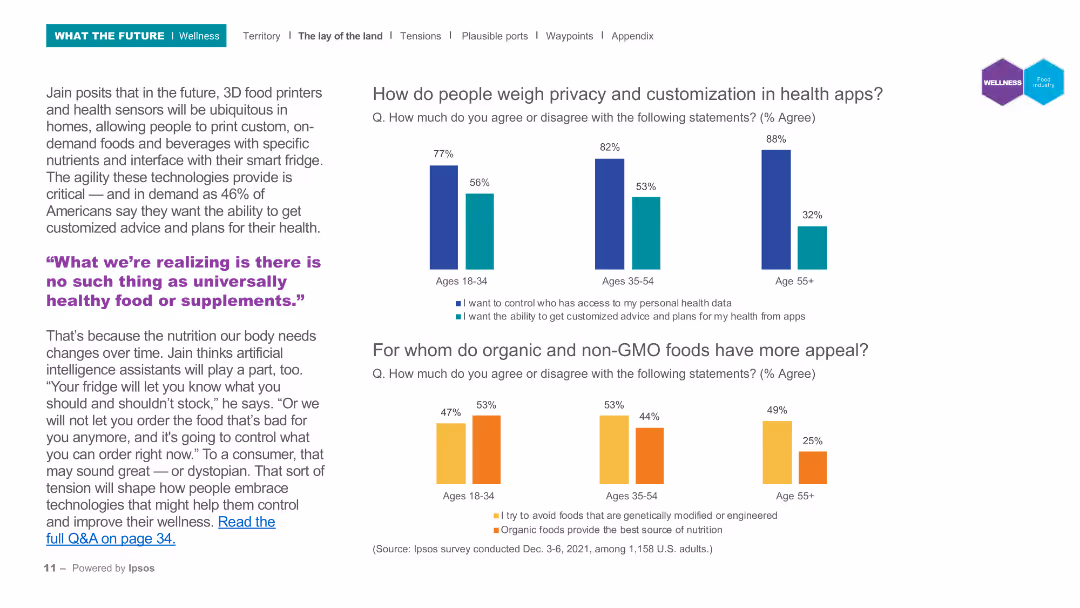
The slide contains column charts showing the importance of privacy and customization in health apps for different age groups.
Market Analysis and Trends
Healthcare & Pharmaceuticals
This slide examines the attitudes towards privacy and customization in health apps, showing significant age-based differences in priorities for health data control and personalized advice.
Health apps, privacy, customization, age groups, digital health
false
Market Analysis and Trends
Healthcare & Pharmaceuticals
Multiple Chart
IPSOS
Add to my slides
Remove from favorites
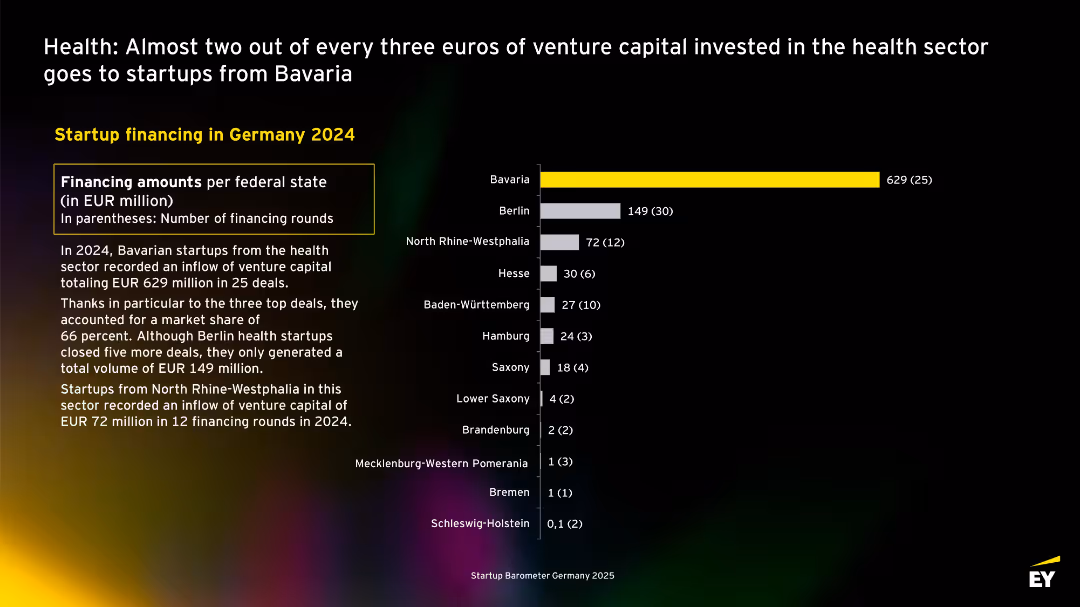
Bar chart comparing health sector funding by federal state. Bavaria leads significantly. Paragraph explains regional distribution and implications.
Market Analysis and Trends
Healthcare & Pharmaceuticals
Presents a breakdown of health sector funding by state in 2024. Bavaria startups received two-thirds of all invested capital, mainly due to three large deals. Despite more deals in Berlin, its funding total was far lower, emphasizing investment disparity.
health, Bavaria, Berlin, venture capital, federal states, 2024, funding concentration, Germany
false
Market Analysis and Trends
Healthcare & Pharmaceuticals
Mixed Chart
EY
Add to my slides
Remove from favorites
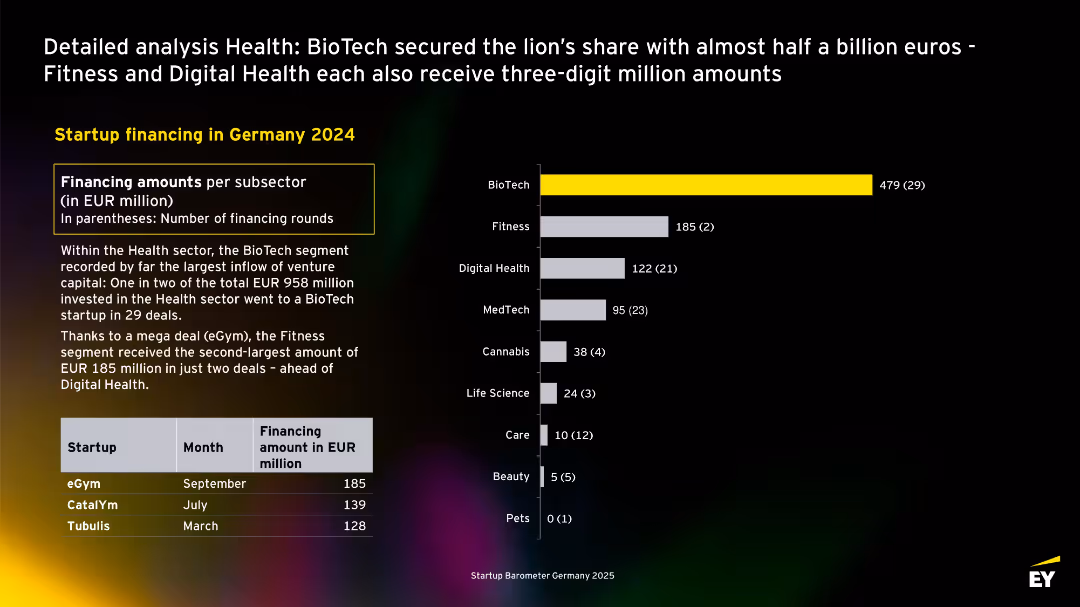
Horizontal bar chart with financing by health subsector. BioTech clearly leads. Summary explains investment concentration and mentions major deals. Includes funding table.
Product and Service Analysis
Healthcare & Pharmaceuticals
Examines health sector startup financing in Germany in 2024. BioTech dominates with €479M raised in 29 deals. Fitness and Digital Health follow due to large single deals. The slide presents a deep dive into health segment investments.
health, biotech, fitness, digital health, Germany, sector funding, eGym, CatalYm
false
Product and Service Analysis
Healthcare & Pharmaceuticals
Mixed Chart
EY
Add to my slides
Remove from favorites
This slide presents a structured summary of health outcomes influenced by broadband, using flowcharts and bullet points. It details user percentages accessing telehealth and other medical resources, citing benefits and drawbacks. Color coding assists in distinguishing between positive and negative impacts.
Market Analysis and Trends
Telecommunications
The slide outlines how broadband access has influenced health services, detailing user engagement and satisfaction with telehealth and online health resources.
Health, Broadband, Telehealth, Medical, Resources, Impact, Positive, Negative, Internet, Access
false
Market Analysis and Trends
Telecommunications
Multiple Chart
Accenture
Add to my slides
Remove from favorites
Slide includes a large header and a grouped bar chart with percentages indicating people's responses about changes in healthcare access during the COVID-19 pandemic. It features images of diverse individuals, possibly representing different demographics affected by the pandemic.
Industry Overview
Healthcare & Pharmaceuticals
This slide offers insights into how healthcare access was perceived to have changed during the pandemic, with a majority reporting no change or improvement. It is relevant for discussions on the resilience of healthcare systems in crises and can be used in healthcare policy and planning discussions to highlight areas of strength and potential improvement.
healthcare access, COVID-19 impact, system resilience, patient experiences, demographic analysis
false
Industry Overview
Healthcare & Pharmaceuticals
Mixed Chart
Accenture
Add to my slides
Remove from favorites
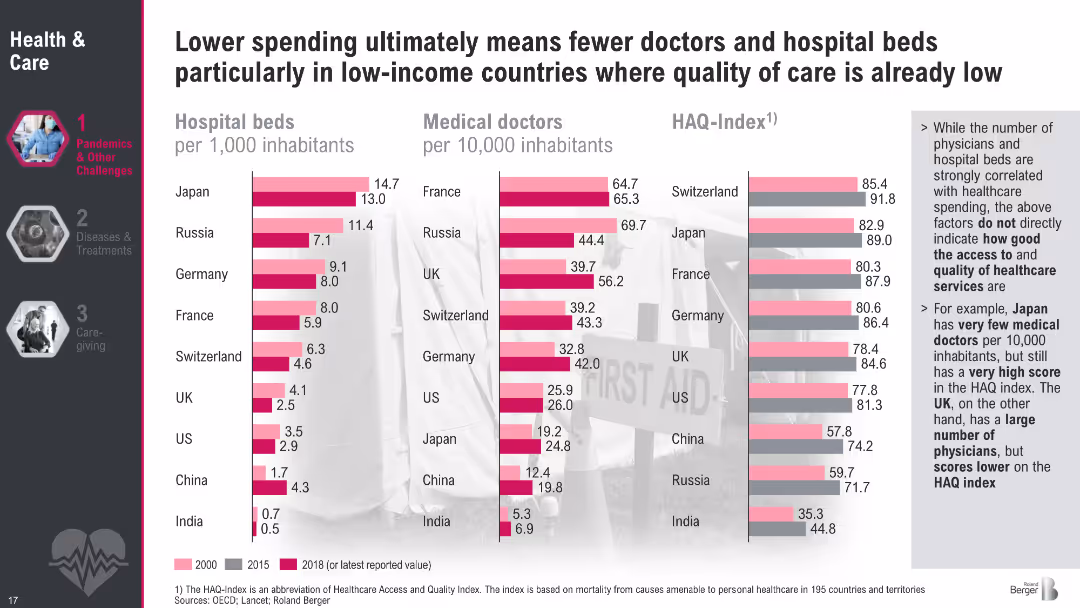
Three comparative bar charts for hospital beds, medical doctors, and HAQ Index across countries. Light to dark shades mark years (2000, 2015, 2018).
Human Resources and Talent Management
Healthcare & Pharmaceuticals
The slide compares healthcare infrastructure across countries—beds per capita, number of doctors, and healthcare quality (HAQ). It shows that low-income countries have significantly fewer resources. Interestingly, some high-scoring nations (like Japan) achieve good healthcare outcomes despite fewer doctors, revealing disparities in efficiency and access.
Healthcare access, HAQ Index, physicians, hospital beds, international comparison, infrastructure
false
Human Resources and Talent Management
Healthcare & Pharmaceuticals
Multiple Chart
Roland Berger
Add to my slides
Remove from favorites
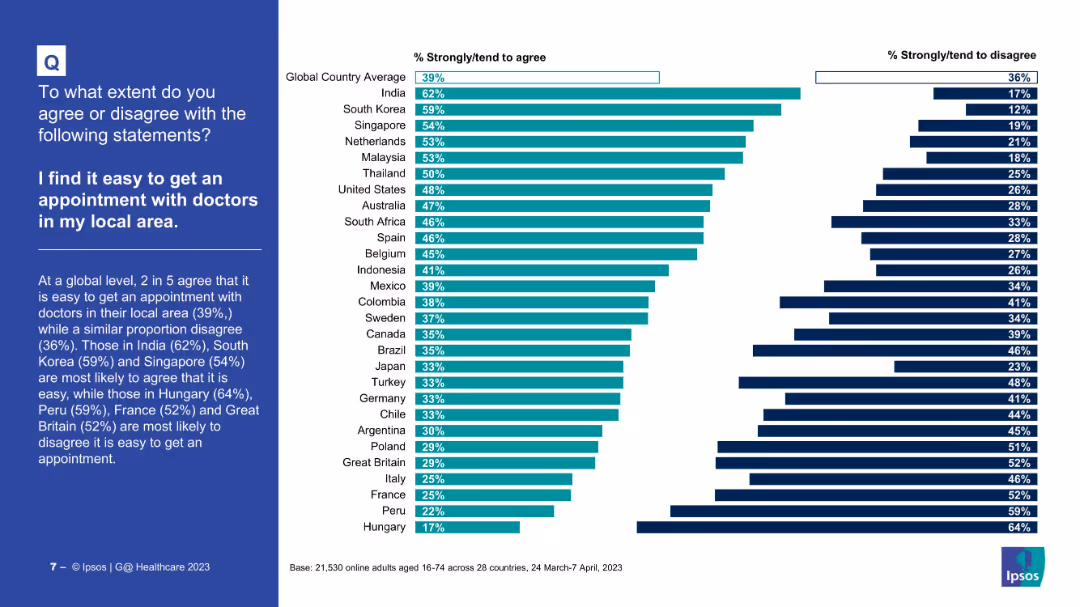
Country comparison bar chart on ease of getting doctor appointments locally
Market Analysis and Trends
Healthcare & Pharmaceuticals
The slide presents survey data showing how easy people in various countries find it to get local doctor appointments. India, South Korea, and Singapore report the most ease; Hungary and Peru the least.
Healthcare access, local doctors, appointment ease, survey data, international comparison, Ipsos
false
Market Analysis and Trends
Healthcare & Pharmaceuticals
Mixed Chart
IPSOS
Add to my slides
Remove from favorites
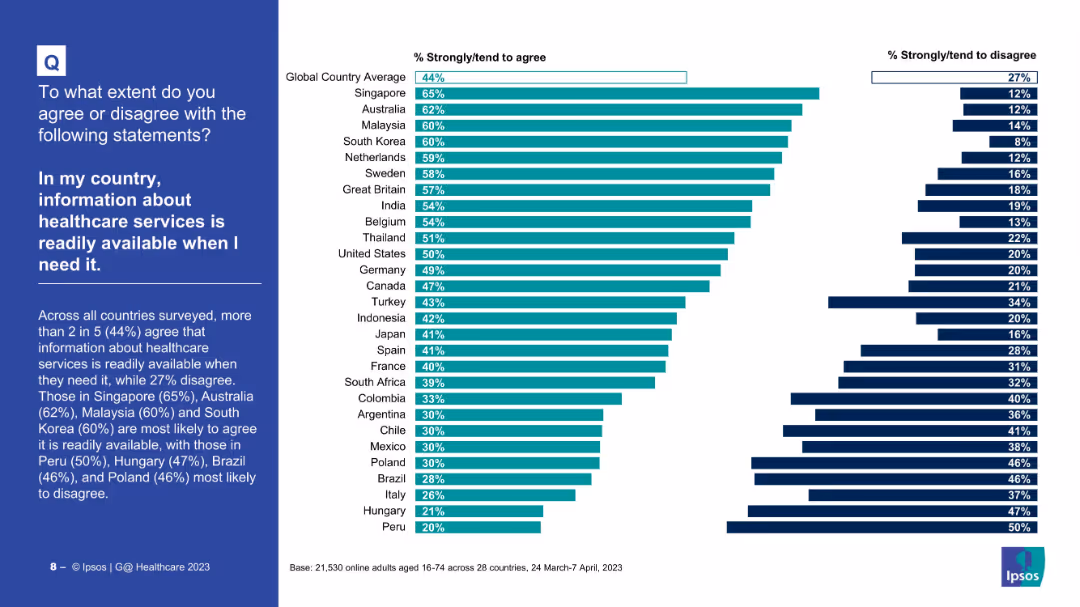
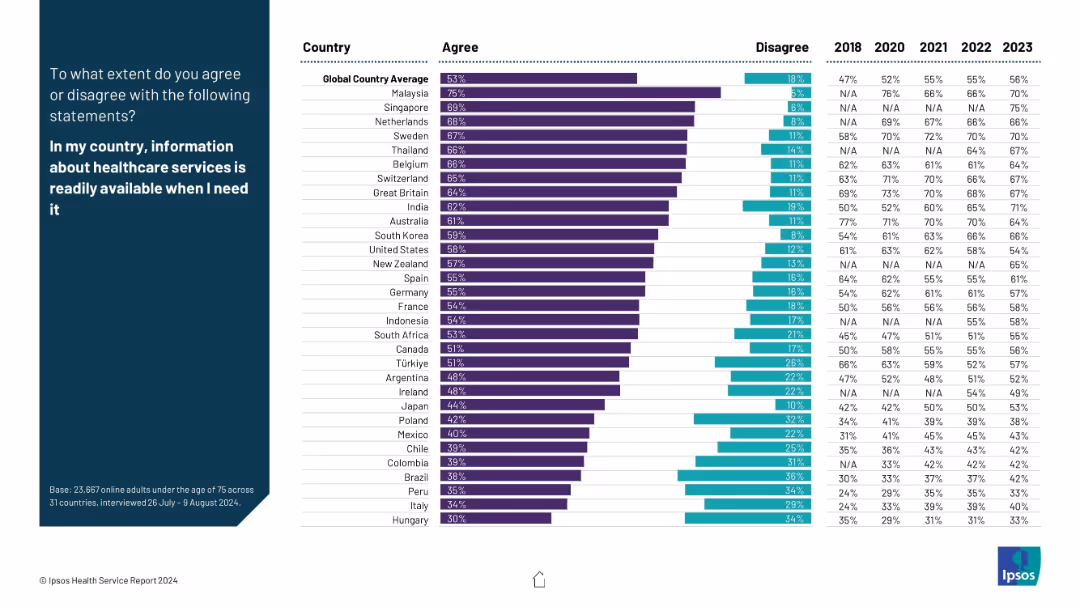
Left side text with title and summary; right side features a horizontal bar chart comparing countries by agreement/disagreement levels.
Market Analysis and Trends
Healthcare & Pharmaceuticals
The slide presents survey data on the availability of healthcare service information across 28 countries. It highlights agreement/disagreement levels, with Singapore ranking highest in agreement and Peru highest in disagreement.
healthcare access, survey, global comparison, Ipsos, information availability, public perception, ranking, patient needs, healthcare data, international survey
false
Market Analysis and Trends
Healthcare & Pharmaceuticals
Mixed Chart
IPSOS
Add to my slides
Remove from favorites
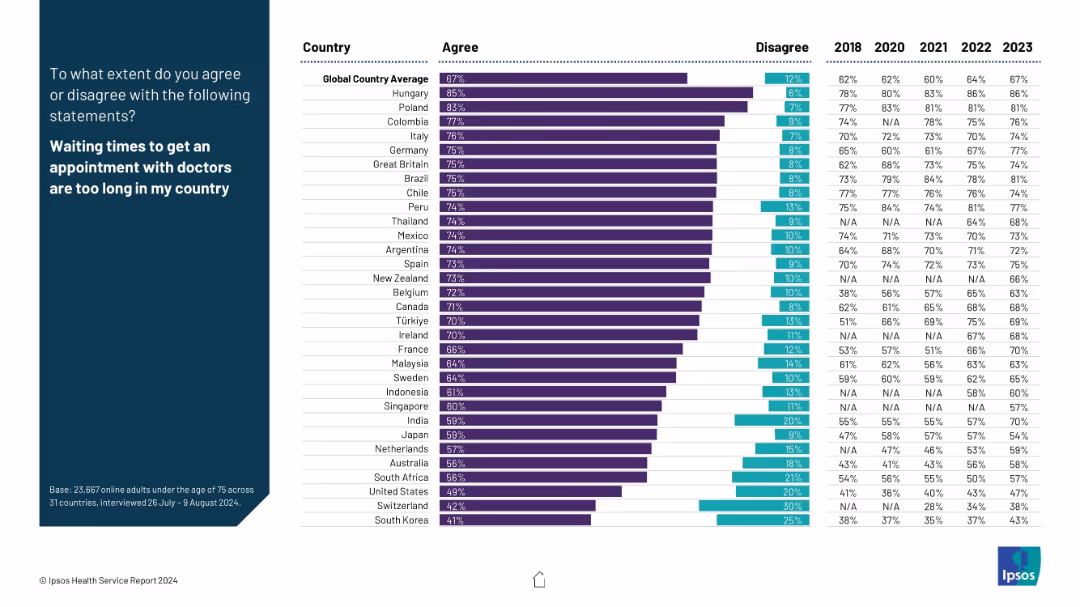
Bar chart showing percentage agreement/disagreement by country that waiting times are too long; includes yearly trend data.
Risk Assessment and Management
Healthcare & Pharmaceuticals
Respondents shared opinions on doctor appointment wait times. Hungary and Poland show the highest dissatisfaction. This data can signal accessibility issues and efficiency concerns in health systems worldwide.
healthcare access, waiting times, dissatisfaction, efficiency, survey
false
Risk Assessment and Management
Healthcare & Pharmaceuticals
Mixed Chart
IPSOS
Add to my slides
Remove from favorites
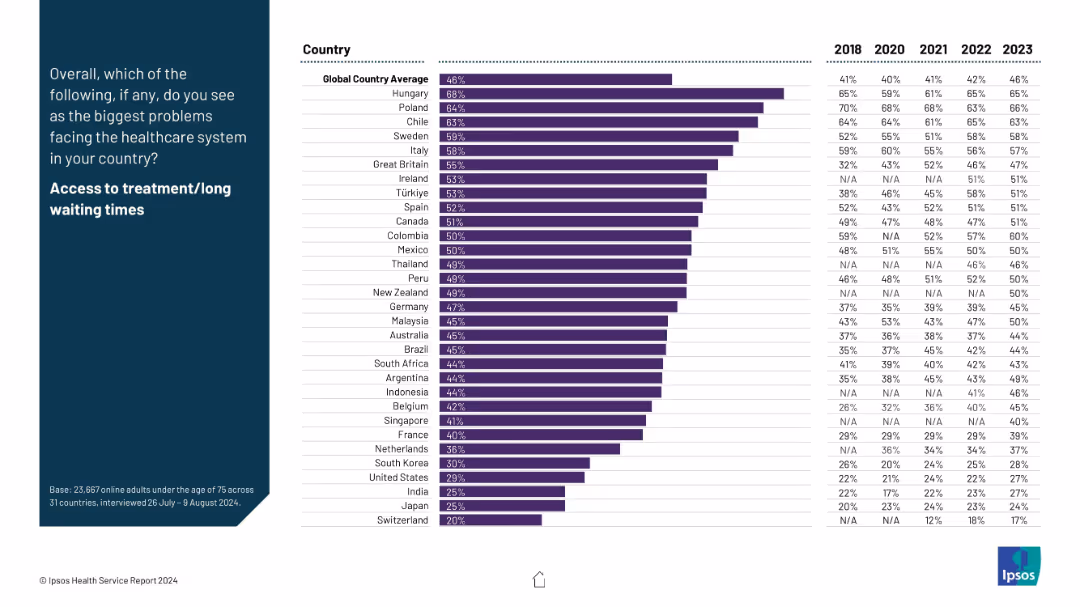
Bar chart showing agreement with this specific problem across countries, with historical data from 2018 to 2023.
Risk Assessment and Management
Healthcare & Pharmaceuticals
This slide details perceptions around treatment accessibility and long wait times, considered one of the most pressing healthcare issues. The data spans multiple years and highlights which countries report it most often as a concern.
healthcare access, waiting times, global comparison, Ipsos, system pressure, trend, treatment delays
false
Risk Assessment and Management
Healthcare & Pharmaceuticals
Mixed Chart
IPSOS
Add to my slides
Remove from favorites
Features a column chart comparing responses across different generations (Baby Boomers, Gen X, Millennials) regarding actions taken due to affordability issues in healthcare. The chart uses color coding to differentiate between generations.
Market Analysis and Trends
Healthcare & Pharmaceuticals
This slide explores generational differences in responses to healthcare affordability, which could be critical for market analysis and policy making. It highlights the specific actions different age groups are likely to take when faced with financial barriers to accessing medical care.
healthcare affordability, generational analysis, patient behavior, policy implications, financial barriers
false
Market Analysis and Trends
Healthcare & Pharmaceuticals
Multiple Chart
Accenture
Add to my slides
Remove from favorites
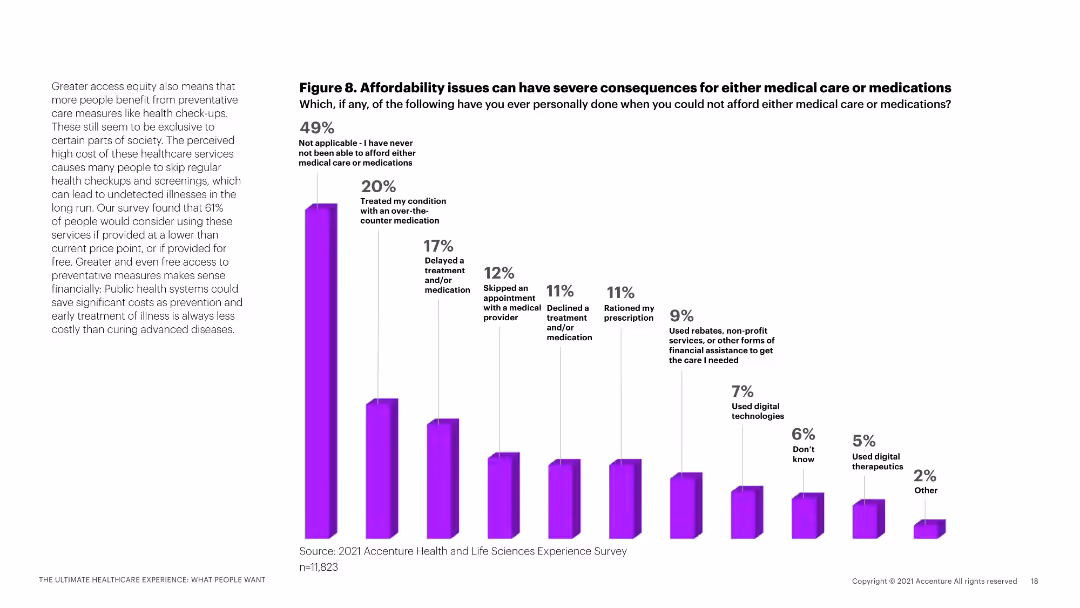
A column chart illustrating the consequences of affordability issues in healthcare, with a detailed explanation on the left.
Risk Assessment and Management
Healthcare & Pharmaceuticals
This slide explores the impact of affordability issues on medical care and medication access, based on survey data.
healthcare affordability, medical care, medication access, patient survey, cost impact
false
Risk Assessment and Management
Healthcare & Pharmaceuticals
Mixed Chart
Accenture
Add to my slides
Remove from favorites
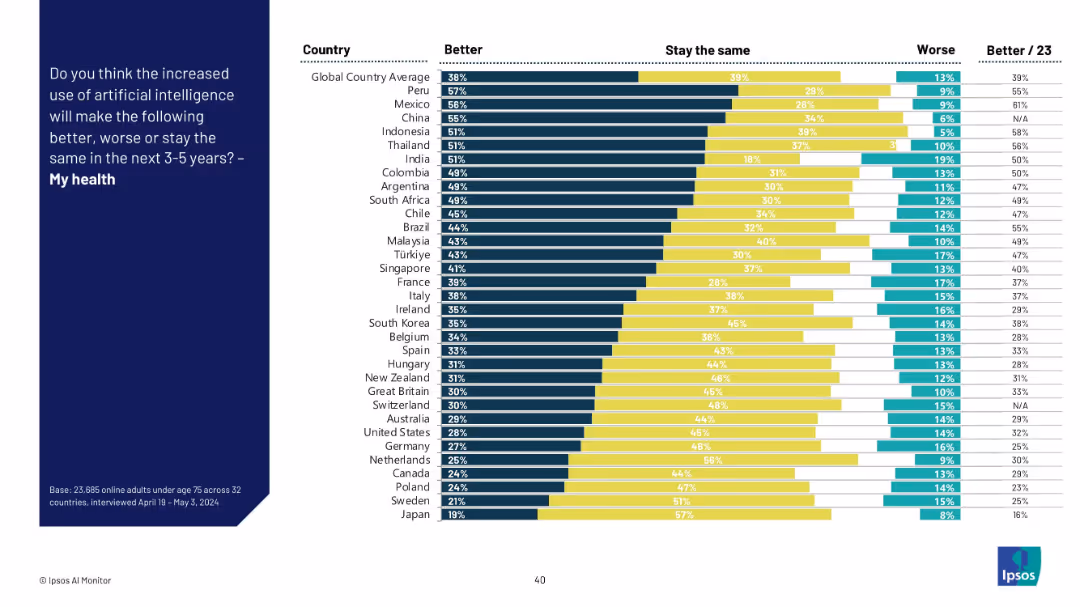
Standard Ipsos layout: blue question block on left, chart with three segmented response bars per country.
Risk Assessment and Management
Healthcare & Pharmaceuticals
The slide captures expectations of AI’s impact on personal health. While there is general optimism (e.g., in Peru, Mexico, China), skepticism is also evident, especially in developed countries like Japan and Sweden.
healthcare AI, future health, survey response, global comparison, medical technology, AI optimism, personal well-being, Ipsos
false
Risk Assessment and Management
Healthcare & Pharmaceuticals
Mixed Chart
IPSOS
Add to my slides
Remove from favorites
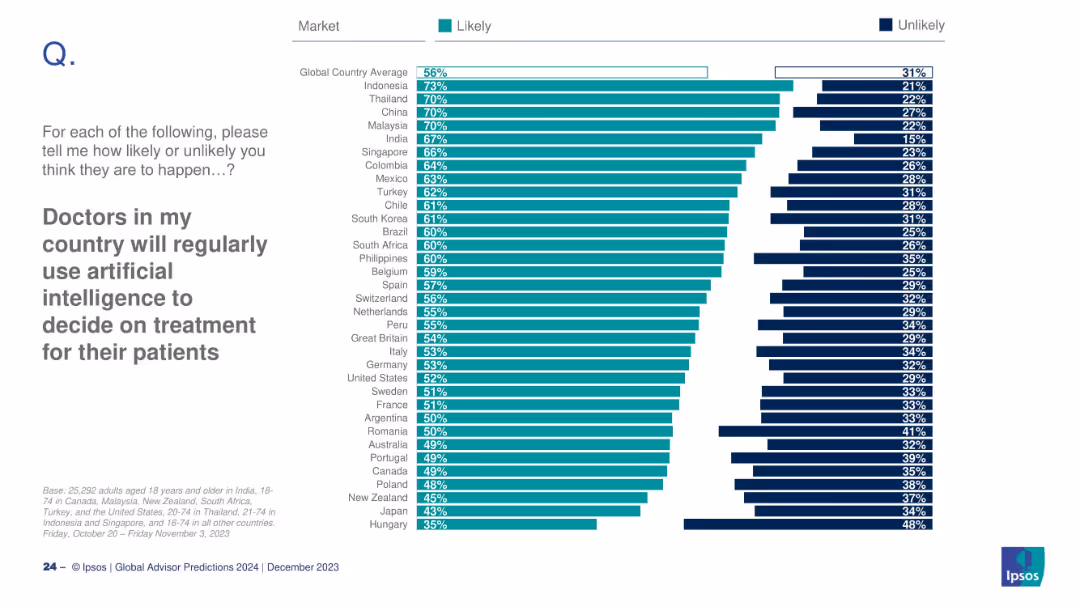
Country-level horizontal bar chart with likelihood ratings
Technology and Digital Transformation
Healthcare & Pharmaceuticals
This slide presents opinions by country on whether AI will be regularly used in medical treatment decisions. It shows likelihood percentages and highlights disparity in expectations globally.
healthcare, AI, medical technology, public opinion, treatment trends
false
Technology and Digital Transformation
Healthcare & Pharmaceuticals
Mixed Chart
IPSOS
Add to my slides
Remove from favorites
Shows pie charts in soft blue and teal, focused on AI's role in patient care and hospital operations.
Operational Efficiency
Healthcare & Pharmaceuticals
Highlights specific AI applications in healthcare operations and patient management, detailing the adoption rates and areas like imaging and diagnostics where AI is prominently used.
healthcare, AI, patient experience, operations, diagnostics
false
Operational Efficiency
Healthcare & Pharmaceuticals
Multiple Chart
Deloitte
Add to my slides
Remove from favorites
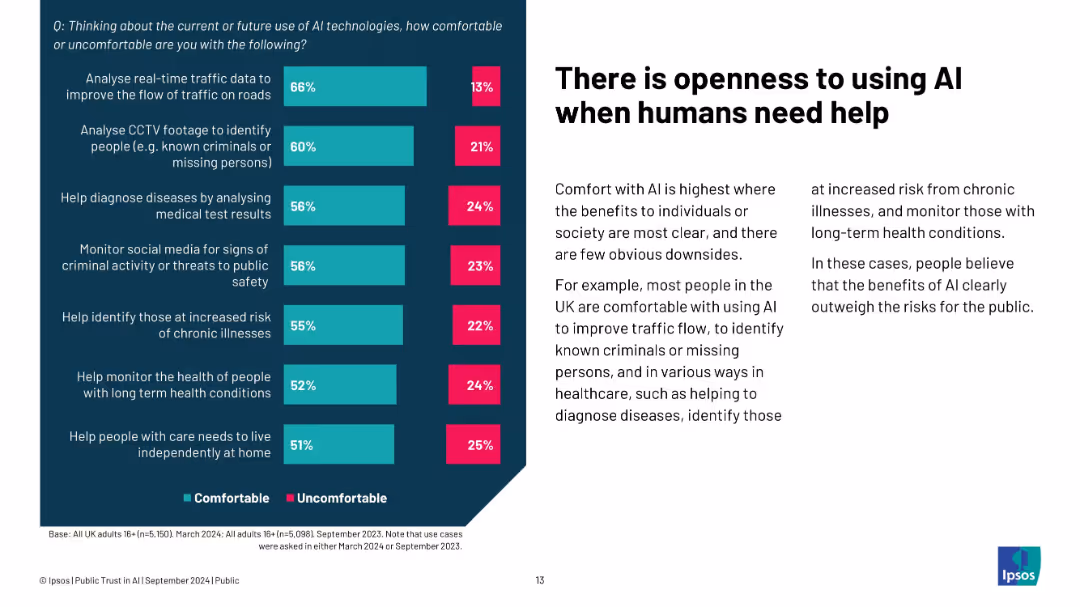
Two-column layout; left: chart showing comfort with specific AI uses; right: explanation of comfort reasons
Product and Service Analysis
Artificial Intelligence
The slide shows that the public is most open to AI applications where it provides tangible help—like health diagnostics, crime prevention, or traffic optimization. Public comfort increases when benefits clearly outweigh risks, particularly in healthcare and safety.
healthcare AI, public comfort, Ipsos, social value, diagnostic tools, AI applications, helpful technology
false
Product and Service Analysis
Artificial Intelligence
Mixed Chart
IPSOS
Add to my slides
Remove from favorites
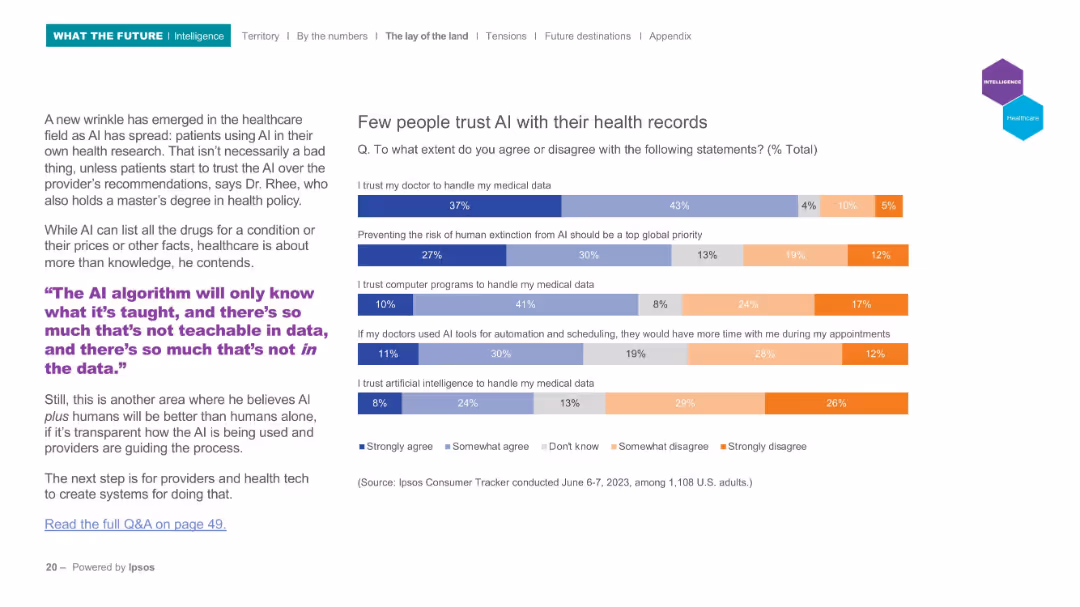
Horizontal bar chart with five multi-colored statements; left side features expert commentary and quote.
Risk Assessment and Management
Healthcare & Pharmaceuticals
Focuses on public attitudes about AI’s role in healthcare, specifically trust in handling medical data. Most people still prefer human doctors over AI systems for managing health data. Includes concerns about automation and human extinction risk related to AI.
healthcare AI, trust, medical data, patient opinion, privacy, Ipsos, automation, public sentiment
false
Risk Assessment and Management
Healthcare & Pharmaceuticals
Mixed Chart
IPSOS
Add to my slides
Remove from favorites
Displays a bar chart of NY dental clinic statuses during the pandemic and a dotted line chart projecting the recovery of ambulatory services, detailing both immediate closures and recovery prospects.
Market Analysis and Trends
Healthcare & Pharmaceuticals
Assesses the moderate impact of the pandemic on healthcare ambulatory services in NY, focusing on dental clinics and projecting a recovery path influenced by delayed elective procedures.
healthcare, ambulatory services, dental clinics, pandemic impact, recovery projections, bar chart, line chart
false
Market Analysis and Trends
Healthcare & Pharmaceuticals
Multiple Chart
BCG
Add to my slides
Remove from favorites
This slide displays a bar chart with the major limiting factors to providing antenatal care in primary healthcare centers, such as poor power supply and equipment issues. Each factor is distinctly colored for emphasis.
Risk Assessment and Management
Healthcare & Pharmaceuticals
Identifies critical barriers to healthcare service provision in primary centers, focusing on power supply issues, which is crucial for risk management and service improvement in healthcare.
healthcare barriers, power supply, risk management, PHC limitations, service improvement
false
Risk Assessment and Management
Healthcare & Pharmaceuticals
Single Chart
BCG
Add to my slides
Remove from favorites
Text-heavy slide with bullet points and icons representing various aspects of healthcare and bioengineering.
Regulatory and Compliance
Healthcare & Pharmaceuticals
Reviews potential healthcare innovations and disruptions due to bioengineering.
Healthcare, Bioengineering, Innovations, Disruptions
false
Regulatory and Compliance
Healthcare & Pharmaceuticals
Header Vertical
McKinsey
Add to my slides
Remove from favorites
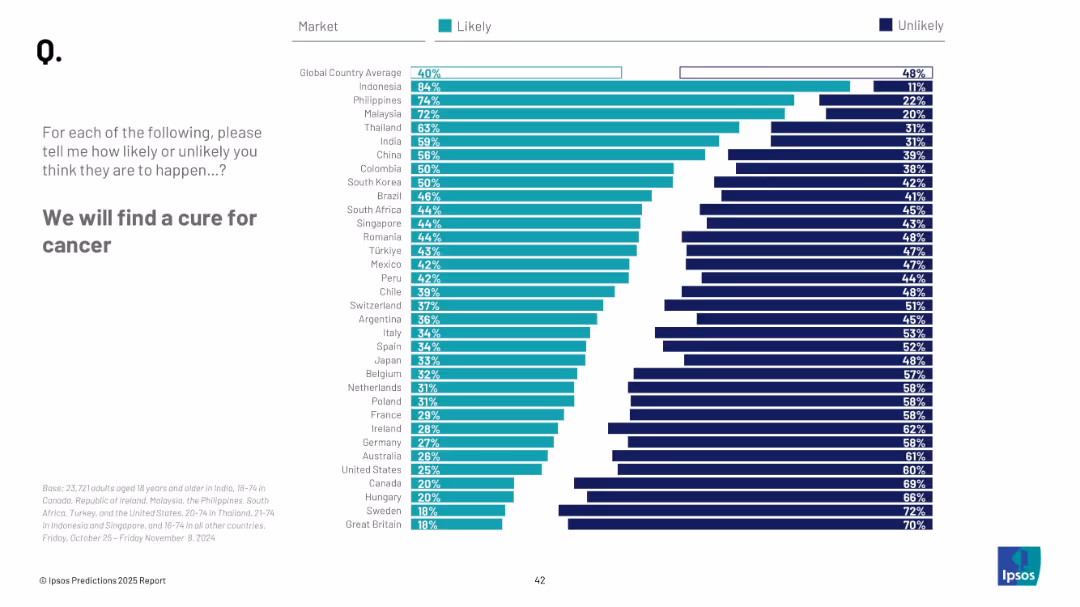
Horizontal bar chart; ranked likelihood by country; teal and navy color coding for likelihood and unlikelihood
Strategic Planning
Healthcare & Pharmaceuticals
This slide reflects global beliefs on the likelihood of a cancer cure. Indonesia and the Philippines are most hopeful, with an overall global likelihood of 40%.
healthcare, cancer, medical breakthrough, global opinion, research, hope, cure, innovation, prediction, Ipsos
false
Strategic Planning
Healthcare & Pharmaceuticals
Mixed Chart
IPSOS
Add to my slides
Remove from favorites
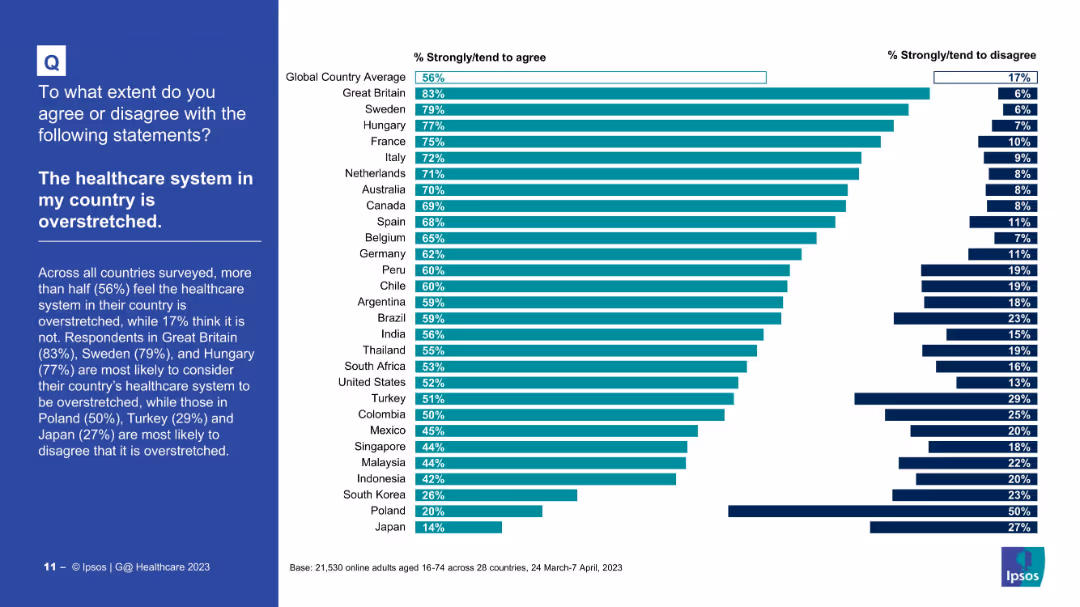
Title and narrative on left; horizontal bar chart on the right shows perception of overstretched healthcare systems across countries.
Risk Assessment and Management
Healthcare & Pharmaceuticals
This slide reflects perceptions of overstretched healthcare systems. The UK, Sweden, and Hungary have the highest agreement on overstretching, while Japan and Poland show the least. The data reveals capacity strain awareness globally.
healthcare capacity, overstretched, healthcare burden, Ipsos, country insights, risk awareness, healthcare strain, service delivery, global perception
false
Risk Assessment and Management
Healthcare & Pharmaceuticals
Mixed Chart
IPSOS
Add to my slides
Remove from favorites
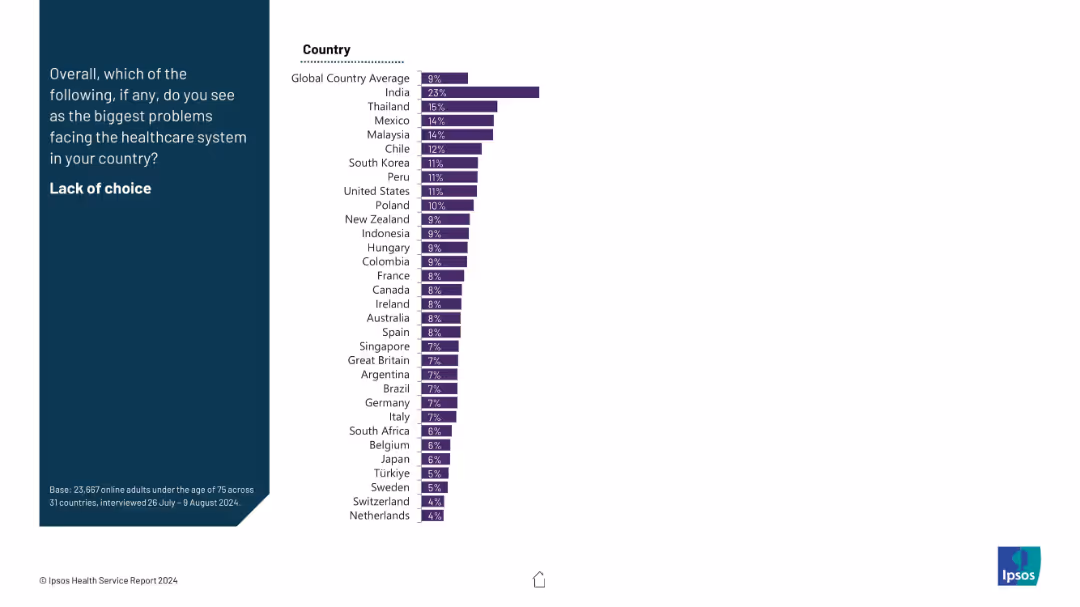
Simple bar chart layout showing single percentages by country on the right; title and prompt on dark blue background to the left.
Risk Assessment and Management
Healthcare & Pharmaceuticals
This slide identifies concern levels about lack of healthcare choices by country. India leads with 23%, well above the global average of 9%. Most countries show low concern.
healthcare choice, patient options, access, healthcare freedom, country comparison, public sentiment
false
Risk Assessment and Management
Healthcare & Pharmaceuticals
Mixed Chart
IPSOS
Add to my slides
Remove from favorites
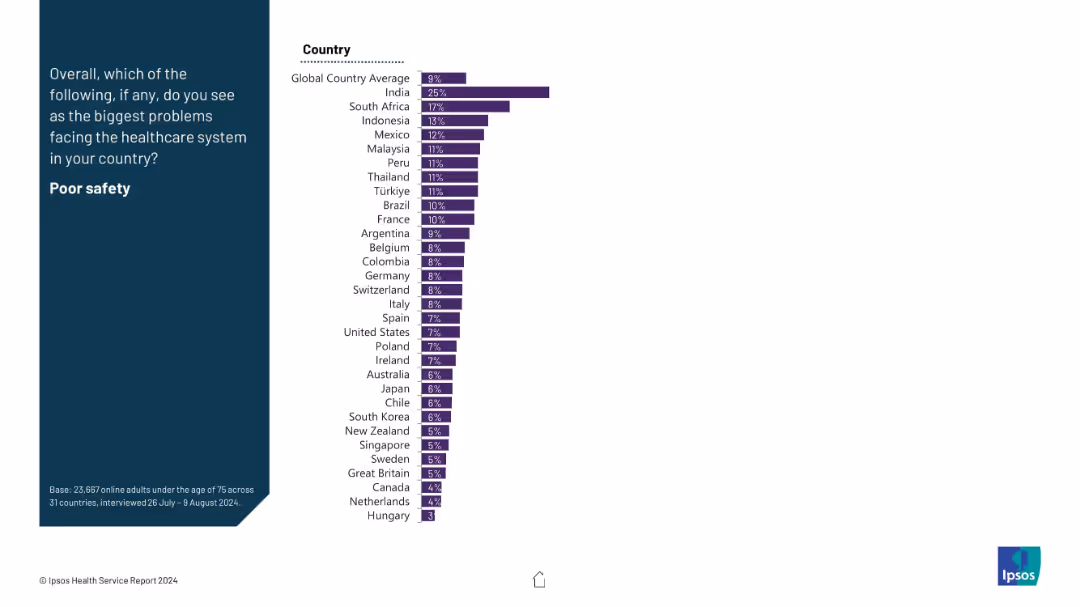
Two-column layout; left side features the question in white on dark blue background; right side has a horizontal bar chart ranking countries by percentage identifying low cleanliness standards as a major healthcare issue.
Risk Assessment and Management
Healthcare & Pharmaceuticals
This slide presents global public opinion on whether low cleanliness standards are a key healthcare issue. India (26%) and South Africa (22%) report the highest concern, far above the global average of 7%. Data is from a survey conducted across 31 countries.
healthcare, cleanliness, public opinion, global comparison, Ipsos, survey, healthcare issues, risk, standards
false
Risk Assessment and Management
Healthcare & Pharmaceuticals
Mixed Chart
IPSOS
Add to my slides
Remove from favorites
The slide includes tables showing the cancellation policies and meal expense limits for various healthcare companies.
Regulatory and Compliance
Healthcare & Pharmaceuticals
Details cancellation policies and meal limits for HCPs, useful for companies managing healthcare events and compliance.
healthcare companies, meal expenses, cancellation policies, compliance, event management
false
Regulatory and Compliance
Healthcare & Pharmaceuticals
Multiple Chart
Deloitte
Add to my slides
Remove from favorites
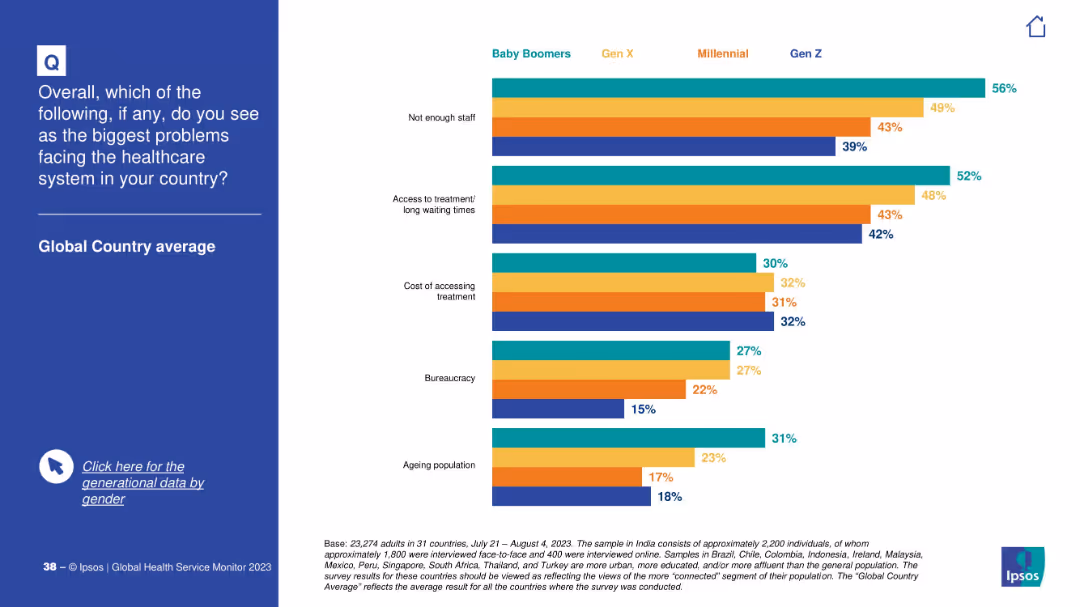
Simplified version of previous slide with consolidated generational data only, without gender breakdown.
Market Analysis and Trends
Healthcare & Pharmaceuticals
This slide presents generational comparisons for perceived major healthcare system problems, such as staffing shortages and long wait times. Baby Boomers are most concerned about staffing, while Gen Z notes cost and bureaucracy.
healthcare concerns, generational view, staff shortage, treatment access, cost, bureaucracy, perceptions, Ipsos
false
Market Analysis and Trends
Healthcare & Pharmaceuticals
Mixed Chart
IPSOS
Add to my slides
Remove from favorites
This slide has two comparative diagrams contrasting the verticals of healthcare and connected cars, with related icons and key statistics.
Strategic Planning
Technology & Software
Illustrates J.P.Morgan's targeted vertical solutions with strategic investments in healthcare payments and connected car services.
Healthcare, Connected Cars, Vertical Solutions, Strategic Investments, J.P.Morgan
false
Strategic Planning
Technology & Software
Table
JP Morgan
Add to my slides
Remove from favorites
The slide features a dark background with white and yellow text, highlighting survey results with column charts.
Market Analysis and Trends
Healthcare & Pharmaceuticals
It discusses the importance of healthcare experience for consumers, with survey results showing 44% above average, 26% average, and 30% below average rating.
healthcare, consumer, experience, survey, England
false
Market Analysis and Trends
Healthcare & Pharmaceuticals
Mixed Chart
EY
Add to my slides
Remove from favorites
A dark background slide with column charts showing survey results on healthcare experience, with white and yellow text.
Market Analysis and Trends
Healthcare & Pharmaceuticals
It highlights consumer ratings of healthcare system optimization for equitable treatment, with 49% above average, 26% average, and 25% below average.
healthcare, consumer experience, survey, Germany
false
Market Analysis and Trends
Healthcare & Pharmaceuticals
Mixed Chart
EY
Add to my slides
Remove from favorites
This slide has a dark background with a yellow highlight. It features a header, body text, and a column chart displaying three circular percentage indicators, each with a different percentage, representing the most valued aspects of healthcare.
Customer and Market Segmentation
Healthcare & Pharmaceuticals
The slide emphasizes the most important factors for Irish consumers in healthcare: access to care when needed, a cost-effective system, and achieving better health outcomes. It underlines the complexity of consumer decision-making in healthcare.
healthcare, consumer values, Ireland, access, cost
false
Customer and Market Segmentation
Healthcare & Pharmaceuticals
Mixed Chart
EY
Add to my slides
Remove from favorites
This slide features a dark background with a yellow highlight. It includes a header, body text, and a column chart displaying three circular percentage indicators, each representing key aspects valued by US consumers in the healthcare system.
Customer and Market Segmentation
Healthcare & Pharmaceuticals
The slide emphasizes the key factors valued by US consumers in healthcare: access to care, a cost-effective system, and the ability to engage in valued life activities. It underscores the complexity of healthcare decision-making among consumers.
healthcare, consumer values, US, access, cost
false
Customer and Market Segmentation
Healthcare & Pharmaceuticals
Mixed Chart
EY
Add to my slides
Remove from favorites
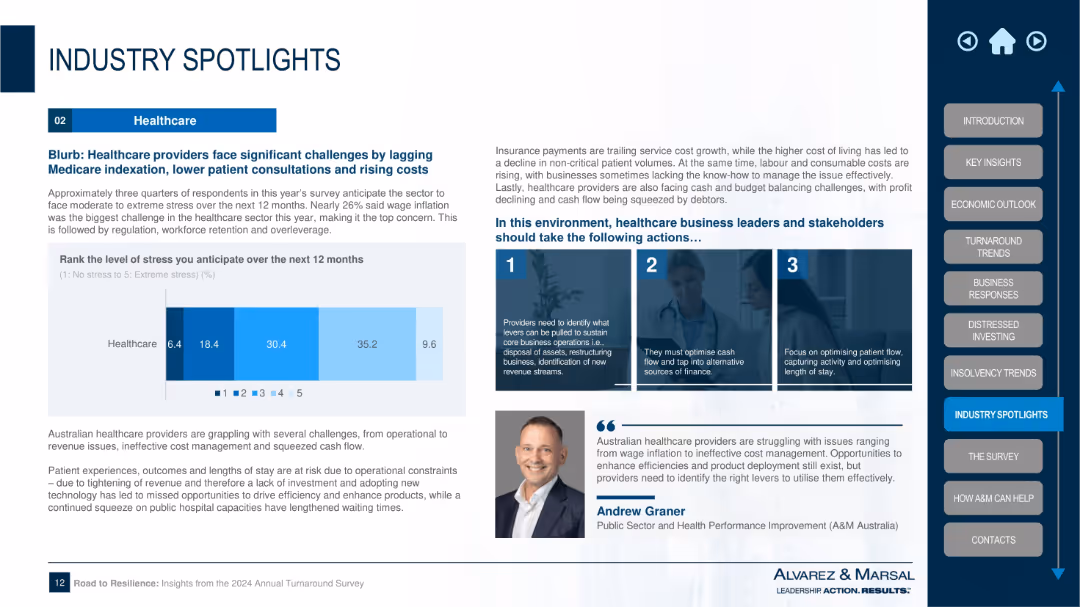
Similar layout to previous slide; stress bar chart on left, analysis and three suggested actions on right, expert quote at bottom
Market Analysis and Trends
Healthcare & Pharmaceuticals
Addresses the Healthcare industry’s financial stress from low Medicare indexation, rising costs, and operational inefficiencies. Recommendations include identifying revenue levers, optimizing cash, and improving patient flow. The chart shows most expect moderate to high stress in the next 12 months.
healthcare, cost inflation, patient flow, Medicare, stress levels, operational efficiency, financial pressure, regulation, workforce
false
Market Analysis and Trends
Healthcare & Pharmaceuticals
Mixed Chart
Alvarez & Marsal
Add to my slides
Remove from favorites
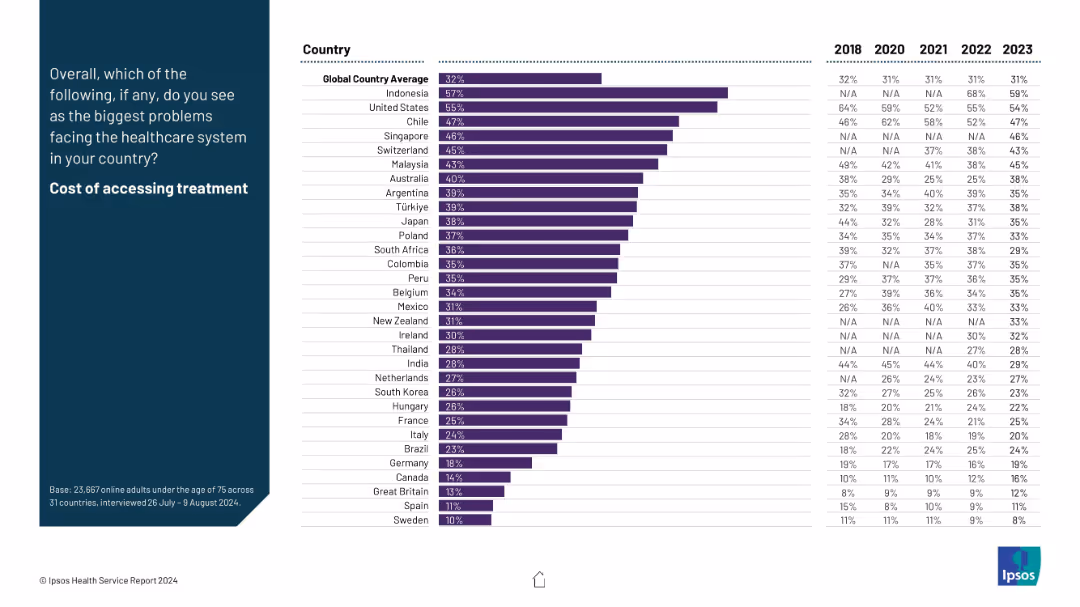
Country bar chart ranking concern about healthcare costs, with historical trend data (2018–2023).
Risk Assessment and Management
Healthcare & Pharmaceuticals
This slide ranks countries based on public concern over the cost of accessing treatment. The five-year trend highlights how financial barriers are a major healthcare issue in nations like Indonesia and the U.S., offering insights into affordability challenges.
healthcare cost, treatment affordability, financial access, Ipsos, survey, global trends, economic barriers, perception
false
Risk Assessment and Management
Healthcare & Pharmaceuticals
Mixed Chart
IPSOS
Add to my slides
Remove from favorites
Displays a grid layout with text and symbolic imagery for different aspects of future healthcare systems, like continuous monitoring and virtual care.
Strategic Planning
Healthcare & Pharmaceuticals
Provides a vision for digital transformation in healthcare, highlighting the necessity for innovations such as connected homes and intelligent treatments.
Healthcare, Digital Transformation, Future Trends, Patient Care, Technology Integration
false
Strategic Planning
Healthcare & Pharmaceuticals
Table
Accenture
Add to my slides
Remove from favorites
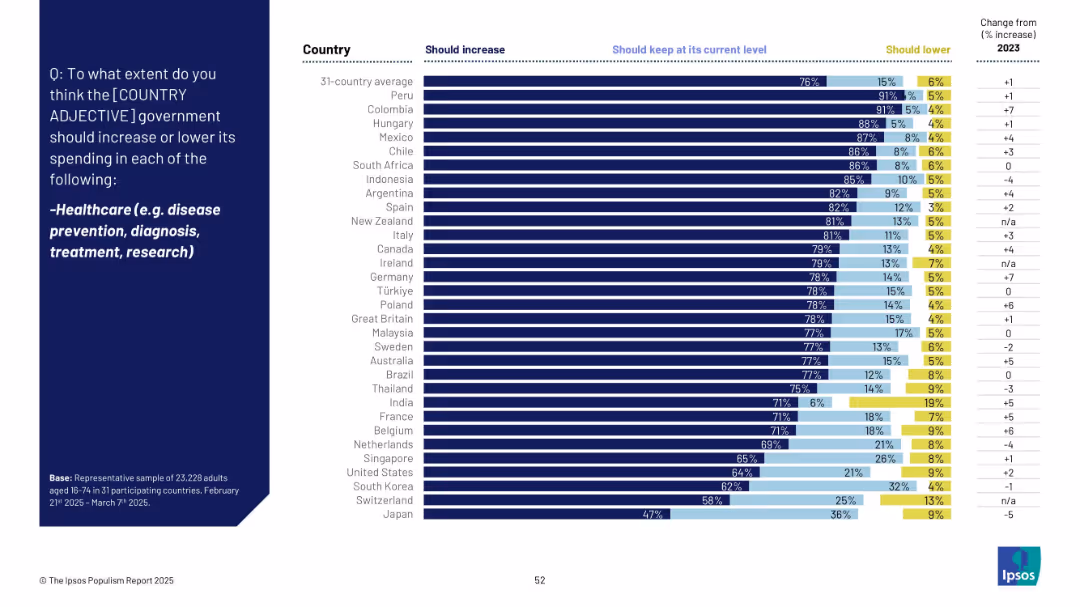
Horizontal bar chart showing public opinion on whether healthcare spending should be increased, maintained, or lowered, with % change from 2023.
Strategic Planning
Healthcare & Pharmaceuticals
The majority of respondents in most countries (76% avg) favor increased government spending on healthcare. Support is highest in Peru, Colombia, and Hungary. Japan and Switzerland have lower percentages, possibly reflecting different national contexts.
healthcare, disease prevention, spending, public services, medical care, Ipsos, global, bar chart
false
Strategic Planning
Healthcare & Pharmaceuticals
Mixed Chart
IPSOS
Add to my slides
Remove from favorites
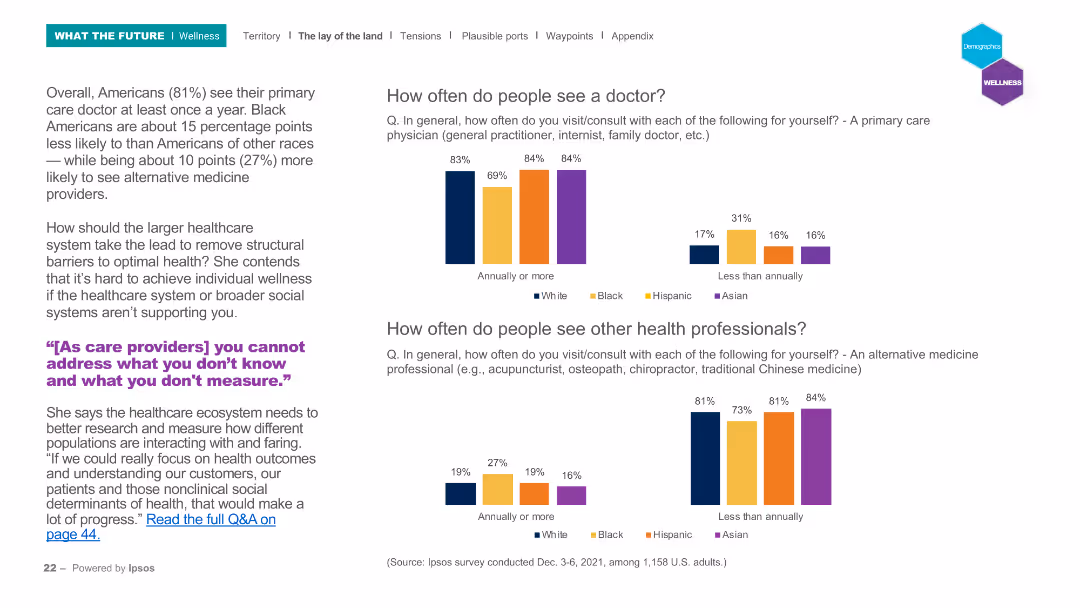
The slide has a header and two sections: a text block on the left and two sets of column charts on the right. The first column chart shows the frequency of doctor visits among different ethnic groups, while the second shows the frequency of visits to other health professionals, using different colors for each ethnic group.
Market Analysis and Trends
Healthcare & Pharmaceuticals
Analyzes the frequency of primary care doctor visits and consultations with other health professionals among different ethnic groups in the U.S. The column charts compare annual and less frequent visits, highlighting disparities in healthcare access and usage among these groups.
Healthcare, doctor visits, ethnic groups, survey, frequency
false
Market Analysis and Trends
Healthcare & Pharmaceuticals
Multiple Chart
IPSOS
Add to my slides
Remove from favorites
Slide showcasing L.E.K.'s healthcare sector overview, detailing their vertical and horizontal practices, and key capabilities.
Industry Overview
Healthcare & Pharmaceuticals
This slide provides an overview of L.E.K.'s comprehensive coverage of the healthcare ecosystem, including their practices and specialized capabilities.
Healthcare ecosystem, L.E.K., vertical practices, horizontal practices, capabilities
false
Industry Overview
Healthcare & Pharmaceuticals
Diagram
LEK
Add to my slides
Remove from favorites
Two-column layout with question and text on the left; horizontal bar chart segmented by gender and generation on the right.
Risk Assessment and Management
Healthcare & Pharmaceuticals
The slide displays survey results on perceptions of equality in healthcare delivery, segmented by gender and generational cohort. It compares the percentages of respondents who agree or disagree that care is equally provided.
healthcare, equality, generational data, gender, survey, care standards, perception, Ipsos, agreement, disparity
false
Risk Assessment and Management
Healthcare & Pharmaceuticals
Mixed Chart
IPSOS
Add to my slides
Remove from favorites
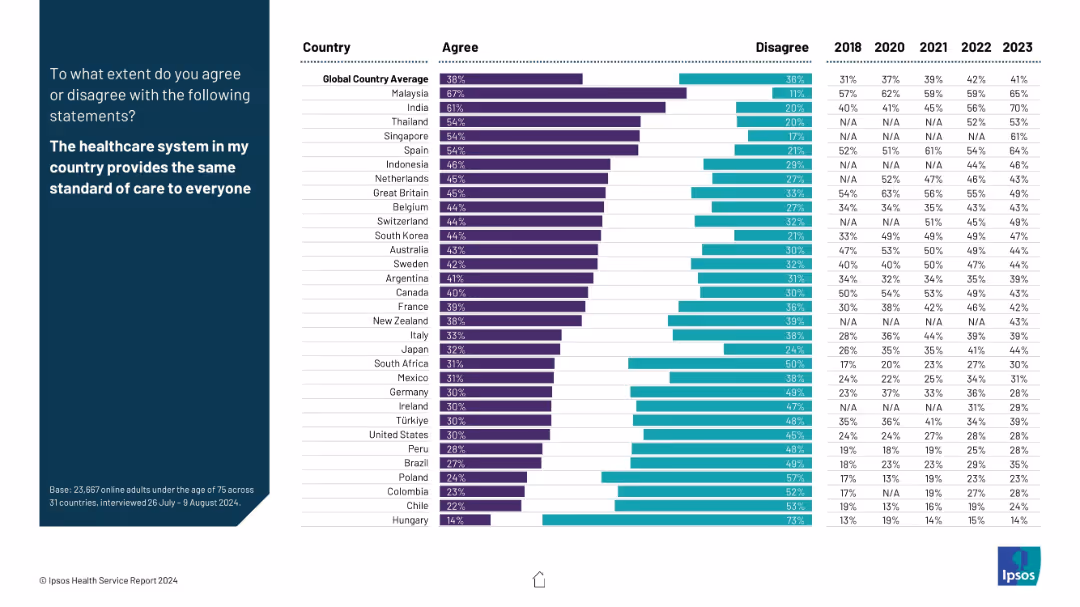
Same structure: headline on left, data visualization on right. Yearly comparison across countries included.
Market Analysis and Trends
Healthcare & Pharmaceuticals
This slide explores equity in healthcare delivery across countries by asking whether the same standard of care is provided to all. It analyzes agreement levels and changes over time, providing insight into perceived fairness and healthcare equality.
healthcare equity, standard of care, fairness, public sentiment, access, countries, Ipsos, healthcare perception
false
Market Analysis and Trends
Healthcare & Pharmaceuticals
Mixed Chart
IPSOS
Add to my slides
Remove from favorites
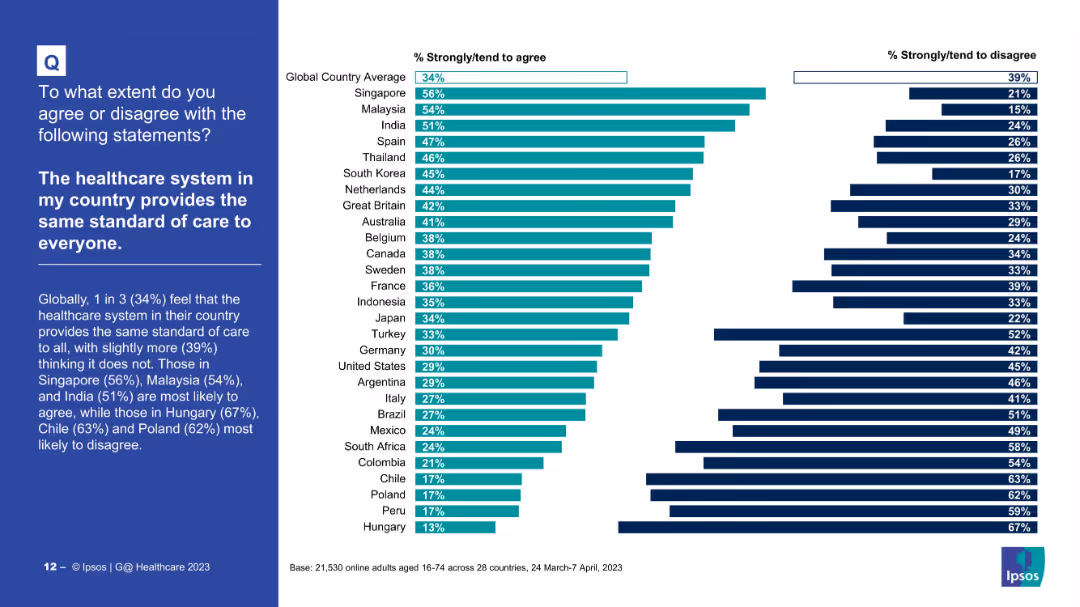
Left-aligned text with commentary; right-aligned bar chart ranks countries on perceived equity in healthcare service standards.
Regulatory and Compliance
Healthcare & Pharmaceuticals
This slide assesses perceived equity in healthcare service standards. Singapore and Malaysia show the most agreement, while Hungary and Poland rank lowest. It identifies disparities in perceptions of care uniformity across countries.
healthcare equity, standard of care, fairness, public view, Ipsos survey, patient rights, service consistency, healthcare equality, global rankings
false
Regulatory and Compliance
Healthcare & Pharmaceuticals
Mixed Chart
IPSOS
Add to my slides
Remove from favorites
The slide contains two column charts. The first chart shows OECD average current expenditure on health as a percent of GDP from 1970 to 2022. The second chart displays global health care M&A activity over the past 25 years. A bar chart at the bottom shows U.S. drug patent expirations by year.
Market Analysis and Trends
Healthcare & Pharmaceuticals
This slide presents data on the increasing expenditure on health care as a percentage of GDP in OECD countries and the global trend in health care M&A activity. It also highlights U.S. drug patent expiration data.
health care, expenditure, M&A, patents, OECD
false
Market Analysis and Trends
Healthcare & Pharmaceuticals
Multiple Chart
JP Morgan
Add to my slides
Remove from favorites
This slide includes a header, body text, and three percentage indicators in different colored boxes (green, blue, red). The percentages are displayed above each box, showing the perceived performance of healthcare systems in optimizing patient experience.
Customer and Market Segmentation
Healthcare & Pharmaceuticals
This slide highlights the importance of the healthcare experience for Irish consumers, emphasizing equitable treatment and optimization of the health experience regardless of personal circumstances. It shows varied ratings for healthcare system performance.
healthcare, experience, Ireland, equitable treatment
false
Customer and Market Segmentation
Healthcare & Pharmaceuticals
Mixed Chart
EY
Add to my slides
Remove from favorites
The slide features a dark background, a quote in a yellow text box, and a question followed by a bar chart showing performance ratings of healthcare system aspects.
Customer and Market Segmentation
Healthcare & Pharmaceuticals
This slide presents Canadian consumers' ratings of the healthcare system's performance in optimizing experiences regardless of personal circumstances.
Healthcare experience, performance, consumer ratings, equitable treatment, Canada
false
Customer and Market Segmentation
Healthcare & Pharmaceuticals
Mixed Chart
EY
Add to my slides
Remove from favorites
This slide includes a header, body text, and three percentage indicators in different colored boxes (green, blue, red). The percentages are displayed above each box, showing the perceived performance of healthcare systems in optimizing patient experience.
Customer and Market Segmentation
Healthcare & Pharmaceuticals
This slide highlights the importance of the healthcare experience for US consumers, emphasizing equitable treatment and optimization of the health experience regardless of personal circumstances. It shows varied ratings for healthcare system performance.
healthcare, experience, US, equitable treatment
false
Customer and Market Segmentation
Healthcare & Pharmaceuticals
Mixed Chart
EY
Add to my slides
Remove from favorites
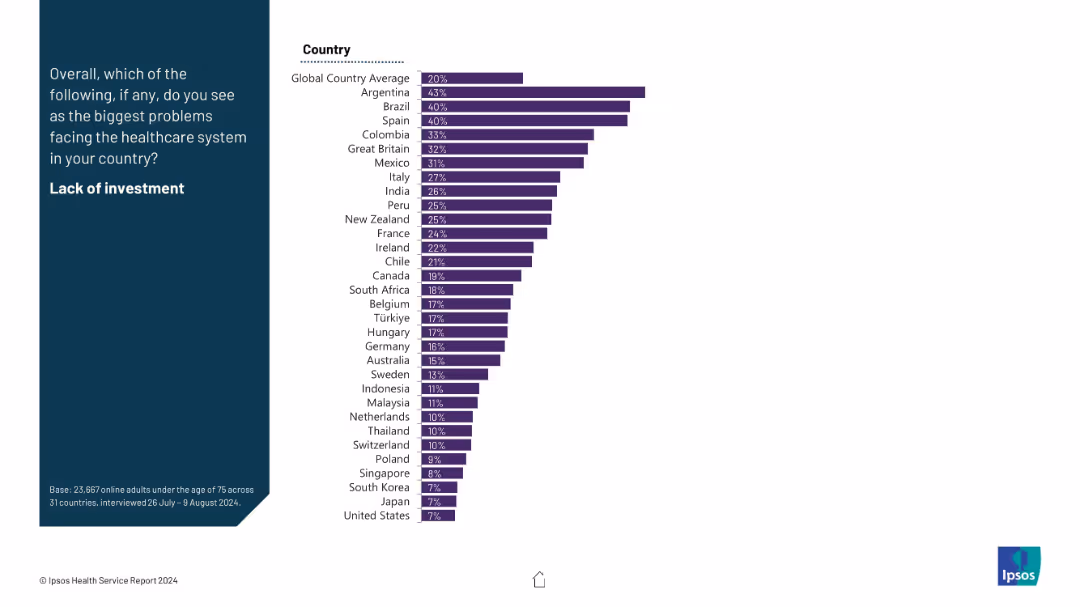
Horizontal bar chart showing public concern about healthcare investment levels; ranked country data displayed.
Investment Analysis
Healthcare & Pharmaceuticals
This slide reveals which countries perceive underinvestment in healthcare as a major issue. Argentina and Brazil rank highest. The global average concern is 20%, highlighting regional disparities.
healthcare funding, investment, infrastructure, public opinion, economic concern, survey insight, country rankings
false
Investment Analysis
Healthcare & Pharmaceuticals
Mixed Chart
IPSOS
Add to my slides
Remove from favorites
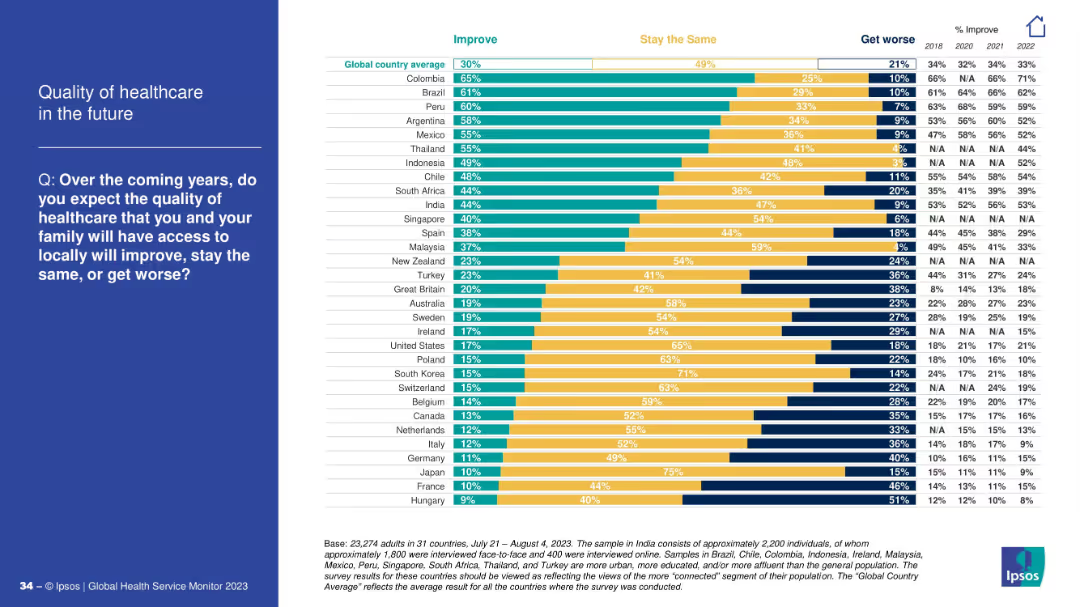
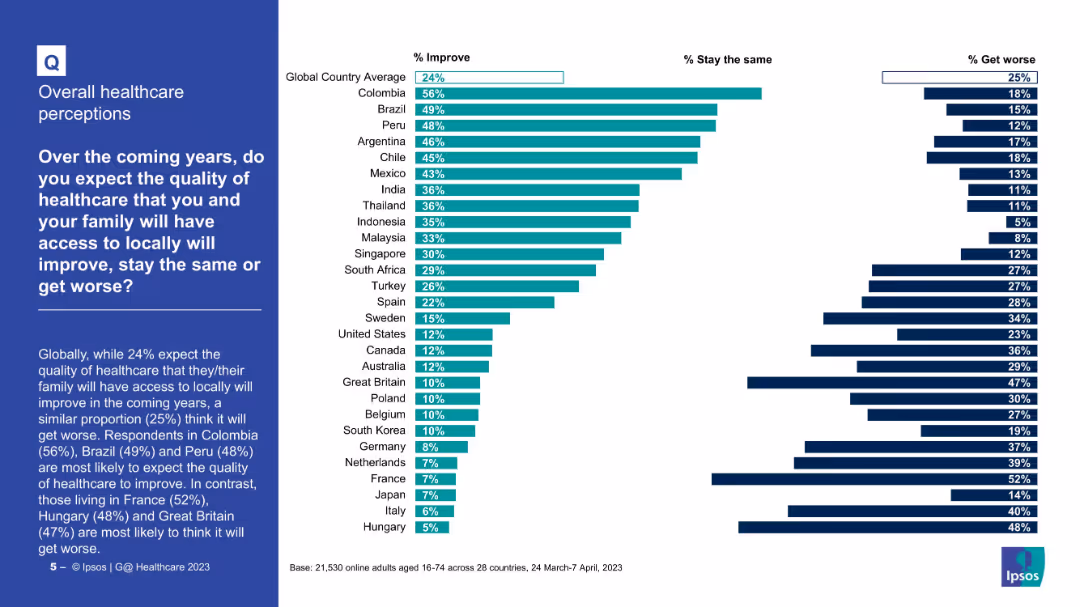
Stacked bar chart with future outlooks ("Improve", "Stay the same", "Get worse") per country.
Strategic Planning
Healthcare & Pharmaceuticals
Respondents' outlooks on future healthcare quality vary widely by country. Colombia, Brazil, and Peru are optimistic, while Japan and Hungary are notably pessimistic. Historical trends from 2018–2022 are included.
healthcare future, expectations, global outlook
false
Strategic Planning
Healthcare & Pharmaceuticals
Mixed Chart
IPSOS
Add to my slides
Remove from favorites
This slide presents pie charts and a global map to illustrate the market capitalization and global presence of surveyed companies. The design is clean with color-coded pie charts for easy interpretation and a grey world map highlighting operational regions.
Regulatory and Compliance
Healthcare & Pharmaceuticals
Provides an overview of industry practices in healthcare professional engagement by showing the market size and global operation scale of responding companies. It discusses the sector's distribution and geographic reach, aiming to give insights into global healthcare market dynamics.
healthcare, global presence, market capitalization, industry practices, survey results
false
Regulatory and Compliance
Healthcare & Pharmaceuticals
Multiple Chart
Deloitte
Add to my slides
Remove from favorites
Text and icons outlining the healthcare sector's 6% organic growth in 2022, emphasizing the ageing population, access to services, and tech development, alongside key solutions driving growth.
Market Analysis and Trends
Healthcare & Pharmaceuticals
This slide focuses on the healthcare industry's growth, highlighting trends like an ageing population and tech advancements, and detailing solutions like syndicated studies and clinical research.
healthcare, industry growth, ageing population, tech development, solutions
false
Market Analysis and Trends
Healthcare & Pharmaceuticals
Vertical Flow
IPSOS
Add to my slides
Remove from favorites
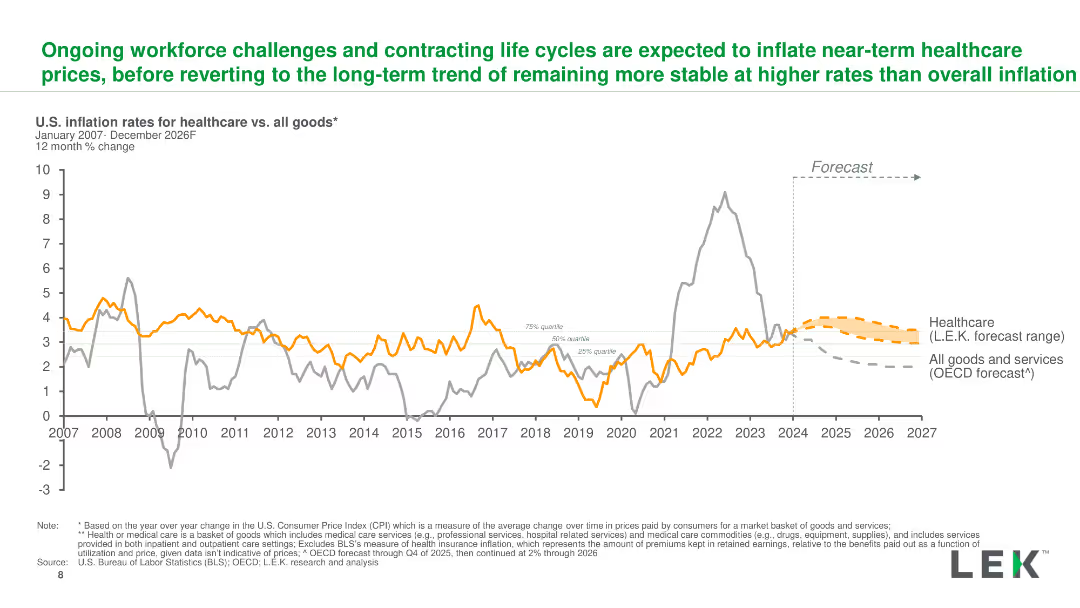
A line chart forecasting U.S. inflation rates for healthcare and all goods from 2024 to 2026, with historical data from 2007 and projections clearly marked.
Risk Assessment and Management
Healthcare & Pharmaceuticals
The slide forecasts healthcare inflation, highlighting the impact of workforce challenges and the expected stabilization of rates compared to overall inflation.
healthcare, inflation, forecast, workforce, trends
false
Risk Assessment and Management
Healthcare & Pharmaceuticals
Single Chart
LEK
Add to my slides
Remove from favorites
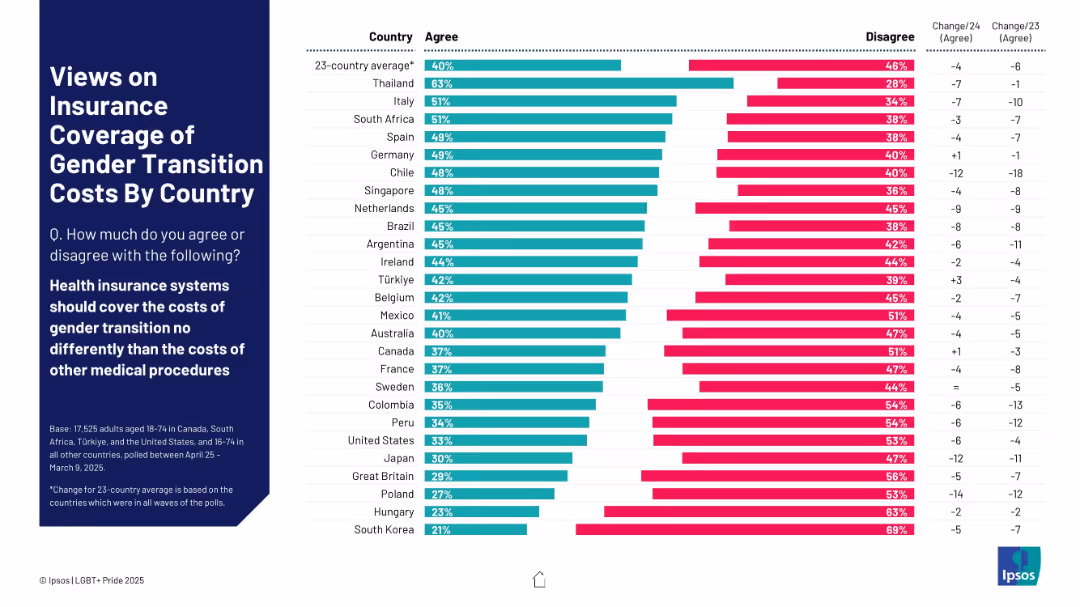
Horizontal bar chart displaying agreement/disagreement across countries on insurance coverage for gender transition. Standard color scheme with change data.
Risk Assessment and Management
Healthcare & Pharmaceuticals
This slide assesses public opinion on whether health insurance should cover gender transition costs like other medical procedures. The chart shows agreement/disagreement percentages by country and includes change data over the past years.
healthcare, insurance, gender transition, medical procedures, public opinion, policy, international views, risk management, LGBTQ+
false
Risk Assessment and Management
Healthcare & Pharmaceuticals
Mixed Chart
IPSOS
Add to my slides
Remove from favorites
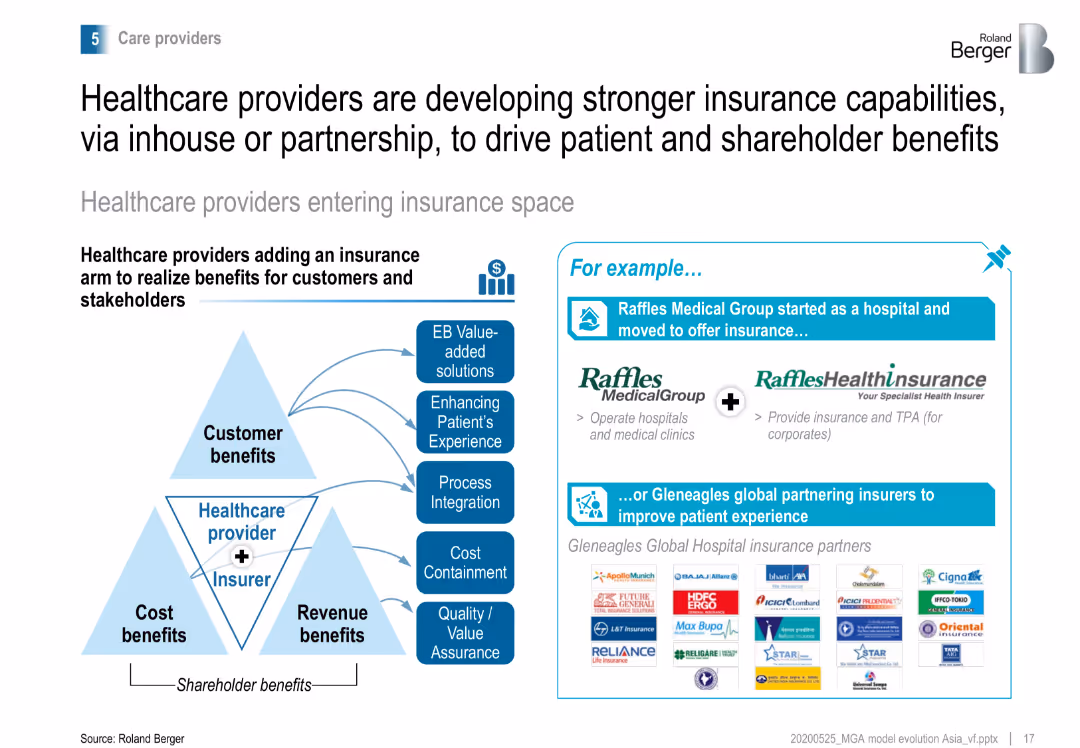
Pyramid diagram showing the benefits of healthcare providers entering the insurance space, with examples like Raffles Medical Group and Gleneagles Global partnering with insurers.
Strategic Planning
Healthcare & Pharmaceuticals
Highlights how healthcare providers are adding insurance capabilities to realize benefits for customers and shareholders, improving patient experience and cost management.
healthcare, insurance, strategic planning, partnerships
false
Strategic Planning
Healthcare & Pharmaceuticals
Diagram
Roland Berger
Add to my slides
Remove from favorites
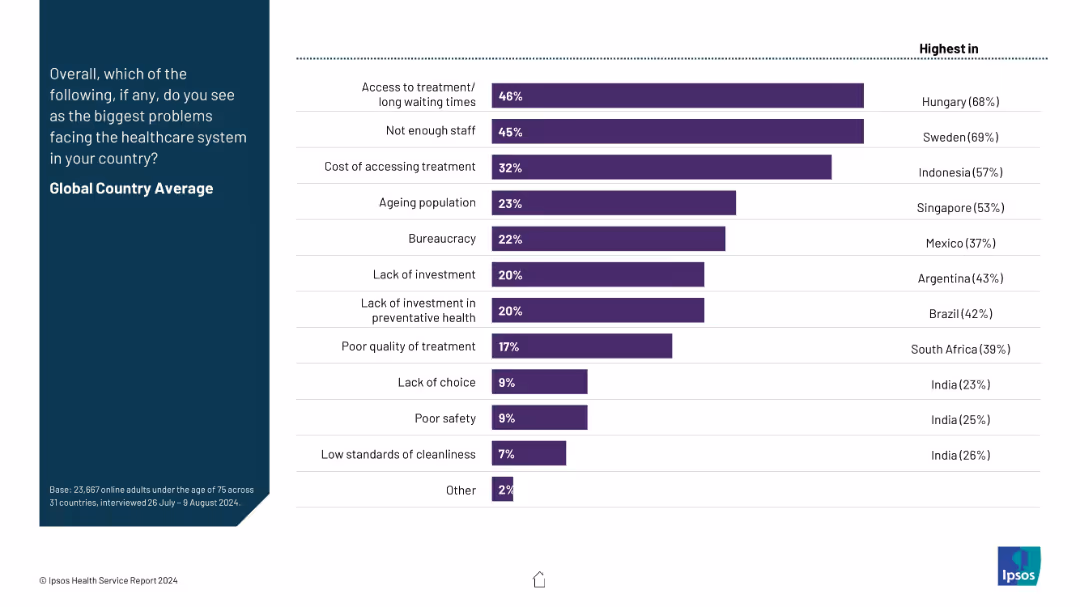
Horizontal bar chart on the right with ranked global country average issues; no yearly data trend. Left side contains a title and brief explanation.
Risk Assessment and Management
Healthcare & Pharmaceuticals
This slide summarizes the top healthcare system challenges globally, such as long wait times, staff shortages, treatment costs, bureaucracy, and lack of investment. The chart highlights both global averages and countries with the highest concern levels for each problem.
healthcare issues, access, staffing, cost, bureaucracy, public concerns, global average, Ipsos, investment, wait times
false
Risk Assessment and Management
Healthcare & Pharmaceuticals
Mixed Chart
IPSOS
Add to my slides
Remove from favorites
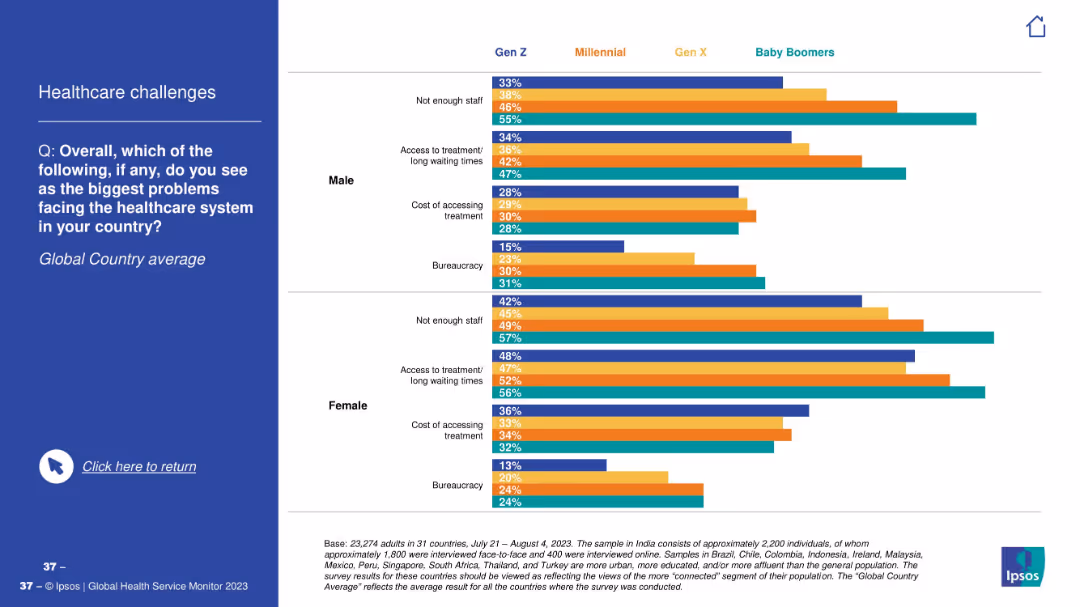
Bar charts by gender and generation; each group has four bars showing top healthcare issues (staff, access, cost, bureaucracy).
Market Analysis and Trends
Healthcare & Pharmaceuticals
The slide visualizes top challenges people identify in their country’s healthcare system—“Not enough staff” and “Access to treatment” are dominant across genders and generations. Data presented globally.
healthcare issues, staff shortage, access, cost, bureaucracy, global average, gender, age cohort, concerns
false
Market Analysis and Trends
Healthcare & Pharmaceuticals
Mixed Chart
IPSOS
Add to my slides
Remove from favorites
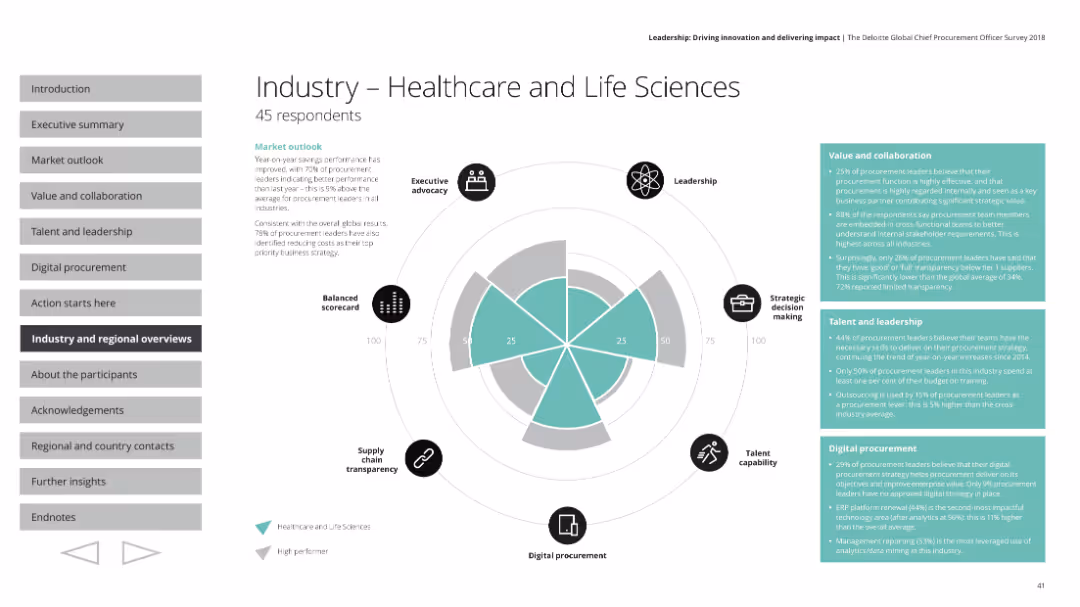
The slide shows a radar chart with various performance indicators, along with text boxes containing detailed survey results and small icons for each metric.
Industry Overview
Healthcare & Pharmaceuticals
This slide provides insights into the healthcare and life sciences industry's procurement performance from a survey. It discusses executive advocacy, leadership, strategic decision making, talent capability, digital procurement, and supply chain transparency, with market outlook and specific metrics on value, collaboration, talent, and leadership.
Healthcare, life sciences, procurement, radar chart, survey results
false
Industry Overview
Healthcare & Pharmaceuticals
Mixed Chart
Deloitte
Add to my slides
Remove from favorites
Graphic slide showcasing the healthcare sector opportunity, including dedicated icons and statistics related to U.S. healthcare expenditure.
Market Analysis and Trends
Healthcare & Pharmaceuticals
Highlights the potential in the healthcare market, detailing JPMorgan Chase & Co.'s positioning and strategic focus.
Healthcare market, expenditure, U.S. GDP, banking strategy, JPMorgan Chase, financial services, market opportunity, client targeting
false
Market Analysis and Trends
Healthcare & Pharmaceuticals
Linear Flow
JP Morgan
Add to my slides
Remove from favorites
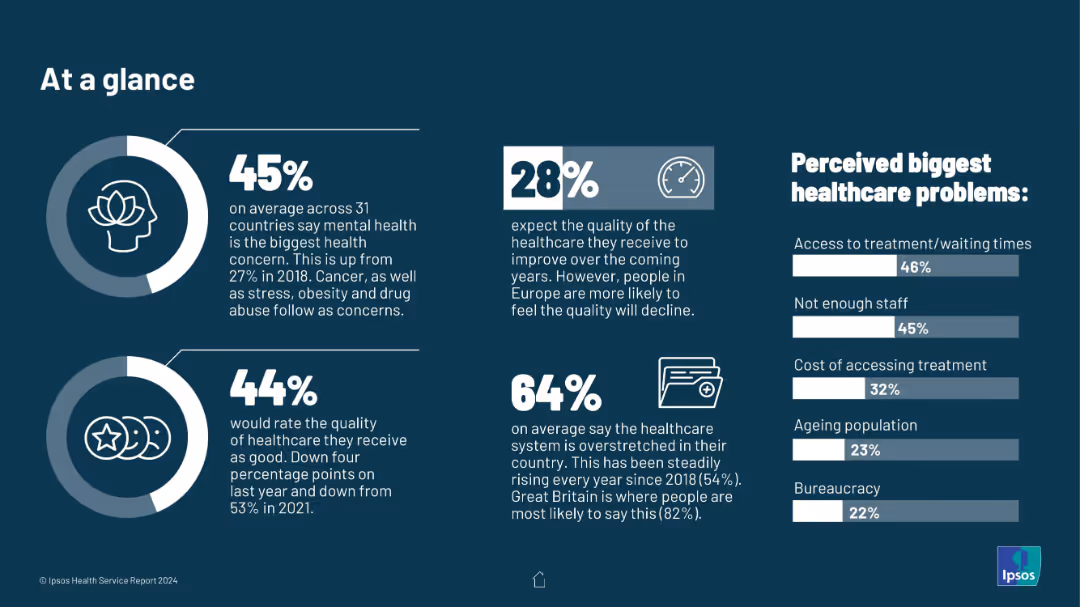
Dark blue background with infographic-style layout. Circular icons, bar charts, and bold percentages highlight healthcare concerns
Market Analysis and Trends
Healthcare & Pharmaceuticals
This slide presents global healthcare concerns: mental health is cited by 45% as the top issue. Other data covers expectations on healthcare quality and perceived biggest healthcare issues.
healthcare, mental health, global trends, access to care, staffing issues, patient concerns, Ipsos health report, data visualization
false
Market Analysis and Trends
Healthcare & Pharmaceuticals
Multiple Chart
IPSOS
Add to my slides
Remove from favorites
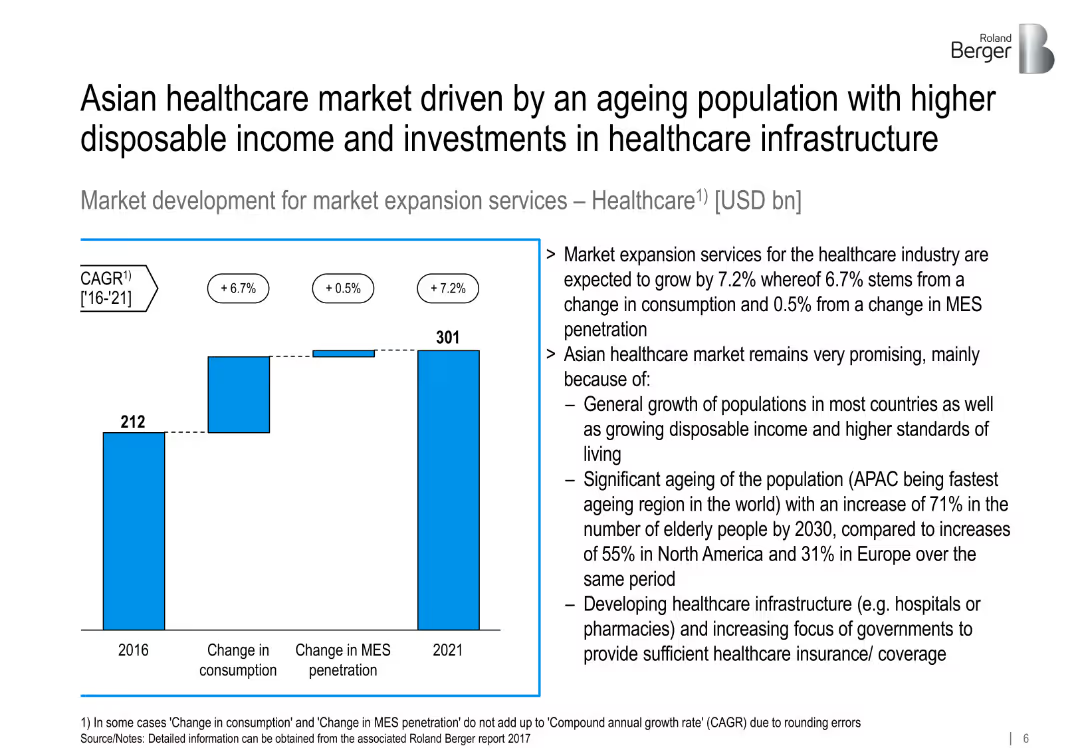
Healthcare MES bar chart showing 2016 vs. 2021 with CAGR; text details regional growth factors.
Market Analysis and Trends
Healthcare & Pharmaceuticals
Forecasts 7.2% CAGR for Asian healthcare MES, supported by ageing populations, improved incomes, and growing investment in infrastructure and insurance.
healthcare, MES, ageing population, Asia, infrastructure, market growth
false
Market Analysis and Trends
Healthcare & Pharmaceuticals
Mixed Chart
Roland Berger
Add to my slides
Remove from favorites
Horizontal bar chart comparing countries’ optimism, neutrality, or pessimism on future healthcare
Market Analysis and Trends
Healthcare & Pharmaceuticals
The slide reveals people’s expectations about healthcare quality in coming years. While 24% globally expect improvement, the highest optimism is in Colombia (56%). France and Hungary show most pessimism, expecting decline.
Healthcare outlook, future quality, global trends, public opinion, Ipsos
false
Market Analysis and Trends
Healthcare & Pharmaceuticals
Mixed Chart
IPSOS
Add to my slides
Remove from favorites
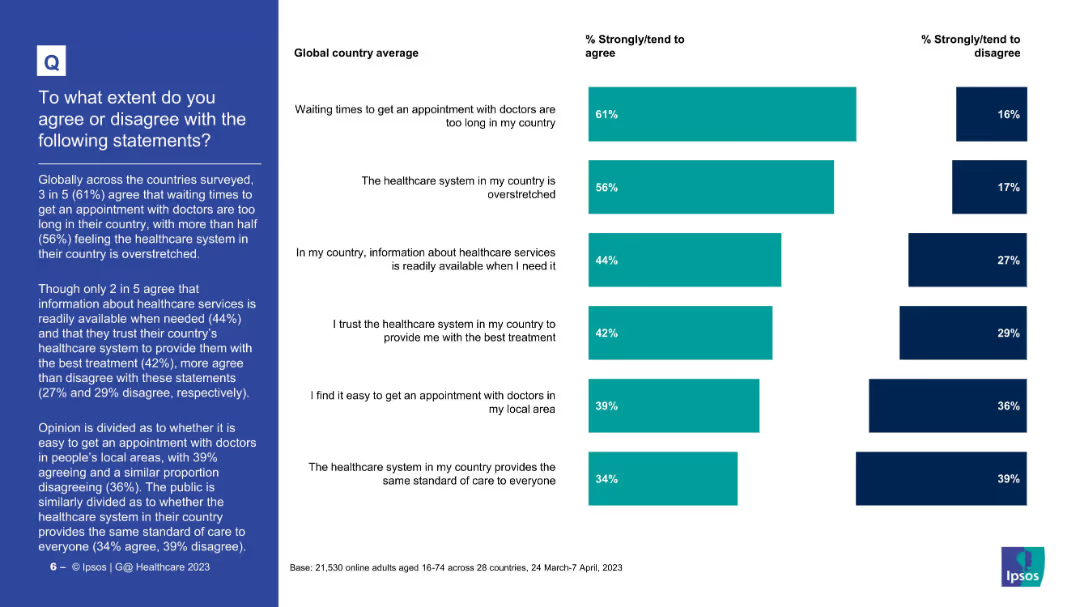
Vertical bar chart showing global averages for 6 healthcare-related statements
Market Analysis and Trends
Healthcare & Pharmaceuticals
This slide shows global average agreement levels on key healthcare system statements. 61% agree wait times are too long, and 56% believe the system is overstretched. Only 34% believe care is equal for all.
Healthcare perception, survey, global average, access to care, equity, satisfaction
false
Market Analysis and Trends
Healthcare & Pharmaceuticals
Mixed Chart
IPSOS
Add to my slides
Remove from favorites
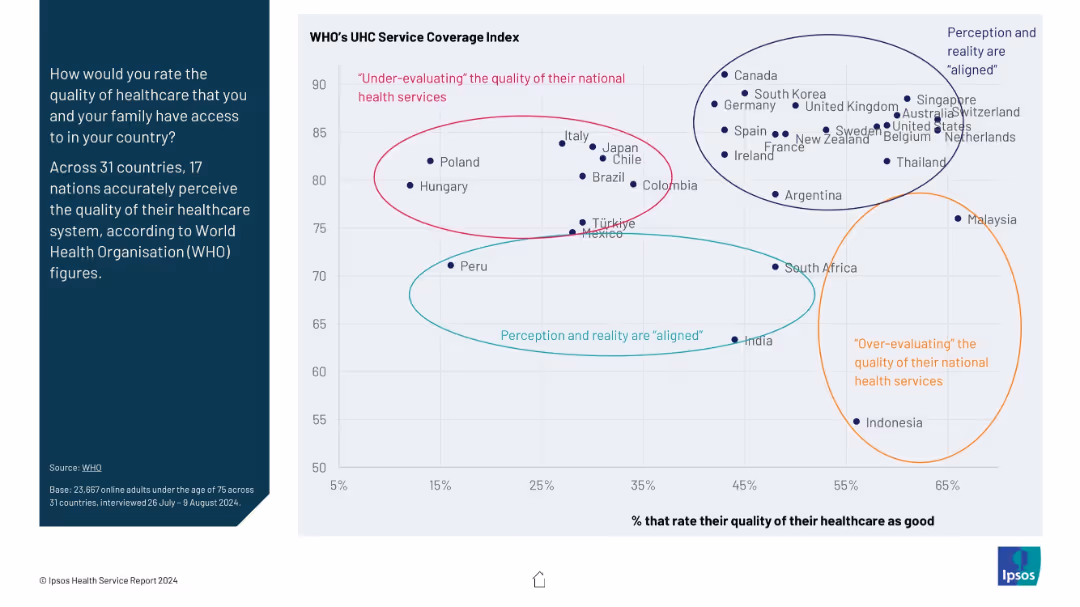
Scatter plot chart with overlaid shaded clusters; left panel contains question and methodology summary; axes measure WHO UHC index vs % rating healthcare quality.
Strategic Planning
Healthcare & Pharmaceuticals
This slide compares perceived healthcare quality with the WHO’s UHC Service Coverage Index across 31 countries. Countries are categorized into clusters: “under-evaluating,” “over-evaluating,” or “aligned” with actual health service performance. It highlights a perception gap in public sentiment vs healthcare reality.
healthcare perception, WHO index, UHC, international comparison, under-evaluation, over-evaluation, public opinion, health systems, data visualization
false
Strategic Planning
Healthcare & Pharmaceuticals
Mixed Chart
IPSOS
Add to my slides
Remove from favorites
This slide features a header, body text, and four circular percentage indicators. Each indicator highlights consumer willingness to use technology-enhanced care methods such as genetic testing, wearable sensors, non-urgent care at retail locations, and personalized medications.
Technology and Digital Transformation
Healthcare & Pharmaceuticals
The slide discusses the openness of Irish consumers to adopt technology-enhanced care for personalized healthcare experiences. It emphasizes the willingness to use genetic testing, wearable sensors, and non-urgent care in retail settings.
healthcare, personalized care, technology, Ireland, genetic testing
false
Technology and Digital Transformation
Healthcare & Pharmaceuticals
Mixed Chart
EY
Add to my slides
Remove from favorites
This slide is divided into two halves, one showing a column chart of healthcare expenditures, and the other showing pharmaceutical forecasts in column charts.
Financial Performance
Healthcare & Pharmaceuticals
Covers healthcare expenditures and pharmaceutical sales and exports, projecting growth and providing market insights for the Philippines.
healthcare, pharmaceuticals, expenditures, forecast, growth
false
Financial Performance
Healthcare & Pharmaceuticals
Multiple Chart
Deloitte
Add to my slides
Remove from favorites
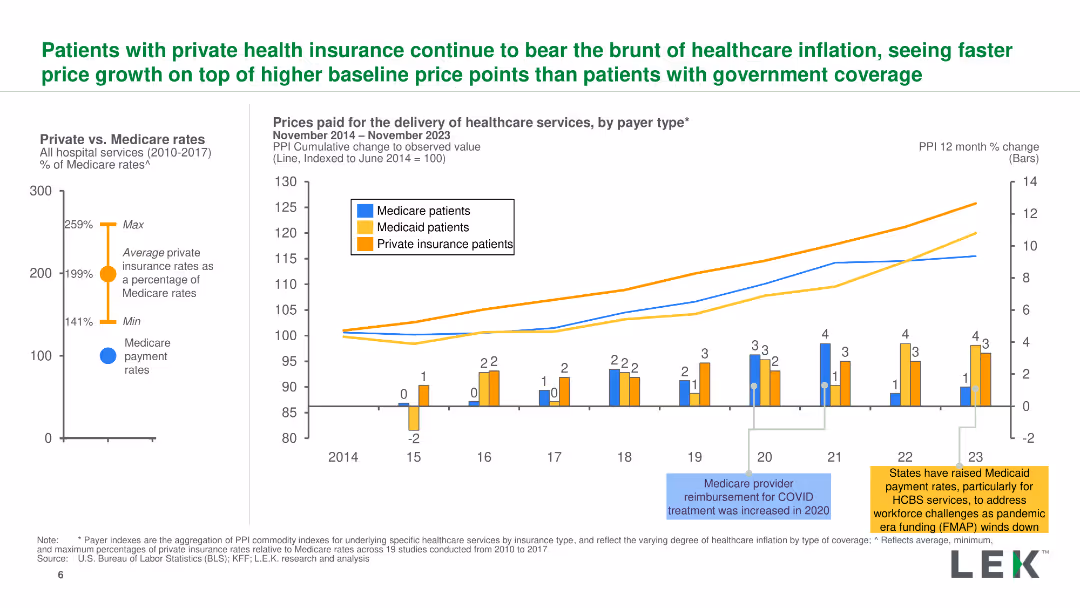
A column chart depicting the cumulative change in prices paid for healthcare services by Medicare, Medicaid, and private insurance from 2014 to 2023, with clear legends and labels.
Financial Performance
Healthcare & Pharmaceuticals
The slide compares the prices paid for healthcare services by different payer types, showing trends and variations over time, including impacts of policy changes.
healthcare, prices, payer types, trends, comparison
false
Financial Performance
Healthcare & Pharmaceuticals
Multiple Chart
LEK
Add to my slides
Remove from favorites
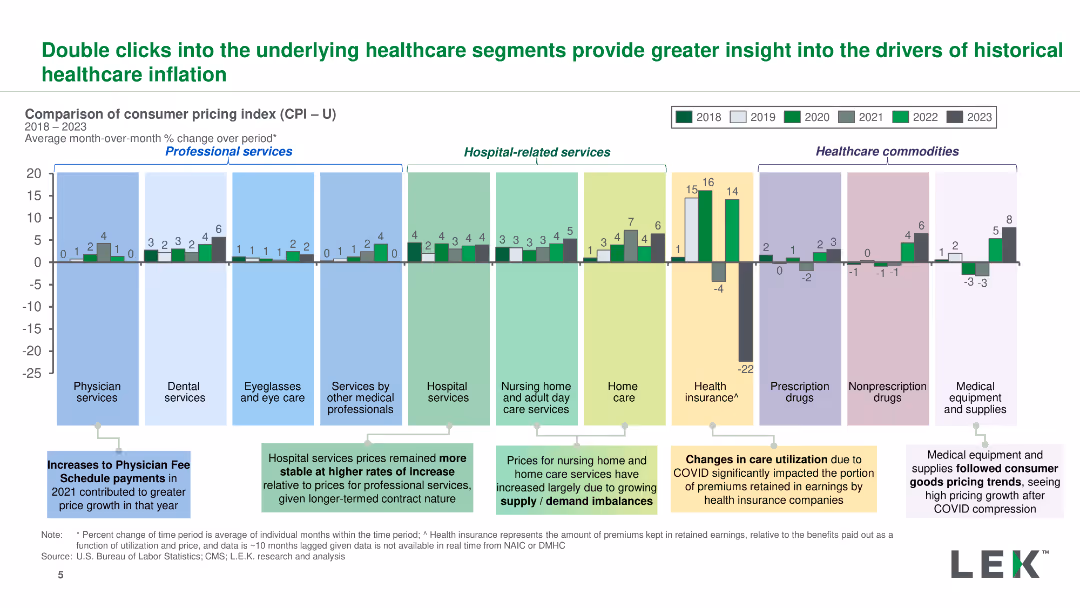
A bar chart showing the month-over-month percentage change in consumer pricing index for various healthcare segments from 2018 to 2023, with detailed labels and color coding.
Product and Service Analysis
Healthcare & Pharmaceuticals
The slide analyzes healthcare pricing trends across different segments, highlighting significant changes and the impact of COVID-19 on healthcare costs.
healthcare, pricing, segments, COVID-19, analysis
false
Product and Service Analysis
Healthcare & Pharmaceuticals
Single Chart
LEK
Add to my slides
Remove from favorites
Simple design focusing on a pie chart with a small legend describing regional differences in processes. The color green is used to denote different responses, facilitating an easy visual distinction between categories.
Regulatory and Compliance
Healthcare & Pharmaceuticals
Discusses the consistency of processes and technology for healthcare professional engagement across different regions. It highlights varying levels of adoption and challenges in standardizing practices globally, aiming to underline the importance of unified operational strategies.
healthcare processes, regional differences, operational consistency, survey analysis
false
Regulatory and Compliance
Healthcare & Pharmaceuticals
Single Chart
Deloitte
Add to my slides
Remove from favorites
The slide presents a table chart detailing organizational responsibility in healthcare professional (HCP) engagement activities across various departments. Highlighted cells indicate the department with the majority of responses.
Market Analysis and Trends
Healthcare & Pharmaceuticals
This slide analyzes the distribution of responsibilities in HCP engagement activities across different departments within organizations, useful for assessing departmental workloads and process efficiency.
healthcare, professional engagement, organizational responsibility, survey, departmental distribution
false
Market Analysis and Trends
Healthcare & Pharmaceuticals
Table
Deloitte
Add to my slides
Remove from favorites
The slide is straightforward with a flow diagram and limited use of color, focusing on clarity and simplicity. It outlines the phases of healthcare professional engagement, including planning, contracting, and payment processes.
Regulatory and Compliance
Healthcare & Pharmaceuticals
This slide describes the sequential process of engaging healthcare professionals, from annual planning through payment and reporting. It aims to provide a clear framework for managing healthcare professional relationships effectively in a compliant and structured manner.
healthcare, professional engagement, planning, contracting, compliance
false
Regulatory and Compliance
Healthcare & Pharmaceuticals
Linear Flow
Deloitte
Add to my slides
Remove from favorites
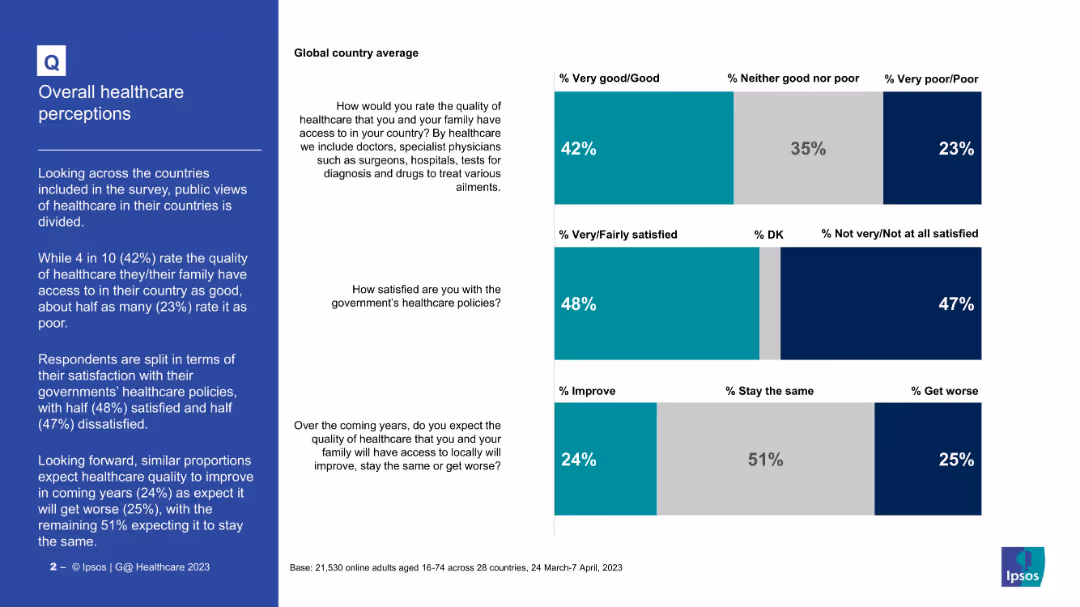
Three bar charts (stacked) with global averages for healthcare quality, policy satisfaction, outlook
Market Analysis and Trends
Healthcare & Pharmaceuticals
This slide provides global perceptions of healthcare based on three questions: quality of healthcare (42% good), satisfaction with policies (48%), and future outlook (24% expect improvement). Views are fairly divided on all metrics.
Healthcare, public opinion, global average, satisfaction, policy, healthcare quality, future outlook, survey
false
Market Analysis and Trends
Healthcare & Pharmaceuticals
Mixed Chart
IPSOS
Add to my slides
Remove from favorites
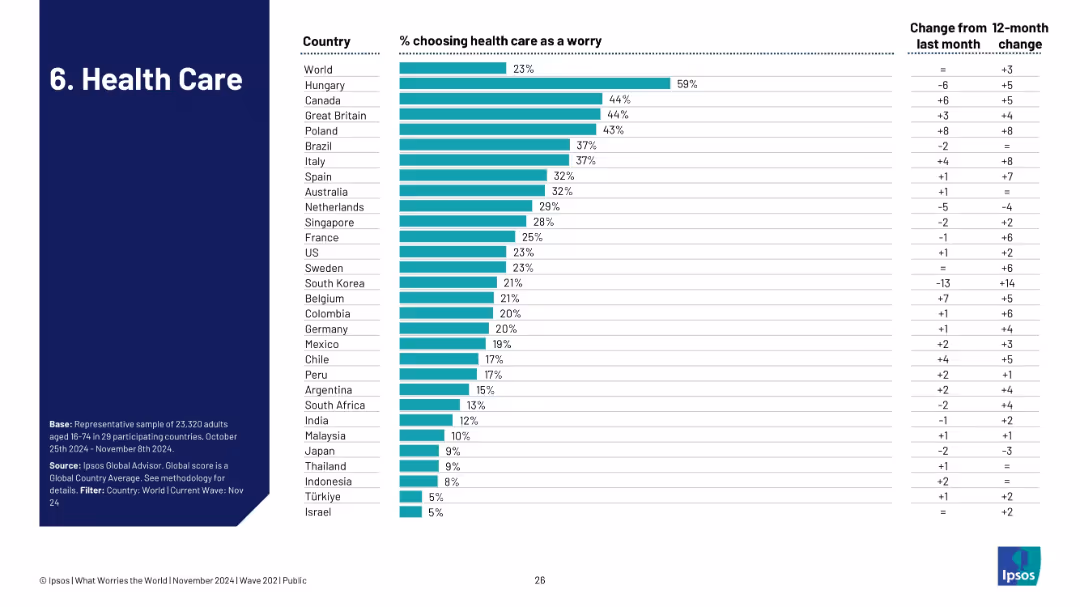
Bar chart of countries concerned with health care; includes monthly and yearly trend columns.
Strategic Planning
Healthcare & Pharmaceuticals
Shows public worry about healthcare systems, with Hungary (59%) and Canada/UK (44%) leading concerns. The data reflects both consistent and shifting national health concerns amid broader economic and societal issues.
healthcare, public opinion, system capacity, Ipsos, medical services, survey, societal concern, planning, accessibility
false
Strategic Planning
Healthcare & Pharmaceuticals
Single Chart
IPSOS
Add to my slides
Remove from favorites
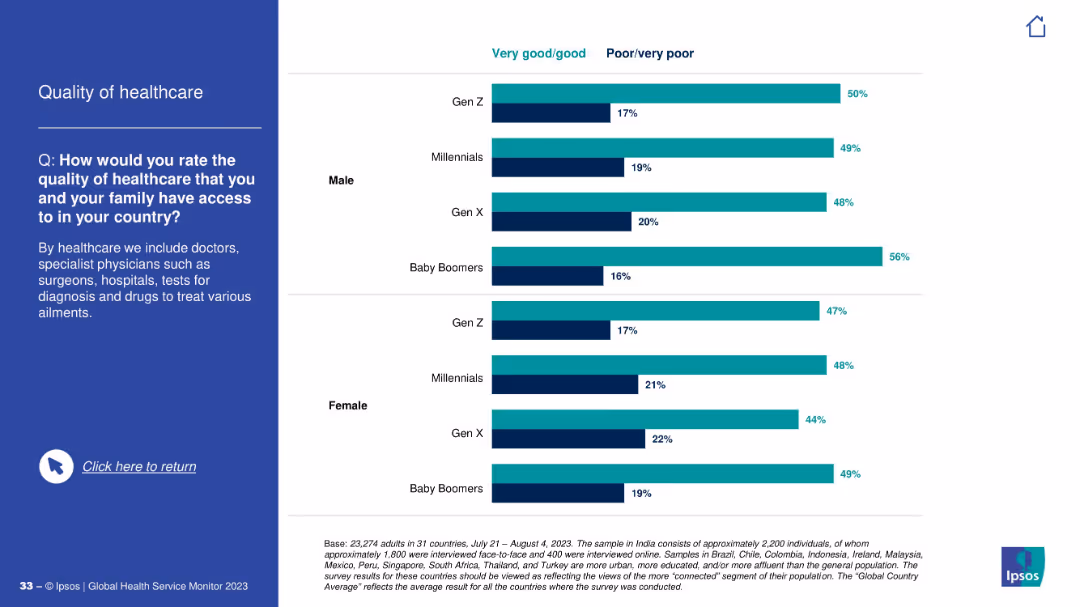
Horizontal stacked bar chart showing “Very good/good” vs. “Poor/very poor” by gender and generation.
Customer and Market Segmentation
Healthcare & Pharmaceuticals
This slide illustrates perceptions of healthcare quality by generation and gender. Baby Boomers show the highest dissatisfaction among women (56% rate it poor), while Gen Z males show the most favorable views (50% positive).
healthcare quality, generational comparison
false
Customer and Market Segmentation
Healthcare & Pharmaceuticals
Mixed Chart
IPSOS
Add to my slides
Remove from favorites
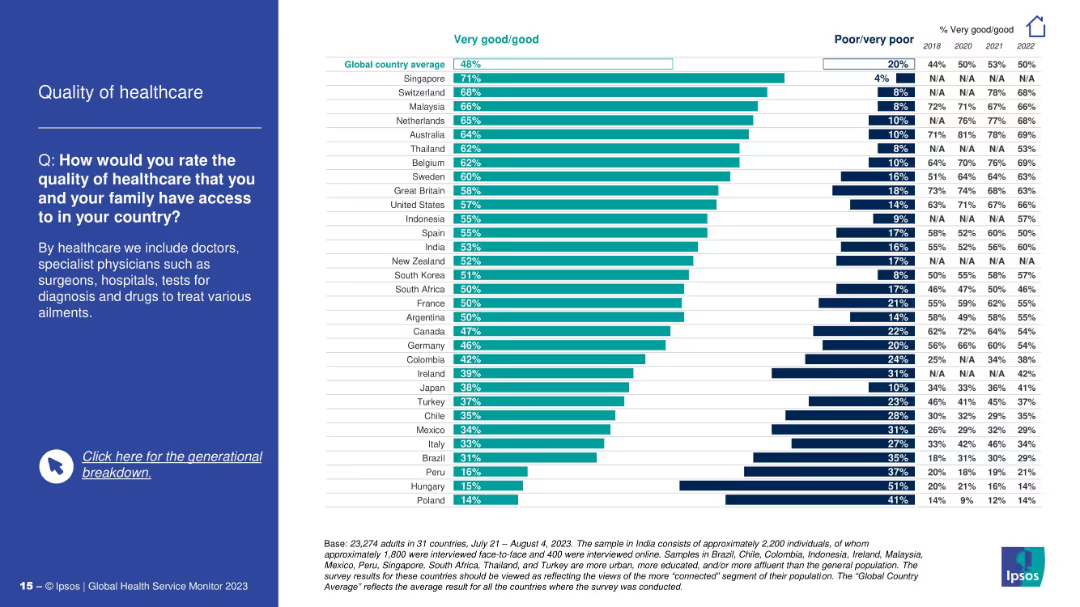
Left-aligned question on a blue background; right side features a horizontal bar chart ranking countries by response.
Performance Metrics and KPIs
Healthcare & Pharmaceuticals
The slide assesses public perception of healthcare quality across countries. Singapore, Switzerland, and Malaysia lead in perceived high quality. It also shows historical perception trends and contrasts “very good/good” vs. “poor/very poor.”
healthcare quality, global ranking, patient perception, country comparison, Ipsos, access to care, satisfaction
false
Performance Metrics and KPIs
Healthcare & Pharmaceuticals
Mixed Chart
IPSOS
Add to my slides
Remove from favorites
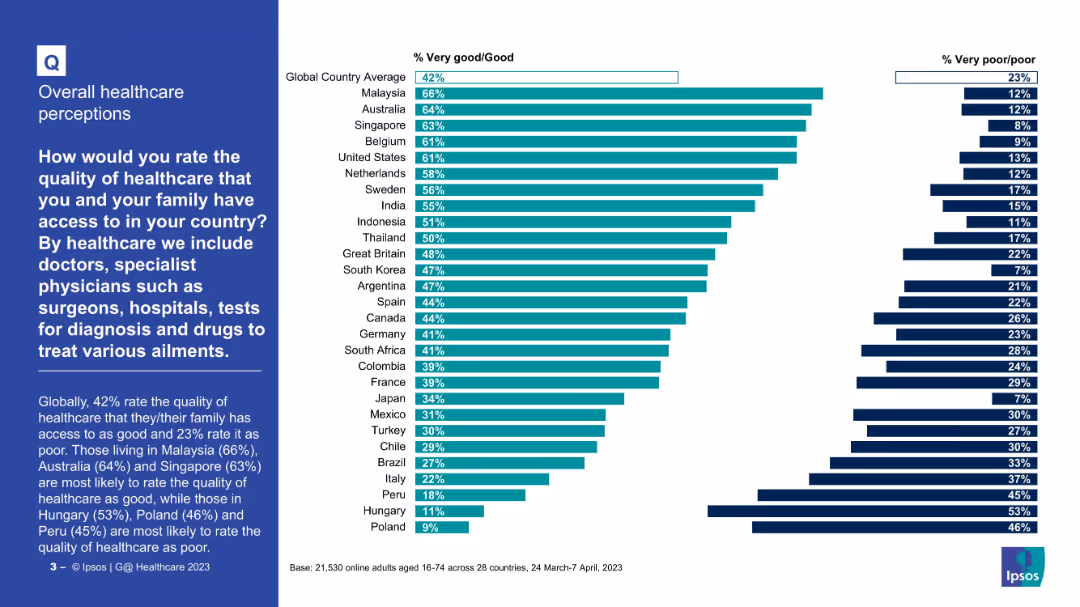
Horizontal bar chart comparing countries by percent rating healthcare as “Very good/Good” or “Poor”
Market Analysis and Trends
Healthcare & Pharmaceuticals
The chart compares how people in 28 countries rate the quality of healthcare. Malaysia, Australia, and Singapore top the list positively. Hungary, Peru, and Poland have the lowest satisfaction levels with highest “poor” ratings.
Healthcare quality, international comparison, satisfaction, global survey, medical care, Ipsos
false
Market Analysis and Trends
Healthcare & Pharmaceuticals
Mixed Chart
IPSOS
Add to my slides
Remove from favorites
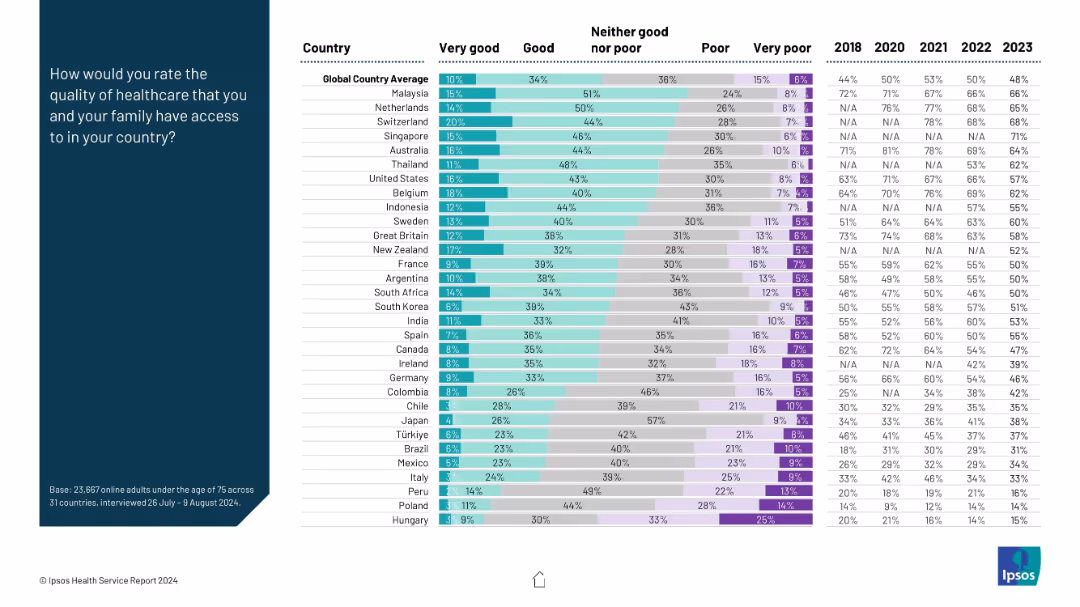
Stacked bar chart on right showing five satisfaction categories per country; prompt on the left.
Performance Metrics and KPIs
Healthcare & Pharmaceuticals
Respondents rated healthcare quality in their countries. Categories range from “Very good” to “Very poor.” Malaysia, Netherlands, and Switzerland have the highest satisfaction levels. The chart provides a comprehensive look at national healthcare sentiment.
healthcare quality, satisfaction, perception, public opinion, survey
false
Performance Metrics and KPIs
Healthcare & Pharmaceuticals
Mixed Chart
IPSOS
Add to my slides
Remove from favorites
The slide features a header, a text block on the left, and a column chart on the right. The column chart presents survey data on racial factors in patient experience, comparing agreement levels on respectful treatment, comfort in disclosing personal information, and the impact of provider's race on patient comfort, using multiple colors.
Strategic Planning
Healthcare & Pharmaceuticals
Discusses the importance of better research in reducing healthcare inequities. The column chart shows survey results on how race impacts patient experience, highlighting areas for improvement in respectful treatment, comfort in disclosing information, and patient comfort with racially concordant providers.
Healthcare, research, inequity, race, patient experience
false
Strategic Planning
Healthcare & Pharmaceuticals
Mixed Chart
IPSOS
Add to my slides
Remove from favorites
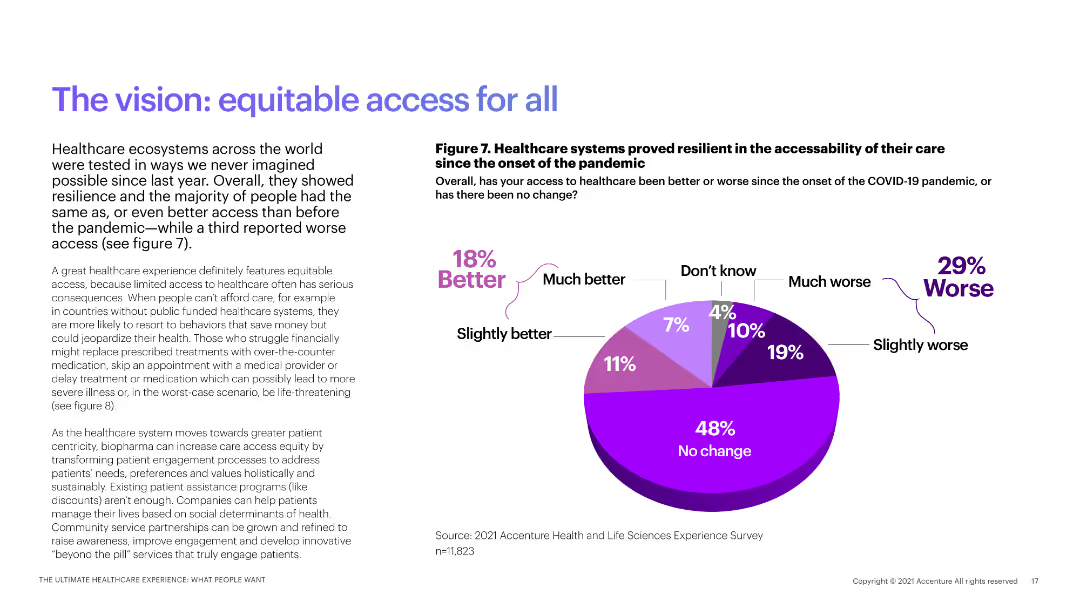
The slide includes a pie chart showing changes in healthcare access since the pandemic, with explanatory text.
Market Analysis and Trends
Healthcare & Pharmaceuticals
This slide analyzes the resilience of healthcare systems in maintaining access to care during the COVID-19 pandemic.
healthcare resilience, pandemic impact, access to care, COVID-19, patient access
false
Market Analysis and Trends
Healthcare & Pharmaceuticals
Mixed Chart
Accenture
Add to my slides
Remove from favorites
Similar layout with horizontal bar chart; ranks concern by country. Left section contains the title and question.
Risk Assessment and Management
Healthcare & Pharmaceuticals
The slide ranks global perceptions about safety within healthcare systems. India and South Africa lead in concern. Most developed countries report low concern, suggesting systemic safety variance.
healthcare safety, patient protection, system reliability, risk, safety concerns, global perception
false
Risk Assessment and Management
Healthcare & Pharmaceuticals
Mixed Chart
IPSOS
Add to my slides
Remove from favorites
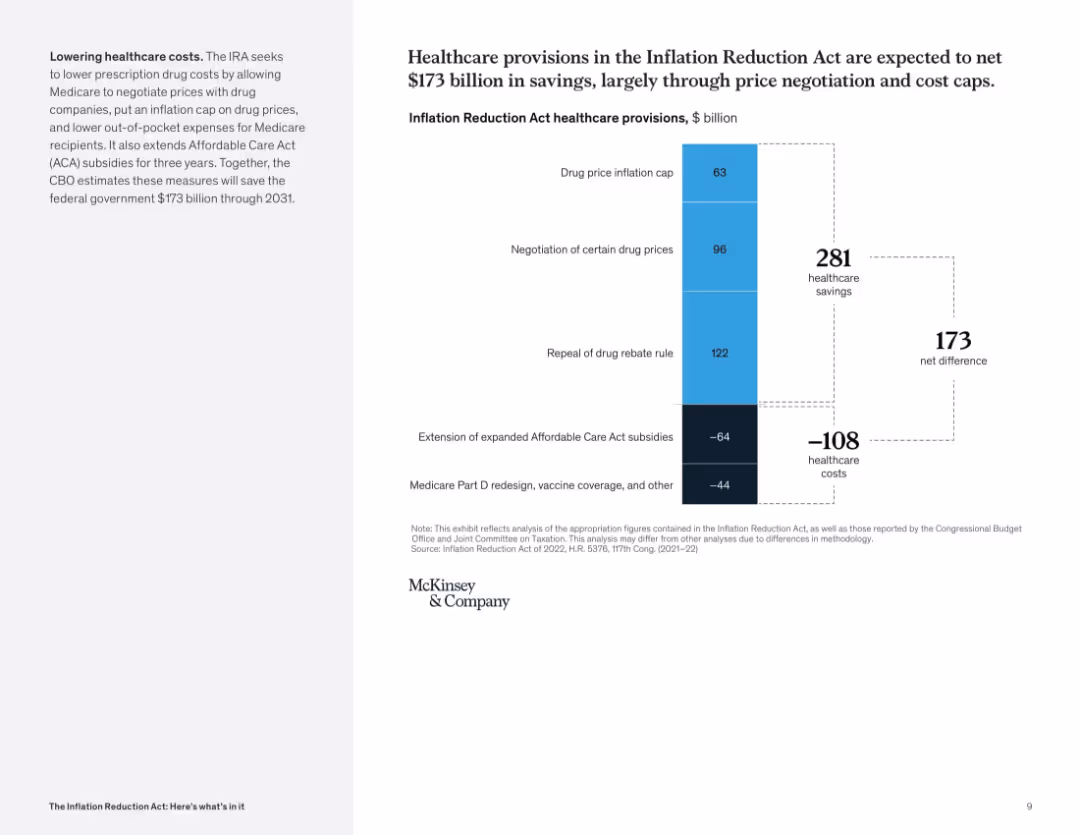
Vertical waterfall chart displaying savings and costs; two-tone column structure with dotted lines marking totals; left panel explains cost-control focus.
Financial Performance
Healthcare & Pharmaceuticals
This slide analyzes projected healthcare savings from the IRA, showing how reforms like drug price caps and rebate repeal contribute to a net savings of $173B. Costs include ACA extension and Medicare redesign.
healthcare savings, drug pricing, ACA, Medicare, subsidies, cost cap, inflation reduction
false
Financial Performance
Healthcare & Pharmaceuticals
Mixed Chart
McKinsey
Add to my slides
Remove from favorites
Maintains the same structure as previous slides, combining visual bar charts and five-year comparison data with a headline statement in the left-side panel.
Market Analysis and Trends
Healthcare & Pharmaceuticals
This slide focuses on the accessibility of information about healthcare services by country. It shows agreement percentages and how responses have shifted over five years, providing insight into citizens’ confidence in finding care-related resources.
healthcare services, information, availability, trends, countries, Ipsos, accessibility, public sentiment, survey
false
Market Analysis and Trends
Healthcare & Pharmaceuticals
Mixed Chart
IPSOS
Add to my slides
Remove from favorites
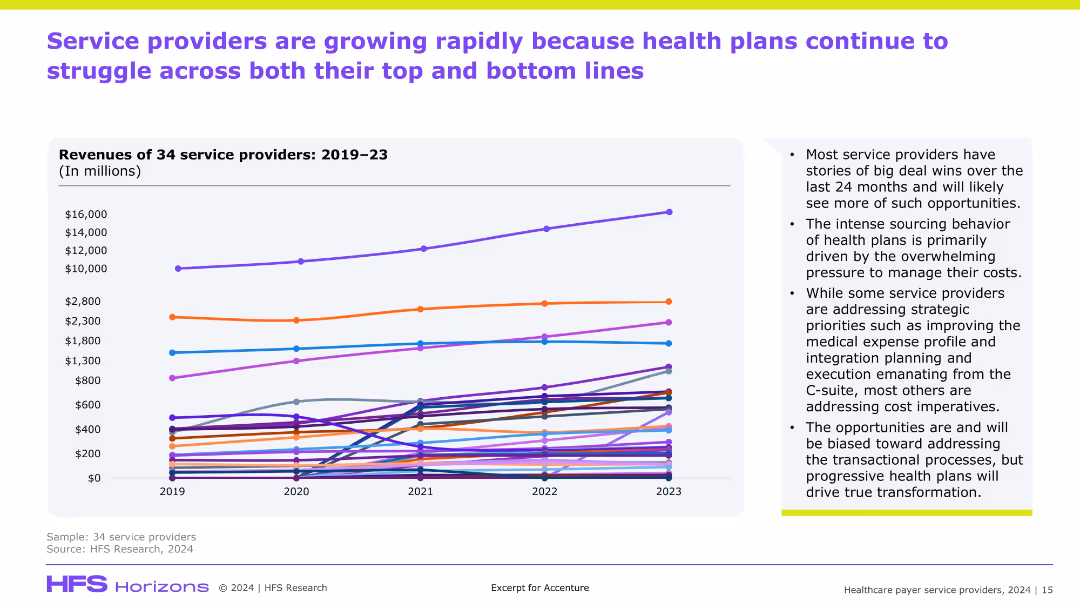
Line graph showing revenue trends for 34 providers (2019–2023); right sidebar summarizes insights; purple header and green footer accents.
Financial Performance
Healthcare & Pharmaceuticals
Highlights the growing revenue of service providers despite the operational challenges faced by health plans. Indicates rising strategic sourcing and cost pressures as key drivers. Emphasizes opportunity areas for transformation in a competitive healthcare service landscape.
healthcare services, provider revenue, cost pressure, transformation
false
Financial Performance
Healthcare & Pharmaceuticals
Mixed Chart
Accenture
Add to my slides
Remove from favorites
The slide features column charts comparing the number of women receiving antenatal care pre and post-solar power adoption, and the percentage of antenatal care coverage across Nigeria.
Strategic Planning
Healthcare & Pharmaceuticals
This slide assesses how solar power adoption in primary healthcare centers can meet antenatal care demands in Nigeria, highlighting significant improvements in service delivery with increased electricity access.
healthcare, solar power, antenatal care, Nigeria, electricity access, service improvement, ANC coverage
false
Strategic Planning
Healthcare & Pharmaceuticals
Multiple Chart
BCG
Add to my slides
Remove from favorites
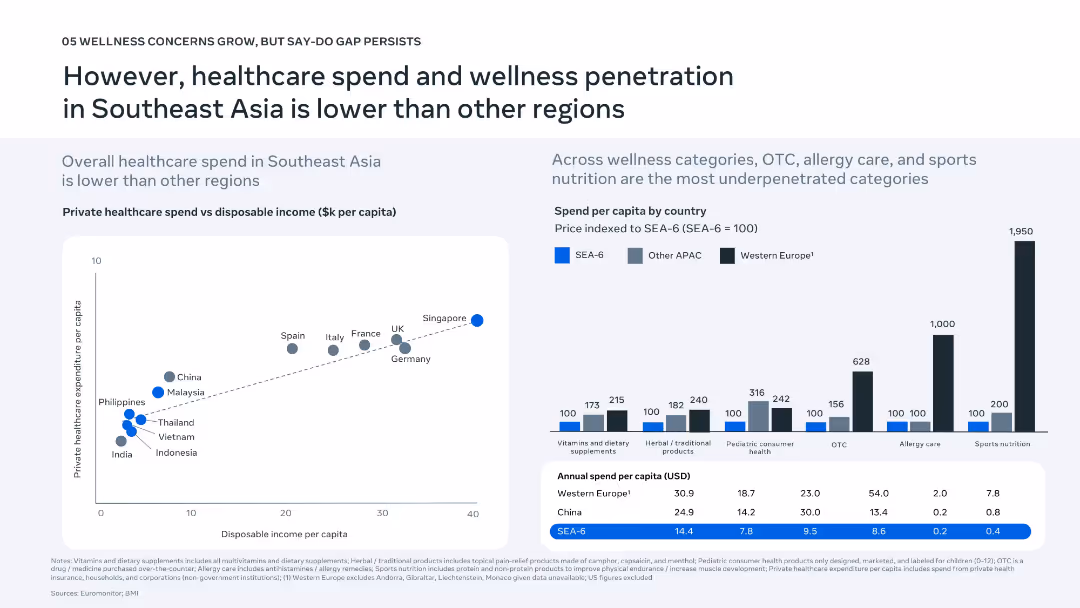
Left: scatter plot of healthcare spend vs. disposable income; Right: bar chart comparing spend per category by region; a table summarizes annual per capita spend.
Financial Performance
Healthcare & Pharmaceuticals
Illustrates how Southeast Asia lags in healthcare and wellness spending compared to regions like Western Europe. The data shows that categories like OTC, allergy care, and sports nutrition are underpenetrated. Aims to highlight the market opportunity for growth in these sectors.
healthcare spend, disposable income, wellness penetration, OTC, SEA
false
Financial Performance
Healthcare & Pharmaceuticals
Multiple Chart
Bain
Add to my slides
Remove from favorites
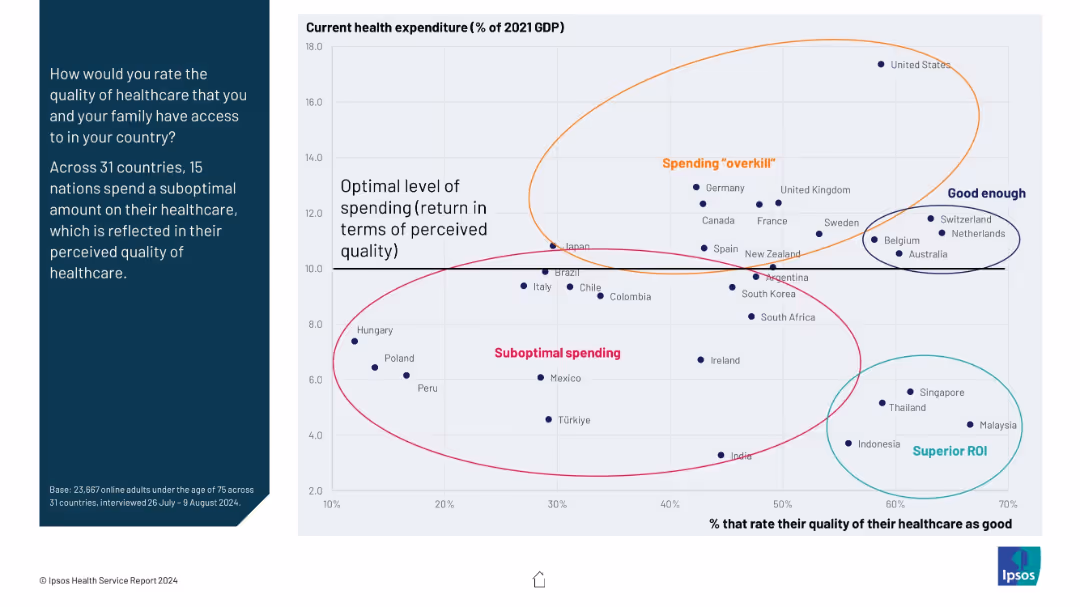
Scatter plot with labeled clusters; x-axis shows perceived healthcare quality, y-axis shows % GDP spending; left panel has explanation.
Financial Performance
Healthcare & Pharmaceuticals
This slide examines the relationship between perceived healthcare quality and national health expenditure as a share of GDP. Countries are grouped into “suboptimal,” “optimal,” and “overkill” spending zones, with a “superior ROI” cluster where perception exceeds spending.
healthcare spending, GDP, cost-efficiency, ROI, national comparison, optimal investment, budget analysis, healthcare quality
false
Financial Performance
Healthcare & Pharmaceuticals
Mixed Chart
IPSOS
Add to my slides
Remove from favorites
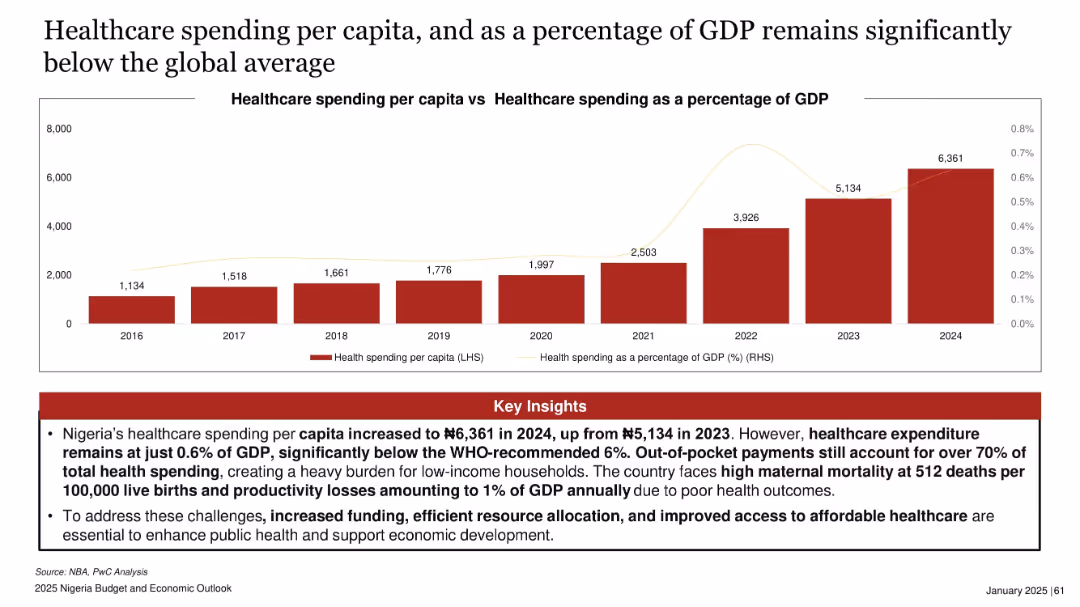
Bar chart showing healthcare spending per capita (2016–2024) and line chart overlay of GDP percentage. Red insights section below.
Regulatory and Compliance
Healthcare & Pharmaceuticals
This slide reveals Nigeria's underfunded healthcare system, with per capita spending far below WHO guidelines and just 0.6% of GDP. It points to critical issues such as maternal mortality and high out-of-pocket costs, calling for urgent funding increases.
healthcare spending, GDP, Nigeria, maternal mortality, public health, WHO standards, funding gap
false
Regulatory and Compliance
Healthcare & Pharmaceuticals
Mixed Chart
PwC/Strategy&
Add to my slides
Remove from favorites
Previous
Next
You don't have any favorites yet.
Please wait loading your favorites slides...
Create a FREE account to continue browsing
Receive Instant Access to 1,000+ slides from companies like McKinsey, Google, and Goldman Sachs
First Name
Last Name
Email
Password
I agree to all
Terms & Privacy Policy
Thank you! Your submission has been received!
Oops! Something went wrong while submitting the form.
Have an account?
Sign in
Upgrade to PRO to Save slides
Advanced Search and Filters
Access to 15,000+ slides
Access to Category Pages
Save/Bookmark Slides
PowerPoint Template Library
Pick a Plan
MONTHLY
$12/month
Billed every month, Cancel anytime.
YEARLY
$9/year
Billed $108 annually, Cancel anytime.
Checkout for $12/month
Checkout for $108/yr
Secured by Stripe | AES-256 bit encryption