My Account
My Slides
Search by Category
Companies
Slide Type
Use Case
Industry
Pricing
Templates
View All Templates
Download Template Slides
✦ AI
AI Prompt Library
AI Search
Feedback
Login
Logout
Get Started
Browse all Slides
Browse all Slides
Create a FREE Account
Instant access to 1,000+ real slides from top companies like McKinsey, BCG, Goldman Sachs, Google and many more!
First Name
Last Name
Email
Password
I agree to all
Terms & Privacy Policy
Thank you! Your submission has been received!
Oops! Something went wrong while submitting the form.
Have an account?
Sign in
Saved Slides
Total No. of slides saved
0
↻ Refresh
✖ Clear all
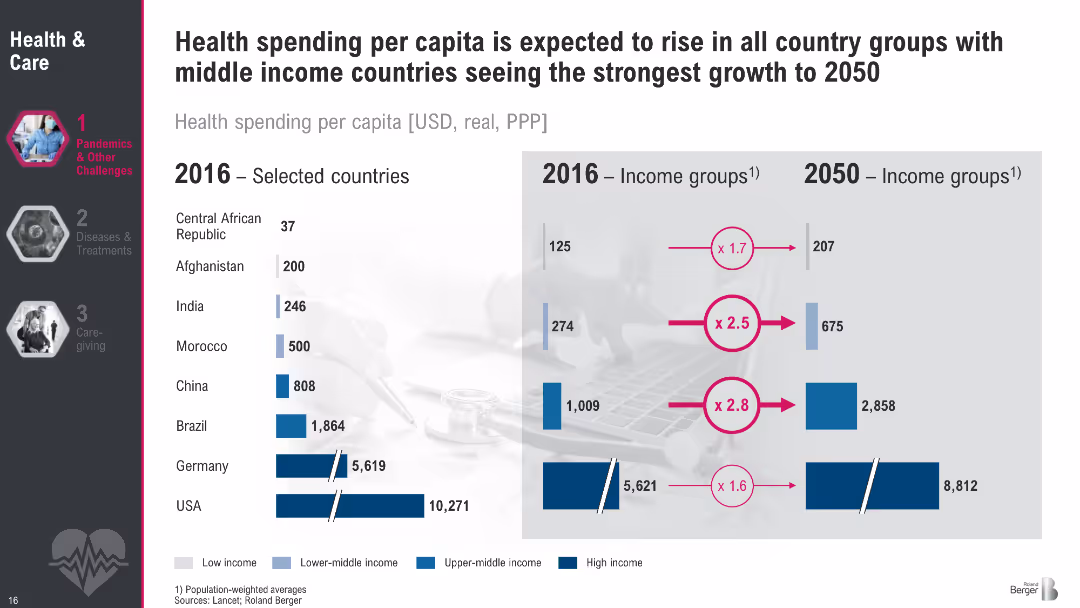
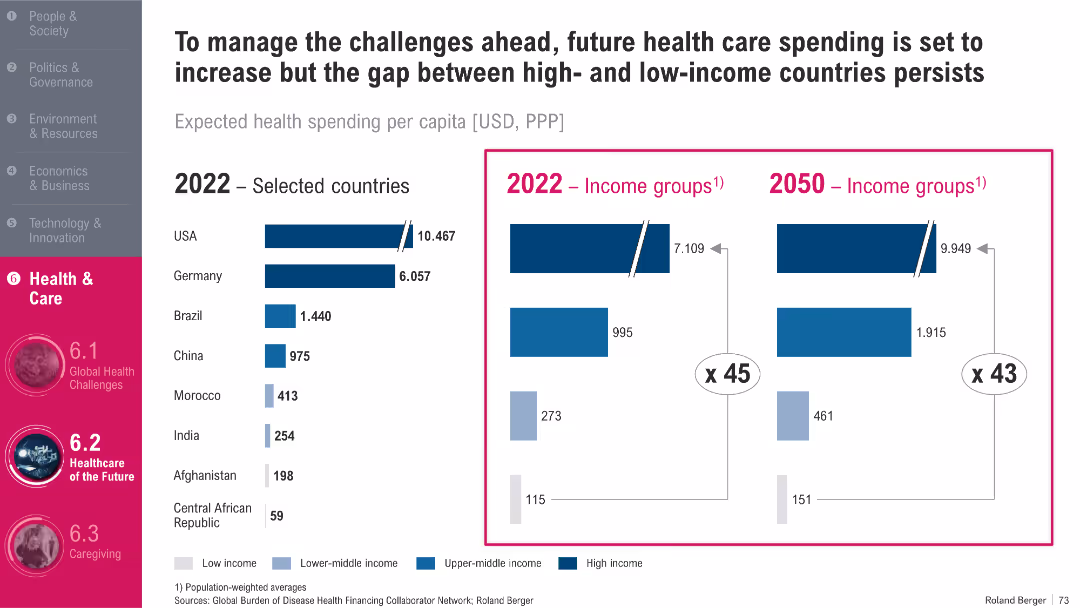
Dual charts: bar chart (left) for country data, bar chart (right) for income groups; strong contrast in bar coloring
Strategic Planning
Healthcare & Pharmaceuticals
This slide compares healthcare spending per capita across countries and income groups (2022 vs. 2050). It shows a widening gap between high- and low-income nations, despite overall increases in global healthcare investment. The disparity suggests persistent inequities in healthcare access and quality.
Healthcare Spending, Inequality, Forecast, PPP, Global Health Systems
false
Strategic Planning
Healthcare & Pharmaceuticals
Single Chart
Roland Berger
Add to my slides
Remove from favorites
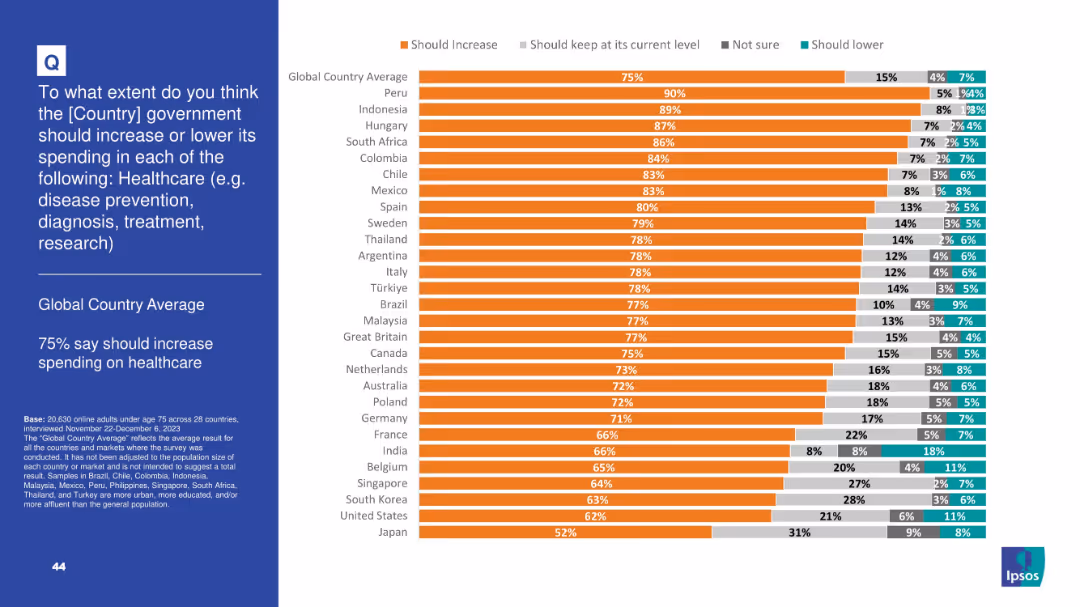
Stacked bar chart focused on healthcare; country-wise responses ranked by support for increased spending.
Strategic Planning
Healthcare & Pharmaceuticals
This slide presents very strong public backing for increased healthcare spending globally, averaging 75%. Each country's support level is shown in a bar chart, with minimal opposition. Historical comparisons are included for context.
healthcare spending, public health, disease prevention, Ipsos 2023, health budget, government funding
false
Strategic Planning
Healthcare & Pharmaceuticals
Mixed Chart
IPSOS
Add to my slides
Remove from favorites
Horizontal bar chart showing majority support for increasing healthcare spending; includes granular response options and country-by-country breakdown
Strategic Planning
Healthcare & Pharmaceuticals
Healthcare is the top funding priority globally—75% agree spending should rise. Countries like Peru, Indonesia, and Hungary show particularly strong support. This reflects global concern for healthcare infrastructure and services.
healthcare, spending, public opinion, investment, hospitals, disease prevention, Ipsos, treatment, public services
false
Strategic Planning
Healthcare & Pharmaceuticals
Mixed Chart
IPSOS
Add to my slides
Remove from favorites
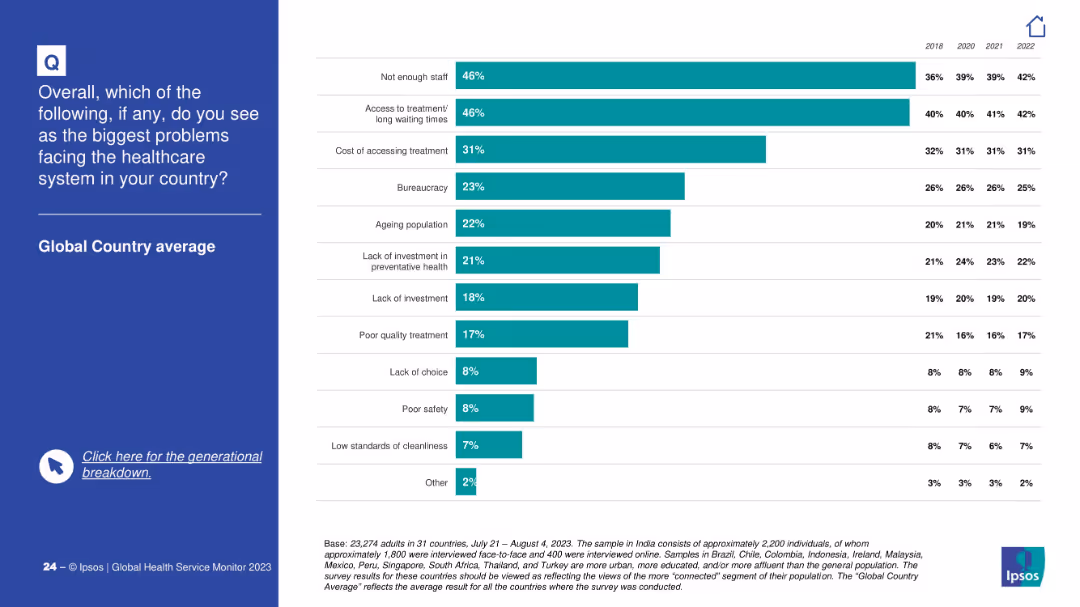
Split screen layout; left panel with question in white text on blue background; right panel has horizontal bar chart.
Market Analysis and Trends
Healthcare & Pharmaceuticals
This slide presents a global average ranking of the top perceived healthcare system problems, with "Not enough staff" and "Access to treatment/long waiting times" each cited by 46% of respondents. The chart tracks trends from 2018–2022.
healthcare, staffing, waiting times, costs, survey
false
Market Analysis and Trends
Healthcare & Pharmaceuticals
Mixed Chart
IPSOS
Add to my slides
Remove from favorites
This slide has a column chart comparing doctors and hospital beds per '000 population across various countries. The background is white with blue and red bars, country flags, and a minimal text description.
Market Analysis and Trends
Healthcare & Pharmaceuticals
The slide presents healthcare statistics by country, focusing on the availability of doctors and hospital beds per '000 population. It is designed to highlight disparities in healthcare resources in the Asia-Pacific region.
Healthcare, Statistics, Access, Doctors, Hospital Beds, Asia-Pacific, Disparities, Resources, Comparison, Countries
false
Market Analysis and Trends
Healthcare & Pharmaceuticals
Single Chart
Bain
Add to my slides
Remove from favorites
The slide is divided into two sections: the left features icons with text descriptions, and the right lists four points in a vertical format, each with a heading and description. The layout is organized and informative.
Market Analysis and Trends
Healthcare & Pharmaceuticals
The slide discusses strategic priorities in healthcare, including syndicated studies, commercial strategy, launch solutions, and clinical research, aimed at driving growth in the industry.
healthcare, strategy, growth, studies, clinical research
false
Market Analysis and Trends
Healthcare & Pharmaceuticals
Boxed
IPSOS
Add to my slides
Remove from favorites
The slide includes a combination of column charts, bar charts, and pie charts to display survey data. The charts categorize respondents by country, type of hospital, hospital size, and respondent role.
Market Analysis and Trends
Healthcare & Pharmaceuticals
This slide presents survey data on hospital priorities in APAC, categorizing responses by country, hospital type, size, and roles. It provides insights into the current focus areas for hospital executives.
healthcare, survey, priorities, APAC, hospitals
false
Market Analysis and Trends
Healthcare & Pharmaceuticals
Single Chart
LEK
Add to my slides
Remove from favorites
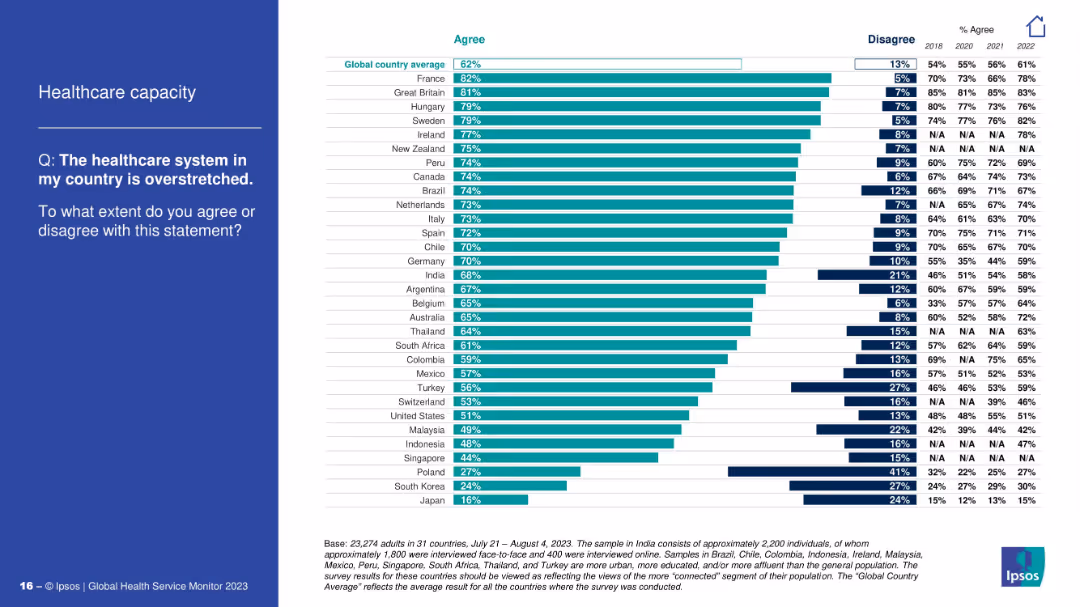
Similar design: left-aligned question, right side with bar chart and agree/disagree stats.
Operational Efficiency
Healthcare & Pharmaceuticals
This slide explores how overstretched people perceive their national healthcare systems to be. France and Great Britain have the highest agreement. It tracks opinion shifts since 2018 and identifies which populations feel most strain.
healthcare system, overstretched, survey, operational pressure, Ipsos, public sentiment, capacity, country stats
false
Operational Efficiency
Healthcare & Pharmaceuticals
Mixed Chart
IPSOS
Add to my slides
Remove from favorites
This slide features a circular chart showing Australian consumers' ratings of the healthcare system's performance in optimizing health experiences across different personal circumstances.
Market Analysis and Trends
Healthcare & Pharmaceuticals
It evaluates Australian consumers' ratings of their healthcare system's ability to optimize health experiences irrespective of personal circumstances, with a focus on equitable treatment.
healthcare system, performance, optimization, personal circumstances, equitable treatment
false
Market Analysis and Trends
Healthcare & Pharmaceuticals
Mixed Chart
EY
Add to my slides
Remove from favorites
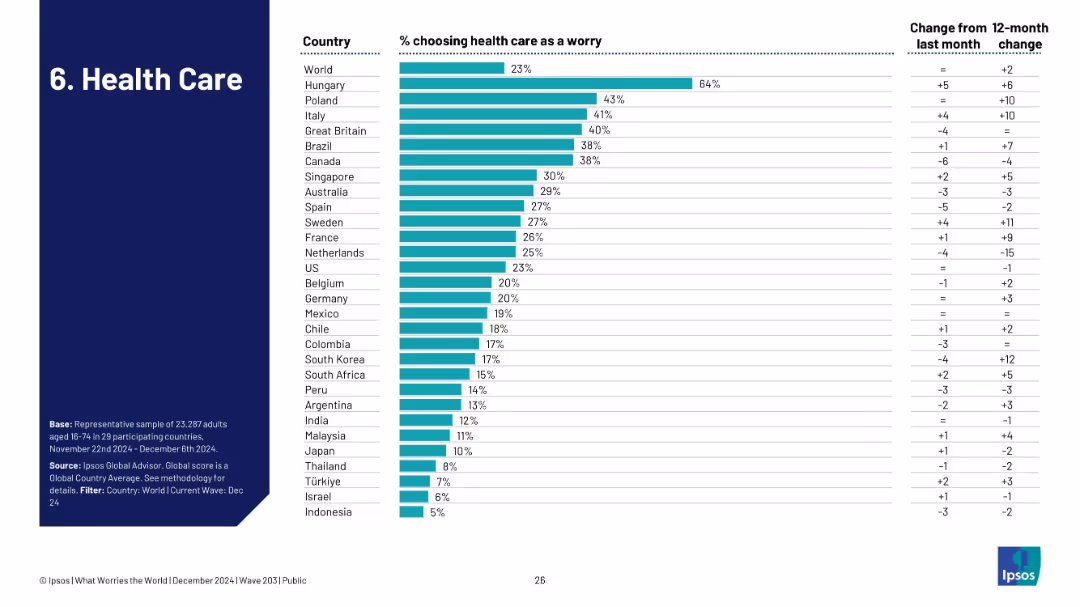
Bar chart showing how many in each country identify health care as a top concern, including trends from the previous month/year.
Risk Assessment and Management
Healthcare & Pharmaceuticals
The slide shows healthcare concerns at 23% globally, led by Hungary (64%). It provides a comparative look at how health systems and concerns differ by region, tracking recent perception changes.
healthcare, system strain, patient care, Ipsos, global health, concern levels
false
Risk Assessment and Management
Healthcare & Pharmaceuticals
Single Chart
IPSOS
Add to my slides
Remove from favorites
This slide features a dark background with a yellow highlight. It includes a header, body text, and a column chart displaying percentages. Four circular percentage indicators show key insights.
Market Analysis and Trends
Healthcare & Pharmaceuticals
The slide discusses the cautious optimism surrounding emerging technologies like AI and virtual presence in healthcare among German consumers. It highlights expected trends in digital technologies, precision medicine, and virtual hospitals.
healthcare, technology, AI, virtual presence, Germany
false
Market Analysis and Trends
Healthcare & Pharmaceuticals
Mixed Chart
EY
Add to my slides
Remove from favorites
This slide has a dark background with a header, body text, and a column chart displaying percentages. Four circular percentage indicators show key insights related to consumer expectations in healthcare technology in Ireland.
Market Analysis and Trends
Healthcare & Pharmaceuticals
The slide presents the cautious optimism among Irish consumers regarding emerging healthcare technologies like AI and virtual presence. It outlines expected trends in digital health technologies, hospital-in-the-home models, and precision medicine.
healthcare, technology, AI, virtual presence, Ireland
false
Market Analysis and Trends
Healthcare & Pharmaceuticals
Mixed Chart
EY
Add to my slides
Remove from favorites
Dark background with white text, circular charts showing percentages and yellow highlights.
Market Analysis and Trends
Healthcare & Pharmaceuticals
The slide predicts future trends in healthcare technology, with 68% believing digital technologies will monitor patients at home, 64% seeing hospital-in-home alternatives, 64% foreseeing virtual hospitals, and 61% expecting precision medicine in primary care, indicating significant technological shifts.
healthcare technology, digital monitoring, virtual hospitals, precision medicine, U.S. consumers
false
Market Analysis and Trends
Healthcare & Pharmaceuticals
Mixed Chart
EY
Add to my slides
Remove from favorites
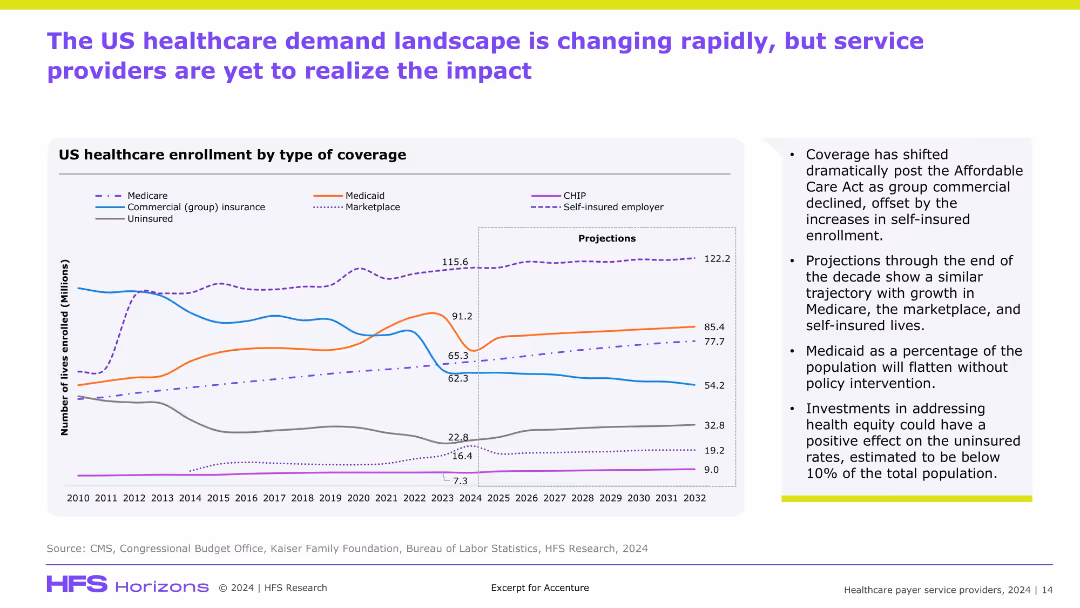
Line graph with multiple colored trend lines and projections (2023–2032); sidebar lists key insights; purple and green accent bars at top and bottom.
Market Analysis and Trends
Healthcare & Pharmaceuticals
Shows changes in U.S. healthcare coverage over time by enrollment type. Highlights shifts post-Affordable Care Act, growth in Medicare and self-insured plans, and implications for health equity. Includes forward-looking projections.
healthcare trends, insurance, projections, ACA, market shift
false
Market Analysis and Trends
Healthcare & Pharmaceuticals
Mixed Chart
Accenture
Add to my slides
Remove from favorites
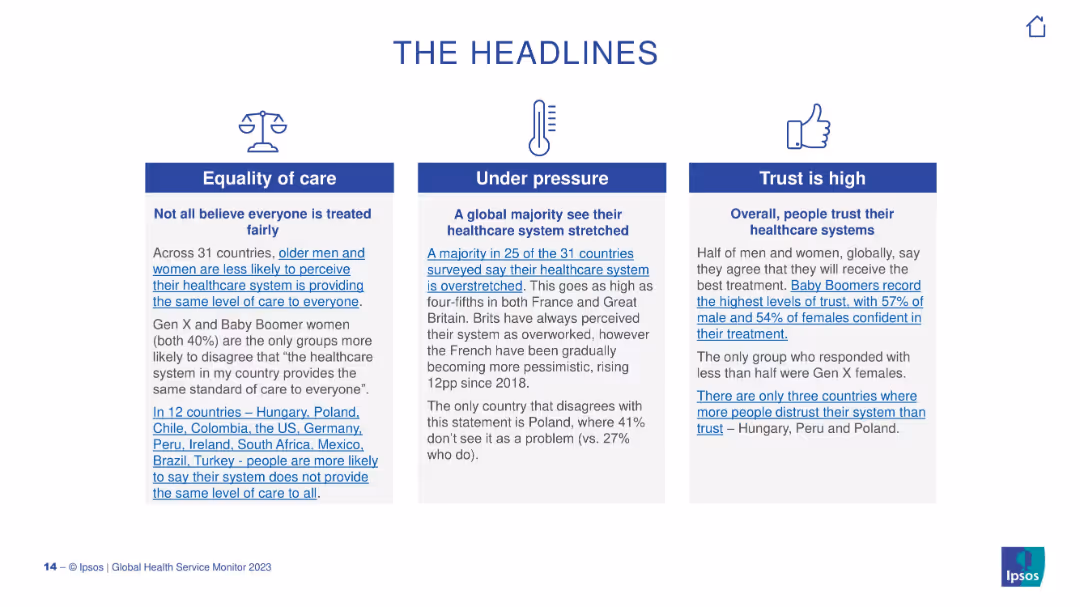
Three-column layout with icons above short paragraphs. Each column presents a headline topic on healthcare themes.
Strategic Planning
Healthcare & Pharmaceuticals
The slide highlights three main insights from the global healthcare survey: inequality in care, system overstretch, and public trust. It emphasizes that older generations and some countries report lower trust and fairness in their systems.
healthcare, trust, access, equity, global survey, system pressure, Ipsos, public opinion
false
Strategic Planning
Healthcare & Pharmaceuticals
Pillar
IPSOS
Add to my slides
Remove from favorites
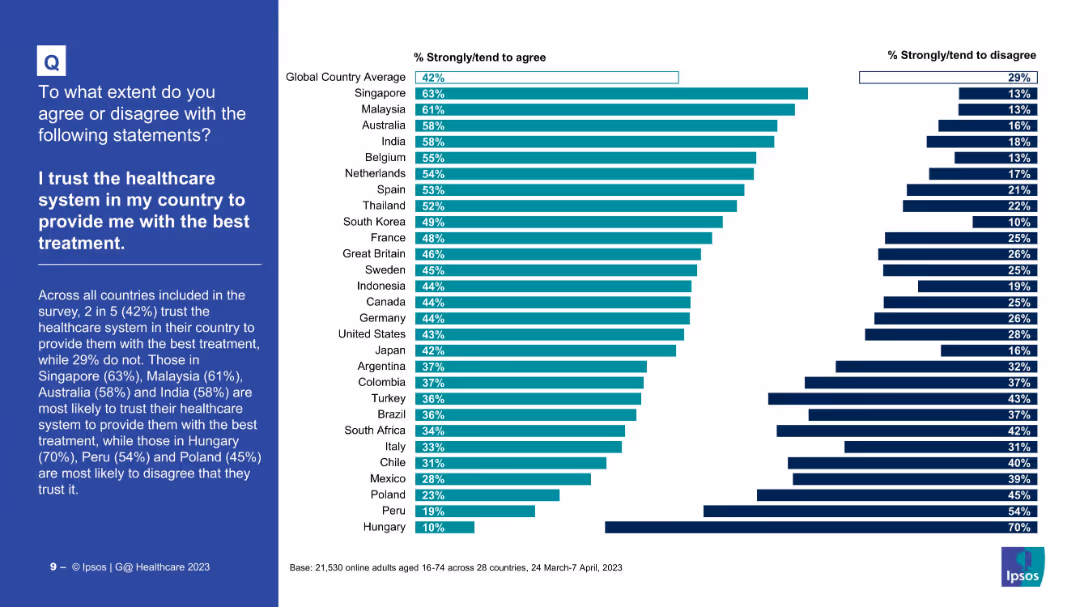
Left-aligned title and paragraph; right-aligned bar chart ranks countries by trust level in their healthcare system for best treatment.
Market Analysis and Trends
Healthcare & Pharmaceuticals
This slide evaluates public trust in national healthcare systems to provide optimal treatment. Singapore leads in trust, while Hungary shows the least. The data reflects global public sentiment on treatment reliability.
healthcare trust, public opinion, treatment quality, global survey, Ipsos, country ranking, medical confidence, perceptions, care delivery, patient trust
false
Market Analysis and Trends
Healthcare & Pharmaceuticals
Mixed Chart
IPSOS
Add to my slides
Remove from favorites
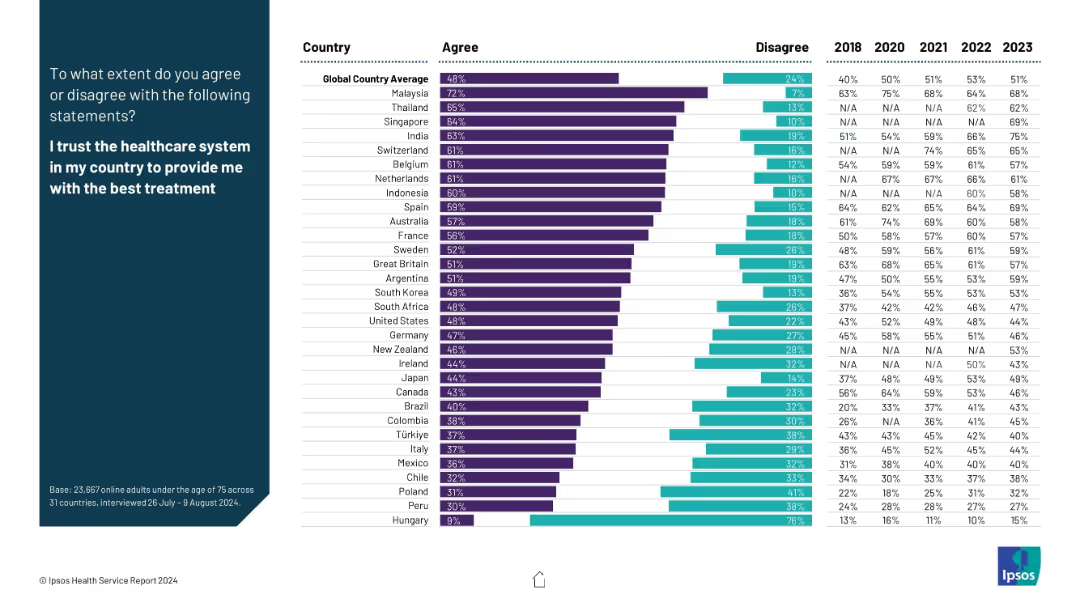
Uses consistent layout; left-side statement and right-side bar graph with yearly data comparison.
Market Analysis and Trends
Healthcare & Pharmaceuticals
The slide reveals trust levels in national healthcare systems, as measured by public agreement with a statement on receiving the best treatment. Cross-national data and temporal trends are presented, useful for gauging systemic trust globally.
healthcare trust, treatment quality, public sentiment, global comparison, Ipsos, survey, healthcare systems, perception
false
Market Analysis and Trends
Healthcare & Pharmaceuticals
Mixed Chart
IPSOS
Add to my slides
Remove from favorites
This slide features a dark background with a header, body text, and a column chart showing three percentage indicators. Each indicator is accompanied by descriptive text explaining consumer openness to virtual primary care consultations versus in-person consultations.
Technology and Digital Transformation
Healthcare & Pharmaceuticals
The slide discusses the openness of Irish consumers to switch to virtual primary care consultations, despite a general preference for in-person consultations. It highlights the percentage of consumers willing to consider virtual consultations.
healthcare, virtual care, primary care, Ireland, consultations
false
Technology and Digital Transformation
Healthcare & Pharmaceuticals
Mixed Chart
EY
Add to my slides
Remove from favorites
This slide features a dark background with a header, body text, and a column chart showing three percentage indicators. Each indicator is accompanied by descriptive text explaining consumer openness to virtual primary care consultations versus in-person consultations.
Technology and Digital Transformation
Healthcare & Pharmaceuticals
The slide discusses the openness of US consumers to switch to virtual primary care consultations, despite a general preference for in-person consultations. It highlights the percentage of consumers willing to consider virtual consultations.
healthcare, virtual care, primary care, US, consultations
false
Technology and Digital Transformation
Healthcare & Pharmaceuticals
Mixed Chart
EY
Add to my slides
Remove from favorites
This slide includes a header, body text, and four circular percentage indicators. Each indicator represents reasons for switching to virtual consultations, such as prescription renewals, minor medical conditions, discussing test results, and saving time.
Technology and Digital Transformation
Healthcare & Pharmaceuticals
The slide highlights reasons why Irish consumers would switch to virtual consultations for minor medical matters. Key reasons include prescription renewals, convenience, discussing test results, and saving time on travel and waiting.
healthcare, virtual consultations, minor matters, Ireland, convenience
false
Technology and Digital Transformation
Healthcare & Pharmaceuticals
Mixed Chart
EY
Add to my slides
Remove from favorites
This slide features a side-by-side column chart comparison for Millennials and Gen Z's top concerns from 2020 to 2021. The chart is color-coded in green and blue, respectively, with a clear label for each concern.
Market Analysis and Trends
Healthcare & Pharmaceuticals
The slide presents comparative data on the evolving personal concerns of Millennials and Gen Z, highlighting health care/disease prevention as a top priority due to the pandemic.
Health, Concerns, Millennials, Gen Z, Pandemic, Data, Column Chart, Survey, Environment, Prevention
false
Market Analysis and Trends
Healthcare & Pharmaceuticals
Single Chart
Deloitte
Add to my slides
Remove from favorites
Slide features column charts showing the proportion of purchase delays due to health concerns and the influence of subsidies in various countries (US, UK, Germany, France, Italy, China, Japan).
Market Analysis and Trends
Transportation & Logistics
Examines how health concerns continue to affect purchase decisions and the impact of subsidies on delaying these decisions in different countries.
health concerns, subsidies, purchase delays, column chart, international analysis
false
Market Analysis and Trends
Transportation & Logistics
Multiple Chart
McKinsey
Add to my slides
Remove from favorites
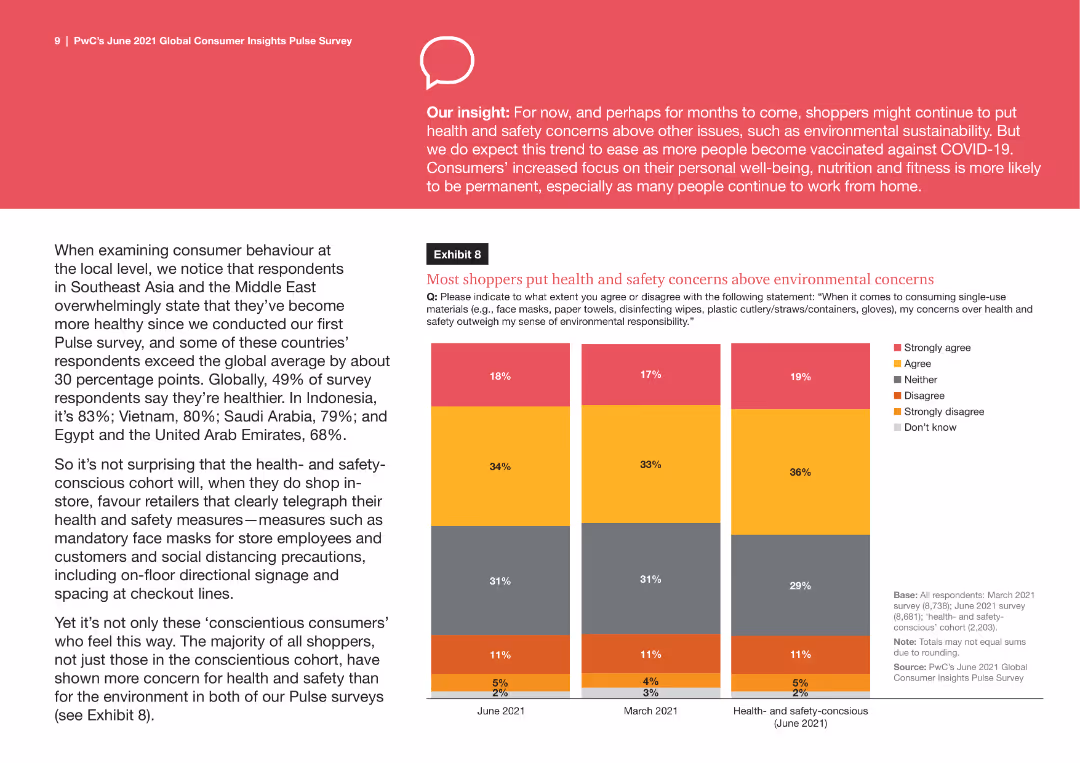
A comparative column chart showing the shopping behaviors of health- and safety-conscious consumers versus the global total across various categories like fashion, electronics, and grocery, highlighting the shift to online shopping.
Market Analysis and Trends
Retail & E-commerce
The slide compares shopping habits of health- and safety-conscious consumers with the global average, focusing on the increase in online shopping and decrease in in-store shopping across different product categories.
health-conscious consumers, shopping behavior, online shopping, global comparison, product categories
false
Market Analysis and Trends
Retail & E-commerce
Mixed Chart
PwC/Strategy&
Add to my slides
Remove from favorites
Column chart showing agreement percentages for the desire for control over health decisions across countries.
Market Analysis and Trends
Healthcare & Pharmaceuticals
The slide highlights the global desire for personal control over health decisions.
health control, global trends, public opinion, healthcare, personal autonomy
false
Market Analysis and Trends
Healthcare & Pharmaceuticals
Mixed Chart
IPSOS
Add to my slides
Remove from favorites
This slide juxtaposes graphical trends with textual imperatives, offering a visual and narrative guide on the concurrent management of the pandemic and economic implications. The design is straightforward with effective use of space.
Strategic Planning
Professional Services
It delineates the dual imperatives of managing the health crisis and safeguarding the economy, presenting a timeline that visually correlates the spread of the virus with economic trends, serving as a strategic guide for leaders.
Health Crisis, Economic Trends, Strategic Guide, Leadership, Pandemic Management, Timeboxing, Dual Imperatives, Graphical Representation
false
Strategic Planning
Professional Services
Mixed Chart
McKinsey
Add to my slides
Remove from favorites
Visuals include column charts depicting variations in public health responses across different countries, alongside snapshots of related news articles.
Risk Assessment and Management
Healthcare & Pharmaceuticals
This slide outlines how different regions respond to public health crises, highlighting the variability in lockdown measures and public guidelines.
health crisis, public response, lockdown, regions, guidelines
false
Risk Assessment and Management
Healthcare & Pharmaceuticals
Multiple Chart
McKinsey
Add to my slides
Remove from favorites
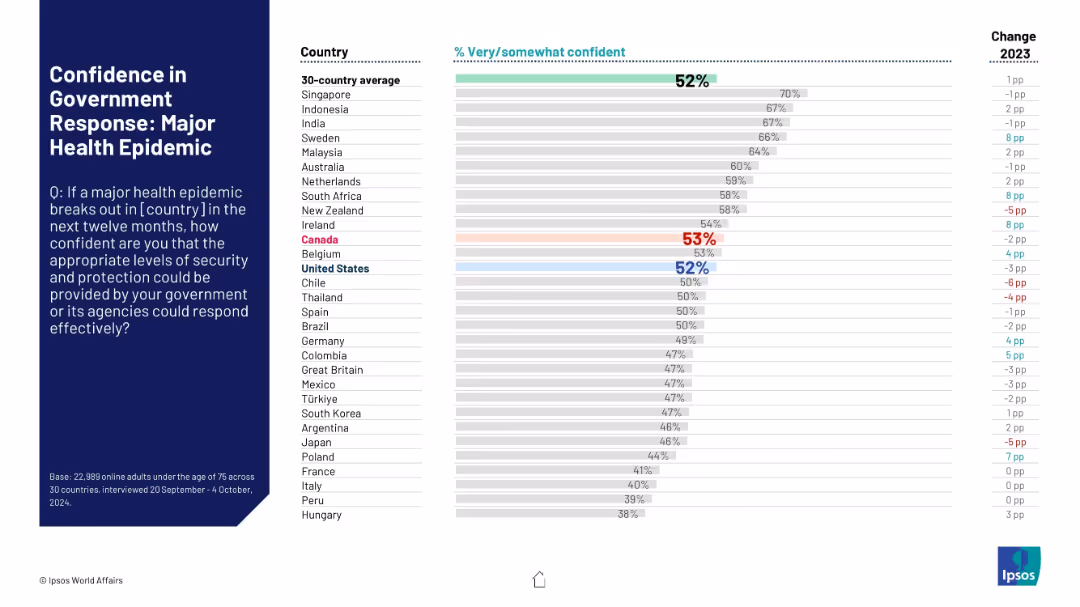
Bar graph illustrating public confidence in epidemic response capabilities; mid-range clustering of most countries.
Risk Assessment and Management
Healthcare & Pharmaceuticals
Public confidence in national government response to health epidemics is shown. Canada (53%) and the U.S. (52%) hover around the 52% global average, reflecting moderate confidence levels.
health epidemic, public confidence, government readiness, Ipsos, survey, 2024, Canada, U.S., healthcare
false
Risk Assessment and Management
Healthcare & Pharmaceuticals
Mixed Chart
IPSOS
Add to my slides
Remove from favorites
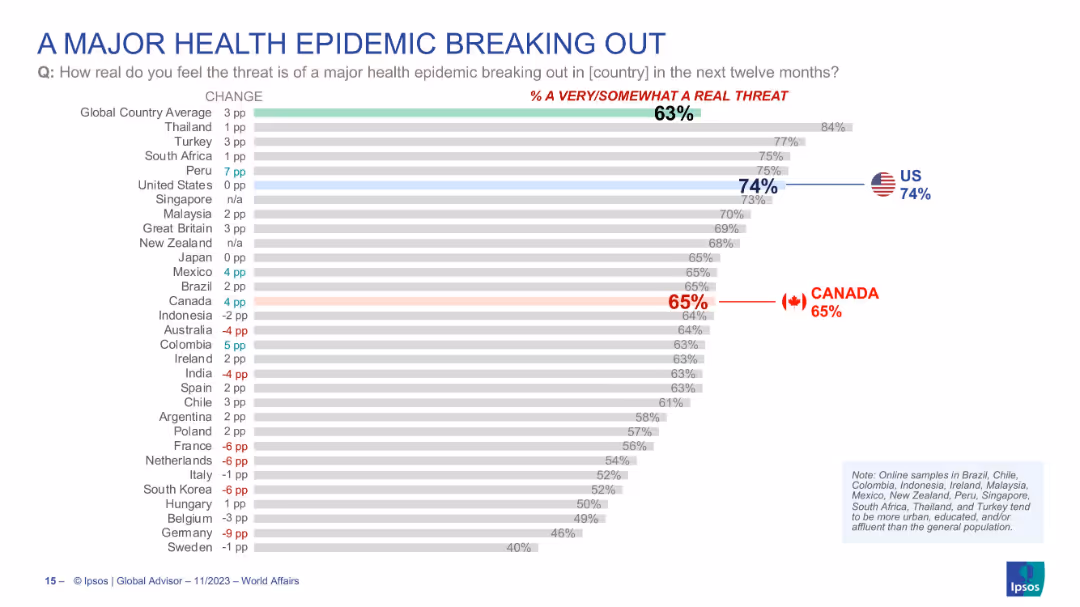
Horizontal bar chart showing how real people perceive the threat of a health epidemic in their country, with countries ranked by concern level.
Risk Assessment and Management
Healthcare & Pharmaceuticals
Country comparison of how real people think the risk of a major health epidemic is. U.S. (74%) ranks highly, with global average at 63%. Canada’s concern is at 65%. Includes % change from previous year, showing shifting perceptions of epidemic threat.
health epidemic, public threat, perception, global concern, pandemic, Ipsos, national comparison, risk
false
Risk Assessment and Management
Healthcare & Pharmaceuticals
Single Chart
IPSOS
Add to my slides
Remove from favorites
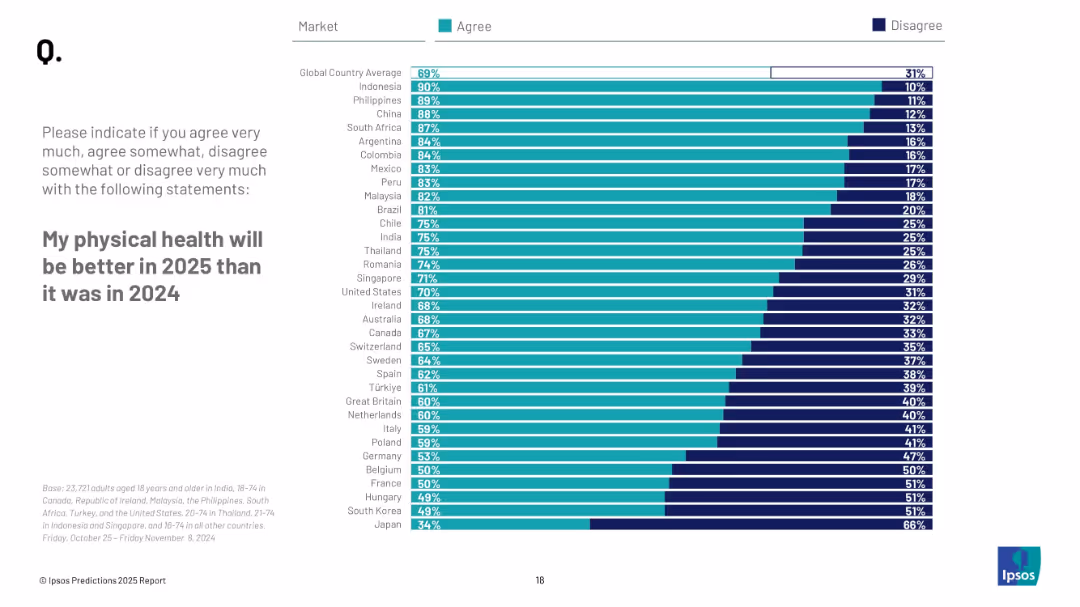
Horizontal bar chart ranked by agreement level; includes "Agree" and "Disagree" bars by country; title and instructions on the left.
Market Analysis and Trends
Healthcare & Pharmaceuticals
Respondents from various countries were asked about their expectations for physical health improvement in 2025. The slide shows agreement and disagreement levels, sorted by country, with global average.
health expectations, physical health, international survey, wellbeing, 2025 prediction, bar chart, Ipsos
false
Market Analysis and Trends
Healthcare & Pharmaceuticals
Mixed Chart
IPSOS
Add to my slides
Remove from favorites
Comparative bar chart split by country and income groups (2016 vs. 2050 projections). Uses blue shades to represent income levels.
Financial Performance
Healthcare & Pharmaceuticals
This slide shows projected growth in per capita health spending across countries and income groups from 2016 to 2050. Low- and middle-income countries like India and China are projected to see the steepest increases, while high-income countries grow modestly. The visualization underlines disparities and expected convergence in global health investment.
Health expenditure, per capita, country comparison, income groups, projections, global health
false
Financial Performance
Healthcare & Pharmaceuticals
Multiple Chart
Roland Berger
Add to my slides
Remove from favorites
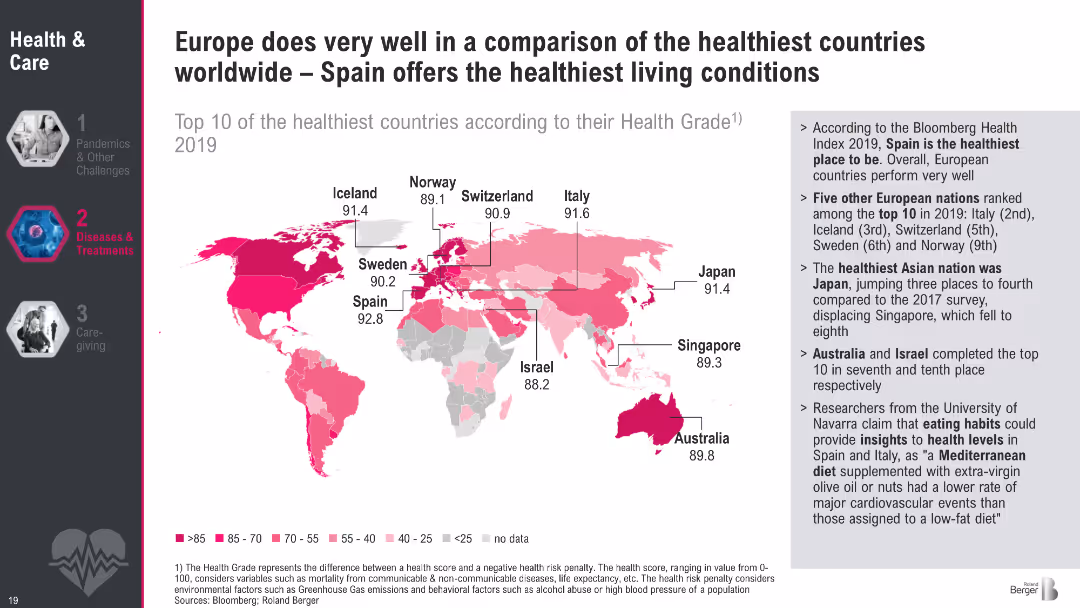
World map in pink gradients highlighting the top 10 healthiest countries according to Health Grade 2019. Right sidebar summarizes regional and dietary factors.
Industry Overview
Healthcare & Pharmaceuticals
This slide maps the top-ranked countries in terms of health based on the Bloomberg Health Index. Spain, Italy, and other European nations dominate the top 10. It attributes the high health rankings to lifestyle factors such as the Mediterranean diet. The sidebar offers brief insights into country-specific improvements and trends.
Health index, global health, country ranking, Mediterranean diet, wellness, Bloomberg
false
Industry Overview
Healthcare & Pharmaceuticals
Graphic
Roland Berger
Add to my slides
Remove from favorites
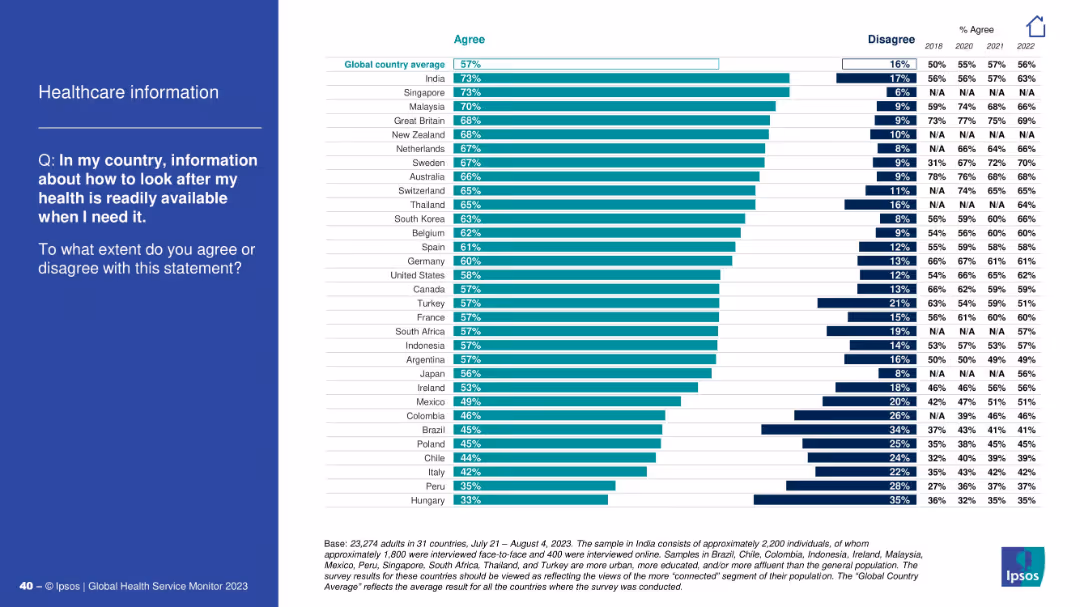
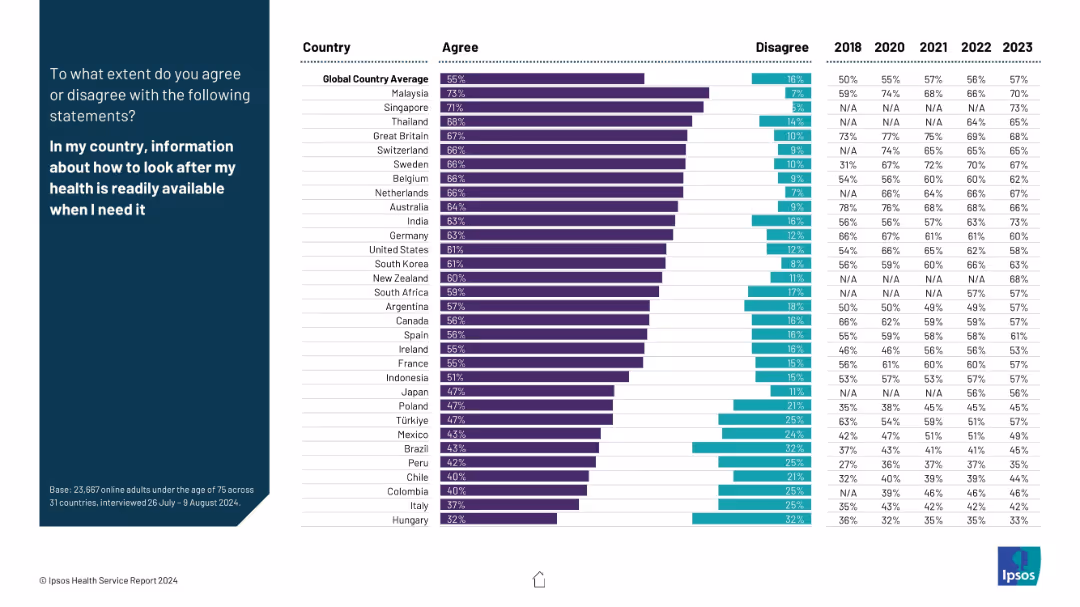
Ranked horizontal bar chart with country-wise data showing agreement with availability of personal health info.
Operational Efficiency
Healthcare & Pharmaceuticals
This slide examines how accessible information on personal health maintenance is across different countries. India and Singapore lead in agreement, while Hungary and Peru show lowest perceived availability.
health information, accessibility, country ranking, perception, global average, operational readiness, Ipsos
false
Operational Efficiency
Healthcare & Pharmaceuticals
Mixed Chart
IPSOS
Add to my slides
Remove from favorites
Similar layout as previous; left blue panel with bold white statement, right side includes bar charts showing agreement/disagreement levels across countries with historical comparison data from 2018–2023.
Market Analysis and Trends
Healthcare & Pharmaceuticals
This slide illustrates public perception across countries on whether health-related information is readily available. It includes agreement levels and five-year trend data, reflecting access to health literacy and public health communication efficiency.
health information, availability, literacy, awareness, survey, trends, public opinion, countries, Ipsos, access
false
Market Analysis and Trends
Healthcare & Pharmaceuticals
Mixed Chart
IPSOS
Add to my slides
Remove from favorites
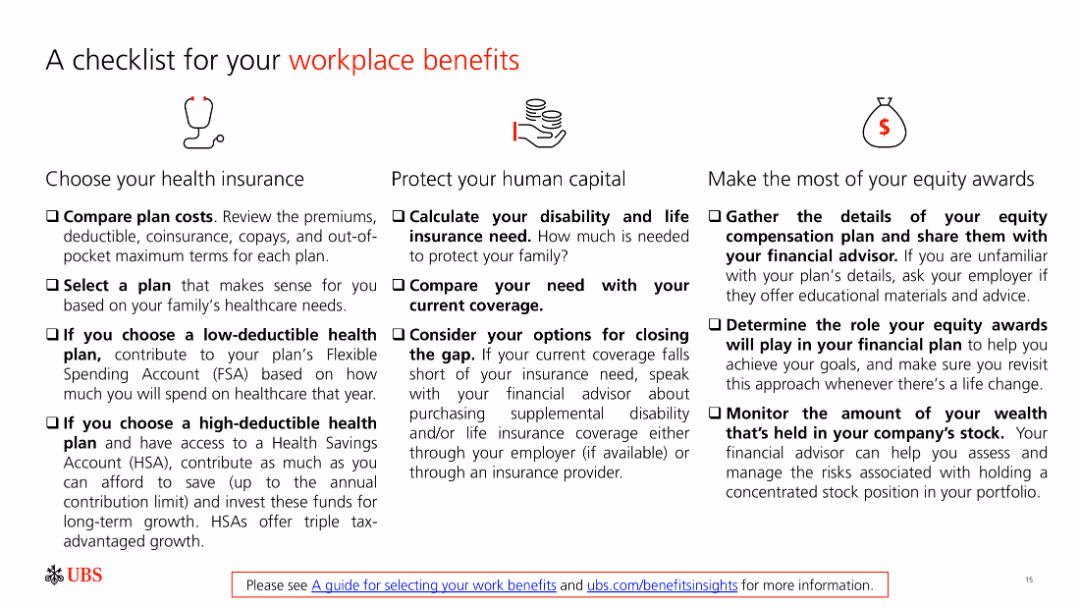
A slide with three columns: "Choose your health insurance," "Protect your human capital," and "Make the most of your equity awards." Each column contains a checklist with brief explanations.
Human Resources and Talent Management
Financial Services
The slide provides a checklist for selecting health insurance, protecting human capital, and maximizing equity awards, aimed at helping employees understand and manage their workplace benefits.
health insurance, human capital, equity awards, checklist, benefits
false
Human Resources and Talent Management
Financial Services
Pillar
UBS
Add to my slides
Remove from favorites
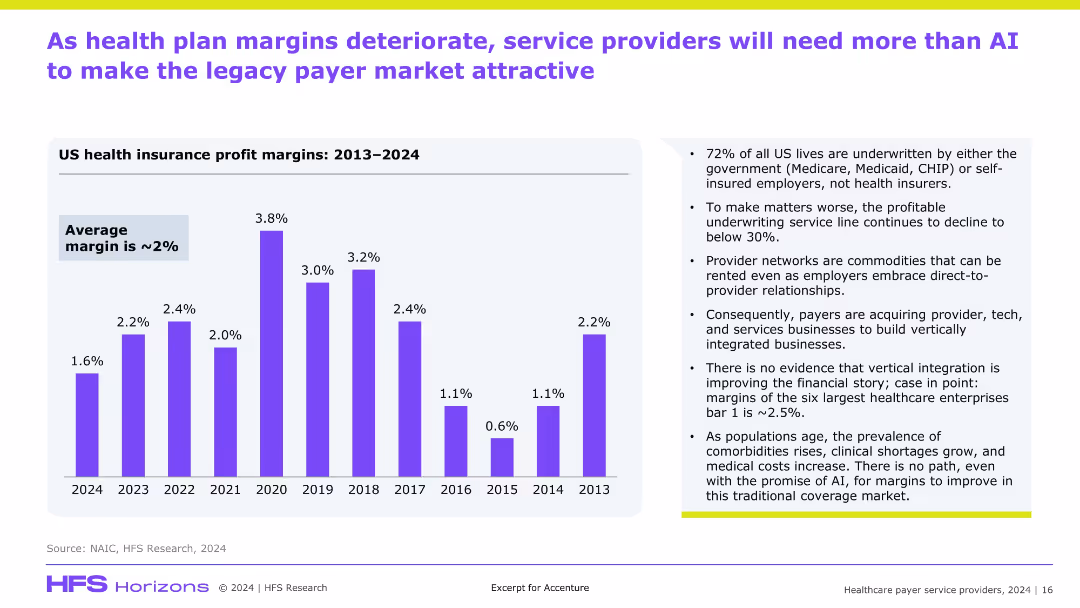
Left-aligned title, left bar graph showing profit margins 2013–2024, right bullet points with insights; clean corporate design with purple theme and emphasis on data and interpretation.
Financial Performance
Healthcare & Pharmaceuticals
This slide discusses the declining profit margins in US health insurance, highlighting a ~2% average margin. It outlines the challenges facing payers including shrinking underwriting margins, commoditization of provider networks, and limitations of vertical integration. It suggests that AI alone won’t solve systemic issues in the legacy payer market.
health insurance, profit margins, underwriting, vertical integration, AI, payer, provider
false
Financial Performance
Healthcare & Pharmaceuticals
Mixed Chart
Accenture
Add to my slides
Remove from favorites
Matrix showing the involvement of different stakeholders in the health insurance value chain, highlighting trends in product development, sales, underwriting, and claims.
Market Analysis and Trends
Financial Services
Analyzes the evolving landscape of health insurance, detailing how various stakeholders are expanding their roles across the value chain to enhance their value propositions.
health insurance, value chain, stakeholders, trends
false
Market Analysis and Trends
Financial Services
Single Chart
Roland Berger
Add to my slides
Remove from favorites
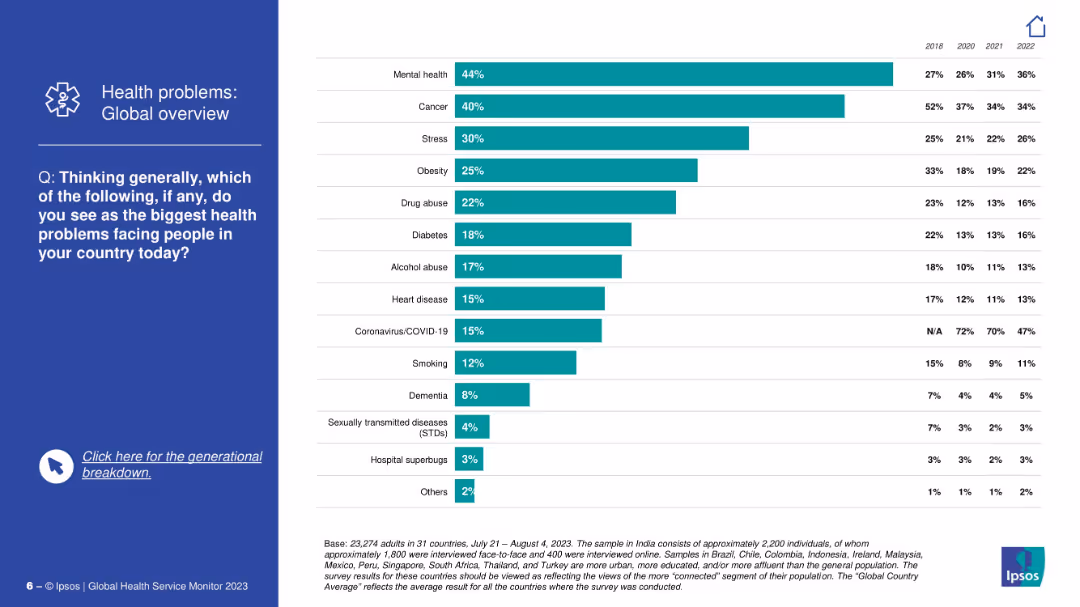
Blue sidebar with question text; right side shows vertical bar chart listing global top health concerns like mental health, cancer, stress, obesity, etc.
Market Analysis and Trends
Healthcare & Pharmaceuticals
This slide provides a global ranking of perceived major health issues. Mental health tops the list, followed by cancer and stress. It also includes trend data from 2018 to 2022 showing changes in public concern for each issue.
health issues, mental health, cancer, public perception, global ranking, Ipsos, stress, obesity, disease awareness, trends
false
Market Analysis and Trends
Healthcare & Pharmaceuticals
Mixed Chart
IPSOS
Add to my slides
Remove from favorites
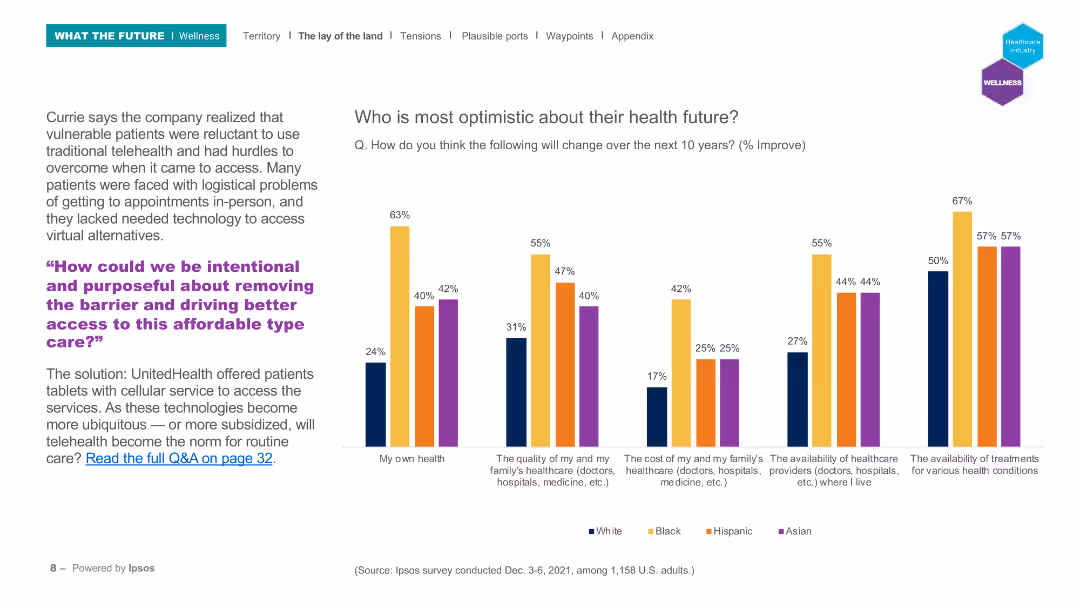
The slide features a column chart comparing optimism about health futures among different ethnic groups across several health-related categories.
Market Analysis and Trends
Healthcare & Pharmaceuticals
This slide presents survey data on optimism regarding future health across different ethnic groups in the U.S., highlighting disparities in expectations about personal health, healthcare quality, and availability.
Health optimism, ethnic groups, survey, healthcare, future trends
false
Market Analysis and Trends
Healthcare & Pharmaceuticals
Mixed Chart
IPSOS
Add to my slides
Remove from favorites
This slide features a matrix highlighting key actions for health organizations to improve consumer perceptions, categorized by performance and importance of health system aspects.
Strategic Planning
Healthcare & Pharmaceuticals
It identifies key opportunity areas for health organizations to improve consumer perceptions, focusing on aspects rated as important but with lower performance, such as mental health and sustainability.
health organizations, consumer perceptions, key actions, performance, importance
false
Strategic Planning
Healthcare & Pharmaceuticals
Mixed Chart
EY
Add to my slides
Remove from favorites
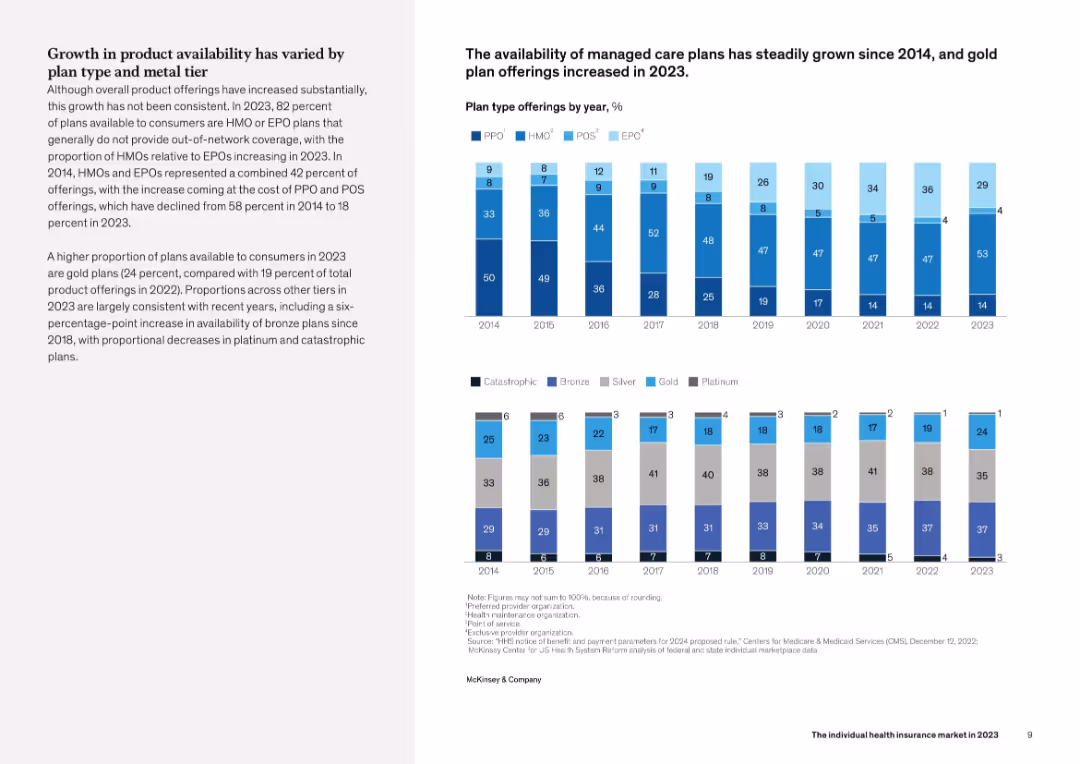
Dual chart layout on right side showing plan type offerings by year (2014–2023) and metal tier breakdowns. Left column contains explanatory text. Color-coded bar segments differentiate plan types and tiers.
Product and Service Analysis
Healthcare & Pharmaceuticals
This slide examines changes in health insurance product offerings from 2014 to 2023. It notes increased availability of managed care plans like HMOs and EPOs, and a rise in gold plans. The proportions of PPO and POS plans have decreased, while bronze plans have become more widely available, suggesting a shift in plan affordability and design preferences.
health plans, PPO, HMO, metal tiers, product availability, trends
false
Product and Service Analysis
Healthcare & Pharmaceuticals
Mixed Chart
McKinsey
Add to my slides
Remove from favorites
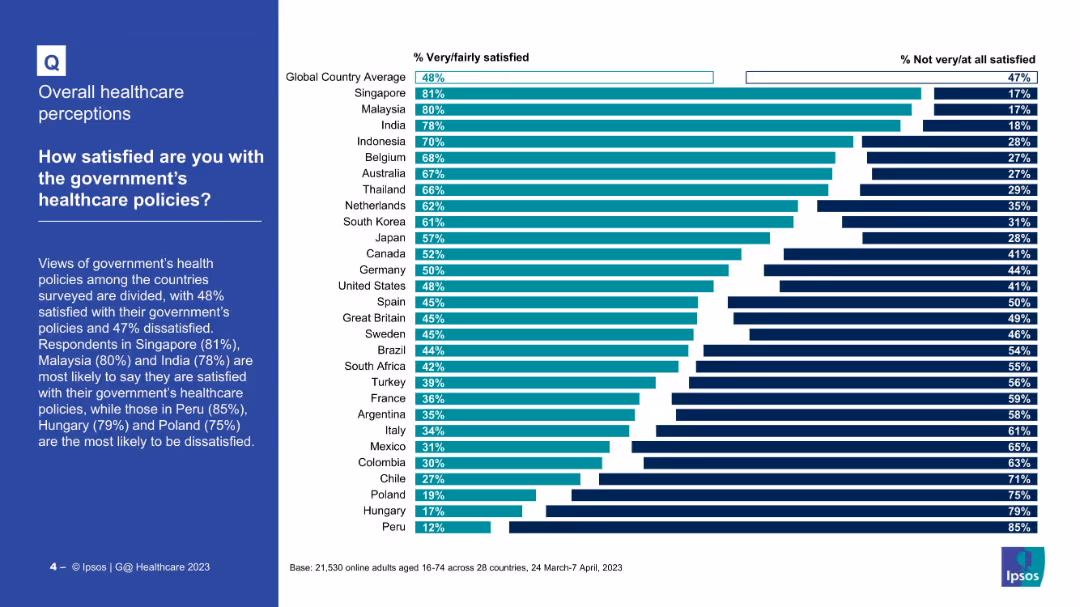
Bar chart showing satisfaction and dissatisfaction levels with healthcare policy by country
Market Analysis and Trends
Healthcare & Pharmaceuticals
This slide ranks countries based on citizens’ satisfaction with their government's healthcare policies. Singapore (81%) and Malaysia (80%) lead in satisfaction; Peru, Hungary, and Poland show the highest dissatisfaction.
Health policy, satisfaction, government, global survey, Ipsos, comparative analysis
false
Market Analysis and Trends
Healthcare & Pharmaceuticals
Mixed Chart
IPSOS
Add to my slides
Remove from favorites
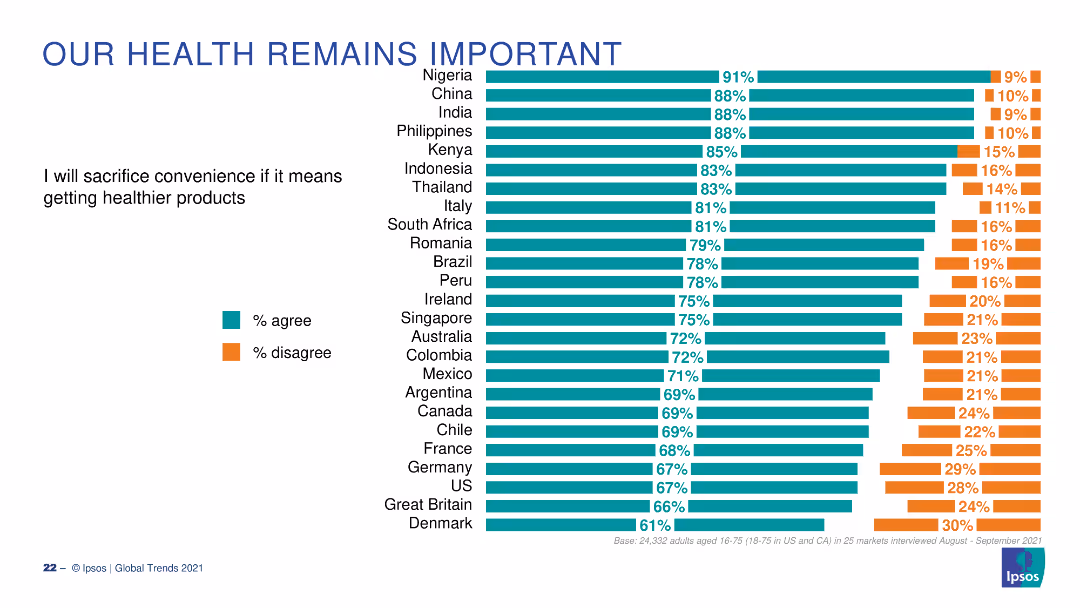
This slide features vertical bar charts showing respondents' willingness to sacrifice convenience for healthier products across different countries. The charts are color-coded, with accompanying text summarizing the findings.
Market Analysis and Trends
Healthcare & Pharmaceuticals
The slide indicates a strong willingness among respondents to prioritize health over convenience, with high agreement percentages across various countries. This can be used to discuss consumer health trends, market opportunities for healthier products, and cross-cultural differences in health priorities.
health priorities, consumer behavior, convenience, healthier products, global trends
false
Market Analysis and Trends
Healthcare & Pharmaceuticals
Multiple Chart
IPSOS
Add to my slides
Remove from favorites
Includes multiple column charts assessing the effectiveness of various health safety measures in encouraging the use of public and shared transport modes.
Market Analysis and Trends
Transportation & Logistics
Evaluates the effectiveness of health safety measures on public and shared transport usage.
health safety, transportation, measures, effectiveness
false
Market Analysis and Trends
Transportation & Logistics
Single Chart
McKinsey
Add to my slides
Remove from favorites
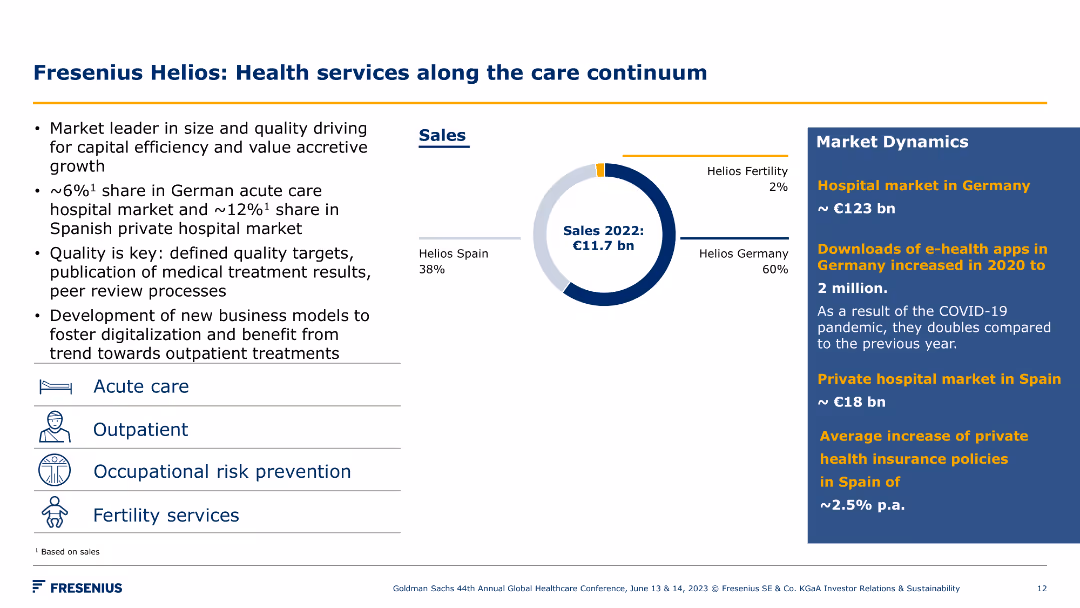
A pie chart of sales distribution and market dynamics. Key points on health services, market share, and new business models. Simple icons represent service categories.
Product and Service Analysis
Healthcare & Pharmaceuticals
The slide presents Fresenius Helios' market leadership in health services, highlighting sales distribution, market share, and innovations in care services.
health services, market share, sales, healthcare, business models, Fresenius Helios, care continuum, strategy, growth, market dynamics
false
Product and Service Analysis
Healthcare & Pharmaceuticals
Mixed Chart
Goldman Sachs
Add to my slides
Remove from favorites
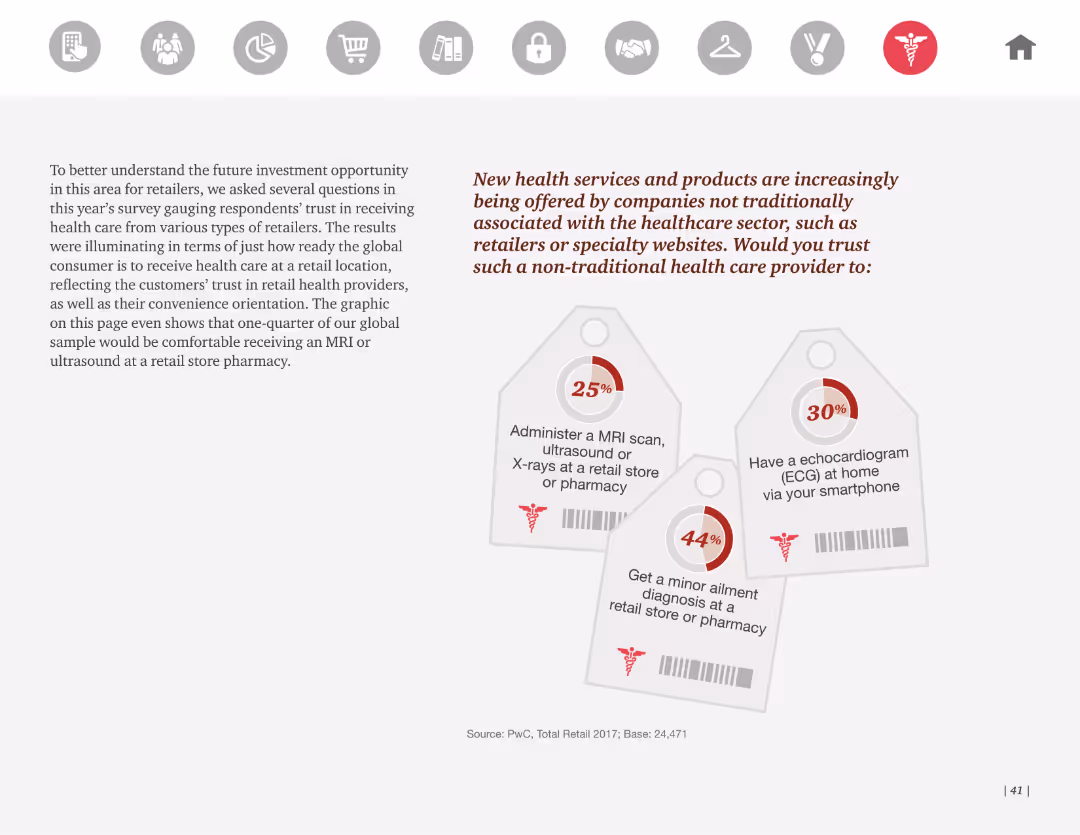
The slide shows a series of tag-shaped graphics with percentages, illustrating consumer willingness to receive healthcare services from non-traditional providers. It uses minimal text and a clean design.
Market Analysis and Trends
Healthcare & Pharmaceuticals
It discusses the trend of non-traditional companies offering health services, with a significant percentage of consumers willing to receive services like MRI scans, echocardiograms, and minor ailment diagnoses from retailers or online providers.
Health services, non-traditional providers, consumer trust, retail health, survey
false
Market Analysis and Trends
Healthcare & Pharmaceuticals
Mixed Chart
PwC/Strategy&
Add to my slides
Remove from favorites
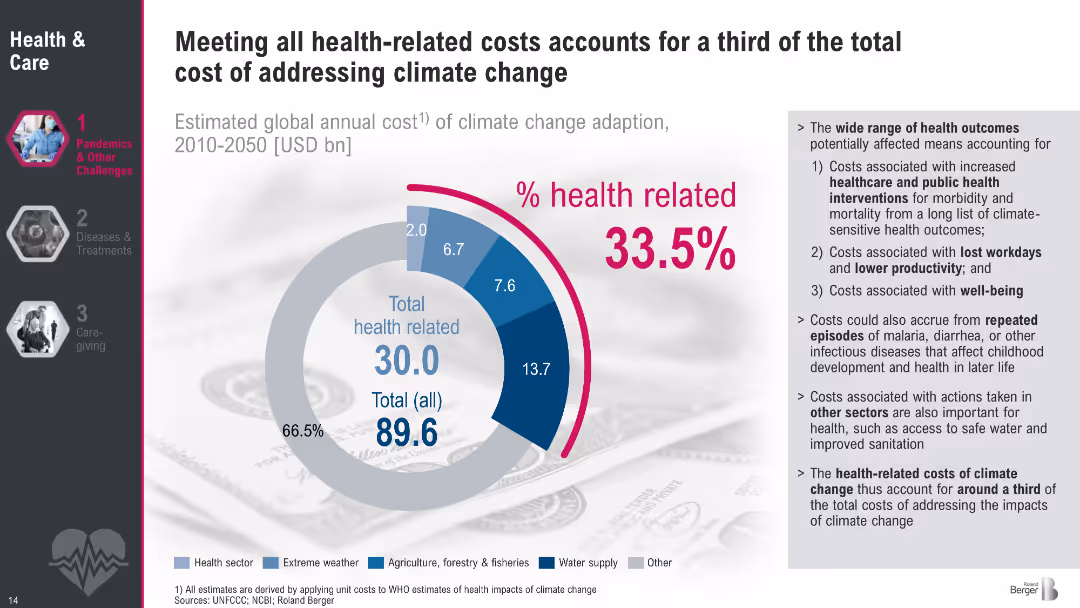
Donut chart showing health-related costs as part of climate change adaptation. Sidebar lists sources of health-related costs.
Strategic Planning
Healthcare & Pharmaceuticals
This slide presents a financial analysis of health-related costs within the broader climate adaptation budget. It reveals that health-related interventions comprise 33.5% of total adaptation costs from 2010–2050. It breaks down contributing factors such as healthcare interventions, productivity loss, and indirect costs from repeated infectious diseases and sanitation issues.
Health spending, climate adaptation, costs, interventions, sanitation, productivity, global health
false
Strategic Planning
Healthcare & Pharmaceuticals
Mixed Chart
Roland Berger
Add to my slides
Remove from favorites
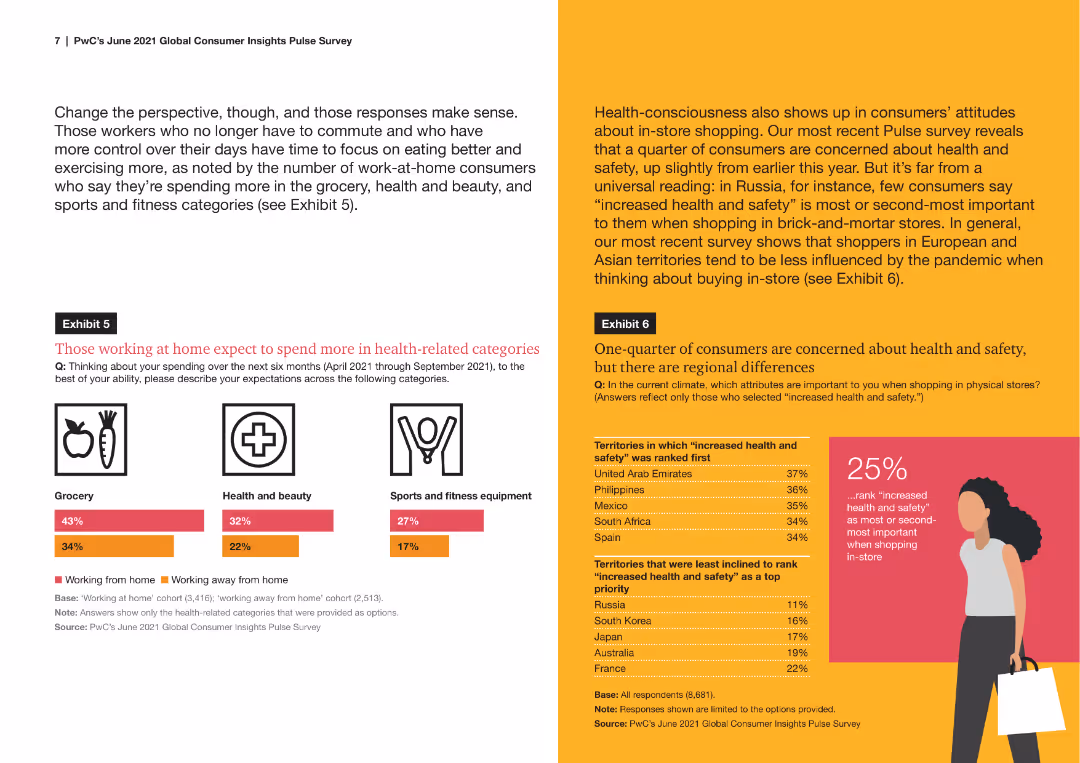
A column chart comparing the expected spending in health-related categories between those working from home and those working away from home. Categories include grocery, health and beauty, and sports equipment.
Market Analysis and Trends
Healthcare & Pharmaceuticals
The slide illustrates expected spending behaviors in health-related categories among consumers working from home versus those working away from home, showing differences in spending priorities and trends.
health spending, work from home, consumer behavior, grocery, health and beauty, sports equipment
false
Market Analysis and Trends
Healthcare & Pharmaceuticals
Mixed Chart
PwC/Strategy&
Add to my slides
Remove from favorites
This slide features a table comparing drivers of health system performance across various countries, including factors like ease of use, access to care, and community health improvements.
Industry Overview
Healthcare & Pharmaceuticals
It provides an overview of factors driving health system performance as rated by consumers across different countries, focusing on ease of use, access to care, and community health.
health system performance, drivers, country comparison, healthcare, consumer ratings
false
Industry Overview
Healthcare & Pharmaceuticals
Multiple Chart
EY
Add to my slides
Remove from favorites
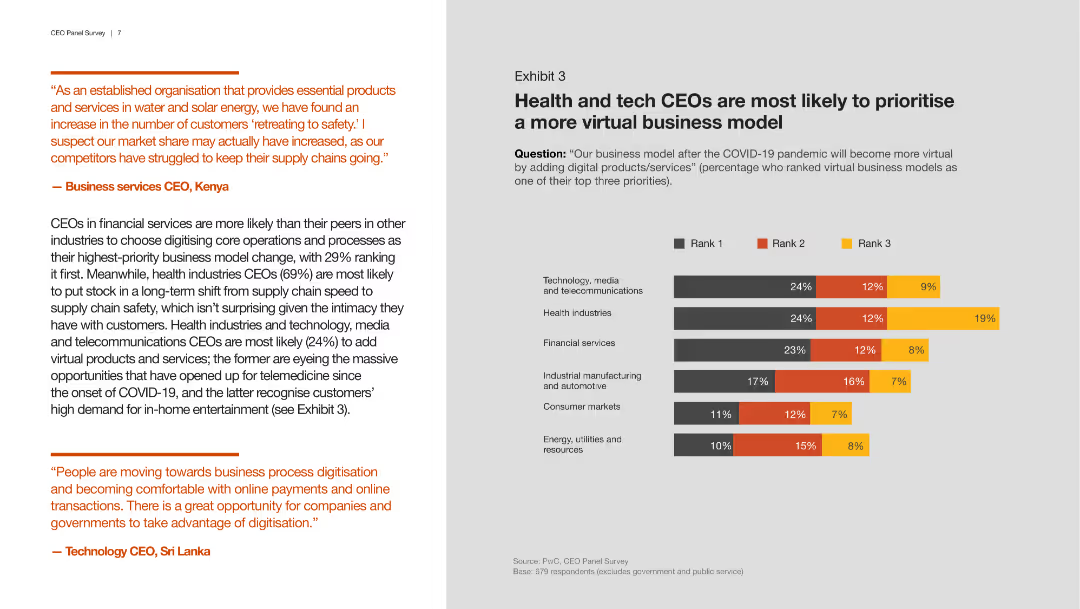
Shows a column chart comparing the likelihood of CEOs from various industries to prioritize virtual business models, with different colors representing ranking positions.
Strategic Planning
Technology & Software
This slide compares the prioritization of virtual business models among CEOs from different industries, with health and tech CEOs leading in the adoption of virtual and digital changes.
health, tech, CEOs, virtual business models, priorities
false
Strategic Planning
Technology & Software
Mixed Chart
PwC/Strategy&
Add to my slides
Remove from favorites
A straightforward column chart displaying the total deal value in the Healthtech sector over time, with a summary of key points in text to the side. The chart is highlighted with selective coloring to draw attention to the increasing trend.
Investment Analysis
Healthcare & Pharmaceuticals
The slide showcases Healthtech's increasing deal values over the years, with a record peak in H1 2021. It emphasizes the sector's resilience and potential for future growth, suggesting a strong market presence and investor interest.
Healthtech, Deal Value, Growth, Investment, SEA
false
Investment Analysis
Healthcare & Pharmaceuticals
Mixed Chart
Bain
Add to my slides
Remove from favorites
The slide has a split design comparing two sectors, Healthtech and Edtech, with circular percentage charts and supporting text.
Market Analysis and Trends
Technology & Software
This slide compares Healthtech and Edtech adoption rates in the past year, showing potential areas of growth and interest for consumers.
Healthtech, Edtech, Adoption Rates, Digital Consumers, Growth Potential, Market Analysis
false
Market Analysis and Trends
Technology & Software
Multiple Chart
Bain
Add to my slides
Remove from favorites
The slide contains a blue column chart showing the monthly active user growth of Telemedicine platforms, indexed to January 2020. It has a source citation and a simple title header in red.
Client Case Studies
Healthcare & Pharmaceuticals
This slide demonstrates the significant growth and user retention of HealthTech platforms post-lockdown, with usage data indexed to pre-COVID-19 levels, signifying lasting impacts on health technology adoption.
HealthTech, Growth, User Retention, Telemedicine, Platforms, COVID-19, Lockdown, Adoption, Technology, Data
false
Client Case Studies
Healthcare & Pharmaceuticals
Single Chart
Bain
Add to my slides
Remove from favorites
A multi-year column chart presents investment trends in HealthTech, with a distinct color for each year. The layout includes a title at the top, a legend, and a source citation at the bottom.
Investment Analysis
Healthcare & Pharmaceuticals
The slide shows an upward trend in HealthTech investments over several years, highlighting deal numbers and values, which indicates growing financial interest in the sector.
HealthTech, Investments, Trends, Deal Value, Financial Interest, Growth, Sector, Analysis, Multi-Year, Data
false
Investment Analysis
Healthcare & Pharmaceuticals
Single Chart
Bain
Add to my slides
Remove from favorites
The slide features a bar graph that outlines the growth forecast for health-tech market size and contains icons to represent different market segments.
Market Analysis and Trends
Healthcare & Pharmaceuticals
The slide projects the health-tech market growth and penetration among tier 2 and tier 3 populations, while acknowledging that the industry remains nascent. It provides insights into the challenges and potential for growth within health-tech, particularly in non-tier 1 city demographics. Useful for discussions on market potential and barriers to adoption in emerging markets.
Health-Tech, Market Growth, Penetration, Forecast, Barriers to Adoption, Emerging Markets
false
Market Analysis and Trends
Healthcare & Pharmaceuticals
Mixed Chart
Kearney
Add to my slides
Remove from favorites
Column chart indicating VCs' deal activity expectations with associated quotes on the right, structured under a descriptive title.
Investment Analysis
Technology & Software
Surveys VC expectations for increased deal activity in healthtech, SaaS, and Web3 from 2025-2030, and reduced focus on edtech.
healthtech, SaaS, Web3, edtech, VCs, long-term focus, deal activity, 2025-2030
false
Investment Analysis
Technology & Software
Mixed Chart
Bain
Add to my slides
Remove from favorites
Displays percentages and case study examples in health-focused consumer trends among Chinese, with related images of health products and activities.
Market Analysis and Trends
Healthcare & Pharmaceuticals
Explores the rising trend in health and wellness among Chinese consumers, emphasizing changes in product offerings by companies. Targets market analysts and health sector strategists.
health trends, China, wellness, consumer behavior, market analysis, product development
false
Market Analysis and Trends
Healthcare & Pharmaceuticals
Mixed Chart
BCG
Add to my slides
Remove from favorites
Slide features images of consumers and food products with accompanying stats and quotes about health trends and corporate responsibilities.
Market Analysis and Trends
Consumer Goods
Highlights consumer health trends and the expectations from companies to provide healthier and more sustainable options.
health trends, consumer expectations, sustainable food, corporate responsibility, nutrition
false
Market Analysis and Trends
Consumer Goods
Boxed
Deutsche Bank
Add to my slides
Remove from favorites
Slide with statistical data represented in charts, focused on mental and physical health concerns among women.
Technology and Digital Transformation
Healthcare & Pharmaceuticals
This slide examines critical concerns regarding women's mental and physical health, stressing the importance of well-being and the ability to switch off from work.
Health, Women, Mental Health, Physical Health, Data
false
Technology and Digital Transformation
Healthcare & Pharmaceuticals
Title
Deloitte
Add to my slides
Remove from favorites
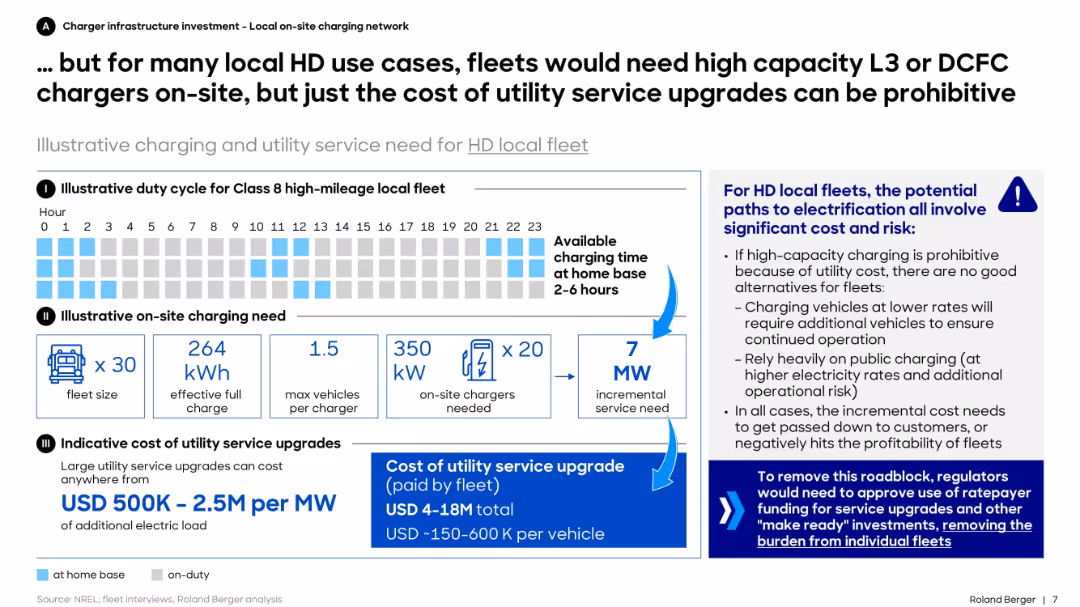
Similar layout as previous: duty cycle, charging need, and cost sections. Focuses on Class 8 trucks with high power demand. Right sidebar outlines risks.
Risk Assessment and Management
Transportation & Logistics
This slide emphasizes the high costs and technical demands of electrifying local heavy-duty fleets due to limited charging time and large power needs. It identifies infrastructure costs and regulatory barriers as major risks to fleet profitability.
heavy-duty, EV, DCFC, infrastructure, risk, charging, cost, fleet, Class 8, MW
false
Risk Assessment and Management
Transportation & Logistics
Mixed Chart
Roland Berger
Add to my slides
Remove from favorites
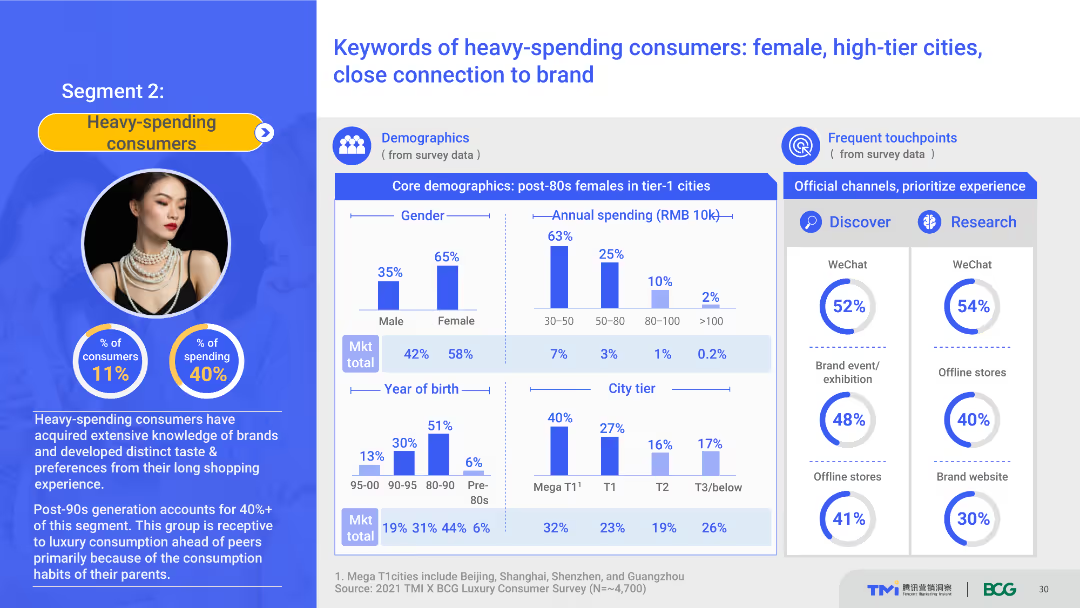
Several charts and graphs detailing demographics, spending patterns, and frequent touchpoints of heavy-spending consumers. The layout is dense with data, including pie charts and bar graphs.
Market Analysis and Trends
Consumer Goods
Provides an overview of the demographic and spending behavior of heavy-spending consumers in high-tier cities. Emphasizes the importance of WeChat as a touchpoint and the close brand connections of this consumer segment.
Heavy-spending consumers, demographics, high-tier cities, WeChat, brand connection
false
Market Analysis and Trends
Consumer Goods
Multiple Chart
BCG
Add to my slides
Remove from favorites
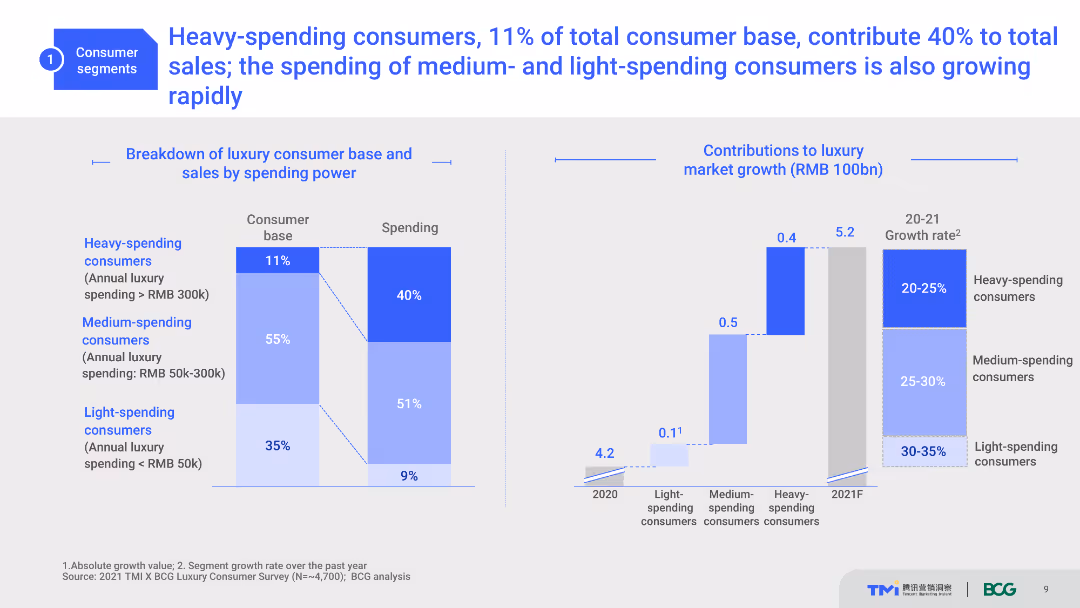
The slide features a column chart showing the breakdown of luxury consumer base and sales by spending power, with an emphasis on heavy-spending consumers.
Market Analysis and Trends
Retail & E-commerce
This slide highlights the contribution of heavy-spending consumers to the luxury market, indicating that although they are a smaller percentage of the consumer base, they contribute significantly to total sales, emphasizing the importance of targeting this group.
Heavy-spending consumers, luxury market, spending power, market growth, consumer base
false
Market Analysis and Trends
Retail & E-commerce
Multiple Chart
BCG
Add to my slides
Remove from favorites
This slide includes a column chart showing assets under management (AUM) by strategy as of 1Q24, with different hedge fund strategies such as equity hedge, event-driven, macro, and relative value.
Investment Analysis
Financial Services
The slide presents the distribution of hedge fund assets under management across various strategies, offering insights into the allocation of capital within the hedge fund industry.
hedge funds, AUM, investment strategies, capital allocation, financial services
false
Investment Analysis
Financial Services
Multiple Chart
JP Morgan
Add to my slides
Remove from favorites
This slide features a column chart showing levels of interest from managers in various digital asset types, including cryptocurrencies and NFTs. An image of an NFT frame is on the left.
Market Analysis and Trends
Financial Services
Discusses hedge fund managers' interest in different types of digital assets, including cryptocurrencies, NFTs, and stablecoins, detailing levels of interest from very interested to not interested.
hedge funds, digital assets, interest, managers, cryptocurrencies, NFTs, stablecoins, blockchain, analysis, trends
false
Market Analysis and Trends
Financial Services
Mixed Chart
EY
Add to my slides
Remove from favorites
The slide contains a pie chart illustrating investors' views on limiting managers' exposure to digital assets. A vibrant image of digital assets in a server room is on the left.
Market Analysis and Trends
Financial Services
Explores hedge fund managers' interest in digital assets and investors' requirements for limiting exposure to these assets, highlighting the percentage of discretionary assets.
hedge funds, digital assets, investors, exposure, cryptocurrency, decentralized finance, blockchain, market trends, server room
false
Market Analysis and Trends
Financial Services
Mixed Chart
EY
Add to my slides
Remove from favorites
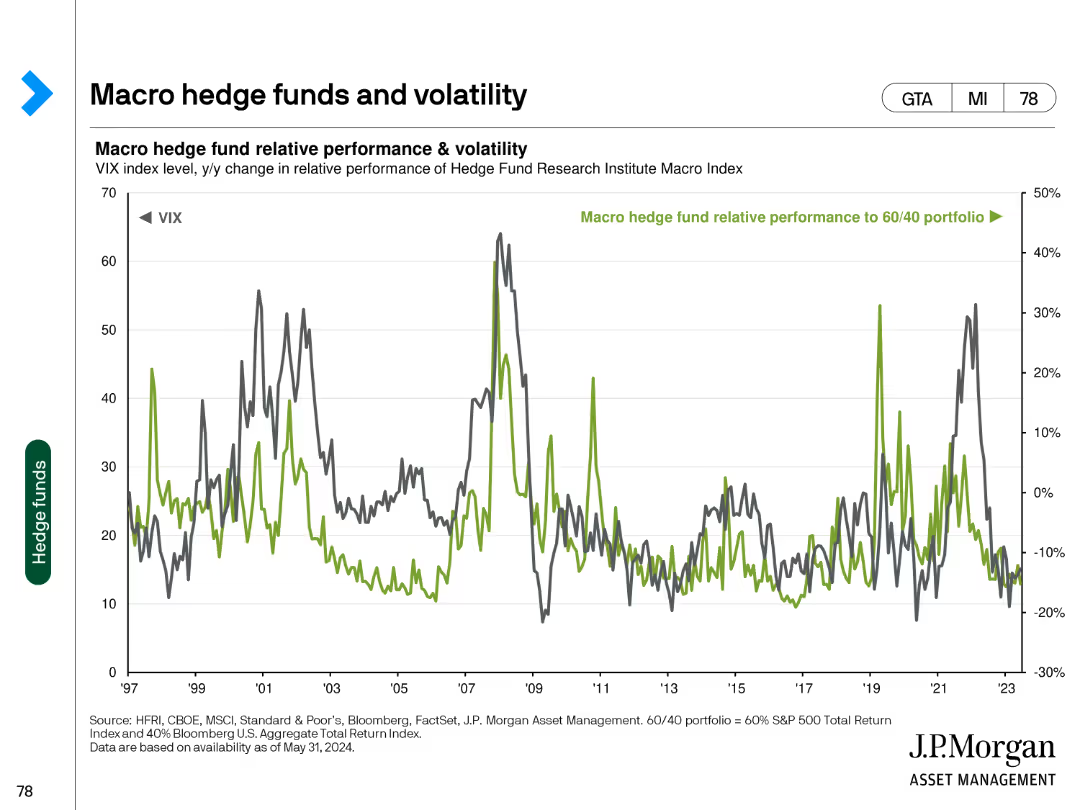
This slide features a line chart showing macro hedge fund relative performance and volatility, measured against the VIX index and a 60/40 portfolio from 1997 to 2023.
Risk Assessment and Management
Financial Services
The slide assesses the performance and volatility of macro hedge funds, comparing them to market volatility (VIX) and a traditional investment portfolio.
hedge funds, macro, volatility, VIX, performance
false
Risk Assessment and Management
Financial Services
Single Chart
JP Morgan
Add to my slides
Remove from favorites
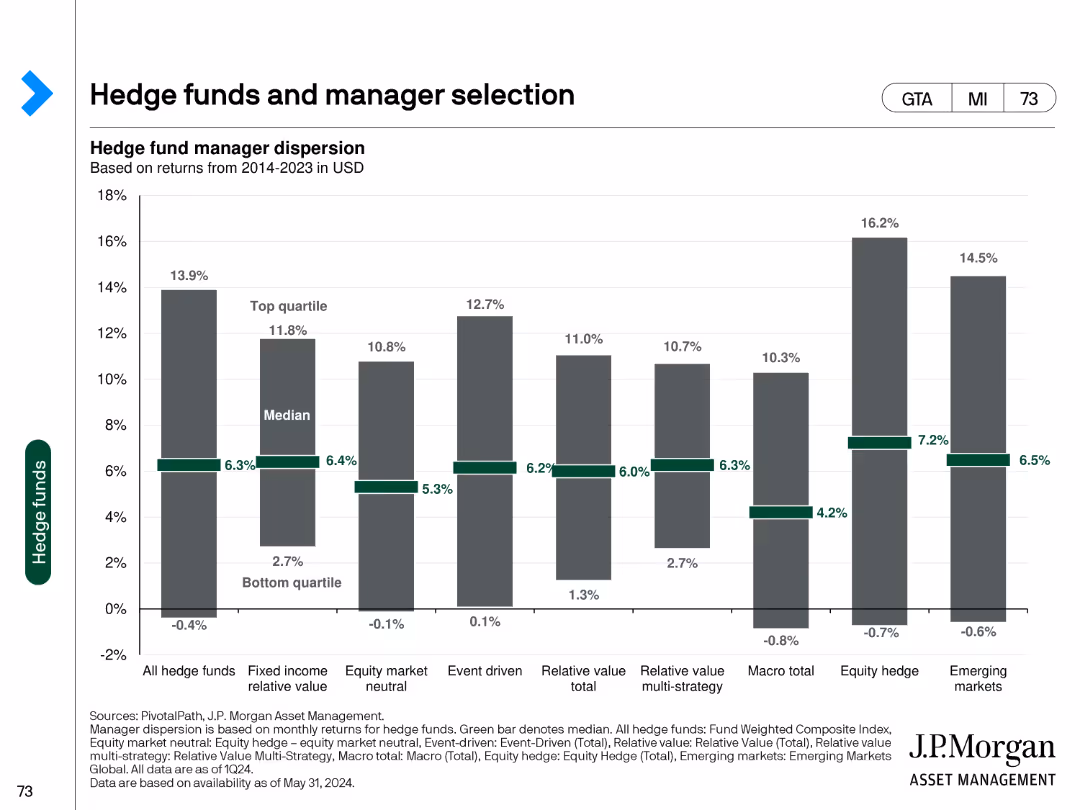
This slide features a column chart showing hedge fund manager dispersion based on returns from 2014-2023 in USD. It compares the performance of top quartile, median, and bottom quartile managers across different hedge fund strategies.
Investment Analysis
Financial Services
The slide examines hedge fund performance dispersion, providing a comparative analysis of returns across various hedge fund strategies over a multi-year period.
hedge funds, manager selection, returns, performance, dispersion
false
Investment Analysis
Financial Services
Single Chart
JP Morgan
Add to my slides
Remove from favorites
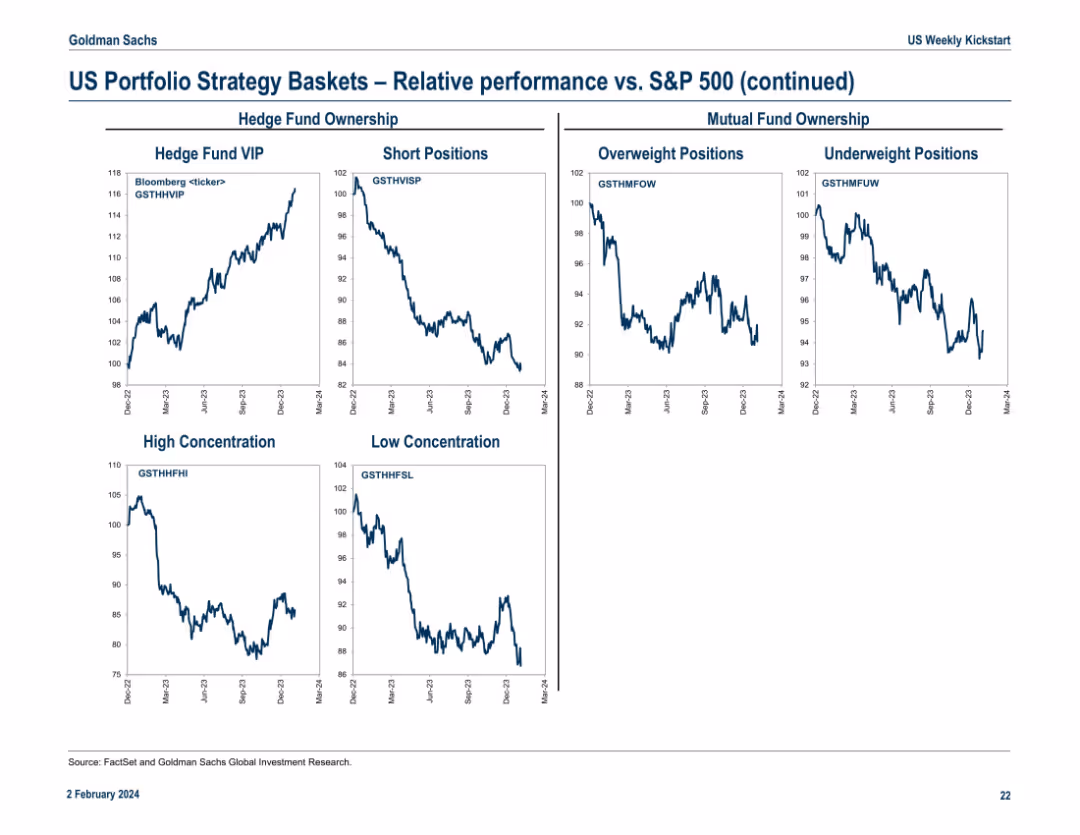
2x3 grid of line charts comparing hedge fund and mutual fund positioning, including VIPs, short/long, and concentration. Uniform structure with simple white background.
Performance Metrics and KPIs
Financial Services
This slide illustrates the impact of hedge fund and mutual fund positioning on stock performance. It examines VIP stocks, short positions, overweight/underweight allocations, and concentration effects on returns.
hedge funds, mutual funds, short interest, overweight, underweight, concentration
false
Performance Metrics and KPIs
Financial Services
Multiple Chart
Goldman Sachs
Add to my slides
Remove from favorites
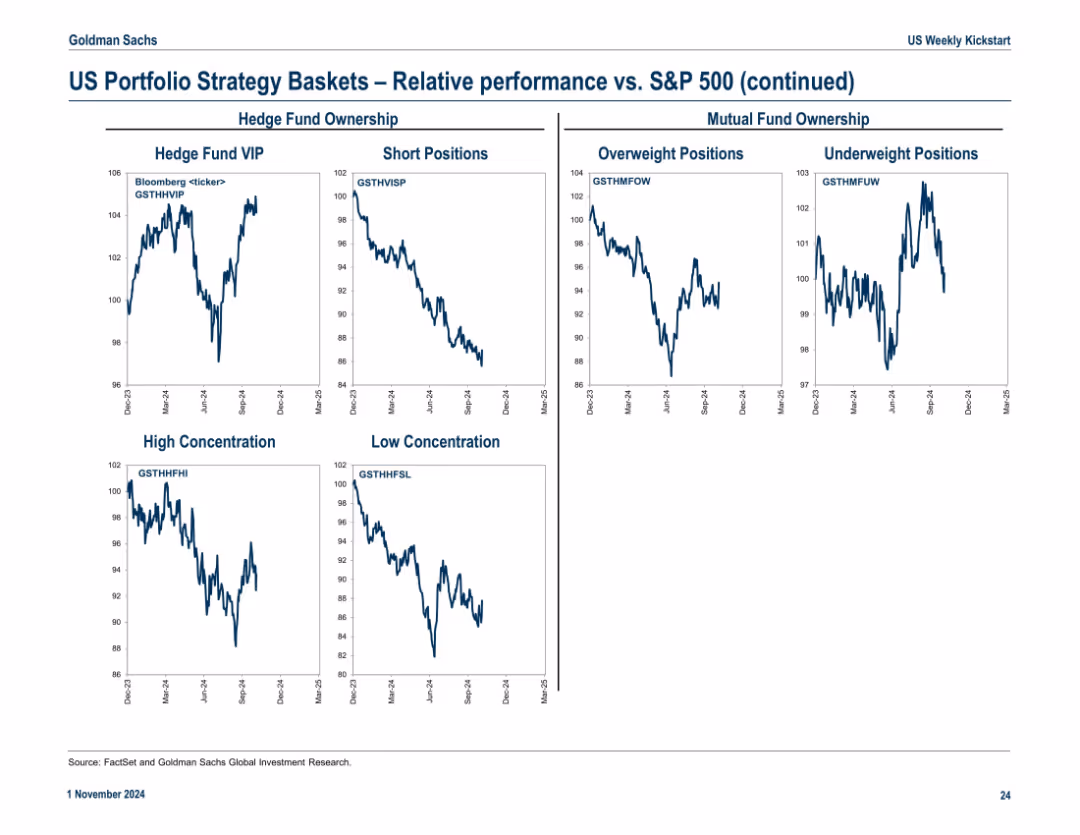
Six-panel layout with line charts showing various investment basket performances versus the S&P 500. Each panel has a different metric (e.g., Hedge Fund VIP, Short Positions). Basic grid structure, minimal text.
Performance Metrics and KPIs
Financial Services
This slide compares the relative performance of different hedge fund and mutual fund baskets (VIP, Short, Overweight, Underweight, High/Low Concentration) against the S&P 500 over the past year. The intent is to track investor positioning and sentiment through visual trend lines.
Hedge funds, mutual funds, short positions, overweights, S&P 500, trends
false
Performance Metrics and KPIs
Financial Services
Multiple Chart
Goldman Sachs
Add to my slides
Remove from favorites
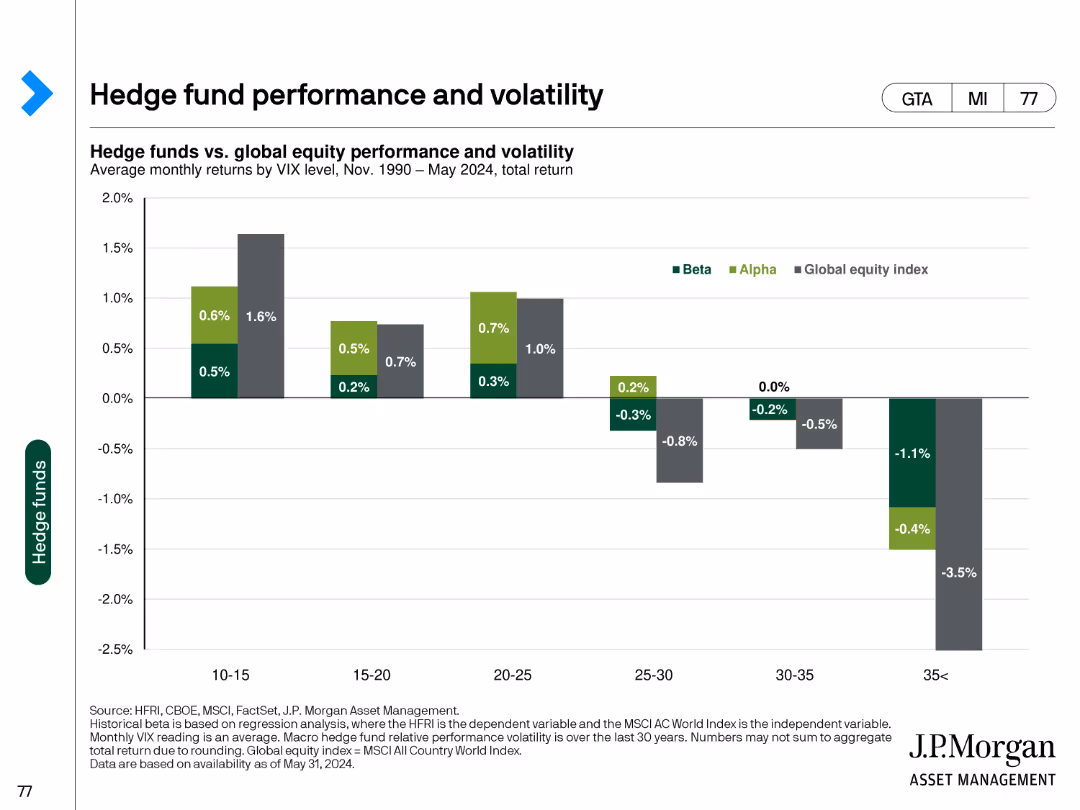
This slide contains a column chart comparing hedge fund returns and volatility against global equity performance by VIX level from November 1990 to May 2024.
Risk Assessment and Management
Financial Services
The slide evaluates hedge fund performance and volatility in comparison to global equity indices, segmented by different levels of market volatility.
hedge funds, performance, volatility, global equity, VIX
false
Risk Assessment and Management
Financial Services
Single Chart
JP Morgan
Add to my slides
Remove from favorites
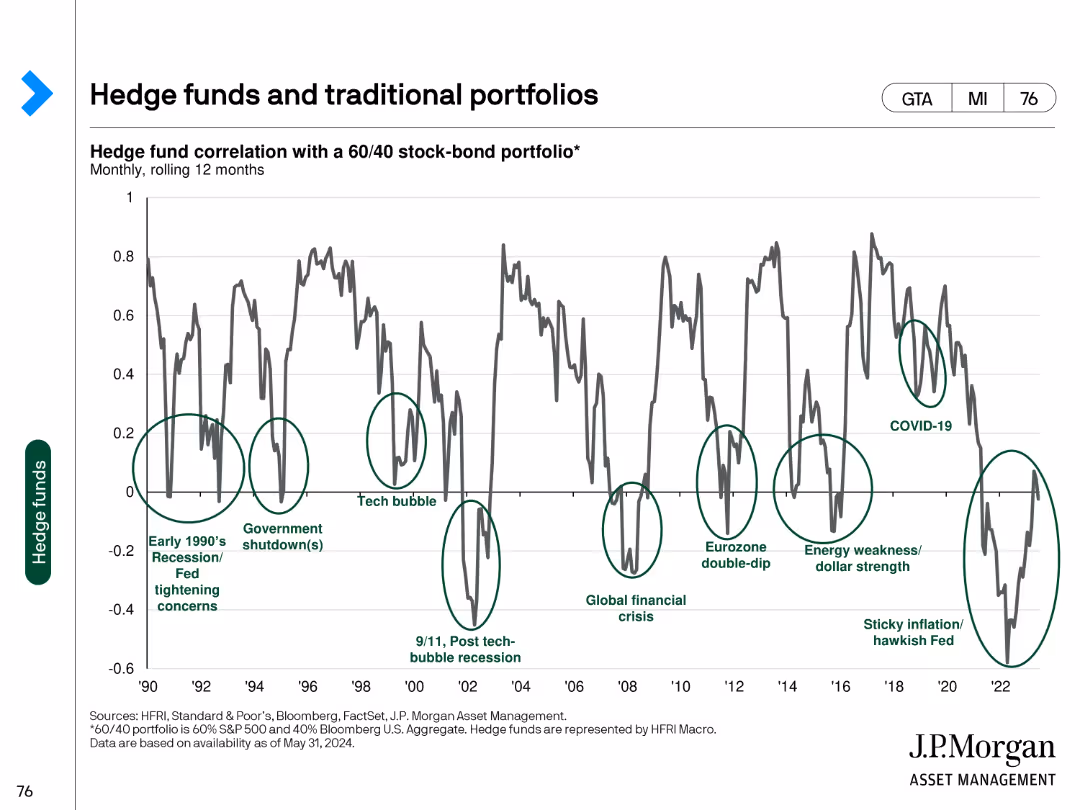
This slide features a line chart showing the correlation of hedge funds with a 60/40 stock-bond portfolio, highlighting major financial events from 1990 to 2024.
Investment Analysis
Financial Services
The slide analyzes the correlation between hedge fund performance and a traditional 60/40 portfolio, indicating how hedge funds behave in different economic conditions.
hedge funds, portfolios, correlation, financial events, investment analysis
false
Investment Analysis
Financial Services
Single Chart
JP Morgan
Add to my slides
Remove from favorites
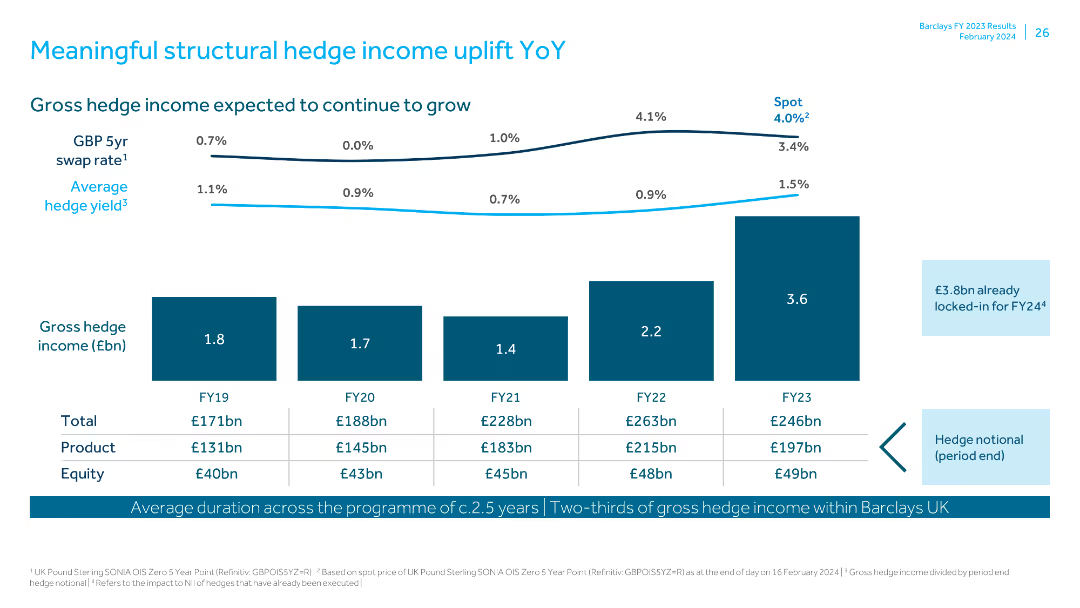
Column chart showing gross hedge income by fiscal year, with annotations for GBP 5yr swap rate and average hedge yield.
Financial Performance
Financial Services
Highlights the growth in gross hedge income across different fiscal years, emphasizing key financial metrics like swap rates and hedge yields.
hedge income, financial growth, swap rate, fiscal years, hedge yield
false
Financial Performance
Financial Services
Multiple Chart
Barclays
Add to my slides
Remove from favorites
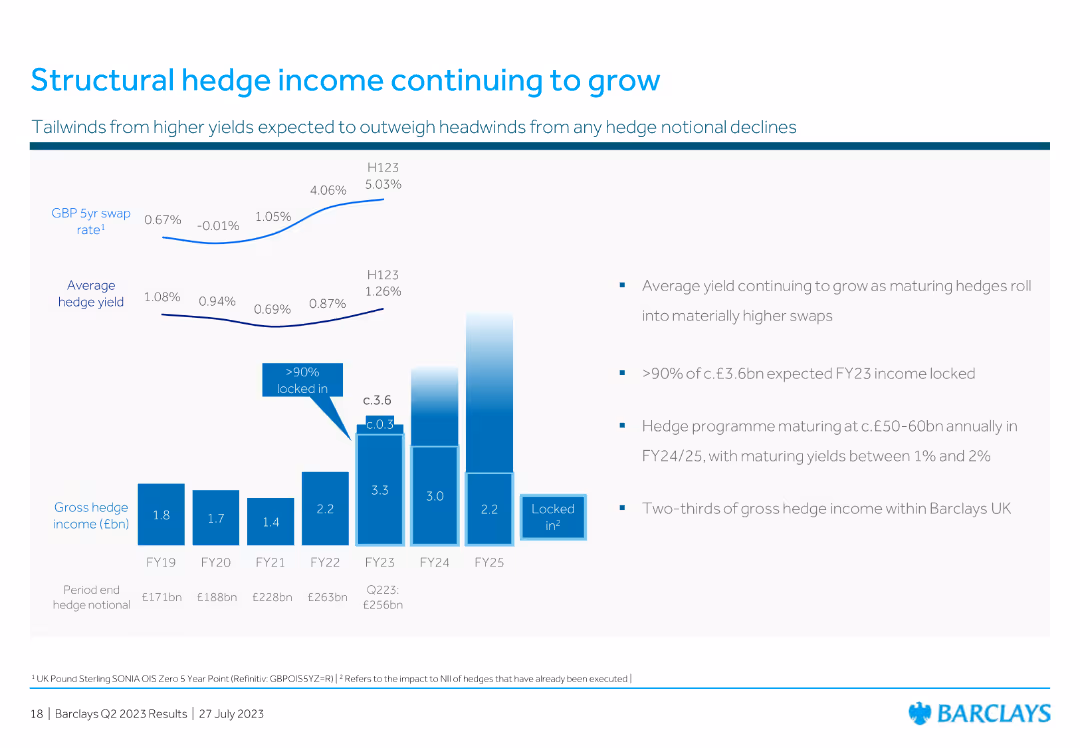
This slide features a complex set of column charts and a line graph showcasing data progression over multiple years, labeled FY19 to FY24, with various financial metrics displayed.
Financial Performance
Financial Services
The slide presents yearly increases in gross hedge income and projections for future years, highlighting trends in financial performance within a corporate finance context.
hedge, income, financial, trend, growth, GBP, FY19-FY24, Barclays UK, swap rate, equity
false
Financial Performance
Financial Services
Multiple Chart
Barclays
Add to my slides
Remove from favorites
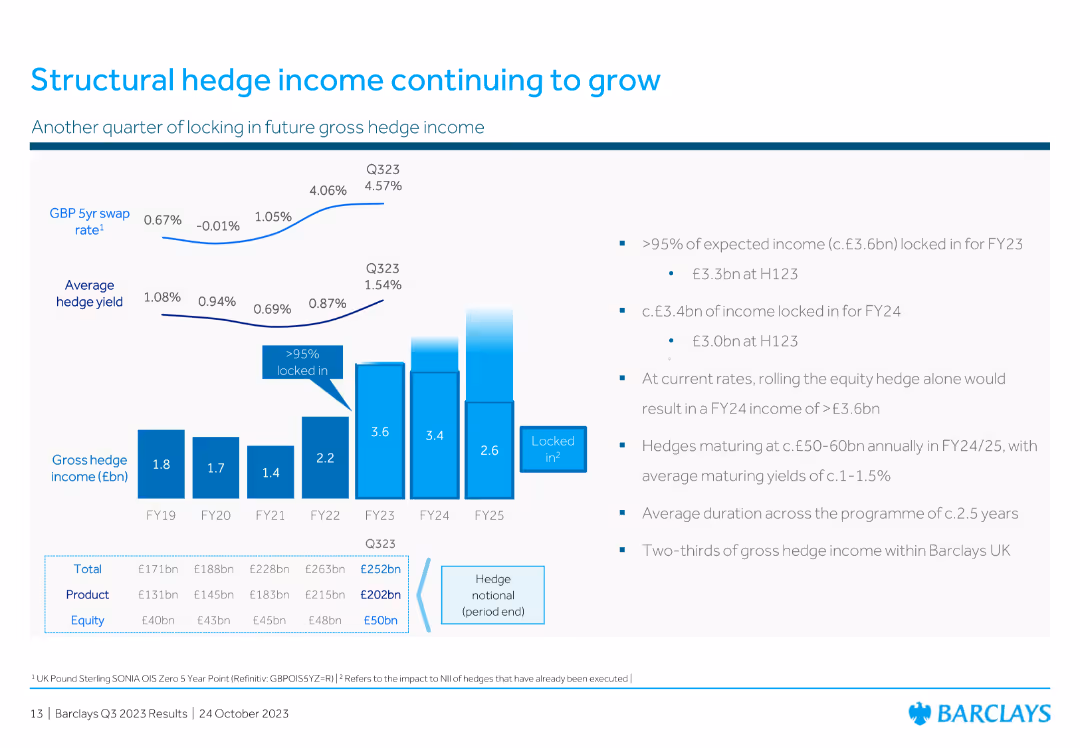
This slide features a column chart showing gross hedge income (£bn) from FY19 to FY25, with details on expected income, hedge yields, and the proportion of income locked in.
Financial Performance
Financial Services
The slide highlights the growth in structural hedge income for Barclays, detailing expected income, hedge yields, and the duration of income locking, projecting future gross hedge income growth.
hedge income, growth, projections, yields, FY25
false
Financial Performance
Financial Services
Multiple Chart
Barclays
Add to my slides
Remove from favorites
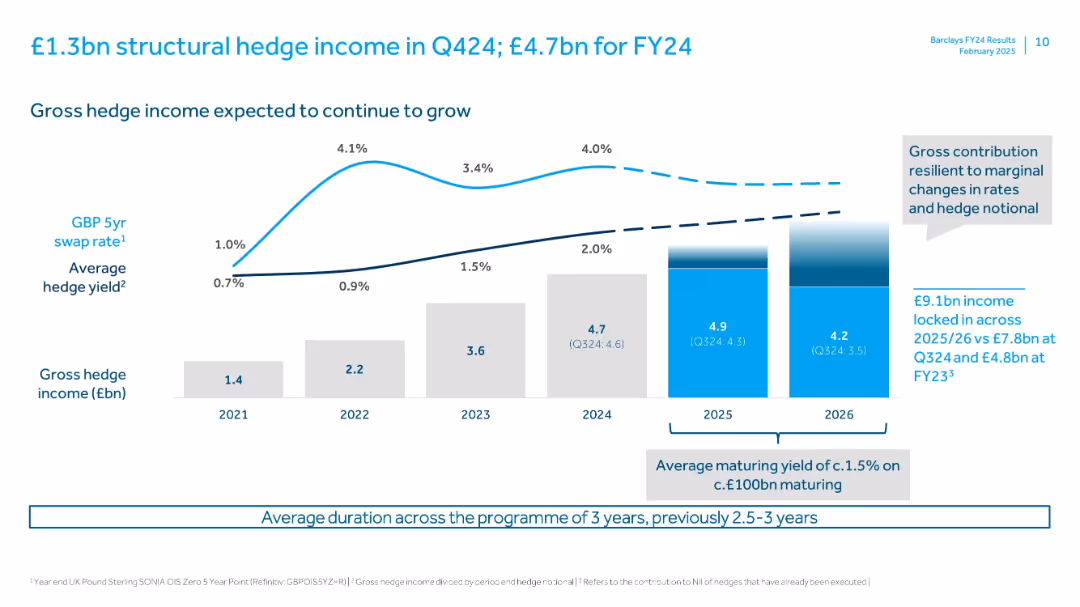
Line and bar combo chart; light background; annotations and callouts on right and bottom; historical and forecast data from 2021 to 2026
Financial Performance
Financial Services
Highlights Barclays’ hedge income growth, emphasizing resilience to rate changes and hedge notional. Shows gross income progression, projected yields, and income locked for 2025–26. Average duration and maturity yield insights also included.
hedge income, swap rate, forecast, yield, FY24, Barclays, duration, income, maturity, Q424
false
Financial Performance
Financial Services
Multiple Chart
Barclays
Add to my slides
Remove from favorites
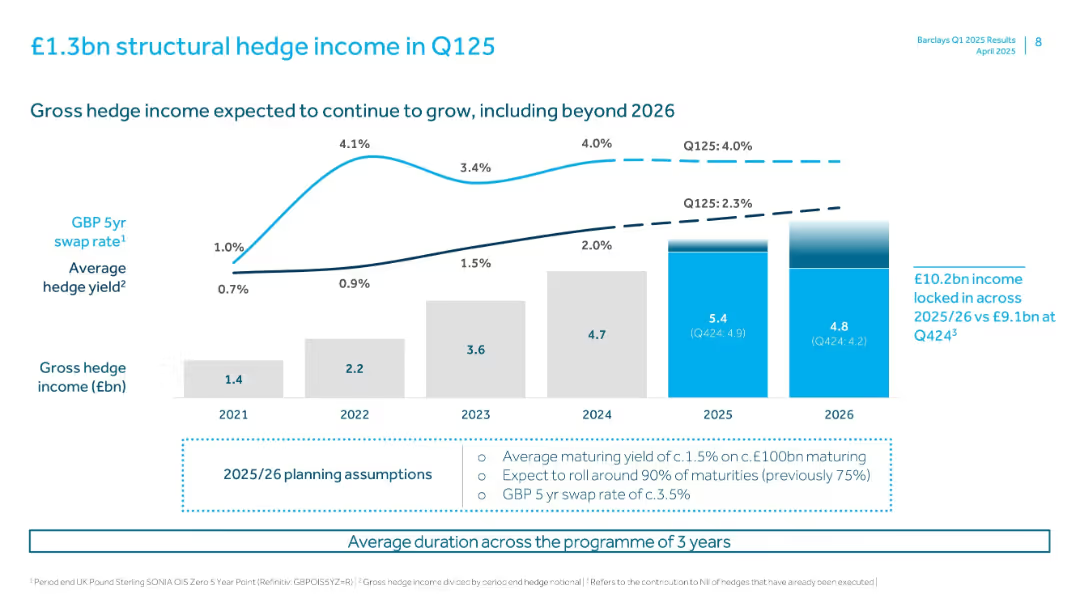
Combination of bar and line graphs projecting gross hedge income and yield rates.
Risk Assessment and Management
Financial Services
The slide projects gross hedge income beyond 2026 and shows historical and projected yield rates. It highlights growth in income and expectations around hedge maturities and market interest rates.
hedge income, swap rates, Barclays, risk management, hedge yield, Q125, interest rate, structural hedge, financial forecast
false
Risk Assessment and Management
Financial Services
Multiple Chart
Barclays
Add to my slides
Remove from favorites
The slide features a combination of line charts and column charts showcasing hedge yields and gross income.
Financial Performance
Financial Services
Highlights the continued growth of structural hedge income, expecting tailwinds from higher yields to outweigh headwinds.
hedge, income, yields, growth, financial
false
Financial Performance
Financial Services
Multiple Chart
Barclays
Add to my slides
Remove from favorites
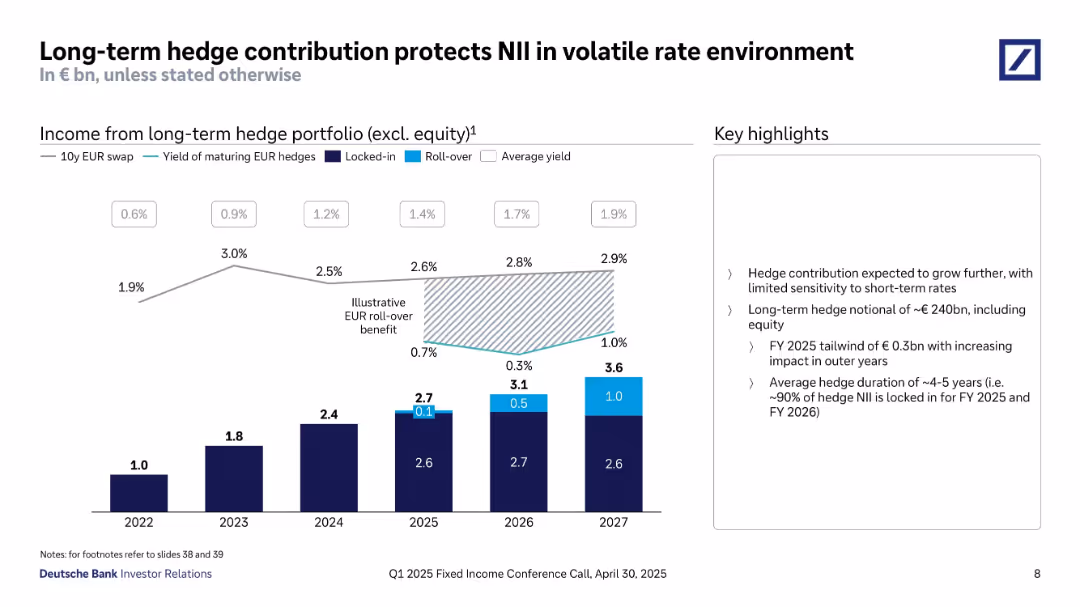
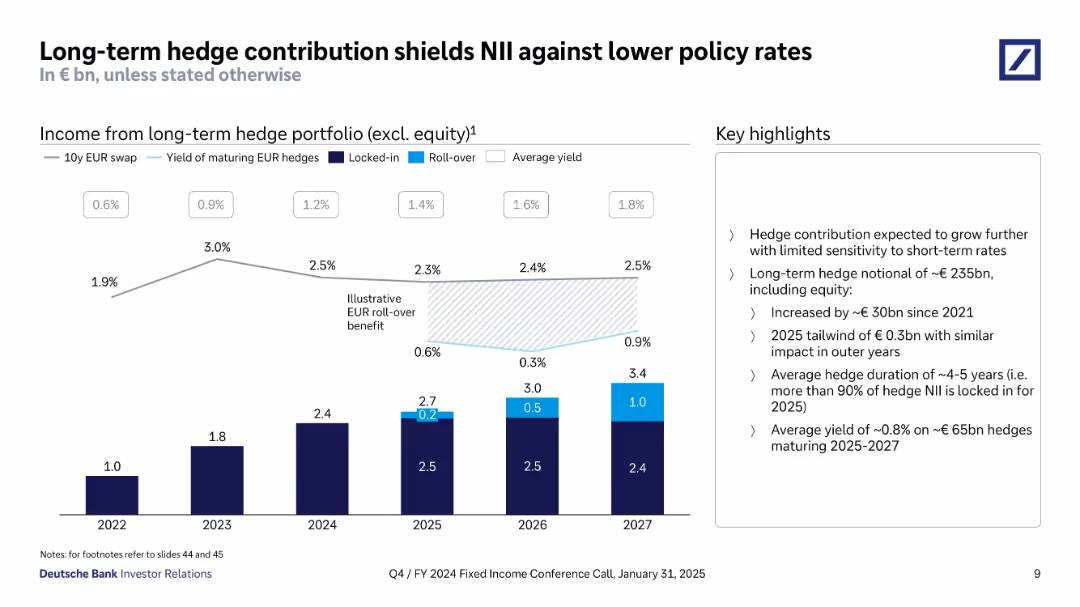
Bar chart showing income from long-term hedge portfolio over time; line graphs and shaded area show rate yields; text box with highlights.
Risk Assessment and Management
Financial Services
This slide illustrates how Deutsche Bank’s long-term hedge portfolio stabilizes NII. It shows income trends from 2022–2027, hedge yields, and locked-in rates. Key takeaways include low sensitivity to short-term rates and 90% hedge NII locked for FY 2025–26.
Hedge Portfolio, NII Protection, Interest Rate Risk, Long-term Strategy, Yield, FY 2025, Risk Management
false
Risk Assessment and Management
Financial Services
Mixed Chart
Deutsche Bank
Add to my slides
Remove from favorites
Includes a line chart and column chart showing the trends in hedge yields and the impact on gross income from 2019 to 2026, highlighting stability despite rate changes.
Financial Performance
Financial Services
This slide details the income stability through structural hedges, showing historical data and future projections of hedge yields and their impact on gross income. It underpins financial stability strategies by illustrating how income resilience is maintained through financial instruments.
Hedging, Income Stability, Projections, Finance
false
Financial Performance
Financial Services
Multiple Chart
Barclays
Add to my slides
Remove from favorites
Slide with column charts showing NII drivers in banking book segments through 2025, with key highlights text.
Risk Assessment and Management
Financial Services
Analyzes the offset of deposit margins through hedging strategies and lending growth, highlighting future financial expectations.
hedging, lending, NII, deposit margin, growth, finance
false
Risk Assessment and Management
Financial Services
Mixed Chart
Deutsche Bank
Add to my slides
Remove from favorites
A bar chart with segments for locked-in and roll-over hedge income, overlaid with yield and swap curves. Key highlights in a text box.
Risk Assessment and Management
Financial Services
Demonstrates how Deutsche Bank’s long-term hedge strategy protects NII from policy rate changes. Shows increasing hedge income and yield expectations, along with locked-in benefits for future years. Includes €235bn notional hedge size and ~5-year duration stats.
hedging, NII protection, policy rates, roll-over, locked-in yield, hedge strategy
false
Risk Assessment and Management
Financial Services
Mixed Chart
Deutsche Bank
Add to my slides
Remove from favorites
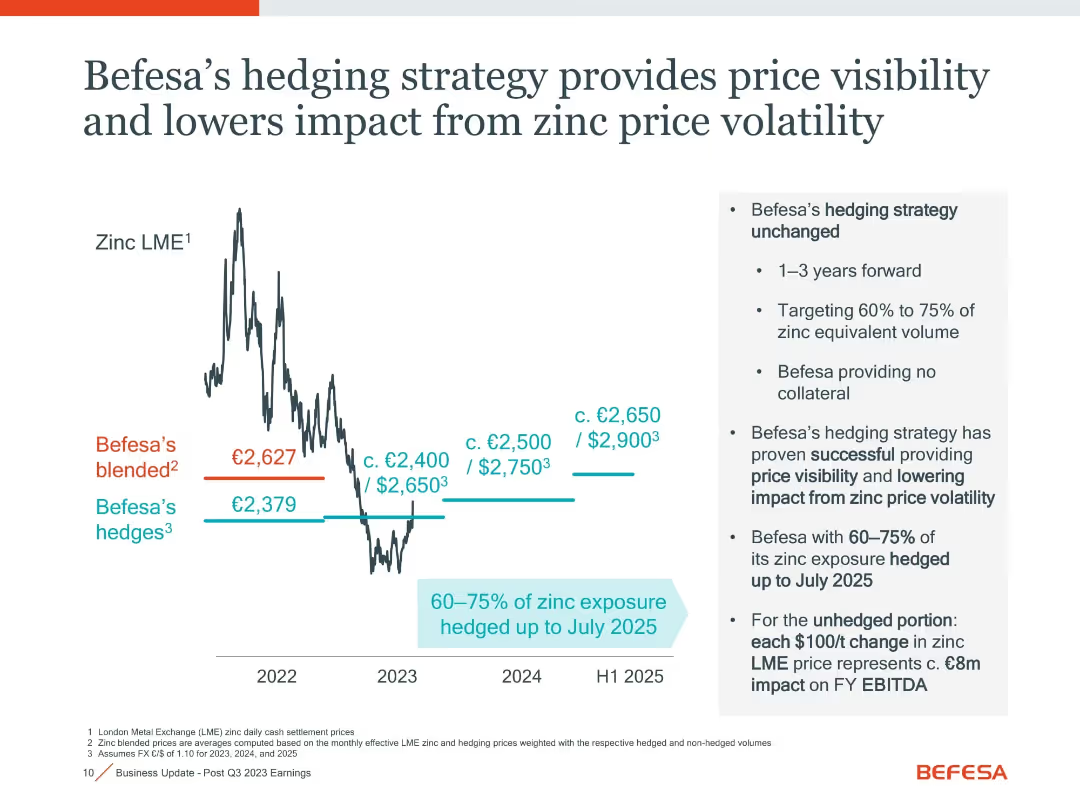
Line graph with annotated hedge zones and pricing thresholds
Risk Assessment and Management
Industrial & Manufacturing
Describes Befesa’s hedging strategy targeting 60–75% zinc exposure through 2025. It provides stability amid market volatility. Highlights hedged/unhedged impact on EBITDA per $100/t zinc variation.
hedging, zinc exposure, EBITDA impact, price volatility, strategy
false
Risk Assessment and Management
Industrial & Manufacturing
Mixed Chart
Goldman Sachs
Add to my slides
Remove from favorites
The slide features a detailed case study on HEFA (Hydroprocessed Esters and Fatty Acids) as a viable solution for bio jet fuels in the US, covering the process description, key metrics, feedstock characteristics, and environmental performance.
Client Case Studies
Transportation & Logistics
This slide examines HEFA as a technically viable solution for producing bio jet fuels in the US, detailing the conversion process, key metrics, feedstock characteristics, and environmental impacts associated with HEFA production.
HEFA, bio jet fuel, US, case study, process description, key metrics, feedstock characteristics, environmental performance
false
Client Case Studies
Transportation & Logistics
Mixed Chart
Kearney
Add to my slides
Remove from favorites
Slide with two doughnut charts comparing helicopter deliveries, two pie charts on revenue segmentation, and bullet points. Red and grey shades are utilized, with a clean layout.
Product and Service Analysis
Transportation & Logistics
Analysis of helicopter delivery numbers and revenue by customer segment for FY2020 and FY2021, highlighting changes and focusing on different helicopter models within the AW family.
helicopter deliveries, revenue segmentation, AW family, defense, civil, OE, CS&T
false
Product and Service Analysis
Transportation & Logistics
Multiple Chart
Goldman Sachs
Add to my slides
Remove from favorites
There are two large column charts, a pie chart, and a textbox with bullet points. Red highlights are used for key data points, and percentages are presented in a clear format.
Market Analysis and Trends
Transportation & Logistics
The slide provides a performance overview of Leonardo's helicopter business, including past results and projections, with a focus on growth and profitability factors.
helicopter, orders, revenue, EBITA, profitability, civil recovery, market trends, production efficiency
false
Market Analysis and Trends
Transportation & Logistics
Multiple Chart
Goldman Sachs
Add to my slides
Remove from favorites
The slide is split horizontally, with two sections for "Helicopters" and "Aircrafts". Each section has its own set of bullet points and financial figures presented in red text. Icons for helicopters and aircraft are used to represent each category.
Financial Performance
Industrial & Manufacturing
The slide presents financial confidence in the medium to long-term prospects for helicopters and aircraft businesses, with data on backlogs and revenue growth over the past years. It is likely used to communicate business stability and forecast future growth to stakeholders.
Helicopters, Aircraft, Revenue, EBITA, Financial Growth
false
Financial Performance
Industrial & Manufacturing
Header Vertical
Goldman Sachs
Add to my slides
Remove from favorites
Pie charts and column chart showing Hellmann’s financial performance, market segmentation, and growth trends. Features data on market strategy for mayonnaise and variations.
Strategic Planning
Consumer Goods
Examines Hellmann’s growth and market strategy, focusing on its strong position in mayonnaise across various markets and its recent performance trends. Details strategic initiatives for maintaining market leadership.
Hellmann’s, Market Strategy, Growth Trends, Market Leadership, Strategic Initiatives
false
Strategic Planning
Consumer Goods
Multiple Chart
Deutsche Bank
Add to my slides
Remove from favorites
The slide shows a column chart with features like detailed product descriptions, size calculators, and 360° views that shoppers find helpful for avoiding returns.
Customer and Market Segmentation
Retail & E-commerce
Identifies features that online shoppers consider helpful to prevent returns, such as detailed product descriptions, size calculators, and various product viewing options.
Helpful features, Online shopping, Product selection, Size calculator, 360° view
false
Customer and Market Segmentation
Retail & E-commerce
Mixed Chart
Roland Berger
Add to my slides
Remove from favorites
The slide includes a column chart showing the percentage of people not in need of any help, with a detailed breakdown of specific types of help needed or not needed, comparing May and December data.
Client Case Studies
Healthcare & Pharmaceuticals
This slide presents data on the percentage of people not in need of any help, with a detailed breakdown of specific types of help needed or not needed, comparing May and December survey results.
help, not needed, survey, comparison, specific types, column chart, public opinion, healthcare, time periods
false
Client Case Studies
Healthcare & Pharmaceuticals
Single Chart
IPSOS
Add to my slides
Remove from favorites
The slide includes a column chart depicting the percentage of people receiving various types of help, comparing data from May and December. Text boxes highlight key percentages.
Client Case Studies
Healthcare & Pharmaceuticals
This slide presents data on the types of help received by people in the last month, comparing survey results from May and December, with a focus on the percentage of people receiving different types of help.
help, survey, received, comparison, types of help, column chart, healthcare, public opinion, time periods
false
Client Case Studies
Healthcare & Pharmaceuticals
Single Chart
IPSOS
Add to my slides
Remove from favorites
The slide features two side-by-side graphs: one for Henry Hub and the other for UK NBP gas prices. Each graph shows the price estimates from banks, brokers, and consultants. The background image depicts a gas facility. Text explains trends.
Market Analysis and Trends
Energy & Utilities
This slide forecasts gas prices for Henry Hub and UK NBP, comparing bank, broker, and consultant estimates. It discusses the price trends and provides average price forecasts for 2026, highlighting the wide range of estimates due to market dynamics.
Henry Hub, UK NBP, gas prices, forecasts, bank/broker, consultants
false
Market Analysis and Trends
Energy & Utilities
Multiple Chart
EY
Add to my slides
Remove from favorites
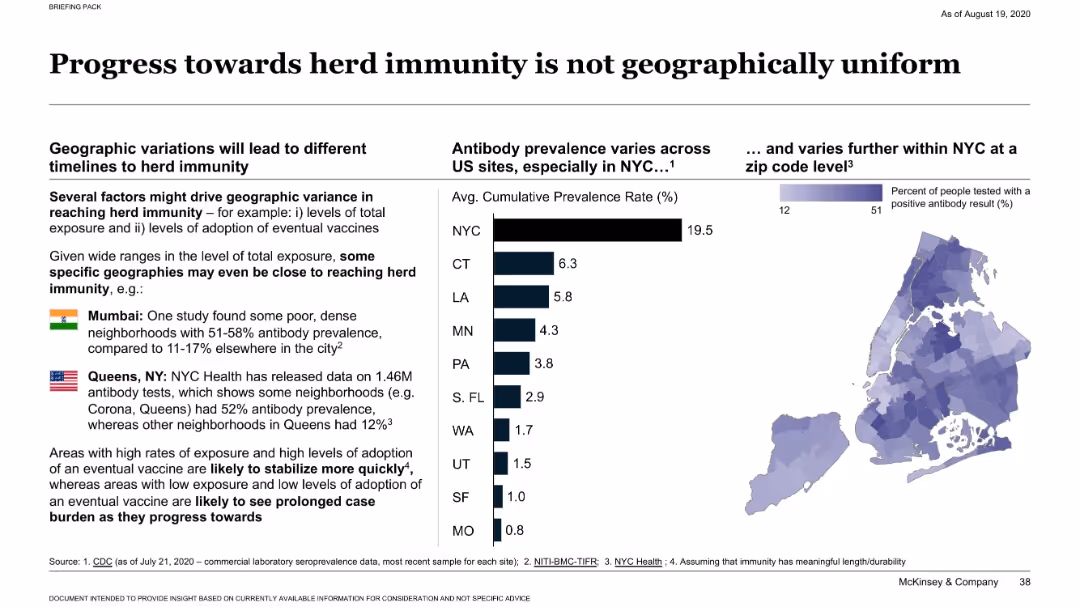
Dual layout with bar graph of antibody prevalence across U.S. states and a heatmap of NYC ZIP code data; includes callouts for Mumbai and Queens.
Market Analysis and Trends
Healthcare & Pharmaceuticals
Demonstrates wide geographic variation in antibody prevalence across U.S. cities and globally. Highlights that some dense areas (like Queens and Mumbai) have much higher rates, suggesting uneven progress toward herd immunity based on exposure and vaccine adoption.
herd immunity, antibody prevalence, NYC, Mumbai, geographic variation
false
Market Analysis and Trends
Healthcare & Pharmaceuticals
Multiple Chart
McKinsey
Add to my slides
Remove from favorites
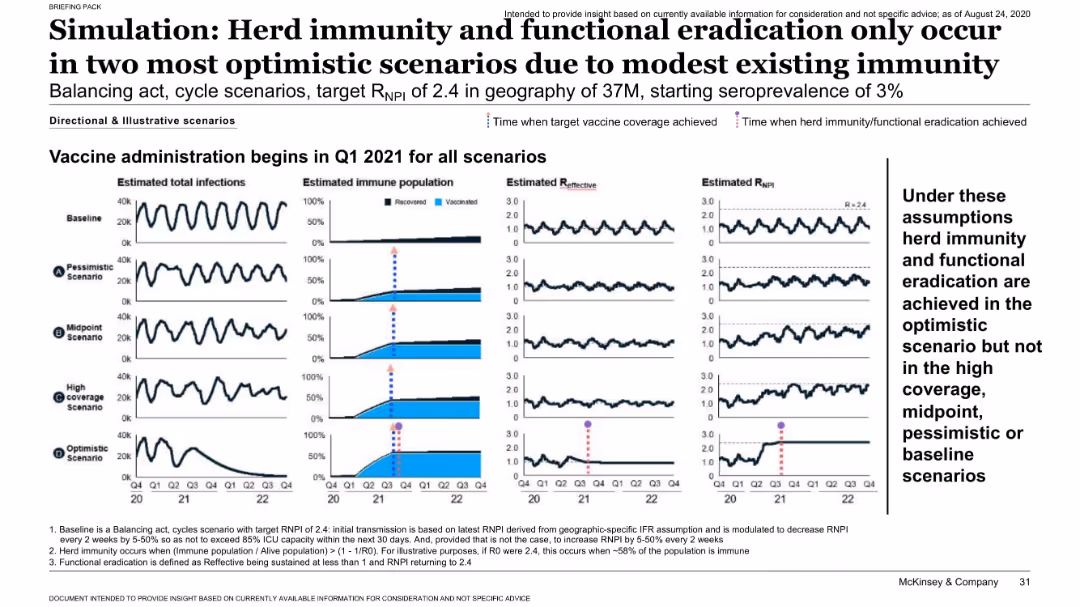
Multi-panel layout comparing infection trends, immune population, effective R, and RNPI across five vaccine rollout scenarios; uses vertical markers for milestones.
Strategic Planning
Healthcare & Pharmaceuticals
Shows that only in the optimistic and high-coverage scenarios is herd immunity and functional eradication of COVID-19 achieved. Visual simulation illustrates varying outcomes based on vaccine rollout effectiveness and starting immunity levels.
herd immunity, simulation, scenarios, RNPI, vaccine, immunity levels
false
Strategic Planning
Healthcare & Pharmaceuticals
Mixed Chart
McKinsey
Add to my slides
Remove from favorites
Central circular diagram surrounded by text blocks that emphasize the bank's strengths, with a background of a global map.
Strategic Planning
Financial Services
This slide emphasizes the longstanding global reach and comprehensive services of the bank, portraying it as a reliable financial partner through various market cycles, geared towards future client needs with robust financial strategies.
Heritage, Global, Strategy, Financial Services, Client Needs, Market Cycles, Future
false
Strategic Planning
Financial Services
Framework
Deutsche Bank
Add to my slides
Remove from favorites
Displays a pie chart comparing 2020 market share in HEV plastic fuel tanks among competitors, with annotations about technology and market strategy. The chart uses various colors to represent different competitors.
Product and Service Analysis
Industrial & Manufacturing
The slide examines TI Fluid Systems' market share in the HEV plastic fuel tanks sector, highlighting their second position and strategic initiatives like the PACE awarded TAPT process to enhance market share.
HEV, market share, 2020, pie chart, fuel tanks
false
Product and Service Analysis
Industrial & Manufacturing
Mixed Chart
Deutsche Bank
Add to my slides
Remove from favorites
Matrix chart with three horizontal zones and detailed text explanation on the right side.
Technology and Digital Transformation
Financial Services
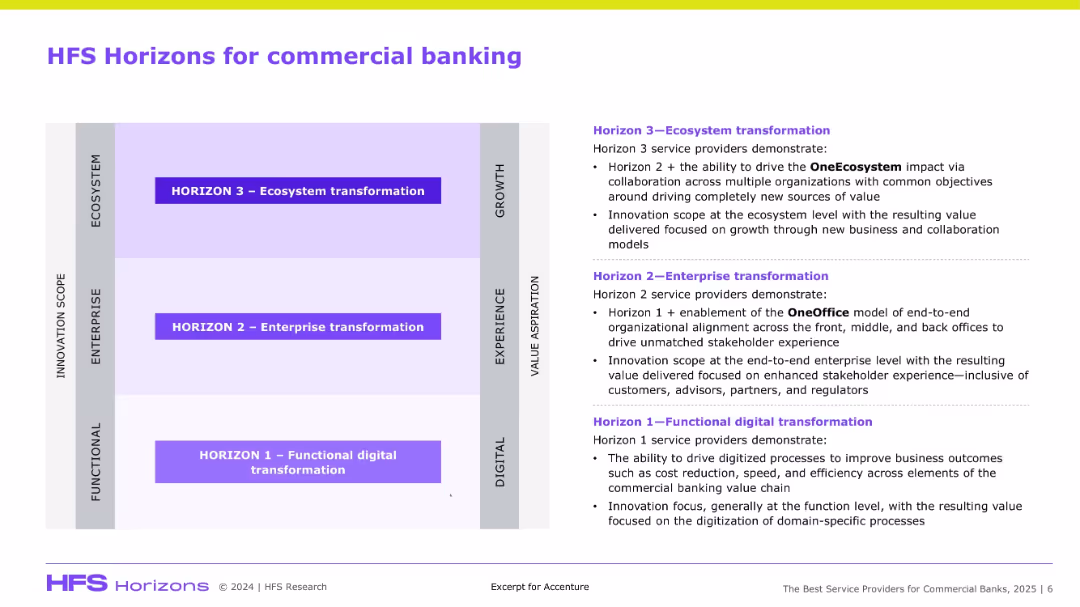
This slide presents a 3-tier model (Functional, Enterprise, Ecosystem transformation) explaining stages of digital maturity in commercial banking, with emphasis on value creation, innovation, and alignment.
HFS, commercial banking, digital transformation, ecosystem, innovation, OneOffice
false
Technology and Digital Transformation
Financial Services
Diagram
Accenture
Add to my slides
Remove from favorites
Four-column layout with icons and brief descriptions for each data source (briefings, reference checks, surveys, public info); uses light and bright background with structured blocks.
Regulatory and Compliance
Professional Services
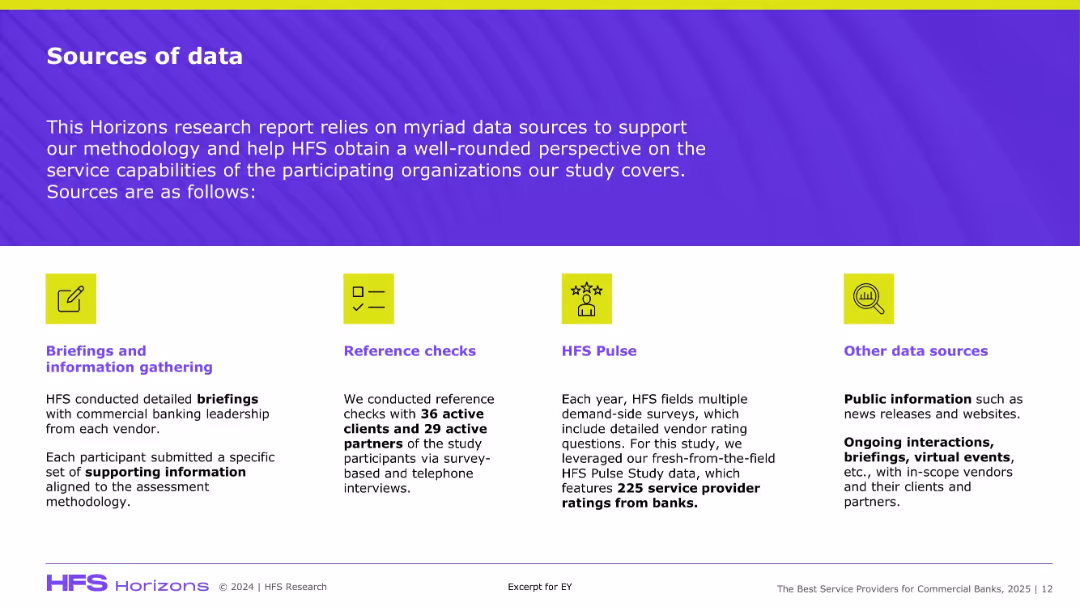
This slide outlines the data sources used in the HFS Horizons research, emphasizing its comprehensive approach: vendor briefings, client and partner reference checks, HFS Pulse survey data, and public or third-party information. It highlights the robustness and credibility of the research methodology, especially for assessing service capabilities in commercial banking contexts.
HFS, data sources, methodology, vendor ratings, reference checks, surveys
false
Regulatory and Compliance
Professional Services
Agenda
Accenture
Add to my slides
Remove from favorites
The slide features three large circular icons with text explaining the steps to hire hidden workers: prioritize potential, filter in not out, and transform the culture.
Strategic Planning
Government & Public Sector
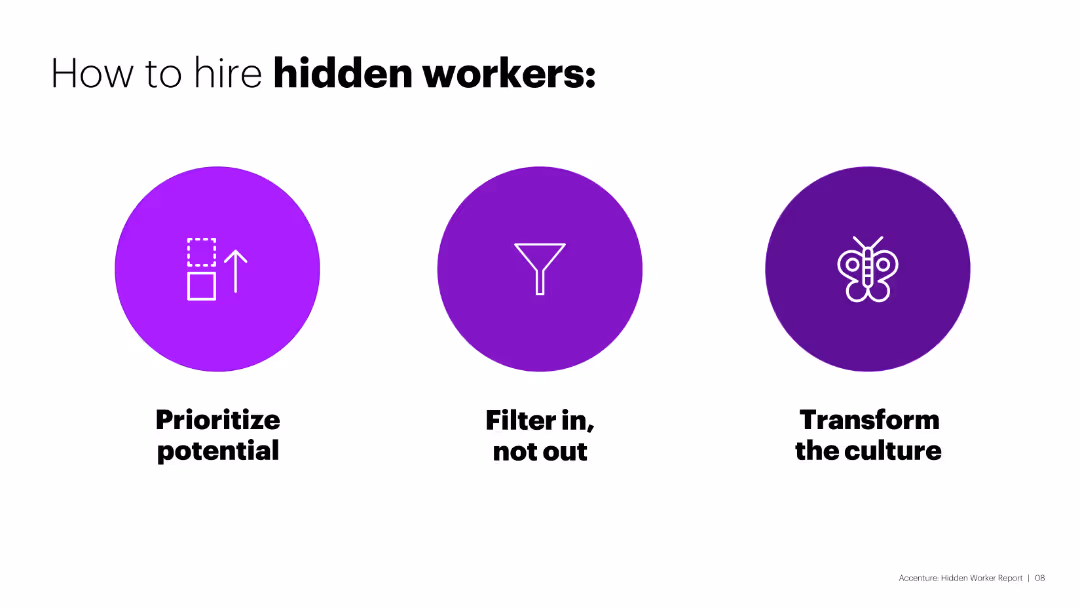
The slide provides strategies for hiring hidden workers, emphasizing the importance of recognizing potential, inclusive filtering, and cultural transformation within organizations.
hidden workers, hiring, strategies, potential, culture
false
Strategic Planning
Government & Public Sector
Pillar
Accenture
Add to my slides
Remove from favorites
The slide has a column chart showing the percentages of hidden workers who stopped applying for jobs due to discouragement from the application process.
Market Analysis and Trends
Government & Public Sector
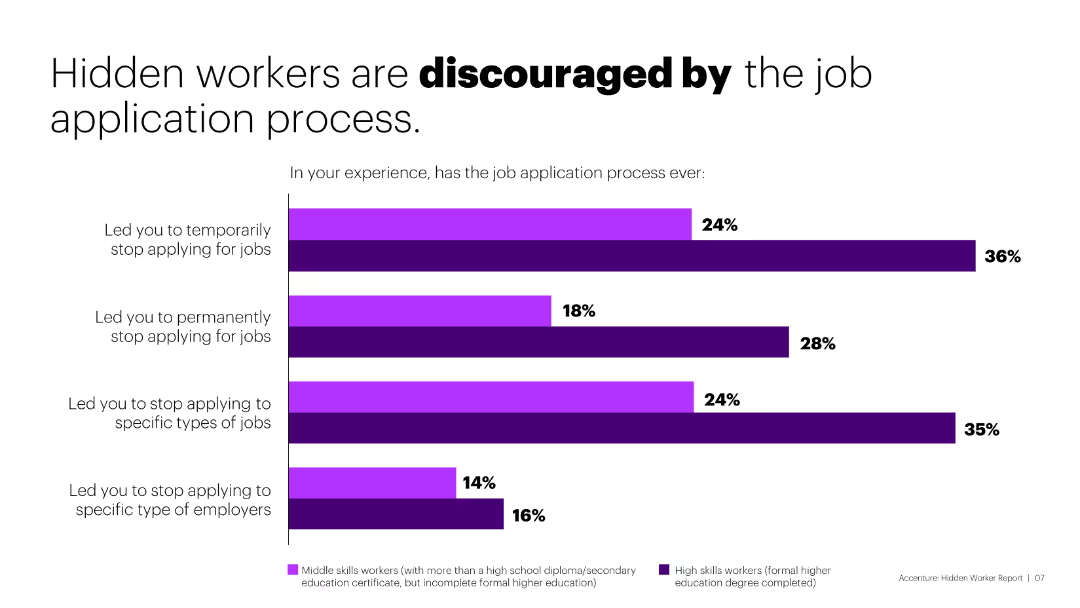
The slide illustrates that a significant number of hidden workers are discouraged by the job application process, leading to reduced job application activities.
hidden workers, job application, discouragement, analysis
false
Market Analysis and Trends
Government & Public Sector
Single Chart
Accenture
Add to my slides
Remove from favorites
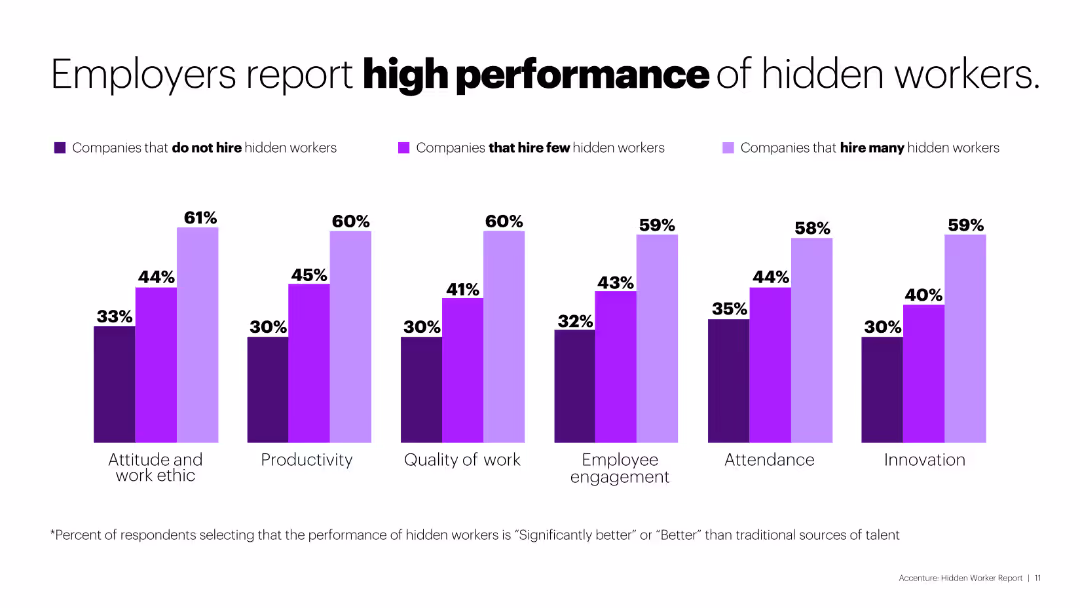
The slide contains a column chart comparing the performance metrics of hidden workers vs. non-hidden workers across several categories like productivity and innovation.
Market Analysis and Trends
Government & Public Sector
The slide demonstrates that employers report higher performance metrics for hidden workers in areas such as productivity, quality of work, and innovation, compared to non-hidden workers.
hidden workers, performance, employers, productivity, innovation
false
Market Analysis and Trends
Government & Public Sector
Multiple Chart
Accenture
Add to my slides
Remove from favorites
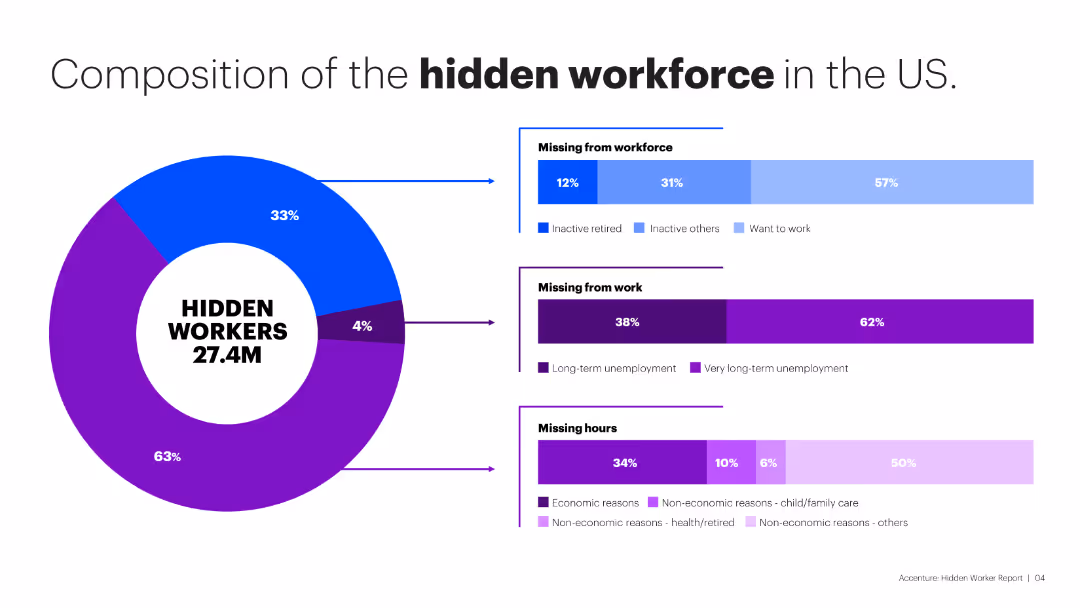
The slide features a large donut chart showing the composition of hidden workers, with smaller bar charts breaking down specific categories like missing from workforce and work.
Market Analysis and Trends
Government & Public Sector
The slide analyzes the hidden workforce in the US, highlighting that 27.4M workers are hidden due to various reasons, including long-term unemployment and family care responsibilities.
hidden workforce, US, employment, analysis, statistics
false
Market Analysis and Trends
Government & Public Sector
Multiple Chart
Accenture
Add to my slides
Remove from favorites
Previous
Next
You don't have any favorites yet.
Please wait loading your favorites slides...
Create a FREE account to continue browsing
Receive Instant Access to 1,000+ slides from companies like McKinsey, Google, and Goldman Sachs
First Name
Last Name
Email
Password
I agree to all
Terms & Privacy Policy
Thank you! Your submission has been received!
Oops! Something went wrong while submitting the form.
Have an account?
Sign in
Upgrade to PRO to Save slides
Advanced Search and Filters
Access to 15,000+ slides
Access to Category Pages
Save/Bookmark Slides
PowerPoint Template Library
Pick a Plan
MONTHLY
$12/month
Billed every month, Cancel anytime.
YEARLY
$9/year
Billed $108 annually, Cancel anytime.
Checkout for $12/month
Checkout for $108/yr
Secured by Stripe | AES-256 bit encryption


![To what extent do you think the [Country] government should increase or lower its spending... Healthcare](https://cdn.prod.website-files.com/654e70fb59937215cac87b19/6899be649bda8417478010cb_wK0gvNhEv-TDz-BhPR9Kamz5ae-Gy0jha35P_QwARWI.avif)