My Account
My Slides
Search by Category
Companies
Slide Type
Use Case
Industry
Pricing
Templates
View All Templates
Download Template Slides
✦ AI
AI Prompt Library
AI Search
Feedback
Login
Logout
Get Started
Browse all Slides
Browse all Slides
Create a FREE Account
Instant access to 1,000+ real slides from top companies like McKinsey, BCG, Goldman Sachs, Google and many more!
First Name
Last Name
Email
Password
I agree to all
Terms & Privacy Policy
Thank you! Your submission has been received!
Oops! Something went wrong while submitting the form.
Have an account?
Sign in
Saved Slides
Total No. of slides saved
0
↻ Refresh
✖ Clear all
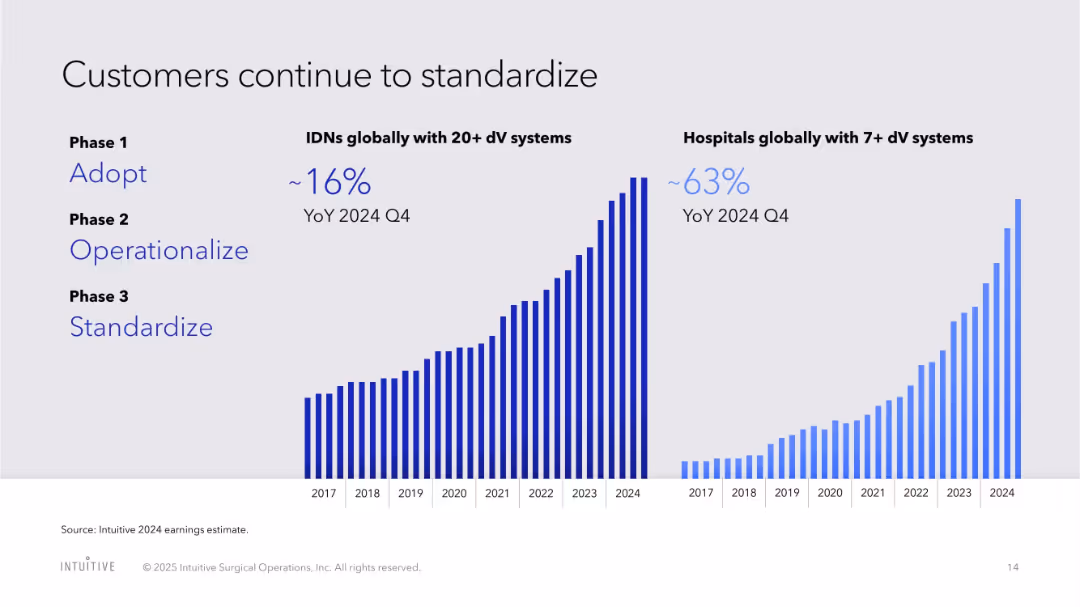
Split bar chart view with two timelines for IDNs and hospitals, showing adoption trends and standardization
Organizational Structure and Change
Healthcare & Pharmaceuticals
Tracks hospital and IDN adoption of da Vinci systems globally, segmented by deployment phases, with YoY growth highlighted.
hospital adoption, IDN, standardization, phases, growth trends, da Vinci, organizational change
false
Organizational Structure and Change
Healthcare & Pharmaceuticals
Multiple Chart
JP Morgan
Add to my slides
Remove from favorites
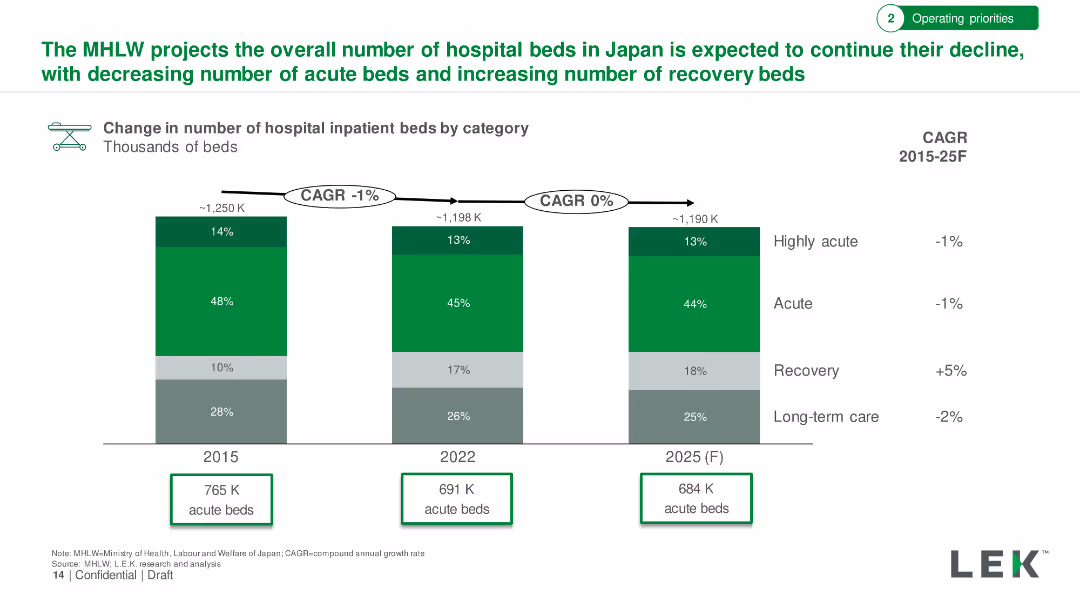
Bar chart showing change in the number of hospital inpatient beds by category from 2015 to 2025. Detailed with bed type categories and CAGR.
Market Analysis and Trends
Healthcare & Pharmaceuticals
Projection of hospital bed trends in Japan, showing a decline in acute beds and an increase in recovery beds through 2025.
Hospital Beds, Japan, Acute Beds, Recovery Beds, Projection
false
Market Analysis and Trends
Healthcare & Pharmaceuticals
Single Chart
LEK
Add to my slides
Remove from favorites
The slide features a bar chart showing the change in the number of hospital inpatient beds by category from 2015 to 2025. It includes a projection for 2025 with percentages for highly acute, acute, recovery, and long-term care beds. The chart uses green shades to distinguish categories.
Market Analysis and Trends
Healthcare & Pharmaceuticals
The slide details the projected decrease in hospital beds in Japan, with specific emphasis on the decline in acute beds and the increase in recovery beds. It highlights the compound annual growth rate (CAGR) for different categories.
hospital beds, Japan, projections, acute, recovery
false
Market Analysis and Trends
Healthcare & Pharmaceuticals
Single Chart
LEK
Add to my slides
Remove from favorites
Bar charts showing respondent mix by role, type of institution, country, and number of hospital beds.
Market Analysis and Trends
Healthcare & Pharmaceuticals
Details the demographics of hospital directors surveyed by L.E.K., including their roles, types of institutions, and geographic distribution.
hospital directors, SEA markets, survey demographics, respondent mix, healthcare
false
Market Analysis and Trends
Healthcare & Pharmaceuticals
Multiple Chart
LEK
Add to my slides
Remove from favorites
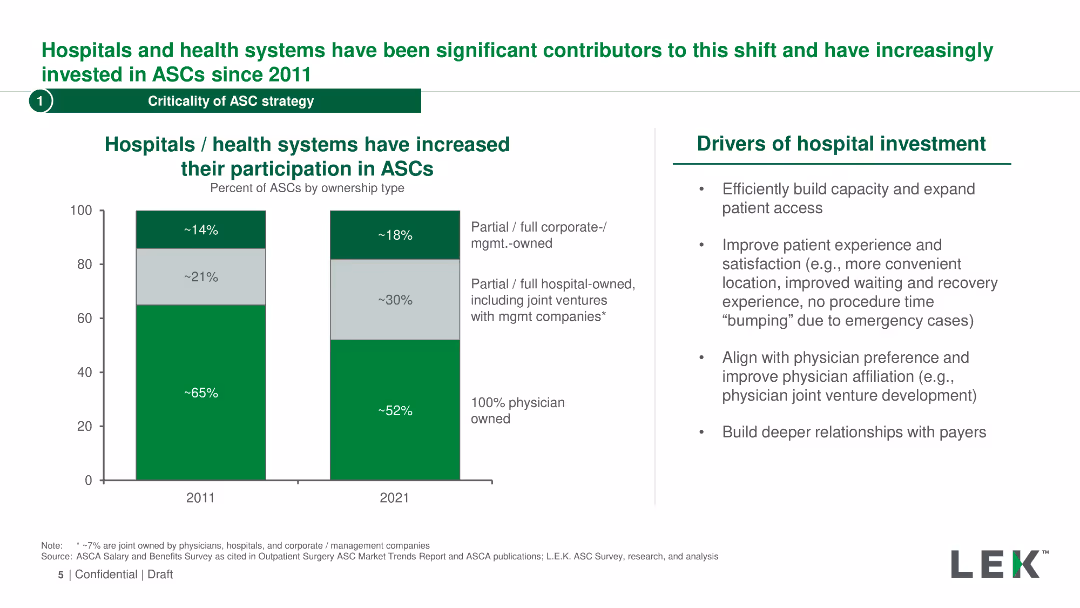
This slide includes a column chart comparing hospital and health system participation in ASCs between 2011 and 2021, with data segmented by ownership type.
Market Analysis and Trends
Healthcare & Pharmaceuticals
It examines the increase in hospital and health system participation in ASCs over a decade, highlighting drivers of investment and changes in ownership types.
hospital investment, ASCs, participation, ownership, trends, healthcare
false
Market Analysis and Trends
Healthcare & Pharmaceuticals
Mixed Chart
LEK
Add to my slides
Remove from favorites
The slide features line charts comparing restaurant reservation declines across different regions and a dotted line chart depicting recovery projections for the hospitality industry.
Market Analysis and Trends
Hospitality & Tourism
Discusses the severe short-term impacts of COVID-19 on the hospitality sector, particularly on hotels and restaurants, with projections for recovery paths and impact assessments up to 2024.
hospitality, COVID-19, restaurants, hotels, impact assessment, recovery projection, line chart
false
Market Analysis and Trends
Hospitality & Tourism
Multiple Chart
BCG
Add to my slides
Remove from favorites
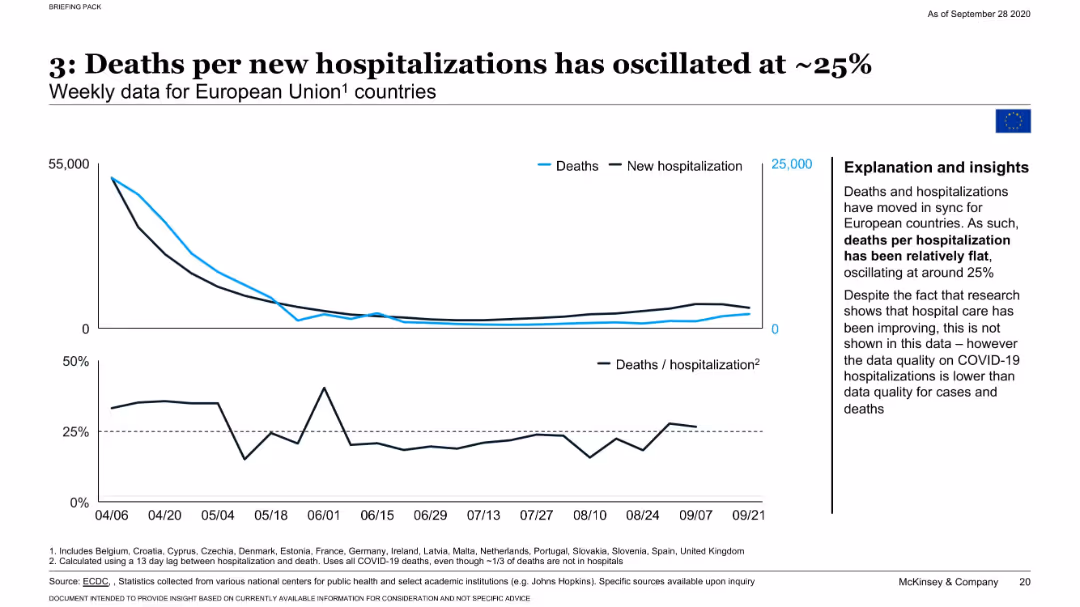
Line chart with two axes: one for death counts, another for hospitalizations; additional chart shows death/hospitalization ratio.
Performance Metrics and KPIs
Healthcare & Pharmaceuticals
Tracks weekly deaths and hospitalizations across EU countries, highlighting that death per hospitalization has remained stable around 25%. Notes limitations in hospitalization data quality and implications for evaluating treatment outcomes.
hospitalization, mortality, EU, COVID-19, health systems, McKinsey
false
Performance Metrics and KPIs
Healthcare & Pharmaceuticals
Mixed Chart
McKinsey
Add to my slides
Remove from favorites
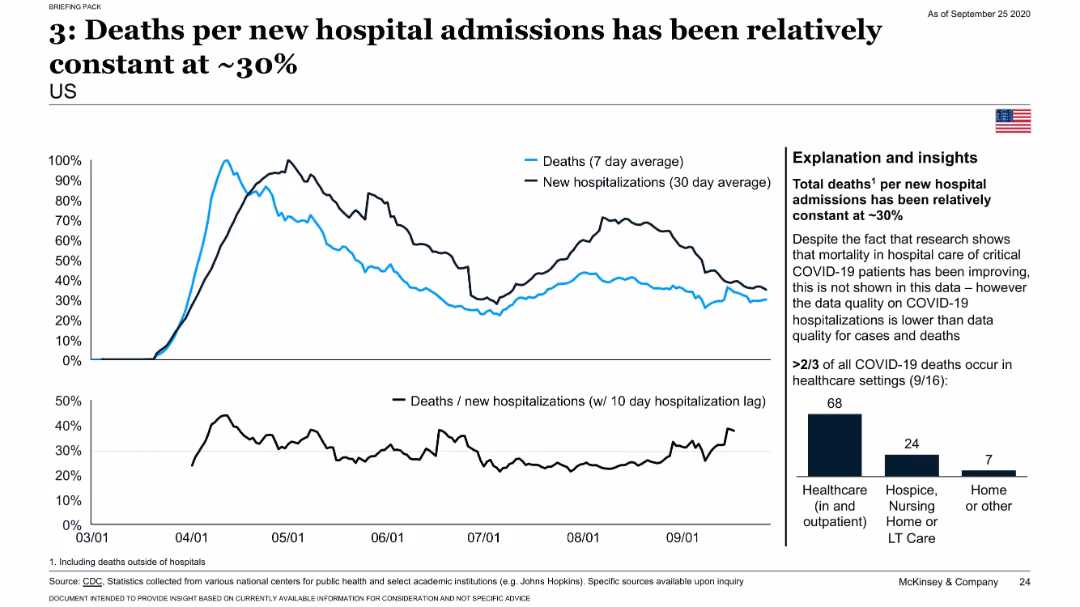
Line graphs showing trends in deaths and new hospitalizations; includes a smaller chart showing ratio of deaths to hospitalizations and a bar graph of death settings.
Risk Assessment and Management
Healthcare & Pharmaceuticals
Despite improvements in hospital care, the ratio of deaths to new hospital admissions has remained around 30%. The slide also reveals that two-thirds of COVID-19 deaths occurred in healthcare settings, emphasizing the strain on medical infrastructure.
hospitalizations, mortality rate, COVID-19, care quality, data quality
false
Risk Assessment and Management
Healthcare & Pharmaceuticals
Multiple Chart
McKinsey
Add to my slides
Remove from favorites
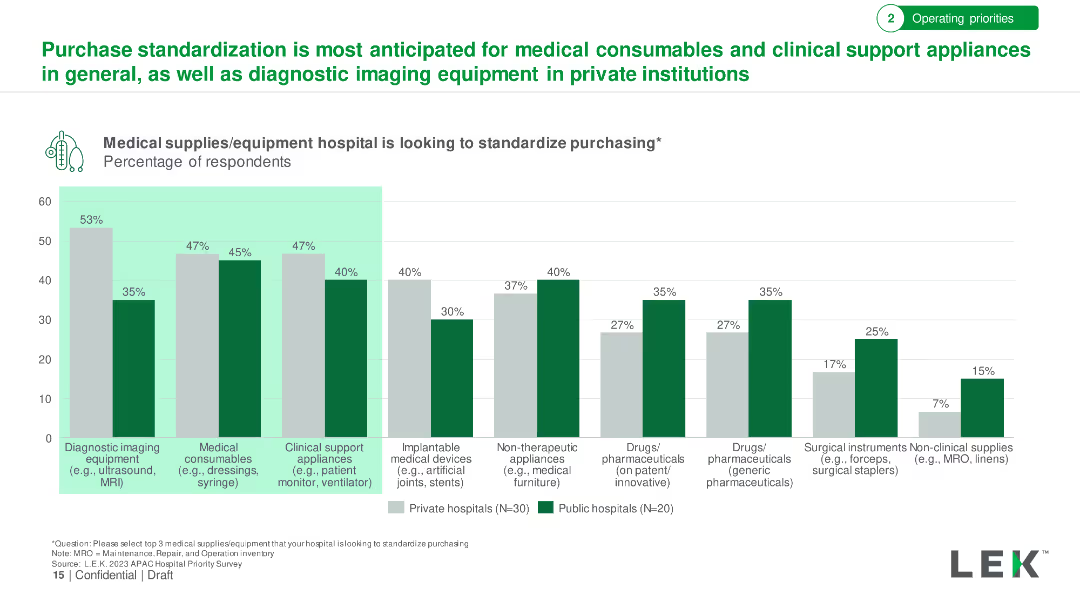
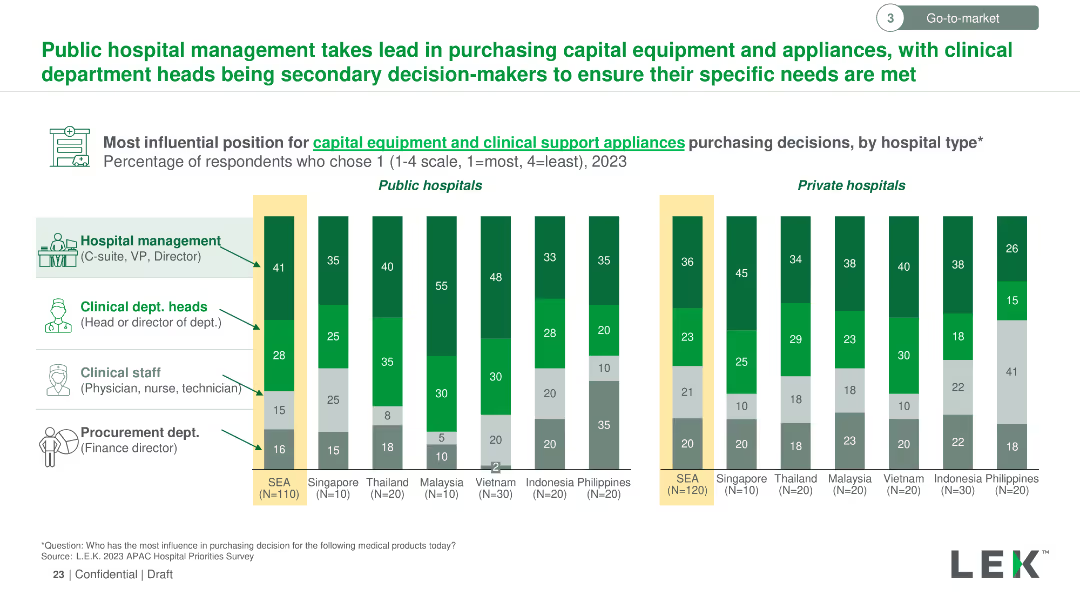
Vertical column chart comparing influential roles in public and private hospitals for purchasing decisions on capital equipment and appliances across SEA countries.
Market Analysis and Trends
Healthcare & Pharmaceuticals
Illustrates that public hospital management leads in purchasing decisions for capital equipment and appliances, with clinical department heads as secondary decision-makers.
hospital management, purchasing decisions, capital equipment, public hospitals, private hospitals, SEA
false
Market Analysis and Trends
Healthcare & Pharmaceuticals
Multiple Chart
LEK
Add to my slides
Remove from favorites
The slide contains a column chart depicting spending priorities over the next 3 years across three categories: Physical and digital infrastructure, Medical supplies and devices, and Staff.
Strategic Planning
Healthcare & Pharmaceuticals
The slide shows the expected increase in spending by hospitals in three main areas over the next three years, with a focus on innovative drugs/therapy, physician support systems, and patient-facing digital solutions.
Hospitals, spending, infrastructure, medical supplies, staff
false
Strategic Planning
Healthcare & Pharmaceuticals
Multiple Chart
LEK
Add to my slides
Remove from favorites
Column chart showing hospital survey respondent mix by country, type of hospital, and hospital size.
Market Analysis and Trends
Healthcare & Pharmaceuticals
This slide presents survey data from APAC hospital executives on various factors, including respondent roles and hospital types.
hospital, survey, APAC, healthcare, respondents
false
Market Analysis and Trends
Healthcare & Pharmaceuticals
Single Chart
LEK
Add to my slides
Remove from favorites
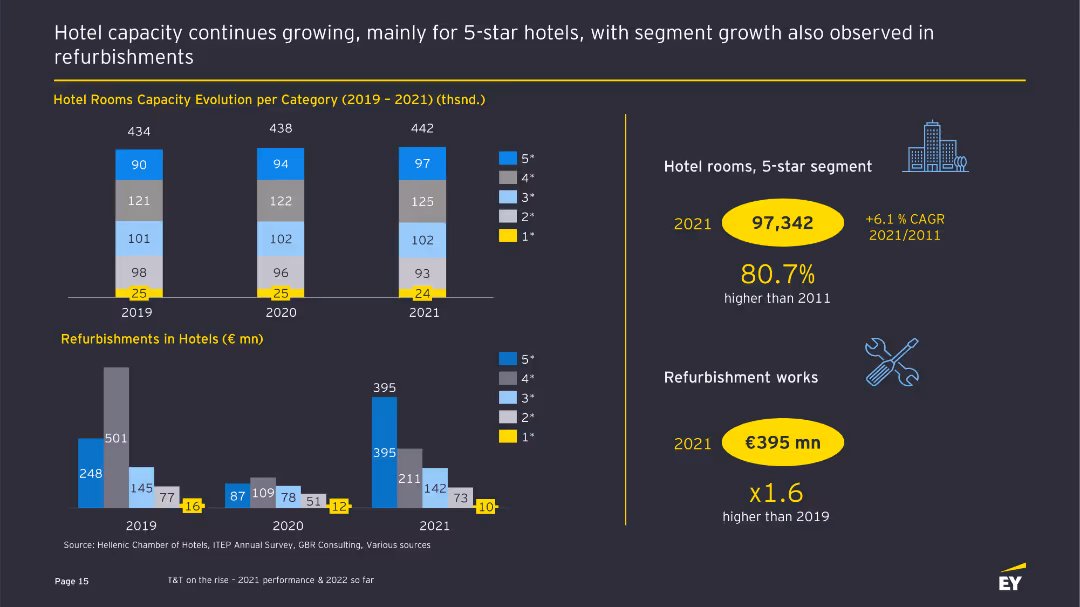
The slide features bar charts showing the evolution of hotel room capacities and refurbishments from 2019 to 2021, with text providing additional context.
Operational Efficiency
Hospitality & Tourism
This slide presents data on hotel room capacity evolution and refurbishment activities, highlighting growth in the 5-star segment and significant investments in refurbishments.
Hotel capacity, refurbishments, operational efficiency, tourism sector, bar charts
false
Operational Efficiency
Hospitality & Tourism
Multiple Chart
EY
Add to my slides
Remove from favorites
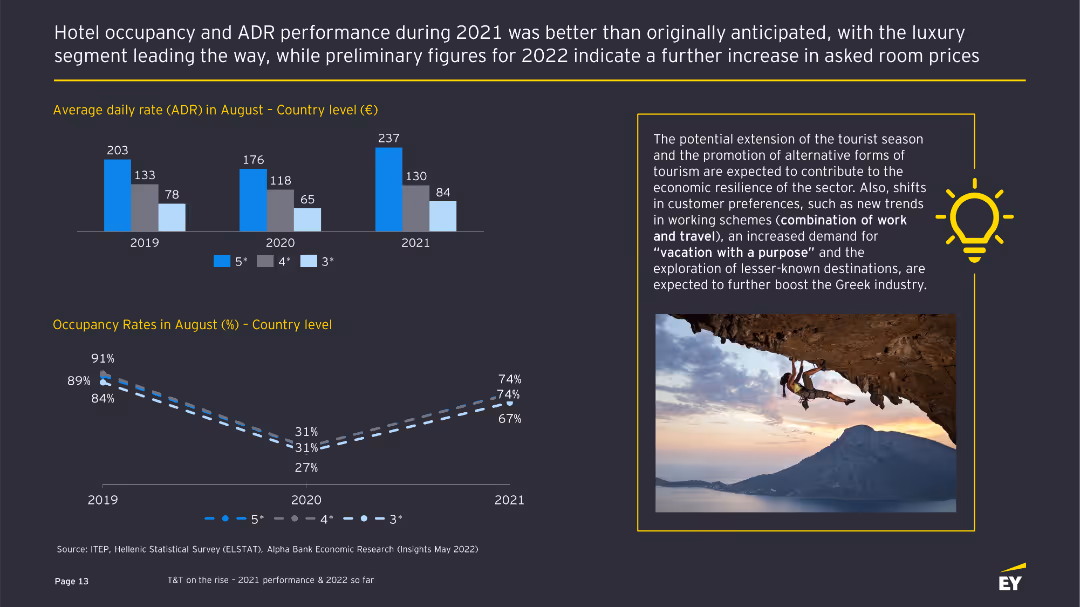
The slide includes bar charts comparing average daily rates (ADR) and occupancy rates in August across different years and hotel categories, with text summarizing insights.
Performance Metrics and KPIs
Hospitality & Tourism
This slide analyzes hotel occupancy and ADR performance, highlighting improvements and shifts in customer preferences, and the potential for alternative tourism.
Hotel occupancy, ADR, performance analysis, tourism insights, bar charts
false
Performance Metrics and KPIs
Hospitality & Tourism
Multiple Chart
EY
Add to my slides
Remove from favorites
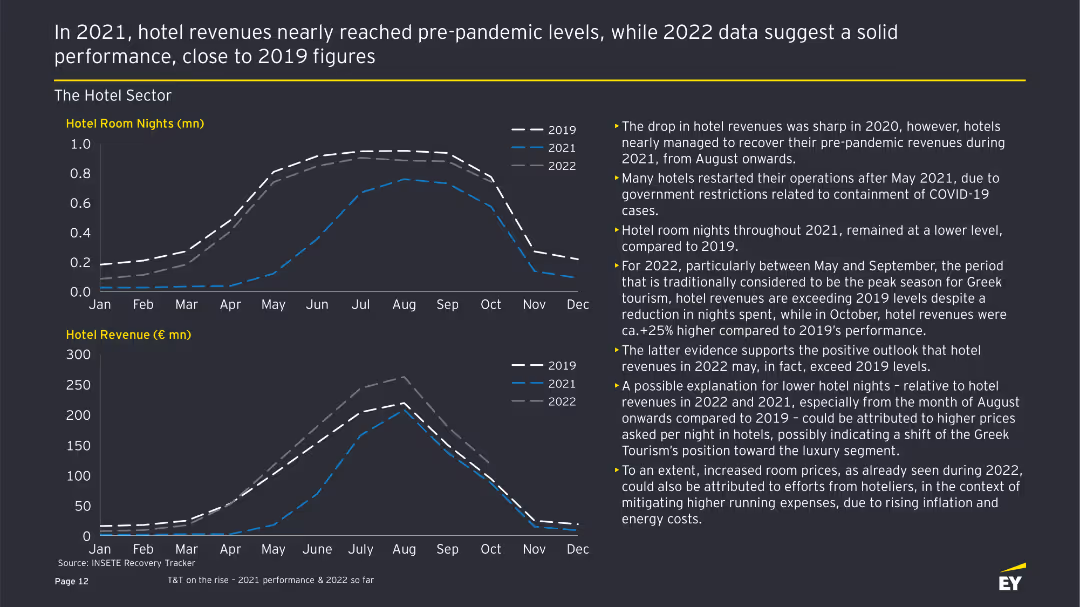
The slide features two line charts showing hotel room nights and revenue from 2019 to 2022, with accompanying text highlighting trends and performance.
Financial Performance
Hospitality & Tourism
This slide provides an analysis of the Greek hotel sector's performance, comparing room nights and revenue across different years, emphasizing recovery and growth trends.
Hotel performance, room nights, revenue analysis, financial performance, tourism trends
false
Financial Performance
Hospitality & Tourism
Multiple Chart
EY
Add to my slides
Remove from favorites
A column chart comparing the online hotels and airlines market size between 2015 and 2025 with percentages and a sidebar for description.
Market Analysis and Trends
Hospitality & Tourism
The slide focuses on the projected growth of the online hotels and airlines sector in SEA, detailing the expected market size and the market's percentage of the total travel market by 2025.
hotels, airlines, SEA, market size, growth
false
Market Analysis and Trends
Hospitality & Tourism
Mixed Chart
Bain
Add to my slides
Remove from favorites
Pie chart representing percentage of internet-using buyers, with side bar graphs detailing the triggers for offline and online buyers.
Market Analysis and Trends
Hospitality & Tourism
Comparison between offline and online buyers for hotels, emphasizing trust and payment reasons for offline purchases and multiple options online.
Hotels, Trust, Payment, Offline Buying, Online Options, Market Trends
false
Market Analysis and Trends
Hospitality & Tourism
Mixed Chart
BCG
Add to my slides
Remove from favorites
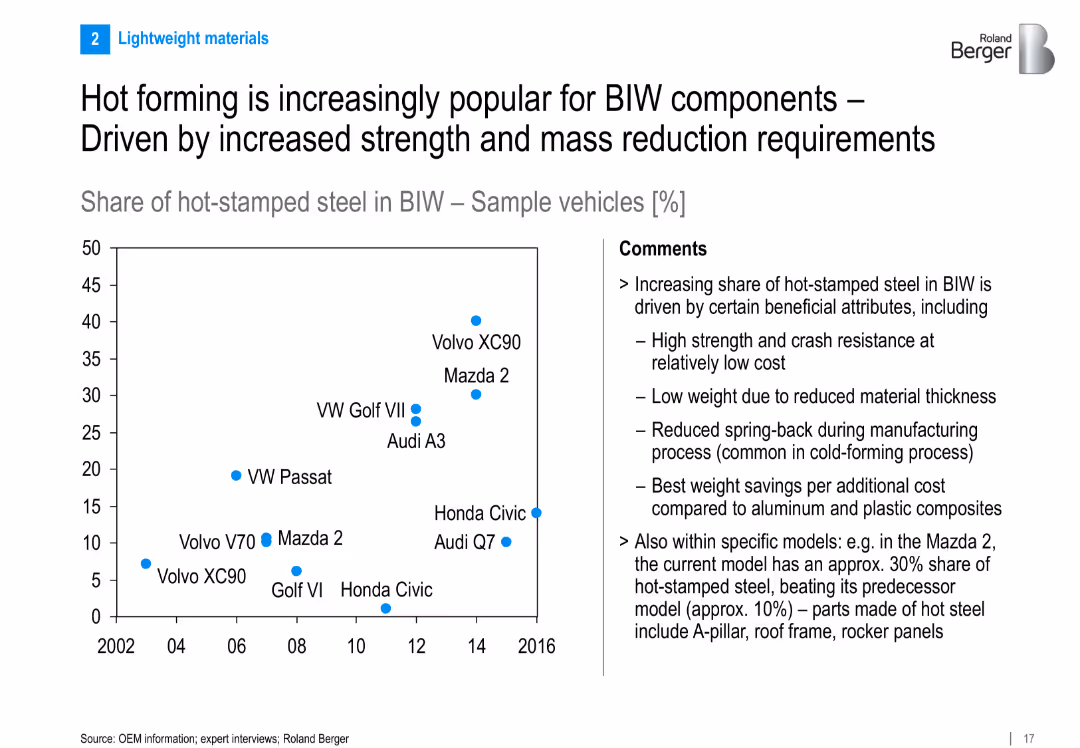
Left side: scatter plot showing hot-stamped steel share in BIW across vehicles and years; right side: comments explaining benefits; clean layout with a focus on data
Market Analysis and Trends
Industrial & Manufacturing
Shows the rising adoption of hot-stamped steel in Body-in-White (BIW) components. Benefits include strength, reduced weight, and low cost. Includes example models like Mazda 2 and Audi Q7 with increasing hot-stamp usage.
hot forming, BIW, hot-stamped steel, vehicle weight, OEMs, trend, body structure, strength, mass reduction
false
Market Analysis and Trends
Industrial & Manufacturing
Mixed Chart
Roland Berger
Add to my slides
Remove from favorites
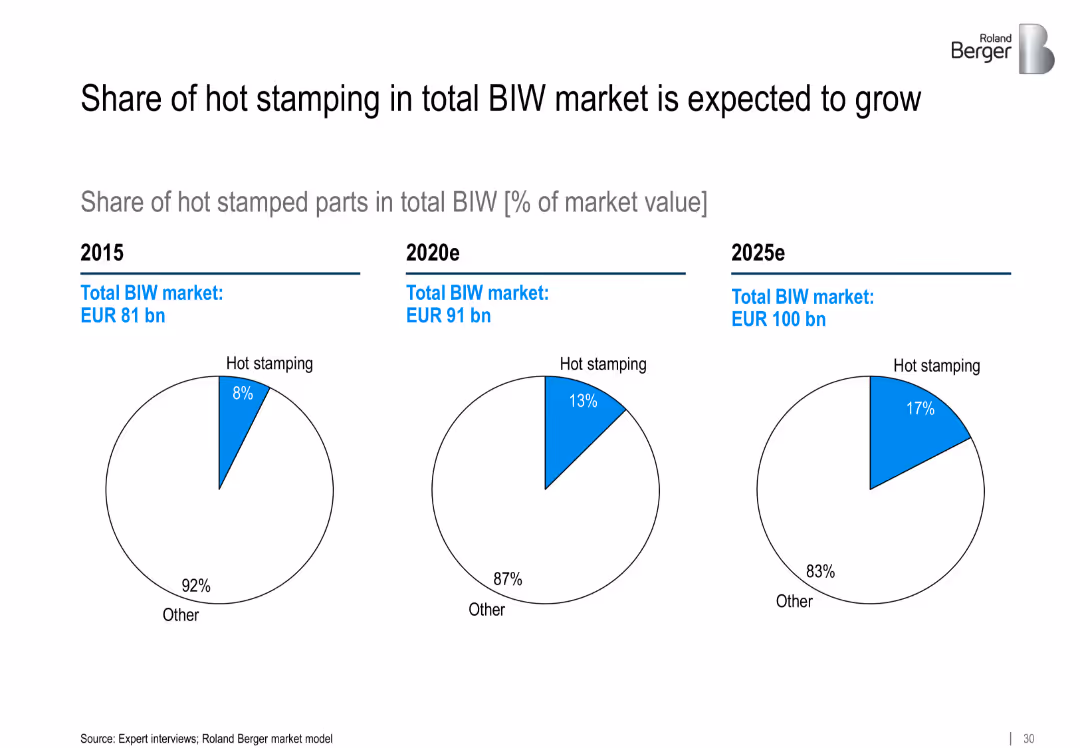
Three side-by-side pie charts (2015, 2020e, 2025e) showing hot stamping share vs. other in BIW market. Each has labeled total market value.
Market Analysis and Trends
Industrial & Manufacturing
The slide tracks the rising adoption of hot stamping in the BIW (Body-in-White) market. Forecasts show a steady increase in hot stamping share from 8% to 17% of market value by 2025.
hot stamping, BIW, automotive, steel forming, manufacturing trends, forecast, market share
false
Market Analysis and Trends
Industrial & Manufacturing
Single Chart
Roland Berger
Add to my slides
Remove from favorites
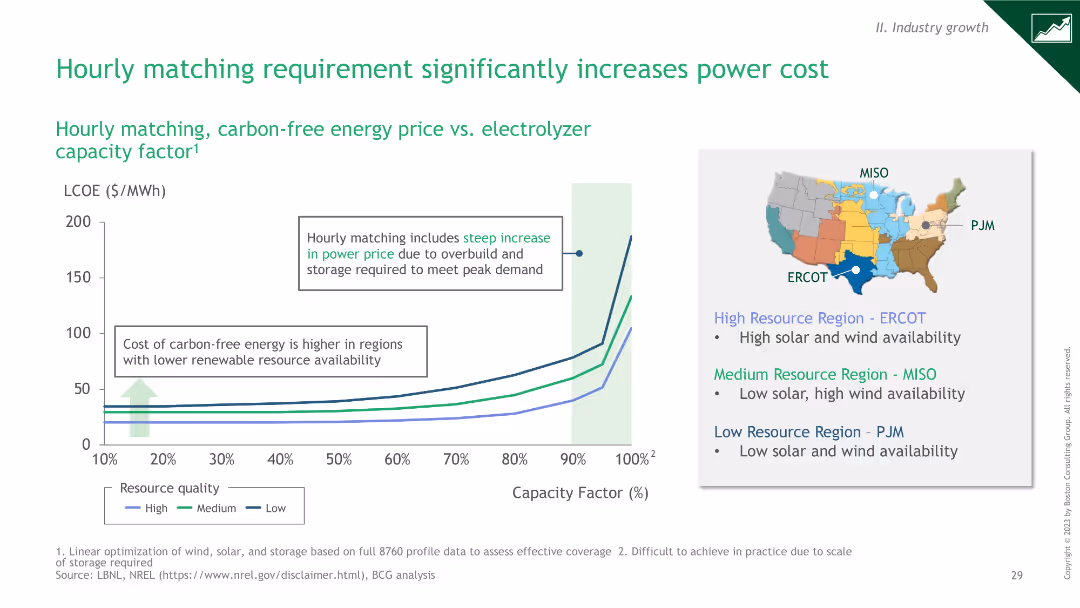
Line chart illustrating the relationship between carbon-free energy price and electrolyzer capacity factor. Includes a map showing resource quality by region (ERCOT, MISO, PJM).
Technology and Digital Transformation
Energy & Utilities
The slide details the impact of hourly matching on carbon-free energy costs versus electrolyzer capacity factor, with regional resource quality insights.
hourly matching, carbon-free energy, price, electrolyzer, capacity factor, resource quality, ERCOT, MISO, PJM
false
Technology and Digital Transformation
Energy & Utilities
Mixed Chart
BCG
Add to my slides
Remove from favorites
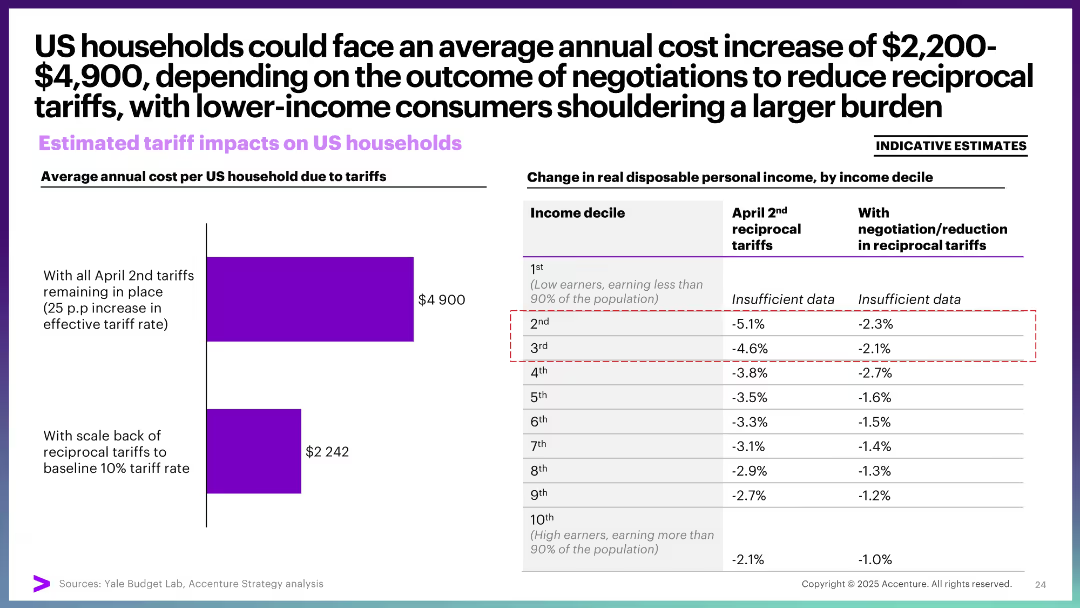
Bar chart on cost per household and a data table showing income decile impacts. Text highlights disproportionate burden on lower-income groups.
Risk Assessment and Management
Financial Services
This slide examines the annual cost burden of tariffs on US households, ranging from $2,200 to nearly $5,000. It reveals that lower-income deciles face a steeper decline in real disposable income, underlining the regressive impact of tariffs on household economics.
household cost, tariffs, income decile, disposable income, economic burden, low-income impact
false
Risk Assessment and Management
Financial Services
Mixed Chart
Accenture
Add to my slides
Remove from favorites
A column chart illustrates the value of household investments in various ranges, comparing data from 2022 and 2023.
Market Analysis and Trends
Financial Services
It shows the distribution of household investment values among Canadians, comparing figures from 2022 and 2023.
Household, Investments, Value, Canadians, 2023, 2022, Column Chart, Financial, Trends
false
Market Analysis and Trends
Financial Services
Single Chart
IPSOS
Add to my slides
Remove from favorites
The slide shows a series of vertical stack coin icons representing the value distribution of household investments.
Financial Performance
Financial Services
The slide illustrates the distribution of household investment values, ranging from under $50K to over $1M.
Household, Investments, Value, Distribution, Wealth
false
Financial Performance
Financial Services
Single Chart
IPSOS
Add to my slides
Remove from favorites
The slide presents two contrasting graphs: a line chart showing household net worth to income ratio and an area chart depicting savings buffer over time. The juxtaposition highlights shifts in economic stability.
Investment Analysis
Financial Services
This slide gives an overview of the household sector's financial health, crucial for understanding consumer behavior and potential investment risks. The net worth and savings data are pivotal for financial planning and advising within the financial services industry.
Household, Net Worth, Savings, Finance
false
Investment Analysis
Financial Services
Multiple Chart
Morgan Stanley
Add to my slides
Remove from favorites
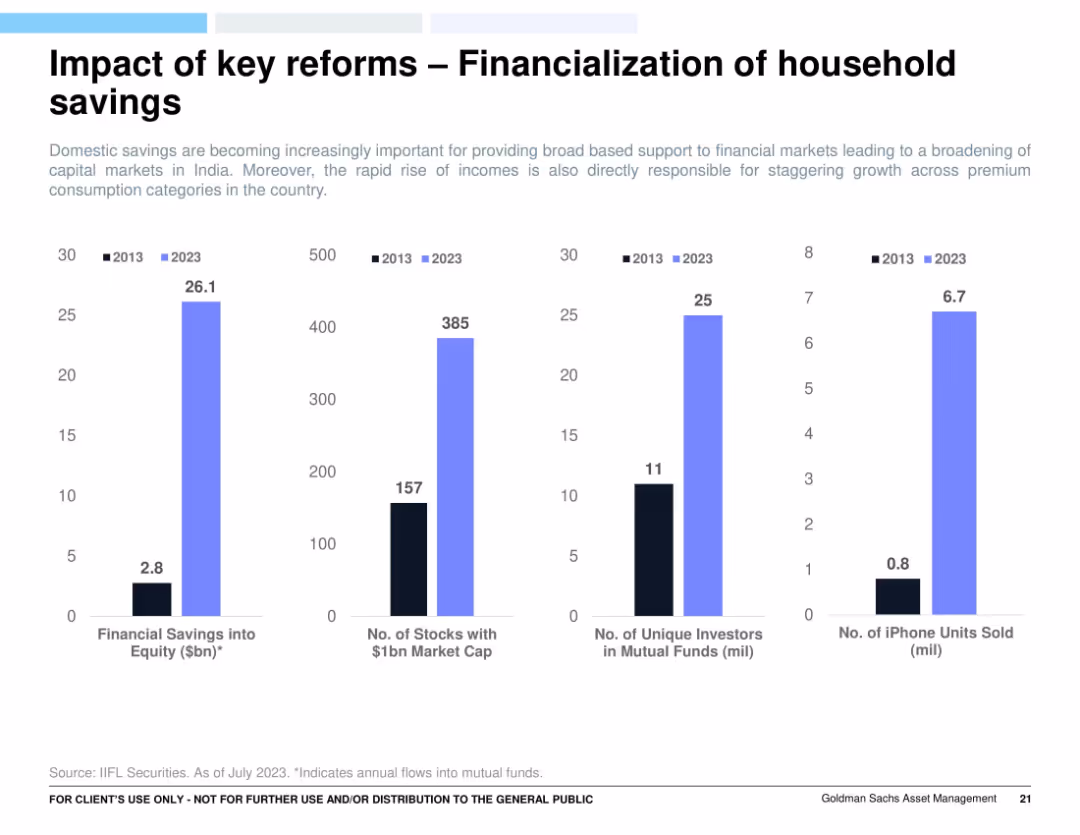
Four vertical bar charts comparing 2013 vs 2023: financial equity savings, stock market cap, mutual fund investors, and iPhone sales. Light blue and black bars on white background.
Market Analysis and Trends
Financial Services
Demonstrates the impact of financial reforms on India’s household behavior over a decade. Notable increases in equity savings, market cap stocks, mutual fund participation, and iPhone sales suggest a rapidly evolving and increasingly affluent and financially literate population.
household savings, equity investment, India reforms, financial inclusion, mutual funds, consumer behavior
false
Market Analysis and Trends
Financial Services
Multiple Chart
Goldman Sachs
Add to my slides
Remove from favorites
This slide presents a series of line charts depicting household savings dynamics in the US, EU, and UK, along with commentary. Each chart shows the actual savings rate, model-predicted trend savings rate, and cumulative excess savings.
Risk Assessment and Management
Financial Services
The slide discusses household savings dynamics, indicating that US consumers are depleting excess savings accrued during the pandemic. It forecasts savings trends and highlights differences between US and European savings behaviors, suggesting cautious consumer spending in the future.
household savings, US, EU, UK, dynamics, forecast
false
Risk Assessment and Management
Financial Services
Multiple Chart
Accenture
Add to my slides
Remove from favorites
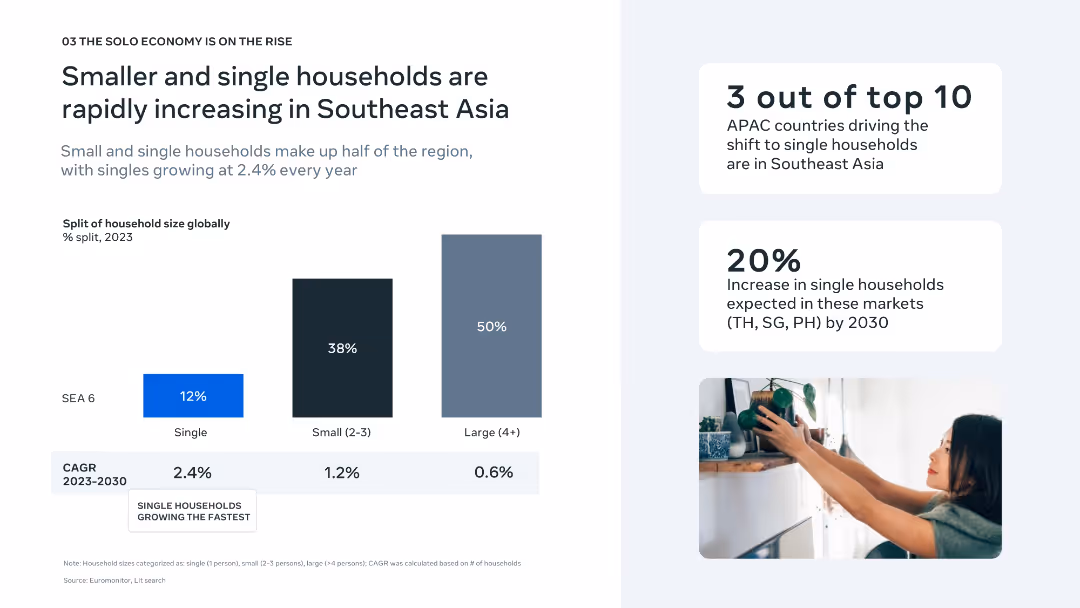
Left-aligned bar chart comparing household sizes and growth rates; stat callouts on right with minimal visuals.
Market Analysis and Trends
Consumer Goods
This slide highlights the rising trend of single-person and small households in Southeast Asia, noting a 2.4% CAGR growth in singles. It also states that SEA includes three of the top 10 APAC countries shifting toward solo households.
household trends, single households, SEA, demographics, CAGR, market shift, APAC, solo economy, urbanization, living patterns
false
Market Analysis and Trends
Consumer Goods
Mixed Chart
Bain
Add to my slides
Remove from favorites
The slide depicts a set of bell curves representing household income distribution over decades, with a threshold line for quality education affordability.
Market Analysis and Trends
Education & Training
Analyzes how rising household wealth affects the affordability and demand for private education, with implications for market growth.
household wealth, education affordability, market trends, private education, income distribution, quality education, market analysis
false
Market Analysis and Trends
Education & Training
Single Chart
EY
Add to my slides
Remove from favorites
A stacked column chart showing household wealth distribution by asset type and a column chart showing the average household savings rate by region.
Market Analysis and Trends
Financial Services
The slide provides a comparison of household wealth distribution by asset type across different countries and the average household savings rates in Asia versus other regions.
household wealth, savings rate, asset type, financial comparison, regions, economic trends, Asia, global, wealth distribution, financial insights
false
Market Analysis and Trends
Financial Services
Multiple Chart
JP Morgan
Add to my slides
Remove from favorites
The slide includes two line charts, one showing nominal house prices indexed to 2015 for various countries and another showing household debt as a percentage of GDP.
Market Analysis and Trends
Financial Services
This slide presents data on house price trends and household debt levels, providing insights into consumer balance sheets and potential economic vulnerabilities.
House prices, household debt, consumer balance sheets, economic trends, GDP
false
Market Analysis and Trends
Financial Services
Multiple Chart
JP Morgan
Add to my slides
Remove from favorites
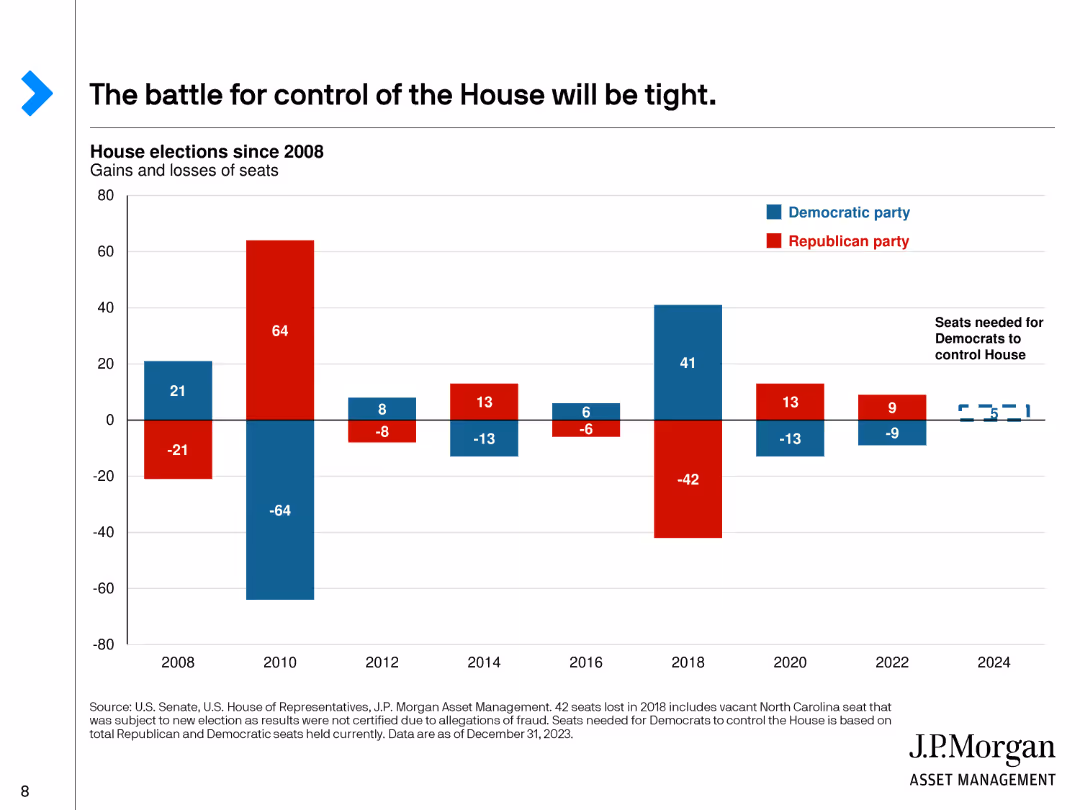
This slide features a bar chart showing the gains and losses of seats in the House of Representatives by party since 2008, with red for Republicans and blue for Democrats.
Market Analysis and Trends
Government & Public Sector
Discusses the competitive nature of the House of Representatives elections, showing historical gains and losses for each party and the current balance of power.
House, Representatives, Elections, Gains, Losses
false
Market Analysis and Trends
Government & Public Sector
Single Chart
JP Morgan
Add to my slides
Remove from favorites
Two line charts side by side, showing US home sales and housing inventories. Uses color coding to differentiate new and existing home sales.
Market Analysis and Trends
Real Estate & Construction
Reviews trends in US home sales and housing inventories, providing insights into the housing market dynamics and inventory levels.
housing, activity, inventories, US, sales
false
Market Analysis and Trends
Real Estate & Construction
Multiple Chart
JP Morgan
Add to my slides
Remove from favorites
The slide includes line charts comparing housing affordability in the US, UK, and EU, US CMBS delinquency rates, and NPL rates on commercial mortgages in Europe.
Market Analysis and Trends
Real Estate & Construction
The slide examines the impact of housing affordability issues and rising delinquency rates on the broader economy, highlighting trends in the US, UK, and EU.
housing affordability, CMBS, NPL rates, economy, real estate
false
Market Analysis and Trends
Real Estate & Construction
Multiple Chart
Accenture
Add to my slides
Remove from favorites
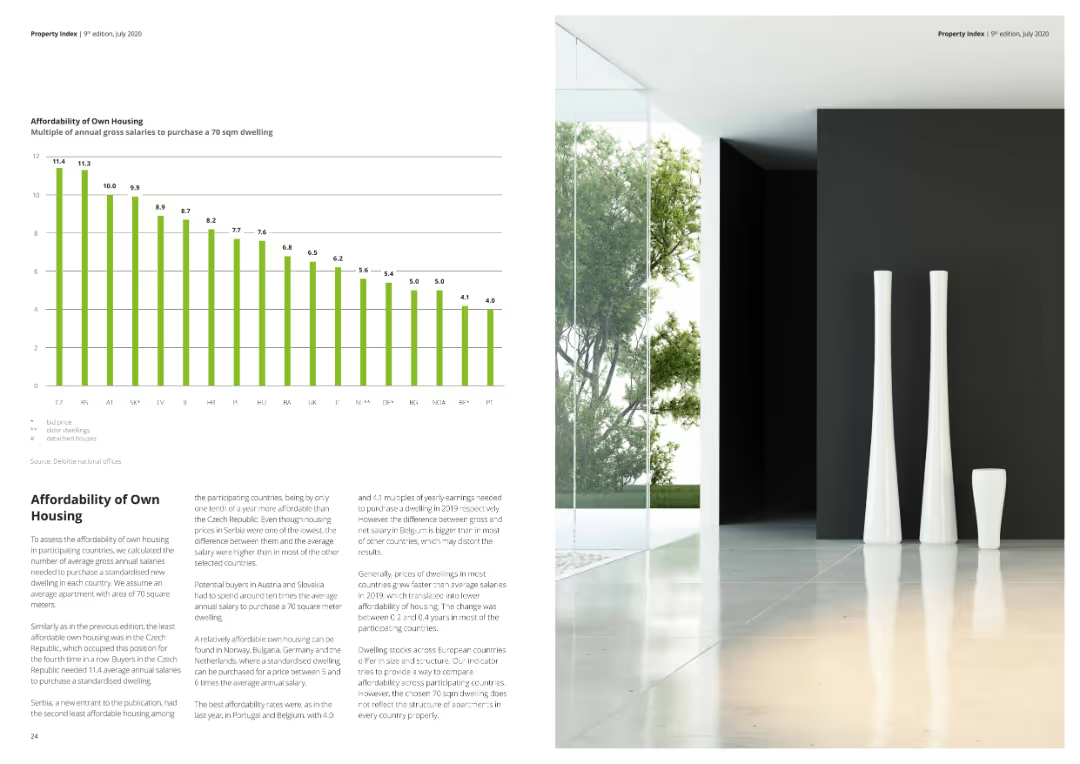
A column chart depicting the multiples of annual gross salaries required to purchase a 70 sqm dwelling.
Market Analysis and Trends
Real Estate & Construction
This slide assesses housing affordability by showing how many annual gross salaries are needed to purchase a standard-sized dwelling.
housing affordability, gross salaries, dwelling, market analysis, real estate, affordability index
false
Market Analysis and Trends
Real Estate & Construction
Mixed Chart
Deloitte
Add to my slides
Remove from favorites
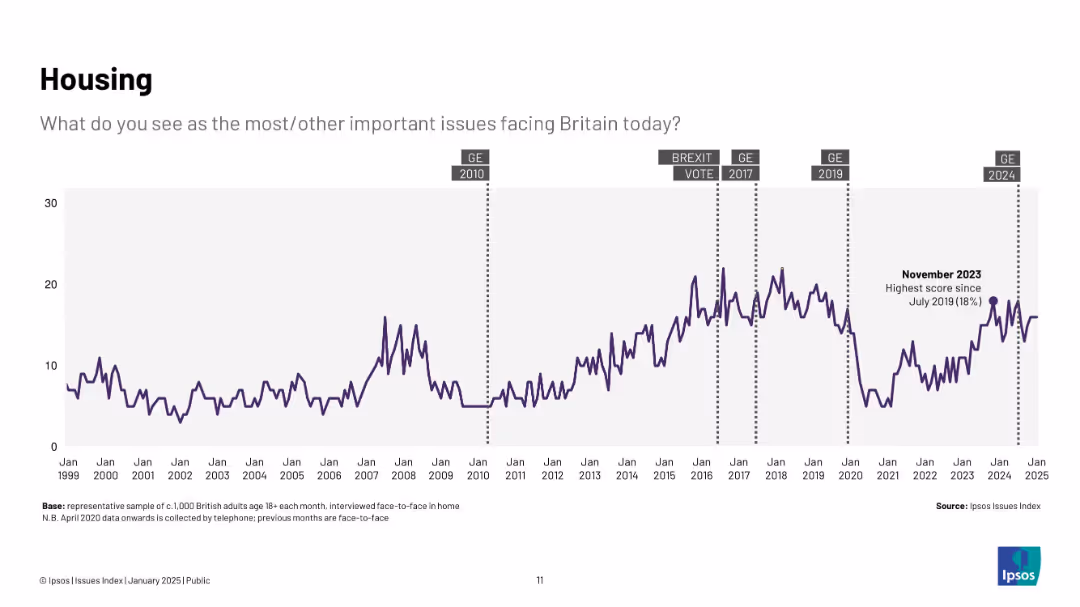
Longitudinal line graph from 1999–2025 with markers for political events (e.g., Brexit, general elections); one peak noted in Nov 2023 at 18%.
Market Analysis and Trends
Real Estate & Construction
Tracks public concern over housing issues across two decades, peaking during various political and economic shifts, with a notable spike in late 2023.
housing, affordability, UK, issues index, public opinion, trends, Brexit, elections
false
Market Analysis and Trends
Real Estate & Construction
Single Chart
IPSOS
Add to my slides
Remove from favorites
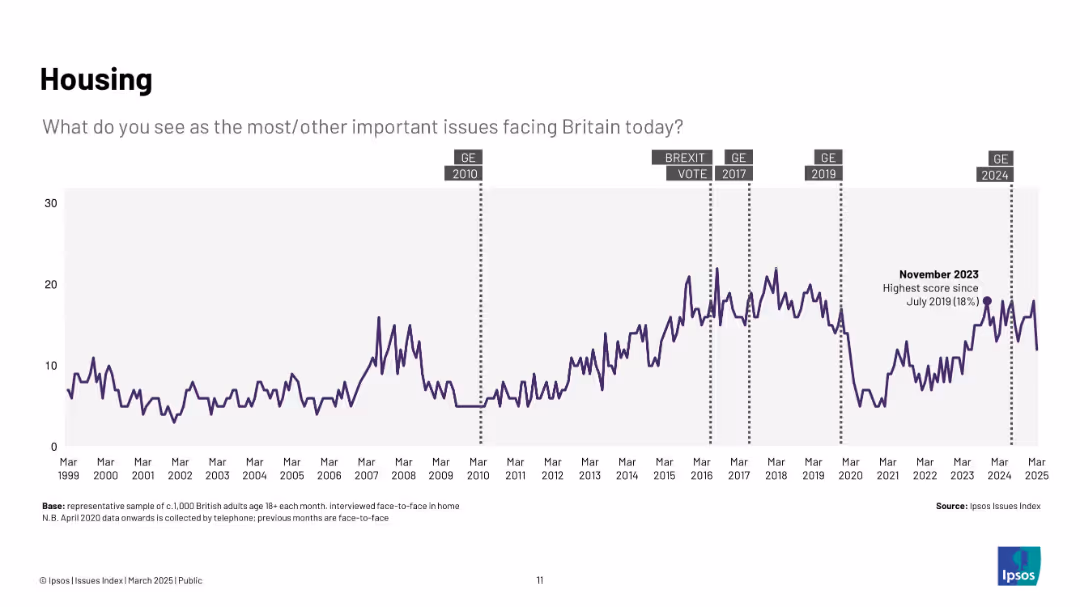
Purple line chart (1999–2025) showing rising concern about housing, peaking in late 2023; includes annotations for general elections and Brexit.
Market Analysis and Trends
Real Estate & Construction
Shows long-term increase in concern about housing, with recent spikes indicating growing pressure on affordability and availability. Peaks are tied to economic and political milestones.
housing, affordability, UK, public opinion, Ipsos, construction, real estate, elections
false
Market Analysis and Trends
Real Estate & Construction
Single Chart
IPSOS
Add to my slides
Remove from favorites
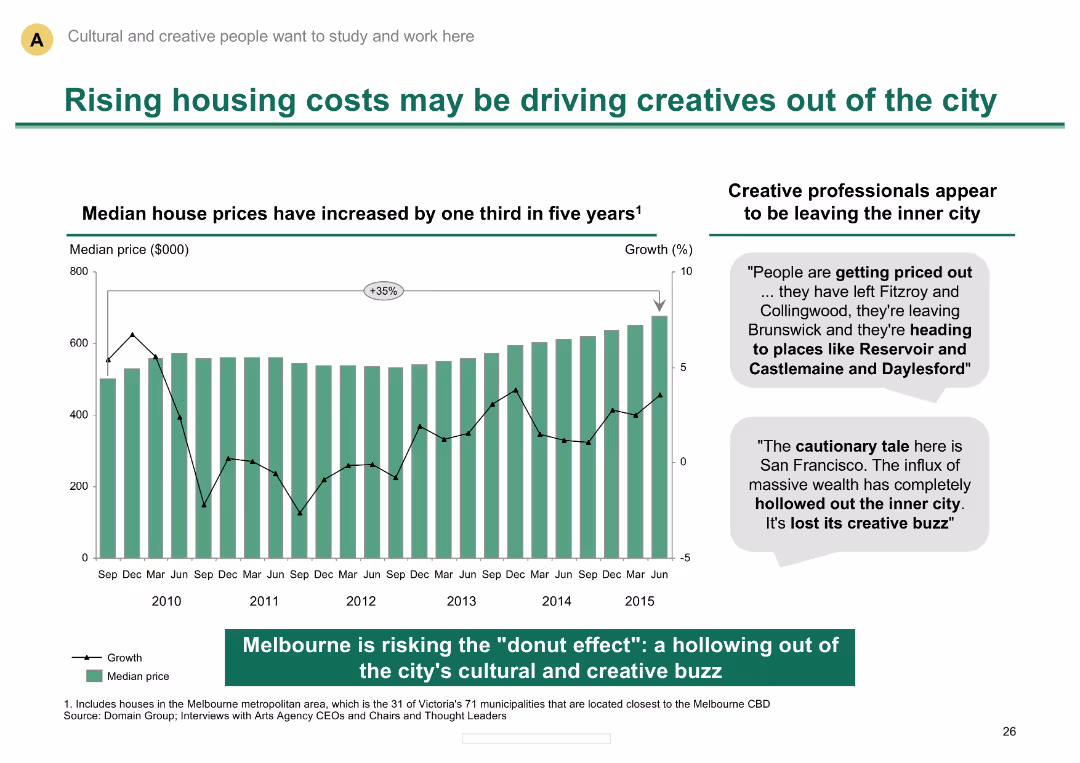
Column chart showing rise in median house prices; text describing impact on creative professionals
Market Analysis and Trends
Real Estate & Construction
Discusses the impact of rising housing costs on creative professionals in Melbourne, highlighting migration trends
Housing costs, creative professionals, real estate trends, Melbourne, urban migration, median house prices
false
Market Analysis and Trends
Real Estate & Construction
Mixed Chart
BCG
Add to my slides
Remove from favorites
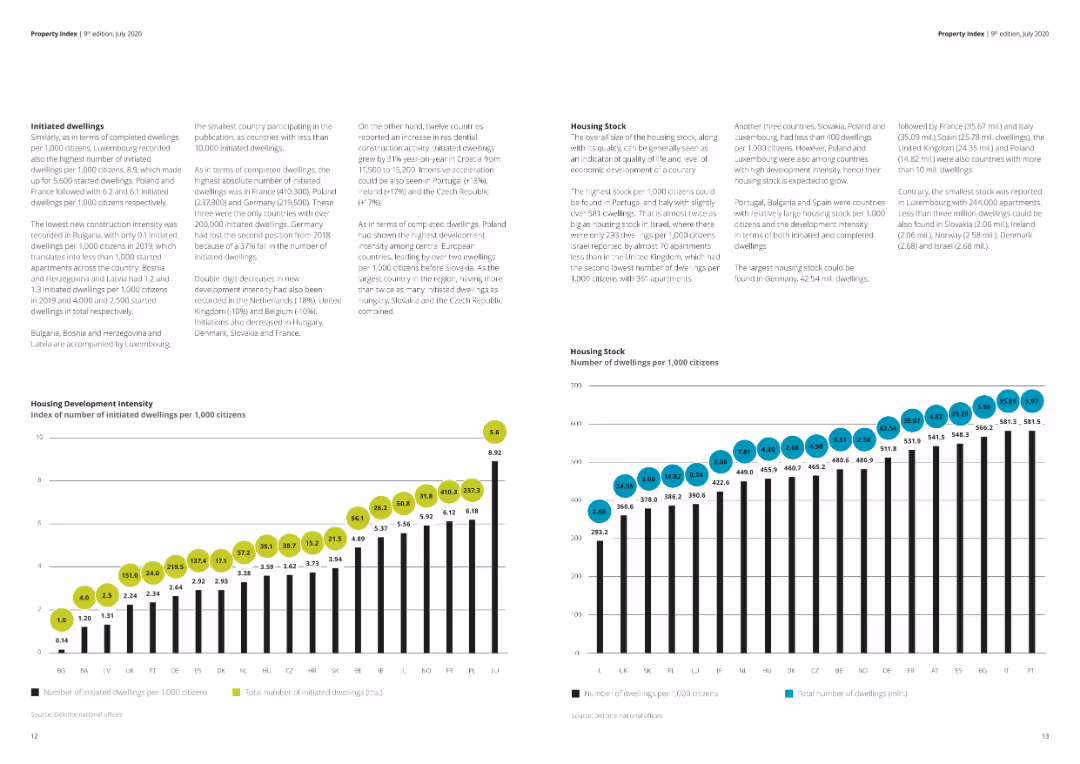
The slide contains two column charts showing the number of initiated and completed dwellings per 1,000 citizens across various European countries. Visual elements are detailed and data-dense, suitable for specific audience groups. Complexity is advanced.
Market Analysis and Trends
Real Estate & Construction
Provides detailed insights into housing development trends in Europe, highlighting the number of initiated and completed dwellings. This slide is valuable for analyzing construction trends and regional differences in housing market activity.
Housing, development, initiated, completed, dwellings, Europe
false
Market Analysis and Trends
Real Estate & Construction
Multiple Chart
Deloitte
Add to my slides
Remove from favorites
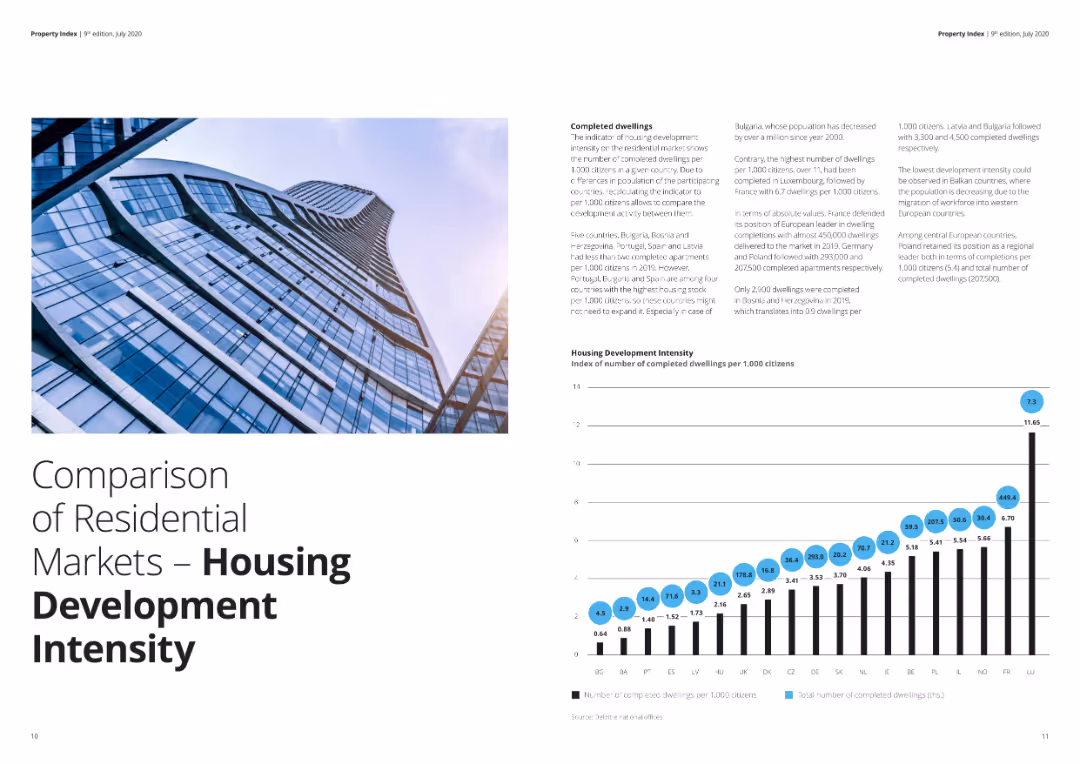
The slide includes a column chart comparing the housing development intensity across various European countries, along with accompanying text. Visual elements are moderately complex with clear labeling and distinct color coding.
Market Analysis and Trends
Real Estate & Construction
This slide compares the intensity of residential housing development in different European countries, measured by the number of completed dwellings per 1,000 citizens. It's useful for analyzing housing market trends and regional development.
Housing, development, residential, market, Europe, intensity
false
Market Analysis and Trends
Real Estate & Construction
Mixed Chart
Deloitte
Add to my slides
Remove from favorites
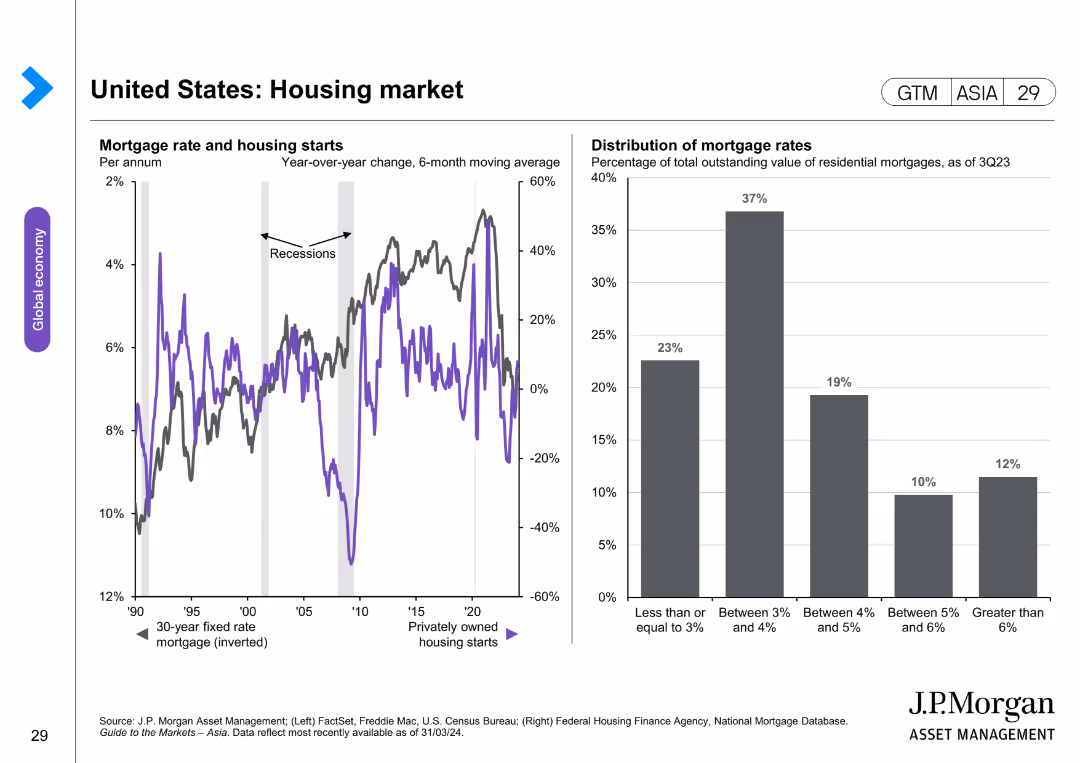
The slide has two charts: a line chart showing mortgage rates and housing starts, and a column chart showing the distribution of mortgage rates. The layout is detailed.
Market Analysis and Trends
Real Estate & Construction
This slide analyzes the housing market by examining mortgage rates and housing starts, along with the distribution of current mortgage rates across various ranges.
housing market, mortgage rates, housing starts, market analysis, real estate trends
false
Market Analysis and Trends
Real Estate & Construction
Multiple Chart
JP Morgan
Add to my slides
Remove from favorites
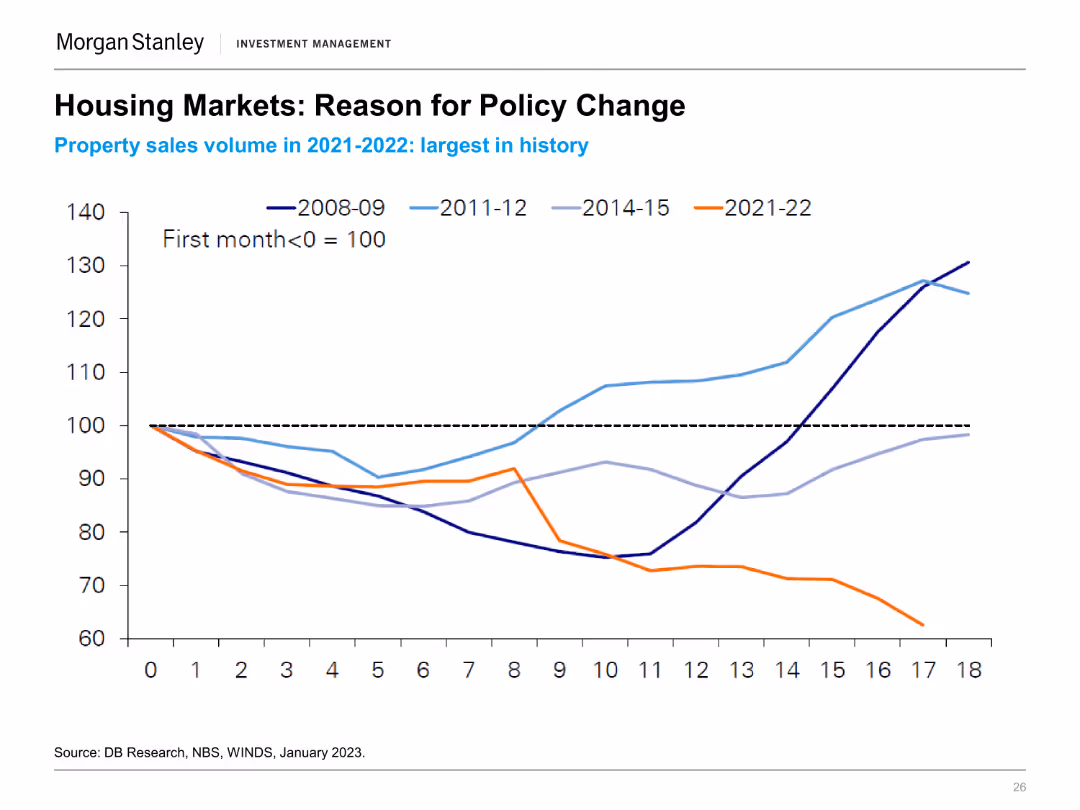
A line chart showing property sales volume (first month = 100) from 2008-09, 2011-12, 2014-15, and 2021-22, indicating historical comparisons and trends.
Regulatory and Compliance
Real Estate & Construction
The slide provides insights into China's housing market policy changes driven by the largest property sales volumes in recent history, comparing past cycles.
Housing Market, Policy Change, Property Sales, China, Historical Trends
false
Regulatory and Compliance
Real Estate & Construction
Single Chart
Morgan Stanley
Add to my slides
Remove from favorites
The slide shows a line graph of TRREB sales and new listings, indicating market recovery trends.
Market Analysis and Trends
Real Estate & Construction
It analyzes the recovery of the housing market, comparing sales and new listings data post-pandemic.
Housing market, recovery, TRREB, sales, new listings, post-pandemic, data, analysis, trends, line graph
false
Market Analysis and Trends
Real Estate & Construction
Single Chart
IPSOS
Add to my slides
Remove from favorites
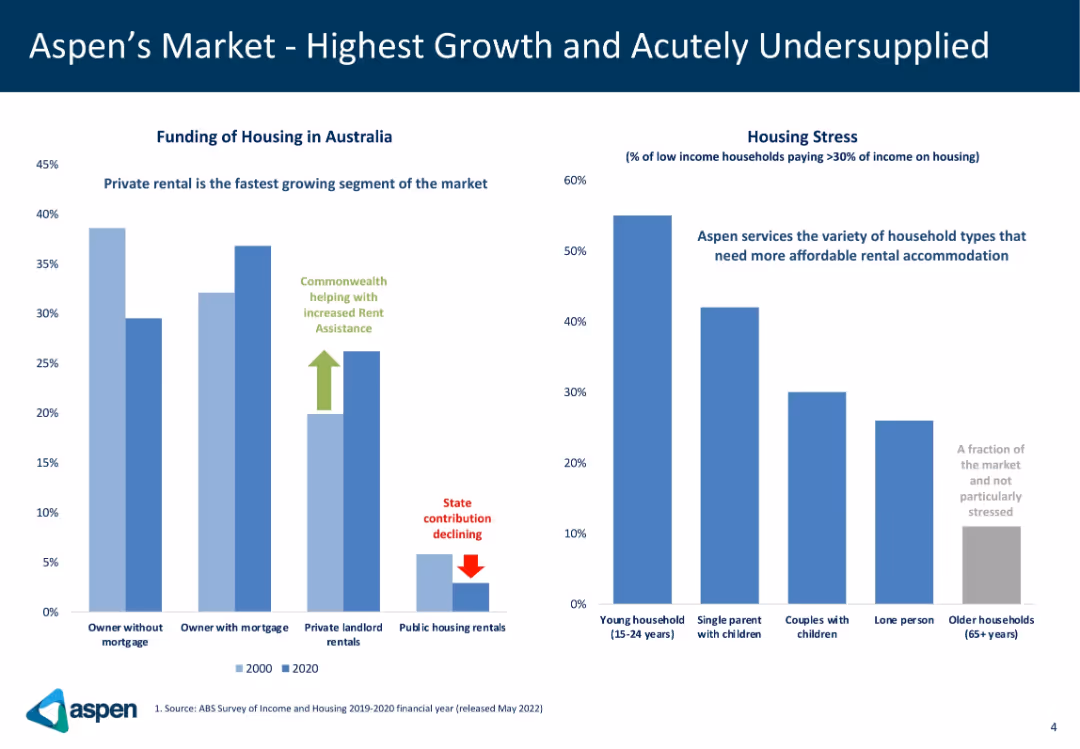
Two-bar chart panels: one showing funding sources for housing in Australia (2000 vs 2020), another showing housing stress by demographic. Simple style with labeled insights.
Market Analysis and Trends
Real Estate & Construction
This slide highlights trends in Australian housing market funding and housing stress levels. It shows a shift toward private rental markets, declining public housing support, and identifies demographics experiencing the most stress. Aspen targets underserved but high-demand housing segments.
housing stress, Australia, rental market, demographics, public housing
false
Market Analysis and Trends
Real Estate & Construction
Multiple Chart
Goldman Sachs
Add to my slides
Remove from favorites
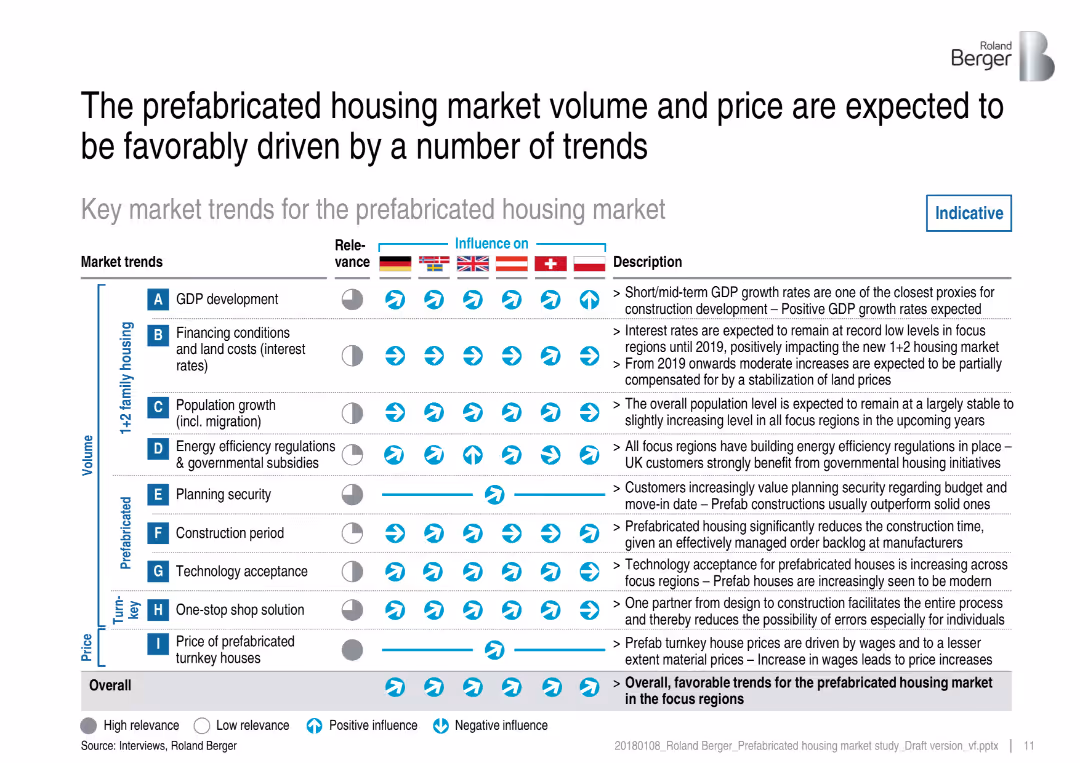
Matrix-style chart with rows of market trends and columns representing different countries, showing trend influences via arrow symbols.
Market Analysis and Trends
Real Estate & Construction
This slide identifies and categorizes key macro and microeconomic trends driving the prefabricated housing market. It includes GDP, land costs, energy regulations, and consumer behavior, mapping their influence across countries with visual indicators.
housing trends, market drivers, prefabrication, regulations, GDP, interest rates, energy efficiency, country comparison, Roland Berger
false
Market Analysis and Trends
Real Estate & Construction
Table
Roland Berger
Add to my slides
Remove from favorites
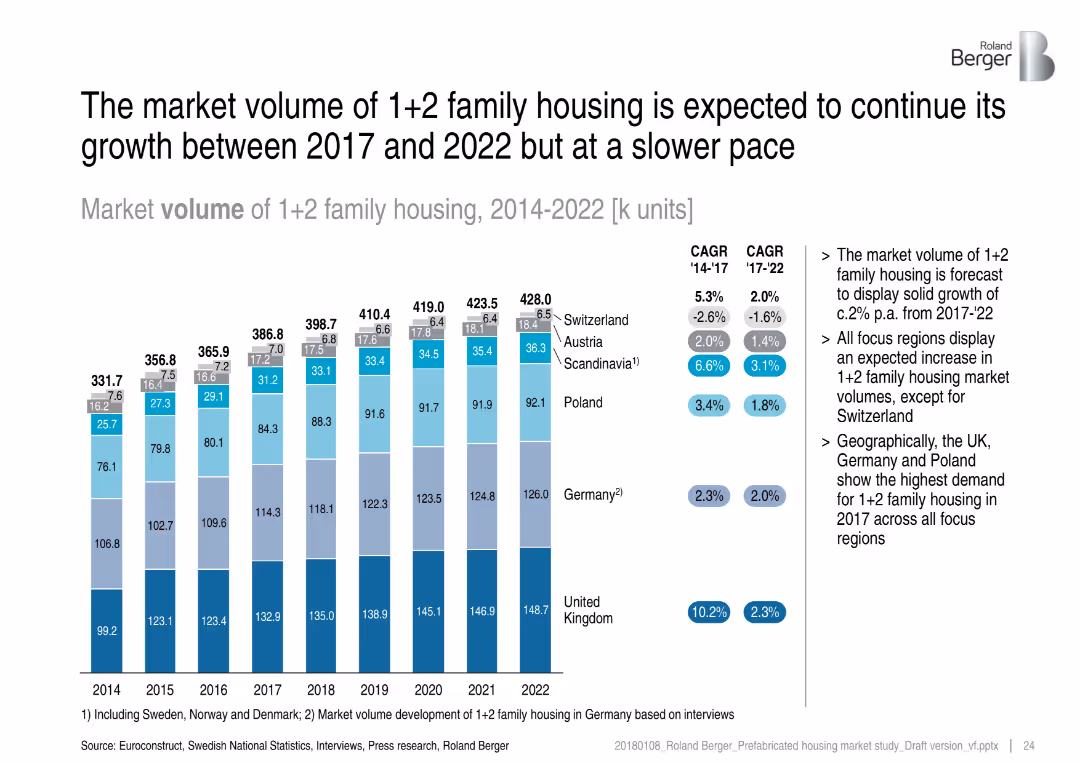
Vertical stacked bar chart showing housing volume from 2014–2022 across countries, with CAGR highlights.
Market Analysis and Trends
Real Estate & Construction
This slide displays the historical and forecasted volume of 1+2 family housing, with annual breakdowns per region. It shows sustained growth with varying rates, noting that Switzerland lags behind while Germany and UK show stronger demand.
housing volume, family housing, market growth, construction demand, annual trend, forecast, CAGR
false
Market Analysis and Trends
Real Estate & Construction
Mixed Chart
Roland Berger
Add to my slides
Remove from favorites
This slide contains pie charts showing the high percentage of HR leaders and employees who agree that companies should offer the best benefits and need to improve support, maintaining a consistent sentiment over three years.
Human Resources and Talent Management
Financial Services
Reflects the strong agreement among HR leaders and employees about the need for improved employer support and benefits, crucial for strategic HR planning.
HR Agreement, Employee Benefits, Employer Support, Pie Charts, Strategic Planning
false
Human Resources and Talent Management
Financial Services
Single Chart
Goldman Sachs
Add to my slides
Remove from favorites
Donut chart showing 13% usage of HR analytics software across different sectors, with accompanying bar charts detailing sector-specific usage percentages.
Human Resources and Talent Management
Professional Services
Slide shows adoption rates of HR analytics software in various sectors, indicating low usage overall but higher in sectors like banking and pharma.
HR analytics, software usage, sectors, donut chart, bar chart
false
Human Resources and Talent Management
Professional Services
Multiple Chart
PwC/Strategy&
Add to my slides
Remove from favorites
A horizontal bar chart listing factors negatively affecting HR function, highlighting the top three factors.
Strategic Planning
Professional Services
Slide illustrates major barriers in HR function performance, useful in HR management discussions for identifying critical areas of focus.
HR, barriers, management, performance, top three
false
Strategic Planning
Professional Services
Single Chart
PwC/Strategy&
Add to my slides
Remove from favorites
Contains two gauge charts comparing views between HR Managers and CEOs/GMs. Each chart uses a gradient color scheme to show agreement levels, focusing on managerial perspectives.
Human Resources and Talent Management
Professional Services
Compares HR Managers and CEOs/GMs opinions on certain company policies, useful for understanding different internal viewpoints and fostering discussion on alignment and policy adjustments.
HR, CEO, perspectives, gauge chart
false
Human Resources and Talent Management
Professional Services
Multiple Chart
PwC/Strategy&
Add to my slides
Remove from favorites
Sectioned layout with distinct points and icons.
Strategic Planning
Professional Services
This slide highlights how HR can lead change in reimagining work within organizations, with a focus on agility and digitalization.
HR, Change, Digitalization, Agility, Leadership
false
Strategic Planning
Professional Services
Header Horizontal
Deloitte
Add to my slides
Remove from favorites
Circular chart showing the distribution of how employee engagement feedback is communicated within companies.
Strategic Planning
Professional Services
Discusses how effectively companies communicate employee engagement feedback, crucial for HR management improvement.
HR, communication, employee engagement, feedback, management
false
Strategic Planning
Professional Services
Single Chart
PwC/Strategy&
Add to my slides
Remove from favorites
Bar chart with multiple bars in two colors showing various uses of HR data such as payroll, recruitment, and performance monitoring, with the highest use for standard data at 90%.
Human Resources and Talent Management
Professional Services
The slide illustrates common applications of HR data in organizations, emphasizing heavy use for standard operations like payroll and leave management.
HR data, payroll, recruitment, performance, bar chart
false
Human Resources and Talent Management
Professional Services
Single Chart
PwC/Strategy&
Add to my slides
Remove from favorites
A donut chart showing 91% of respondents have disciplinary procedures in place.
Strategic Planning
Professional Services
Useful for HR management to evaluate the adoption and effectiveness of disciplinary procedures within organizations.
HR, disciplinary procedures, evaluation, adoption, effectiveness
false
Strategic Planning
Professional Services
Single Chart
PwC/Strategy&
Add to my slides
Remove from favorites
The slide provides column charts comparing perceptions of HR leaders and non-HR leaders on the effectiveness of HR functions in delivering workforce strategy.
Market Analysis and Trends
Professional Services
Assesses differing perceptions between HR and non-HR leaders regarding the effectiveness of HR strategies in adapting to market changes and achieving organizational goals. Useful for identifying areas for improvement in HR practices and alignment with overall business strategy.
HR effectiveness, workforce strategy, leadership perceptions, organizational alignment, HR practices
false
Market Analysis and Trends
Professional Services
Single Chart
PwC/Strategy&
Add to my slides
Remove from favorites
A donut chart showing 81% of companies measure employee satisfaction.
Strategic Planning
Professional Services
Highlights the importance of measuring employee satisfaction in HR management, used for assessing HR practices.
HR, employee satisfaction, measurement, practices, assessment
false
Strategic Planning
Professional Services
Single Chart
PwC/Strategy&
Add to my slides
Remove from favorites
Split layout with photo of executive team and three yellow-highlighted competency blocks labeled 1–3 around a central circle labeled “High-performing CHRO.”
Human Resources and Talent Management
Professional Services
Explores the evolving role of HR executives over five years, identifying three core competencies: Business Operator, Humanistic Leader, and Technology Transformer. Each role is described in detail with supporting quotes, emphasizing the need for digital fluency, emotional intelligence, and commercial focus to succeed in future HR leadership.
HR executive, CHRO, digital fluency, competencies, leadership, emotional intelligence
false
Human Resources and Talent Management
Professional Services
Diagram
EY
Add to my slides
Remove from favorites
Circular stacked pie chart showing the frequency of employee satisfaction measurements.
Strategic Planning
Professional Services
Details frequency of employee satisfaction assessments, aiding in operational planning and improvement in HR.
HR, frequency, employee satisfaction, assessment, operational planning
false
Strategic Planning
Professional Services
Single Chart
PwC/Strategy&
Add to my slides
Remove from favorites
A pie chart shows 91% 'Yes' in a bold orange color, alongside a bar chart detailing percentages per sector like Financial Services and Manufacturing, indicating the presence of formal HR functions.
Market Analysis and Trends
Professional Services
Discusses the prevalence of formal HR functions across various sectors, useful for analyzing organizational maturity and HR management practices across industries.
HR, functions, organization, sectors, management, analysis, prevalence
false
Market Analysis and Trends
Professional Services
Multiple Chart
PwC/Strategy&
Add to my slides
Remove from favorites
Two gauge-like diagrams; one for HR Managers and another for CEOs, each indicating their perception of HR's impact on organizational success through a color gradient from red to yellow.
Market Analysis and Trends
Professional Services
Evaluates how different organizational roles perceive the impact of HR on success, indicating overall sentiment and possible areas for HR development and intervention.
HR, impact, success, perception, management, organizational roles
false
Market Analysis and Trends
Professional Services
Multiple Chart
PwC/Strategy&
Add to my slides
Remove from favorites
Bar chart showing the percentage of "Yes" responses regarding HR information system adoption across various sectors.
Human Resources and Talent Management
Professional Services
Explores the adoption rate of HR information systems across different sectors.
HR, information system, adoption, sectors, rate
false
Human Resources and Talent Management
Professional Services
Multiple Chart
PwC/Strategy&
Add to my slides
Remove from favorites
Central diagram with radiating points to highlight connections.
Technology and Digital Transformation
Professional Services
Explores various components of HR transformation, emphasizing technology and strategy for future workforce development.
HR, Innovation, Technology, Workforce, Strategy
false
Technology and Digital Transformation
Professional Services
Single Chart
Deloitte
Add to my slides
Remove from favorites
Donut chart showing percentages of employee access to HRIS, with 55% having access, 24% having limited access, and 21% with no access.
Human Resources and Talent Management
Professional Services
Explores how employees can access their data on HR information systems, showing a majority have some form of access.
HRIS, employee access, data records, donut chart
false
Human Resources and Talent Management
Professional Services
Single Chart
PwC/Strategy&
Add to my slides
Remove from favorites
Donut chart illustrating managers' access levels to HRIS concerning their direct employees, with varying degrees of access detailed.
Human Resources and Talent Management
Professional Services
Analyzes managers' access to HR information systems in relation to their direct reports, revealing diverse access levels.
HRIS, manager access, employee data, donut chart
false
Human Resources and Talent Management
Professional Services
Single Chart
PwC/Strategy&
Add to my slides
Remove from favorites
Bar chart showing percentages of various HRIS types, including outsourced, off-the-shelf, and in-house solutions. The largest bar represents HRIS custom developed by outsourced specialists at 46%.
Human Resources and Talent Management
Professional Services
This slide displays a bar chart categorizing HR information systems by type within organizations, highlighting the prevalence of outsourced solutions.
HRIS, outsourcing, in-house, off-the-shelf, bar chart
false
Human Resources and Talent Management
Professional Services
Single Chart
PwC/Strategy&
Add to my slides
Remove from favorites
Donut chart displaying the extent of HRIS use in recruitment and staffing, with 55% using HRIS and 36% using it but only for basic details.
Human Resources and Talent Management
Professional Services
This slide presents data on HRIS usage in recruitment, showing a significant portion utilizing these systems, albeit often just for basic information.
HRIS, recruitment, staffing, donut chart, utilization
false
Human Resources and Talent Management
Professional Services
Single Chart
PwC/Strategy&
Add to my slides
Remove from favorites
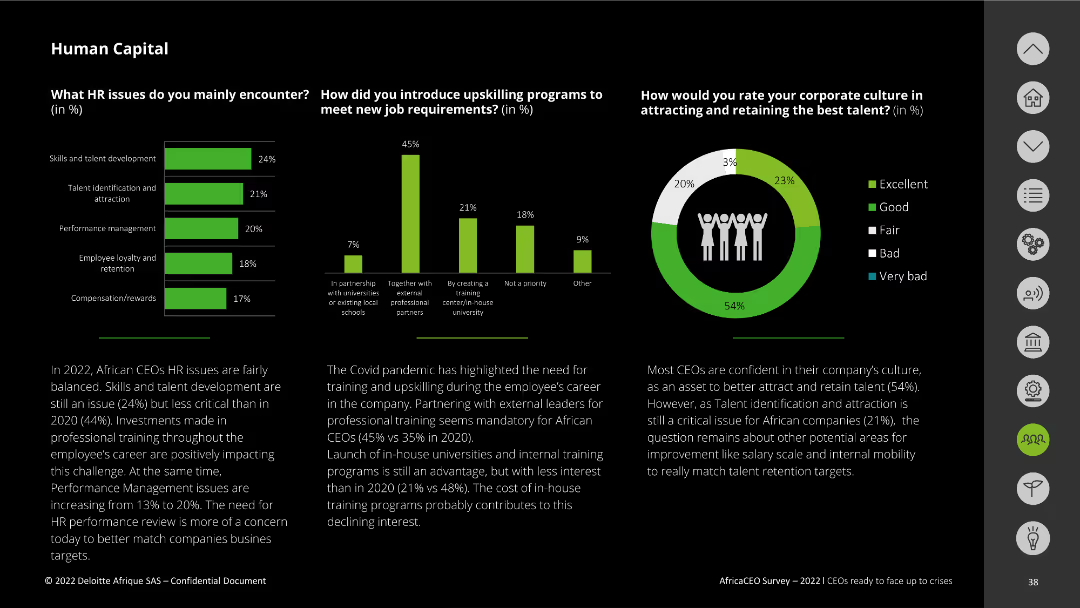
This slide features a series of vertical bar charts and a donut chart. It presents statistical data on HR issues, upskilling programs, and corporate culture. Text boxes provide additional context.
Human Resources and Talent Management
Professional Services
This slide discusses key HR issues African CEOs face, methods used to introduce upskilling programs, and how corporate culture impacts talent retention.
HR issues, upskilling, talent retention, corporate culture, African CEOs
false
Human Resources and Talent Management
Professional Services
Multiple Chart
Deloitte
Add to my slides
Remove from favorites
Horizontal bar chart of methods used to measure employee satisfaction, highlighting surveys and feedback.
Strategic Planning
Professional Services
Focuses on various methods for measuring employee satisfaction, essential for developing effective HR strategies.
HR, measurement methods, employee satisfaction, surveys, feedback
false
Strategic Planning
Professional Services
Single Chart
PwC/Strategy&
Add to my slides
Remove from favorites
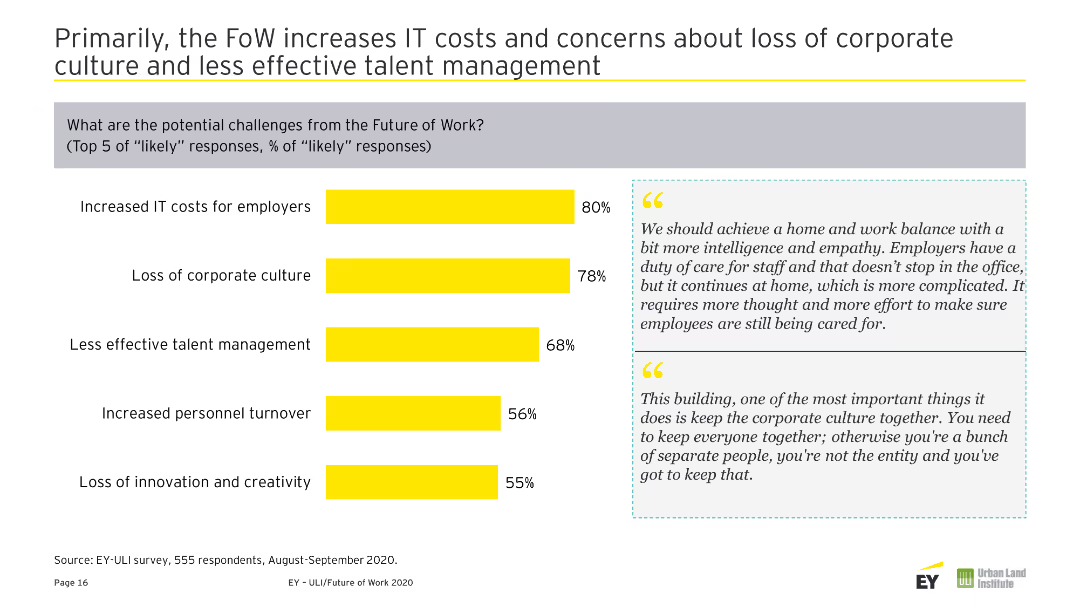
Two pie charts showing the importance of office space in retaining employees and creating a strong corporate culture post-COVID-19. Yellow and gray colors are used.
Human Resources and Talent Management
Real Estate & Construction
Evaluates the importance of office space in the post-COVID-19 environment for employee retention and corporate culture.
HR, Office Space, Retention, Corporate Culture, Post-COVID, Importance, Employees, Environment, Space
false
Human Resources and Talent Management
Real Estate & Construction
Mixed Chart
EY
Add to my slides
Remove from favorites
This slide presents a column chart contrasting employer and employee views on the attention paid to financial benefits over three years, with a significant increase in employee attention highlighted for the recent year.
Human Resources and Talent Management
Financial Services
Focuses on HR leaders' perspectives on employee attentiveness to benefits, indicating a growing awareness and importance of financial benefits in the workplace.
HR Perspectives, Financial Benefits, Employee Attentiveness, Bar Graph, Trends
false
Human Resources and Talent Management
Financial Services
Single Chart
Goldman Sachs
Add to my slides
Remove from favorites
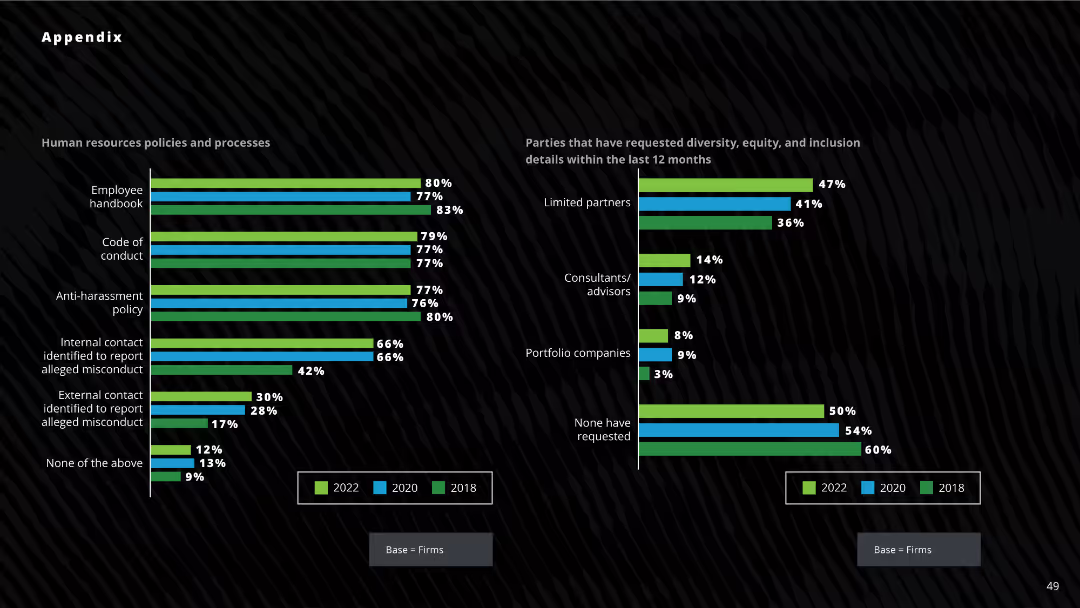
Two horizontal bar charts: one showing the adoption of HR policies across firms, the other displaying parties requesting diversity details within the last 12 months.
Human Resources and Talent Management
Professional Services
The slide illustrates the adoption rates of various HR policies over three years and highlights the parties requesting diversity details. Useful for understanding trends in HR policy adoption and diversity information requests.
HR policies, diversity, compliance, requests, adoption
false
Human Resources and Talent Management
Professional Services
Multiple Chart
Deloitte
Add to my slides
Remove from favorites
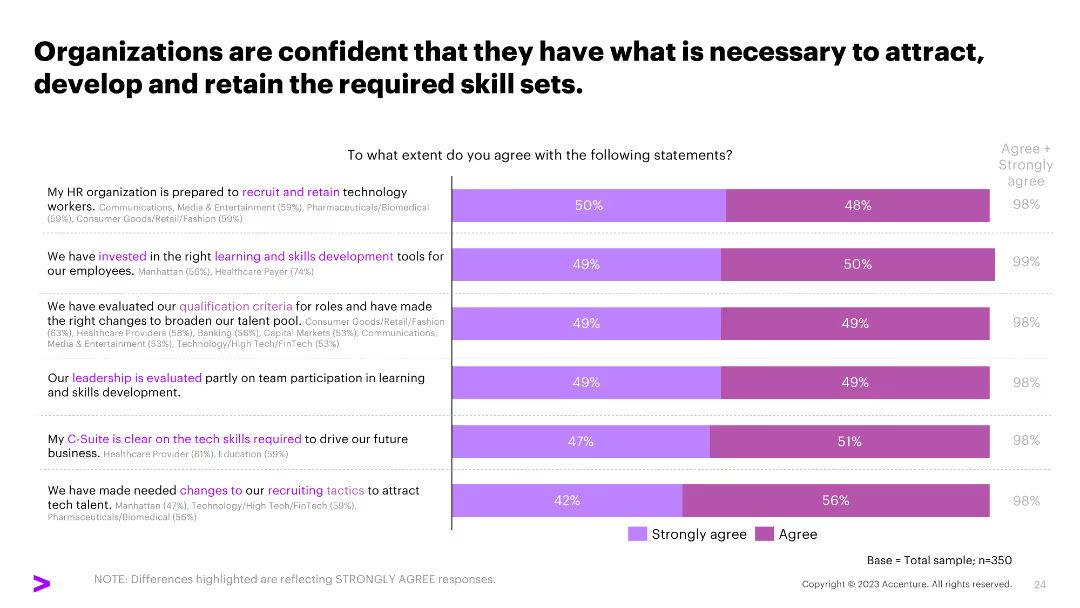
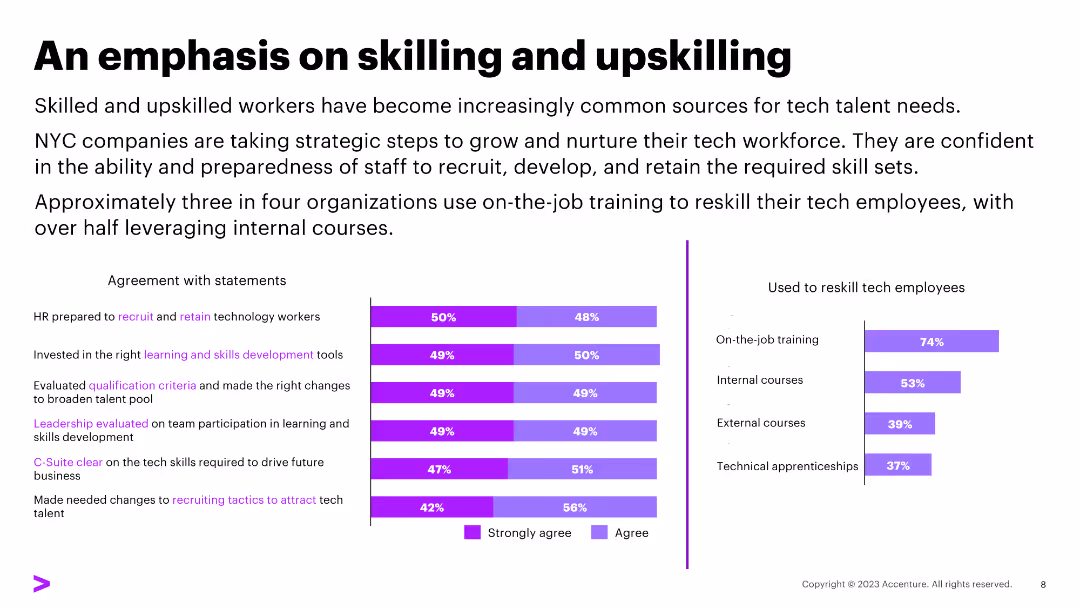
A column chart showing agreement levels on various HR practices, such as recruitment, skills development, and leadership evaluation, with percentages for each.
Human Resources and Talent Management
Professional Services
The slide shows how organizations agree on their capability to attract, develop, and retain required skill sets, emphasizing effective HR practices.
HR practices, skills development, recruitment, leadership evaluation
false
Human Resources and Talent Management
Professional Services
Mixed Chart
Accenture
Add to my slides
Remove from favorites
Horizontal bar chart showing top priorities for HR within the next 12 months, with focus on key talent retention.
Strategic Planning
Professional Services
Discusses key HR priorities to focus on in the upcoming year, vital for strategic HR planning and operational adjustments.
HR, priorities, strategy, talent retention, planning
false
Strategic Planning
Professional Services
Single Chart
PwC/Strategy&
Add to my slides
Remove from favorites
The slide features a column chart displaying percentages of agreement with statements and methods used to reskill employees. The layout is moderately dense with text and visuals.
Human Resources and Talent Management
Professional Services
Discusses the importance of skilling and upskilling workers, with data showing HR preparedness and reskilling methods.
HR, reskilling, training, upskilling, internal courses, external courses, technical apprenticeships
false
Human Resources and Talent Management
Professional Services
Multiple Chart
Accenture
Add to my slides
Remove from favorites
A single gauge diagram in orange to yellow gradient, measuring the balance between reactive and proactive HR approaches, marked by a needle pointing towards 'Balanced-Proactive'.
Market Analysis and Trends
Professional Services
This slide examines the strategic orientation of HR functions, whether they are more reactive or proactive, aiding in discussions on strategic planning and operational effectiveness in HR practices.
HR, strategies, reactive, proactive, planning, effectiveness, orientation
false
Market Analysis and Trends
Professional Services
Single Chart
PwC/Strategy&
Add to my slides
Remove from favorites
Donut chart paired with a bar chart. The donut chart shows 34% have an HR tech strategy, while the bar chart details the strategy prevalence by sector like banking and engineering.
Human Resources and Talent Management
Professional Services
Evaluates the presence of formal HR technology strategies within various sectors, highlighting a significant strategy adoption in banking and engineering.
HR strategy, sectors, technology, donut chart, bar chart
false
Human Resources and Talent Management
Professional Services
Multiple Chart
PwC/Strategy&
Add to my slides
Remove from favorites
Box plot showing the spread of HRST scores by total paid amount with outlier analysis.
Market Analysis and Trends
Government & Public Sector
Evaluates the distribution of HRST scores and their corresponding costs, identifying outliers and highlighting the discrepancies in service expenditures relative to assessed needs.
HRST scores, total paid amount, outlier analysis, health risk screening tool, service expenditures, funding discrepancies, NH's DD population
false
Market Analysis and Trends
Government & Public Sector
Mixed Chart
Alvarez & Marsal
Add to my slides
Remove from favorites
Semi-circular gauge chart indicating the frequency of technology usage within HR departments, with a needle pointing to "Sometimes."
Human Resources and Talent Management
Professional Services
This slide uses a gauge chart to depict the varying extent of technology use within HR departments, highlighting a moderate frequency of use.
HR technology, gauge chart, usage frequency
false
Human Resources and Talent Management
Professional Services
Single Chart
PwC/Strategy&
Add to my slides
Remove from favorites
Purple slide with four large numbered transformation areas, each with a supporting quote and short paragraph.
Organizational Structure and Change
Professional Services
Outlines four major transformations HR must lead: redefining work, workforce, business, and the HR function itself. Each theme addresses how HR leaders should adapt to automation, workforce evolution, strategic business involvement, and HR service delivery to remain relevant and impactful in the age of AI and digital transformation.
HR transformation, automation, future of work, leadership, organizational design
false
Organizational Structure and Change
Professional Services
Vertical Flow
EY
Add to my slides
Remove from favorites
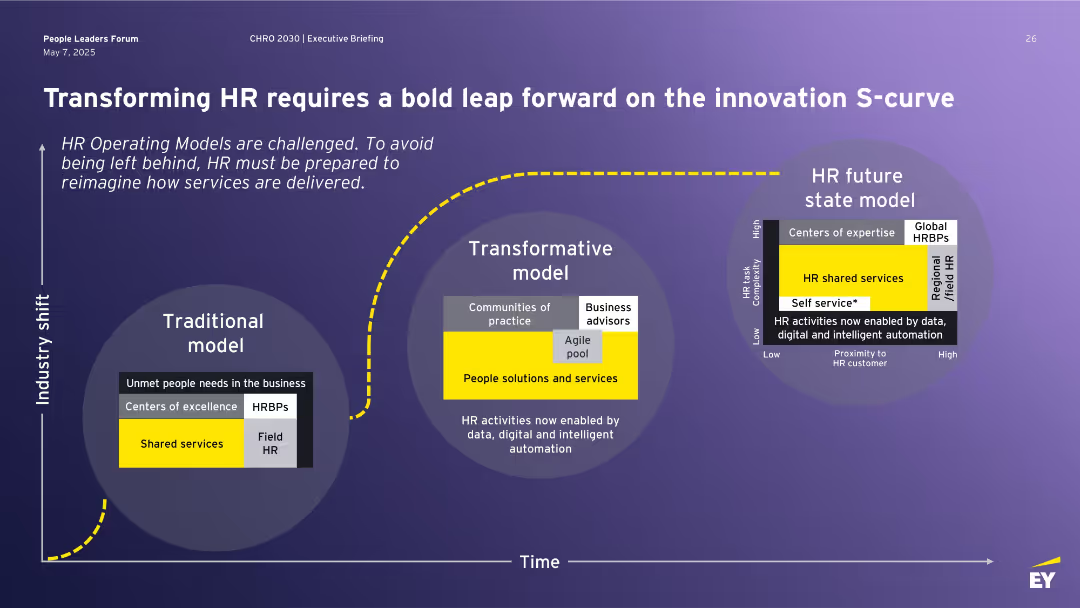
Three-part horizontal layout illustrating evolution from Traditional to Transformative to Future HR model using labeled circle diagrams, with a yellow dotted line representing industry shift over time.
Technology and Digital Transformation
Professional Services
This slide outlines the evolution of HR operating models from traditional to transformative and future-state frameworks. It highlights the impact of data, automation, and digital tools on HR service delivery. The innovation S-curve illustrates a necessary leap to stay relevant and meet business needs.
HR transformation, operating model, shared services, automation, innovation, S-curve, future of work
false
Technology and Digital Transformation
Professional Services
Single Chart
EY
Add to my slides
Remove from favorites
Purple background with three section blocks on HR role evolution, each with a photo and bullet-point text explaining HR's current imperatives.
Human Resources and Talent Management
Professional Services
Summarizes the evolving responsibilities of HR executives, emphasizing their role as business leaders who lead transformation by integrating technology and people strategy. Discusses how companies are shifting to skills-based models and AI adoption, and the need for HRBPs to deliver business outcomes through transformation and people experience strategies.
HR, transformation, talent advantage, AI, people strategy, HRBP, skills-based models
false
Human Resources and Talent Management
Professional Services
Header Vertical
EY
Add to my slides
Remove from favorites
Utilizing a line graph, this slide compares the perceived I&D maturity level across different demographics within HR, highlighting differences between minority and non-minority women.
Strategic Planning
Professional Services
Analyzing perceptions of inclusion and diversity maturity within HR, this slide compares assessments between minority and non-minority women in HR roles, illustrating differences in viewpoints.
HR, Women, Minority, Non-minority, Perceptions, Inclusion, Diversity, Maturity, Assessments
false
Strategic Planning
Professional Services
Single Chart
Accenture
Add to my slides
Remove from favorites
Graphic and text combination with a focus on the ACTIVATE phase.
Technology and Digital Transformation
Professional Services
Demonstrates Deloitte's holistic approach to engaging and optimizing workforce capabilities through HR solutions.
HR, Workforce, Solutions, Activate, Integration
false
Technology and Digital Transformation
Professional Services
Framework
Deloitte
Add to my slides
Remove from favorites
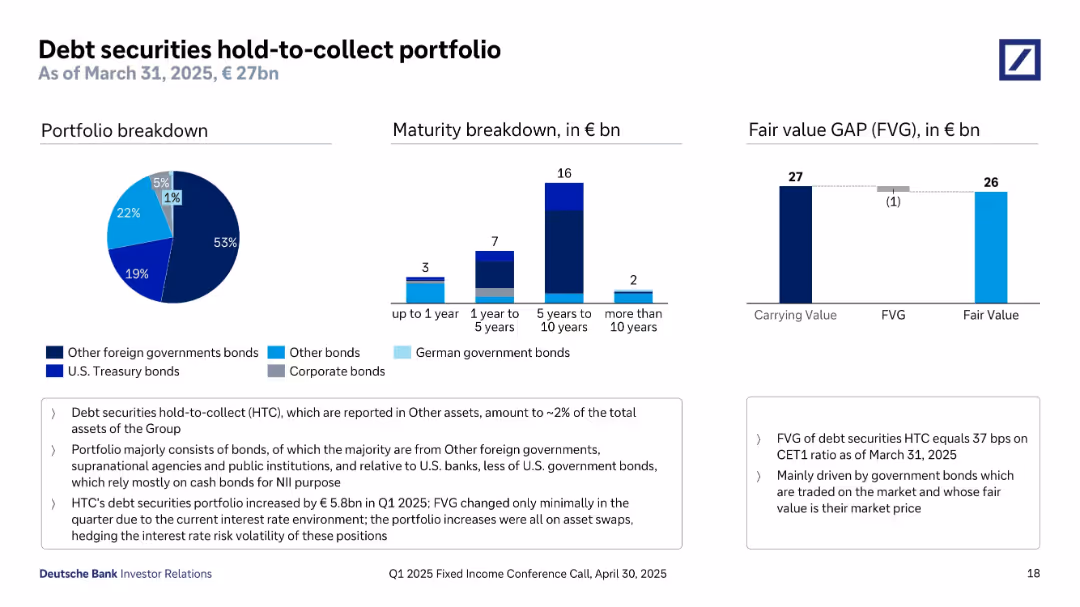
Three visualizations: pie chart (portfolio breakdown), bar chart (maturity), and a bar showing fair value vs carrying value (FVG). Each chart uses consistent color codes. Summary and highlights on the bottom and right.
Investment Analysis
Financial Services
This slide details Deutsche Bank's €27bn hold-to-collect (HTC) bond portfolio. Majority holdings are other foreign government and supranational agency bonds. Most maturities fall within 5–10 years. Fair value gap is minimal (€1bn), reflecting low mark-to-market risk. The slide emphasizes increased portfolio size this quarter, primarily from asset swaps, with negligible FVG changes. It also notes HTC assets account for ~2% of the bank's total assets.
HTC portfolio, government bonds, maturity breakdown, fair value gap, bond investment, NII, supranational
false
Investment Analysis
Financial Services
Multiple Chart
Deutsche Bank
Add to my slides
Remove from favorites
Combines textual explanations with imagery illustrating various human-AI interaction models.
Organizational Structure and Change
Professional Services
Explores the dynamic relationship between AI and human interaction, proposing models for maximizing AI utility in business settings.
Human-AI Dynamics, Organizational Change, AI Models, Business Optimization, Interaction Efficiency, Professional Services
false
Organizational Structure and Change
Professional Services
Header Horizontal
BCG
Add to my slides
Remove from favorites
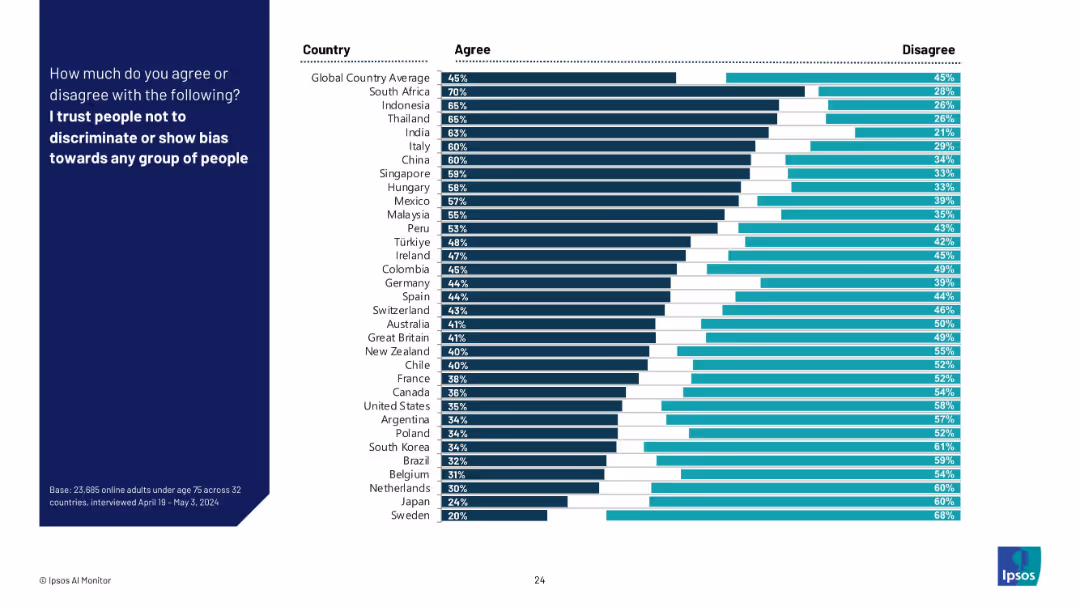
Horizontal bar chart showing public trust in people to act without bias, segmented by country; ordered by % agree.
Regulatory and Compliance
Artificial Intelligence
This slide contrasts public trust in humans regarding bias with that of AI (from prior slide), offering insight into comparative perceptions of fairness between human and machine decision-making.
human bias, fairness, ethics, discrimination, trust, Ipsos, comparative analysis, AI vs people, country sentiment
false
Regulatory and Compliance
Artificial Intelligence
Mixed Chart
IPSOS
Add to my slides
Remove from favorites
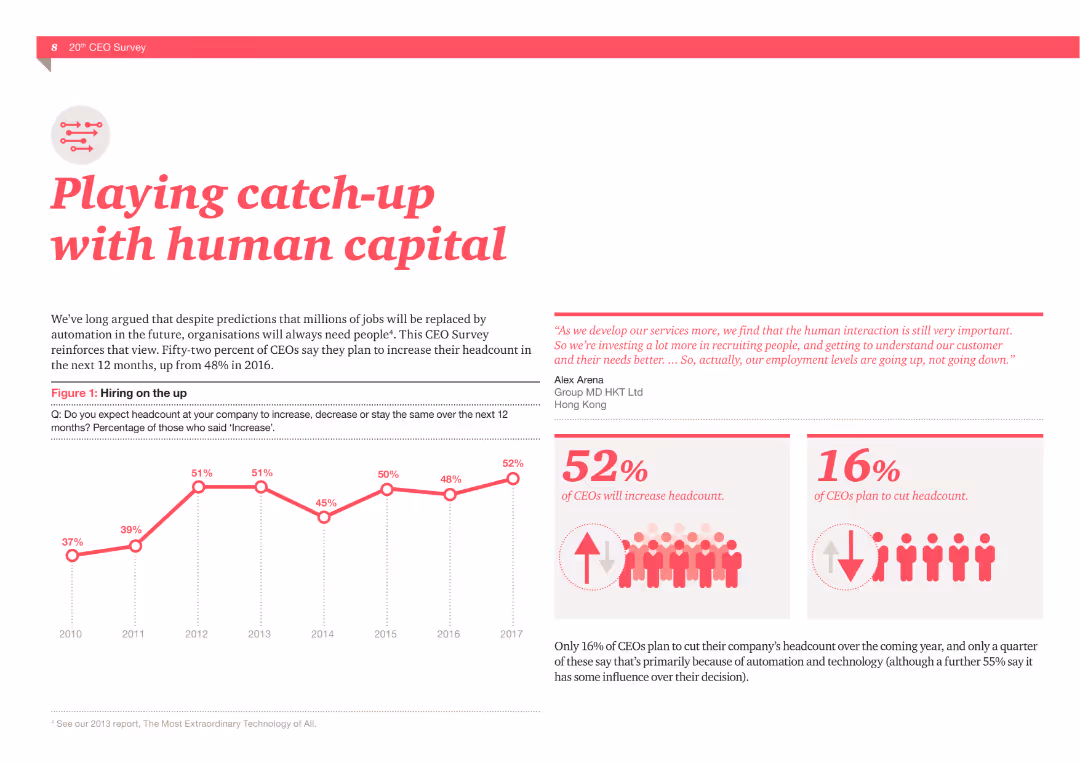
A column chart showing hiring trends from 2010 to 2017, and two statistics: 52% of CEOs plan to increase headcount, 16% plan to cut headcount. Includes a quote about the importance of human interaction.
Human Resources and Talent Management
Professional Services
The slide presents data from a CEO survey about hiring plans and the importance of human capital in the age of automation, supported by visual data and quotes.
Human capital, Hiring, CEOs, Headcount, Automation, Survey, Talent, Interaction, Recruitment, Employment
false
Human Resources and Talent Management
Professional Services
Multiple Chart
PwC/Strategy&
Add to my slides
Remove from favorites
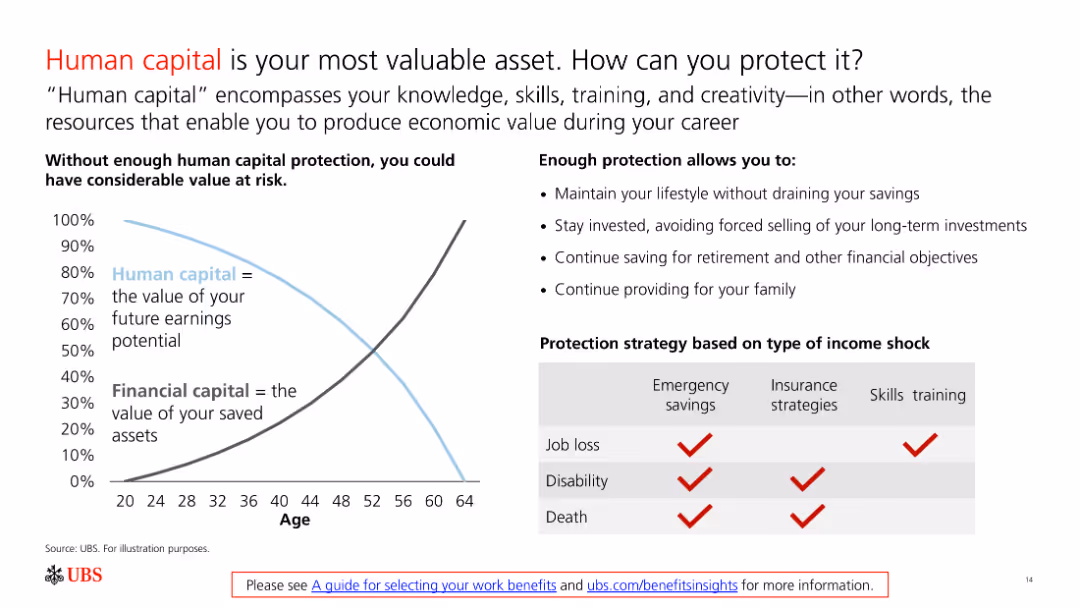
The slide features a line chart comparing human capital and financial capital over a lifetime and a table with protection strategies for income shocks.
Risk Assessment and Management
Financial Services
The slide emphasizes the importance of protecting human capital through various strategies, ensuring financial stability against job loss, disability, or death.
Human Capital, Protection, Financial Stability, Strategies, Risk
false
Risk Assessment and Management
Financial Services
Mixed Chart
UBS
Add to my slides
Remove from favorites
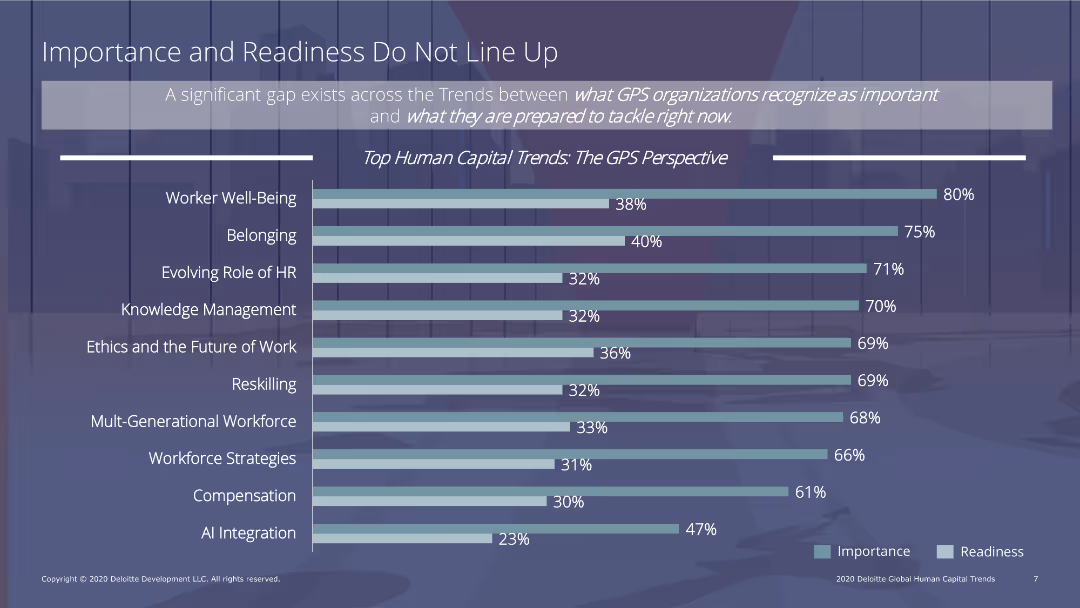
The slide features a column chart comparing the importance and readiness of various human capital trends, such as worker well-being, belonging, and reskilling. Text sections provide context and analysis.
Human Resources and Talent Management
Professional Services
The slide addresses the gap between the importance and readiness of human capital trends in GPS organizations, with a column chart illustrating disparities in areas like worker well-being, belonging, and reskilling.
human capital, readiness, importance, GPS organizations, trends
false
Human Resources and Talent Management
Professional Services
Single Chart
Deloitte
Add to my slides
Remove from favorites
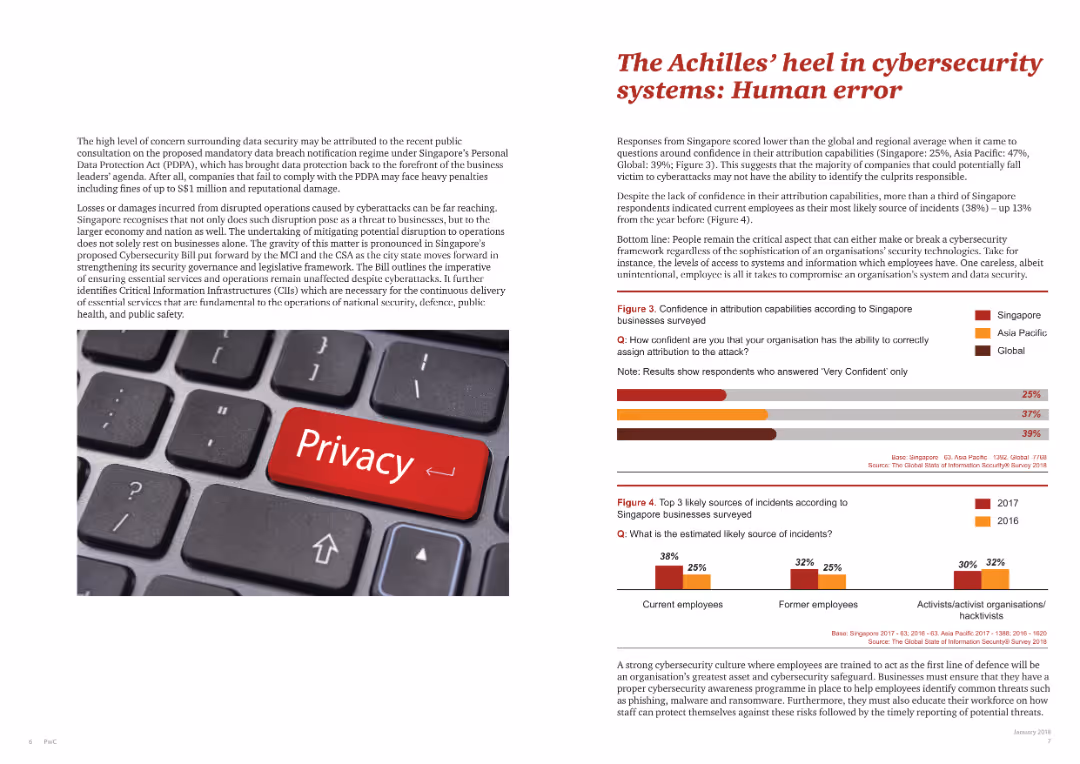
Text-heavy slide with supporting graphics, including a keyboard with a "Privacy" key, and bar charts showing data on human error in cybersecurity.
Risk Assessment and Management
Telecommunications
Discusses how human error is a significant vulnerability in cybersecurity systems, based on survey responses and statistical data.
human error, cybersecurity, vulnerability, survey data, privacy
false
Risk Assessment and Management
Telecommunications
Multiple Chart
PwC/Strategy&
Add to my slides
Remove from favorites
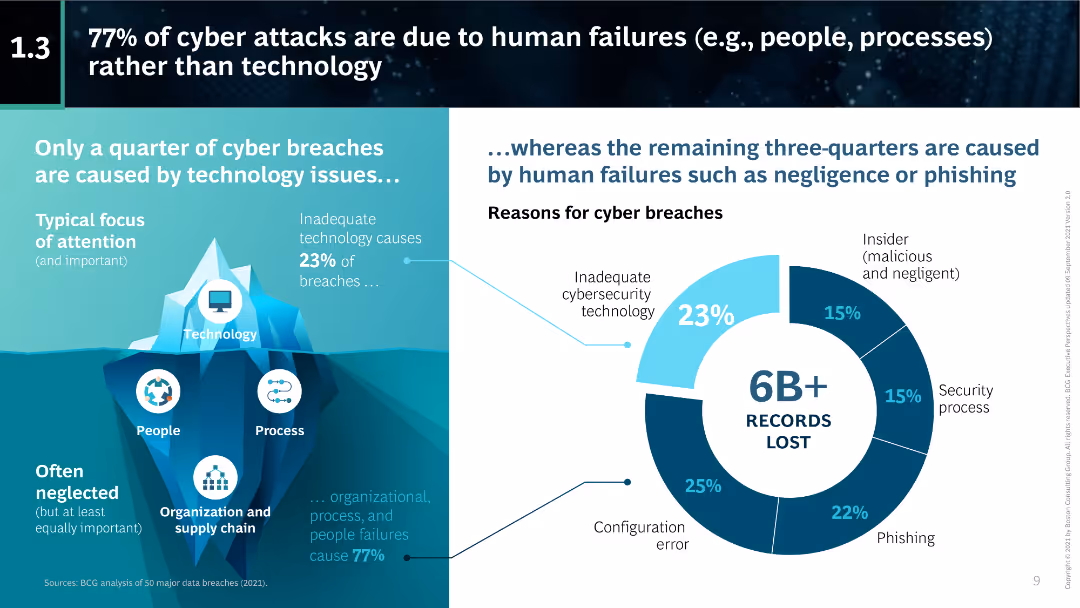
The slide features a pie chart illustrating that 77% of cyber attacks are due to human failures. Accompanying text details the reasons for cyber breaches, including inadequate technology and insider threats.
Risk Assessment and Management
Technology & Software
This slide highlights that the majority of cyber attacks are caused by human failures rather than technological issues. It provides a breakdown of the causes of cyber breaches and emphasizes the importance of addressing human factors in cybersecurity.
human failures, cyber attacks, technology issues, insider threats, cybersecurity, pie chart, BCG
false
Risk Assessment and Management
Technology & Software
Mixed Chart
BCG
Add to my slides
Remove from favorites
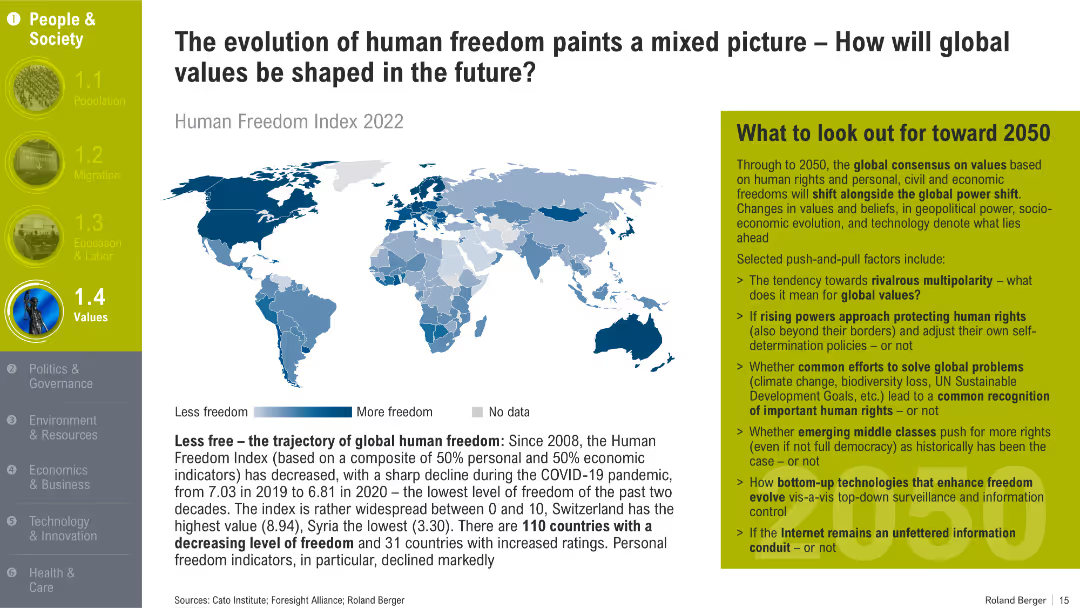
World map shaded by Human Freedom Index levels; supported by text on trends since 2008 and forecast implications toward 2050.
Strategic Planning
Government & Public Sector
The slide illustrates global trends in freedom using the Human Freedom Index. It discusses declining personal freedoms post-COVID and raises key geopolitical and social questions affecting global values by 2050.
human freedom, values, Human Freedom Index, civil liberties, geopolitical trends, personal rights
false
Strategic Planning
Government & Public Sector
Mixed Chart
Roland Berger
Add to my slides
Remove from favorites
Diagram illustrating various touch points in the human-machine relationship, including technological inequality, social media, future of work, biotechnology, and AI.
Technology and Digital Transformation
Technology & Software
The slide explores the complex interactions between humans and machines, emphasizing the need for society to adapt and shape technological advancements. It covers topics such as technological inequality, social media impact, future work scenarios, biotechnology, and AI integration.
Human-Machine Interaction, Technological Inequality, AI
false
Technology and Digital Transformation
Technology & Software
Diagram
Roland Berger
Add to my slides
Remove from favorites
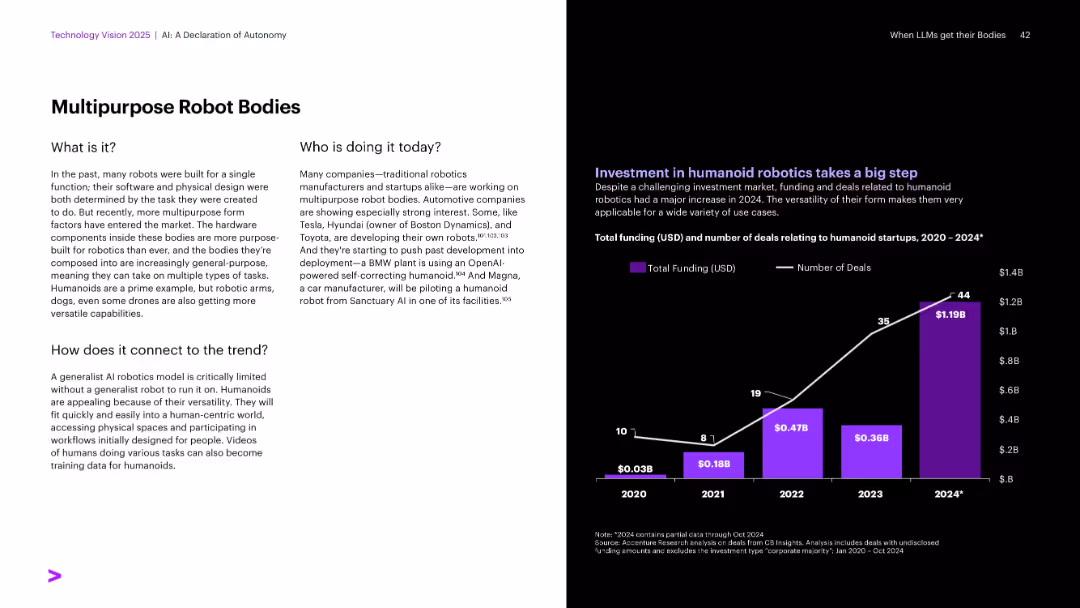
Textual explanation on white background left; chart on funding and deals in purple and white on the right.
Technology and Digital Transformation
Industrial & Manufacturing
Highlights the trend of general-purpose robot bodies, moving beyond task-specific designs. Automakers like Tesla and Toyota are developing humanoids. Investment in humanoid robotics has surged, with 2024 seeing the largest funding and number of deals, indicating strong market interest.
Humanoids, multipurpose robots, Tesla, Toyota, robotics investment
false
Technology and Digital Transformation
Industrial & Manufacturing
Mixed Chart
Accenture
Add to my slides
Remove from favorites
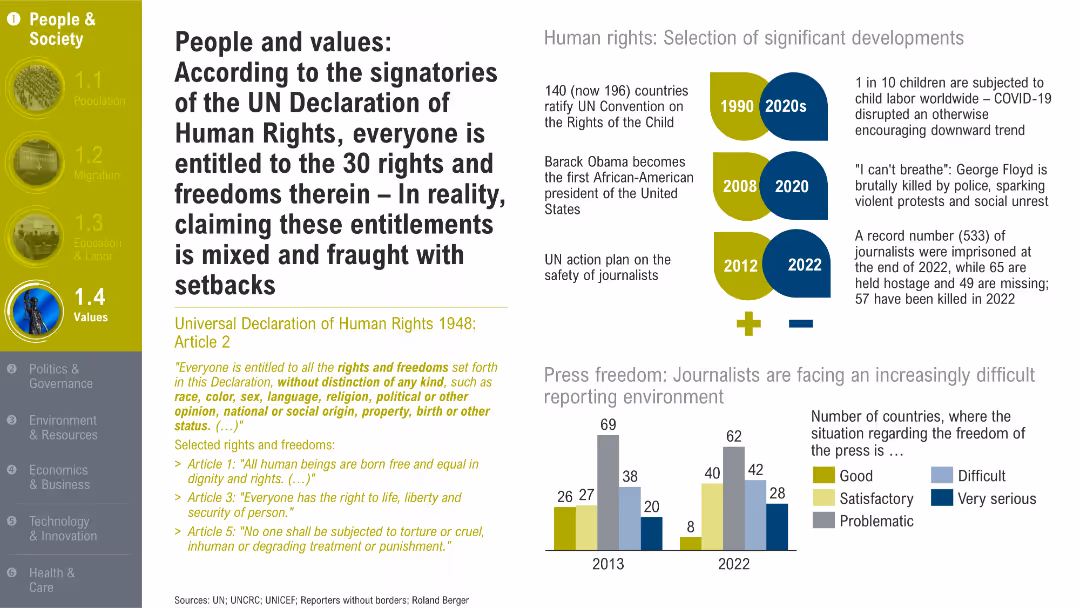
Timeline and rights excerpts on the left, press freedom bar chart on the right, major developments annotated. Uses green and yellow highlight blocks.
Regulatory and Compliance
Government & Public Sector
The slide presents human rights fundamentals and notable milestones while highlighting setbacks in press freedom and journalist safety, despite global commitments to human rights.
human rights, UN Declaration, journalist safety, press freedom, social justice, equality, legal frameworks
false
Regulatory and Compliance
Government & Public Sector
Mixed Chart
Roland Berger
Add to my slides
Remove from favorites
Incorporates a timeline of significant human rights developments, quotes, and statistical data, presented in a visually engaging format with clear color-coded elements to denote different decades.
Market Analysis and Trends
Government & Public Sector
Provides a historical and current overview of significant global human rights developments and challenges, emphasizing progress and setbacks in the pursuit of universal rights.
human rights, UN, global, timeline, progress, challenges, policy, international, historical
false
Market Analysis and Trends
Government & Public Sector
Header Vertical
Roland Berger
Add to my slides
Remove from favorites
This slide displays column charts detailing the impact of different human risks on the workforce, like political instability and migration. The colors indicate data for different timelines and geographies.
Human Resources and Talent Management
Professional Services
This slide examines the external human risks impacting the workforce, such as political instability and economic inequality, and how these vary by geography and over time. It emphasizes the strategic responses by businesses, including enhanced leadership and talent retention strategies, tailored for both current and future challenges.
Human Risk, Workforce, Impact, Leadership, Strategy
false
Human Resources and Talent Management
Professional Services
Mixed Chart
Deloitte
Add to my slides
Remove from favorites
This slide shows multiple small stacked area and column charts comparing capacity scenarios across four categories (Central, Step Change, Fast Change, Slow Change).
Market Analysis and Trends
Energy & Utilities
Compares different capacity scenarios without the HumeLink upgrade, highlighting the potential impact on energy capacity across various changes and timelines.
HumeLink, capacity, scenarios, energy, comparison, Central, Step Change, Fast Change, Slow Change
false
Market Analysis and Trends
Energy & Utilities
Multiple Chart
EY
Add to my slides
Remove from favorites
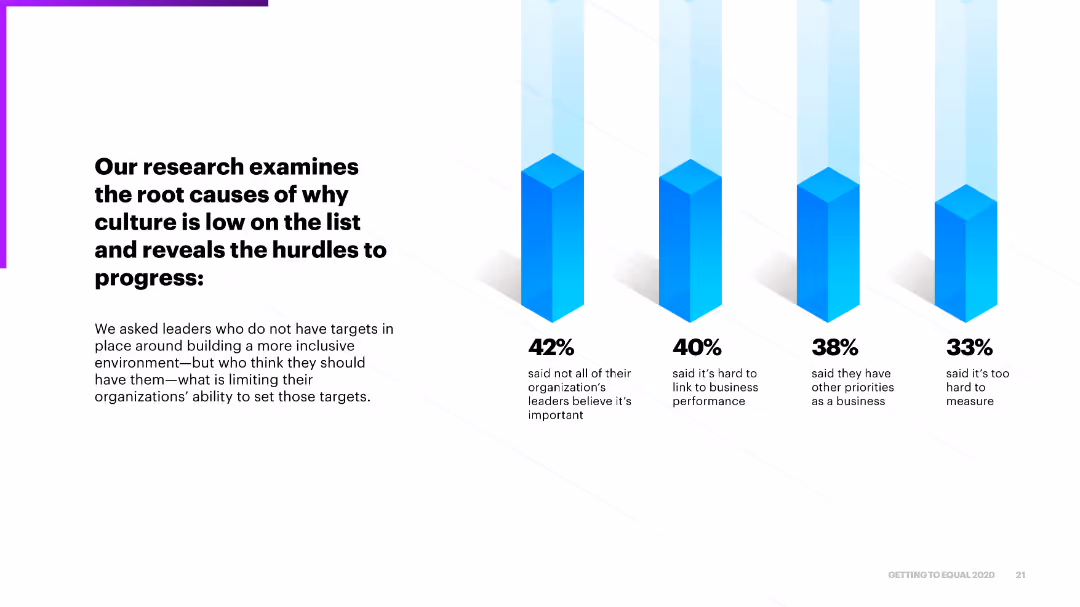
The slide includes four column charts highlighting the main reasons why leaders do not set targets for building an inclusive environment, such as perceived importance and difficulty linking to business performance.
Market Analysis and Trends
Professional Services
It examines the root causes that prevent leaders from prioritizing inclusive culture, identifying hurdles like linking inclusion to business performance and setting measurable targets.
hurdles, inclusive environment, business performance, targets, progress
false
Market Analysis and Trends
Professional Services
Mixed Chart
Accenture
Add to my slides
Remove from favorites
The slide features a flow chart detailing the H-vision project's value chain and potential partners, categorized into supply, production, distribution, end-use, and evacuation.
Strategic Planning
Energy & Utilities
The slide outlines the H-vision project aiming to develop a blue hydrogen economy in Rotterdam by 2050. It includes the project's scope, objectives, context, and identifies key partners involved in the supply chain and production processes.
H-vision, partners, hydrogen, Rotterdam, value chain
false
Strategic Planning
Energy & Utilities
Vertical Flow
Kearney
Add to my slides
Remove from favorites
This slide features a bar graph showing the net present value (NPV) build-up for the H-vision project, including revenue, costs, and subsidies required for profitability.
Investment Analysis
Energy & Utilities
The slide illustrates the financial requirements and expected profitability of the H-vision project in the reference scenario, highlighting the need for a €0.7 billion subsidy and the avoided cost of ETS certificates to achieve economic viability.
H-vision, subsidy, NPV, investment, profitability
false
Investment Analysis
Energy & Utilities
Mixed Chart
Kearney
Add to my slides
Remove from favorites
Previous
Next
You don't have any favorites yet.
Please wait loading your favorites slides...
Create a FREE account to continue browsing
Receive Instant Access to 1,000+ slides from companies like McKinsey, Google, and Goldman Sachs
First Name
Last Name
Email
Password
I agree to all
Terms & Privacy Policy
Thank you! Your submission has been received!
Oops! Something went wrong while submitting the form.
Have an account?
Sign in
Upgrade to PRO to Save slides
Advanced Search and Filters
Access to 15,000+ slides
Access to Category Pages
Save/Bookmark Slides
PowerPoint Template Library
Pick a Plan
MONTHLY
$12/month
Billed every month, Cancel anytime.
YEARLY
$9/year
Billed $108 annually, Cancel anytime.
Checkout for $12/month
Checkout for $108/yr
Secured by Stripe | AES-256 bit encryption