My Account
My Slides
Search by Category
Companies
Slide Type
Use Case
Industry
Pricing
Templates
View All Templates
Download Template Slides
✦ AI
AI Prompt Library
AI Search
Feedback
Login
Logout
Get Started
Browse all Slides
Browse all Slides
Create a FREE Account
Instant access to 1,000+ real slides from top companies like McKinsey, BCG, Goldman Sachs, Google and many more!
First Name
Last Name
Email
Password
I agree to all
Terms & Privacy Policy
Thank you! Your submission has been received!
Oops! Something went wrong while submitting the form.
Have an account?
Sign in
Saved Slides
Total No. of slides saved
0
↻ Refresh
✖ Clear all
The slide uses horizontal bar graphs to compare the online spend of HVUs and non-HVUs in the Philippines. It features a blue and grey color scheme, with each category of spend such as transport, gaming, and travel represented by a bar. The right side of the slide includes two column charts showing changes in spend percentage. It provides demographic and geographic composition percentages through pie charts.
Customer and Market Segmentation
Technology & Software
This slide compares the online spending of high-value users (HVUs) with non-HVUs in the Philippines, emphasizing transport as a significant factor. It's useful for businesses and marketers to identify and capitalize on key differentiators in consumer spending behavior, especially in the context of transportation and e-commerce sectors.
HVUs, Non-HVUs, Philippines, Transport, Online Spend, Gaming, Travel, E-commerce, Market Segmentation
false
Customer and Market Segmentation
Technology & Software
Multiple Chart
Bain
Add to my slides
Remove from favorites
This slide features comparative bar charts and a pie chart. There are two sections: one compares the online spend of HVUs vs. non-HVUs across various verticals, and the other shows the demographic and geographic composition of HVUs. Additionally, there are two column charts depicting changes in spend percentage.
Market Analysis and Trends
Technology & Software
The slide presents data on high-value users' (HVUs) online spending habits in Thailand compared to non-HVUs, indicating that HVUs spend significantly more. Demographic and geographic distributions of HVUs are detailed. Changes in spend over the past 12 months and intentions to increase spend are quantified through column charts, highlighting the growing trend in digital consumer behavior.
HVU, Thailand, Spending Habits, Demographics, E-commerce, Transport, Gaming, Growth, Consumer Behavior, Digital Economy
false
Market Analysis and Trends
Technology & Software
Multiple Chart
Bain
Add to my slides
Remove from favorites
The slide features a title, two sections with column charts, and additional small text boxes with statistics. The first chart shows the growth in consumers with hybrid fitness routines from 2020 to 2022. The second part has comparison stats on health outcomes between hybrid fitness consumers and general respondents.
Market Analysis and Trends
Healthcare & Pharmaceuticals
This slide discusses the increasing adoption of hybrid fitness models, comparing data from 2020 and 2022. It provides evidence of effectiveness by showing higher positive health outcomes among hybrid fitness users versus all respondents. The slide could be used to discuss market trends in health and fitness and consumer behavior changes post-pandemic.
Hybrid fitness, health outcomes, consumer trends, market analysis, data comparison
false
Market Analysis and Trends
Healthcare & Pharmaceuticals
Single Chart
McKinsey
Add to my slides
Remove from favorites
Balanced layout with title, bullet points, and icons for productivity improvements. Neutral color palette with accent colors.
Technology and Digital Transformation
Professional Services
Discusses leadership views on flexible working options with technology integration for health, well-being, and collaboration. In-person collaboration and social events are emphasized.
Hybrid, Leadership, Flexibility, Productivity, Collaboration
false
Technology and Digital Transformation
Professional Services
Pillar
EY
Add to my slides
Remove from favorites
Detailed text analysis with supporting statistics from a small bar and line chart showing predictions in graphic form.
Strategic Planning
Financial Services
Explores the shift towards hybrid and fully tech-driven advisory models in the financial industry.
hybrid model, tech-driven, advisory, financial industry, future, financial services
false
Strategic Planning
Financial Services
Multiple Chart
Deloitte
Add to my slides
Remove from favorites
The slide is designed with a central pie chart that contrasts sharply with the background image of a modern, airy office space. The chart's sections are clearly delineated, using varying shades to differentiate between different work location approaches, and the background image adds depth to the visual narrative.
Technology and Digital Transformation
Professional Services
Showcasing the adoption rates of various hybrid work models, this slide offers a visual representation to aid in discussions about the flexibility and evolution of the modern workplace. It is particularly useful for HR and management to strategize on accommodating diverse work preferences in the evolving corporate landscape.
Hybrid Office, Work Models, Flexibility, Adoption Rates, Modern Workplace
false
Technology and Digital Transformation
Professional Services
Single Chart
EY
Add to my slides
Remove from favorites
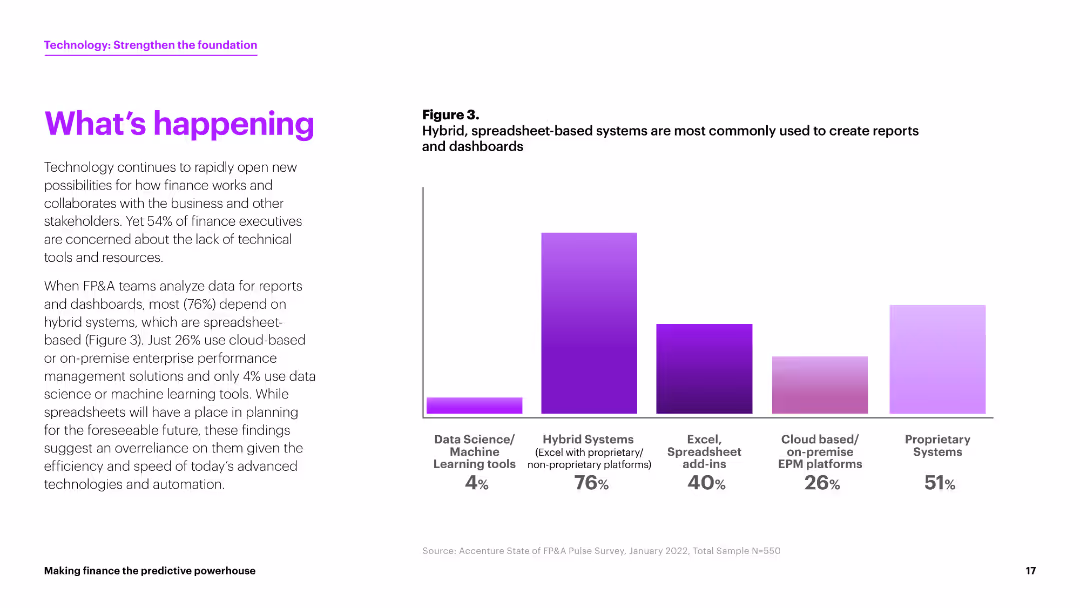
This slide presents a column chart illustrating the types of systems most commonly used to create reports and dashboards. The chart uses shades of purple to represent different systems. There is a section of text explaining the data.
Technology and Digital Transformation
Financial Services
The slide explains that 76% of FP&A teams depend on hybrid systems for creating reports and dashboards. It emphasizes the importance of technology in enhancing efficiency and automation.
hybrid systems, reports, dashboards, FP&A, technology
false
Technology and Digital Transformation
Financial Services
Mixed Chart
Accenture
Add to my slides
Remove from favorites
Combination of text, percentage circles, and data points highlighting changes in work habits and compensation expectations post-pandemic.
Human Resources and Talent Management
Professional Services
This slide explores new working norms post-pandemic, including hybrid work preferences, stress impacts, pay equity issues, and career opportunities, supported by survey data and statistics.
Hybrid work, compensation, career opportunities, pandemic, survey data, employee preferences
false
Human Resources and Talent Management
Professional Services
Multiple Chart
EY
Add to my slides
Remove from favorites
Column charts, text, and image of a woman with headphones. Data on exclusion, flexibility, mental health, and caregiving in hybrid vs. remote environments.
Human Resources and Talent Management
Professional Services
Discusses the exclusion and lack of flexibility for women in hybrid work environments and its impact on their mental health and stress levels.
hybrid work, flexibility, exclusion, mental health, stress, caregiving, women, support, employers
false
Human Resources and Talent Management
Professional Services
Multiple Chart
Deloitte
Add to my slides
Remove from favorites
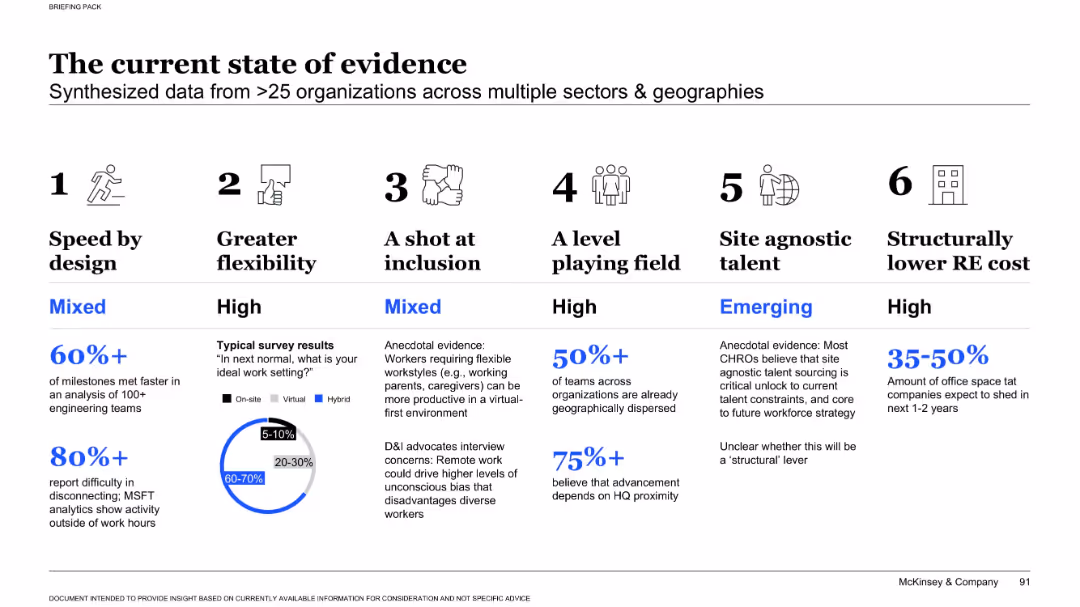
Infographic-style layout with 6 columns, each showing a theme with icons, text, and mixed qualitative/quantitative evidence.
Market Analysis and Trends
Professional Services
This slide summarizes data from over 25 organizations about trends in flexibility, inclusion, cost savings, and performance post-COVID. It presents evidence for hybrid work advantages while noting challenges like disconnection and equity concerns.
hybrid work, flexibility, inclusion, speed, office cost, evidence, survey, productivity, remote, trends
false
Market Analysis and Trends
Professional Services
Mixed Chart
McKinsey
Add to my slides
Remove from favorites
A slide with bar graphs and circular statistics to illustrate the experiences of women in hybrid working environments and how they vary by organizational culture.
Operational Efficiency
Professional Services
Emphasizes how Gender Equality Leaders create better hybrid working experiences, valuable for discussions on hybrid workplace models and inclusive culture development.
hybrid work, gender equality, culture, experience
false
Operational Efficiency
Professional Services
Multiple Chart
Deloitte
Add to my slides
Remove from favorites
This slide includes a header and a column chart. The charts compare employees' preferences for working remotely or in a hybrid setting against their expectations of what their employers will likely implement.
Technology and Digital Transformation
Technology & Software
Analyzes current trends and future expectations regarding hybrid and remote work arrangements, reflecting a strong preference for flexibility in work locations among employees, contrasted with their anticipation of employer policies.
hybrid working, remote work, employee preferences, employer expectations
false
Technology and Digital Transformation
Technology & Software
Single Chart
PwC/Strategy&
Add to my slides
Remove from favorites
The slide includes column charts and text blocks. The left side presents desired office investments, and the right side shows remote work investment preferences.
Technology and Digital Transformation
Professional Services
Discusses employee preferences for investments in hybrid work models, highlighting top choices for office and remote work improvements.
hybrid work, investments, office technology, remote work, survey
false
Technology and Digital Transformation
Professional Services
Multiple Chart
EY
Add to my slides
Remove from favorites
Calm ocean-themed background with circle graphs and icon stats. Focused on labor and hybrid models.
Human Resources and Talent Management
Professional Services
Analyzes CEO responses to labor market dynamics, hybrid vs in-office trends, and intergenerational challenges. Emphasizes upskilling, GenAI integration, and college degree flexibility.
hybrid work, labor market, talent, GenAI, upskilling, workforce trends
false
Human Resources and Talent Management
Professional Services
Single Chart
KPMG
Add to my slides
Remove from favorites
The slide presents an analysis of hybrid work models with a multi-segmented layout, featuring both text descriptions and colored blocks. Statistics are highlighted to draw focus, and a monochrome image of a casual office interaction serves as a backdrop, signifying the evolving work environment.
Human Resources and Talent Management
Professional Services
This slide analyzes the acceptance and structure of hybrid work models post-pandemic, providing valuable data for HR professionals and company leaders. It offers insights into current work patterns and their implications for company policies, talent retention, and the overall future of work.
Hybrid Work, Pandemic, Future of Work, Company Policy, Talent Retention
false
Human Resources and Talent Management
Professional Services
Text Only
EY
Add to my slides
Remove from favorites
The slide features bar graphs contrasting experiences from two different years, set within a large circular design, indicating trends over time.
Risk Assessment and Management
Professional Services
It presents the challenges in hybrid work, particularly the lack of predictability and mixed messaging, which could inform discussions on the clarity of communication in hybrid work policies and its impact on employee satisfaction in human resources and management meetings.
hybrid work, predictability, communication, challenges
false
Risk Assessment and Management
Professional Services
Multiple Chart
Deloitte
Add to my slides
Remove from favorites
Features a mix of text and a column chart illustrating preferred working patterns for Gen Z and millennials. Includes benefits of remote work in text bubbles.
Operational Efficiency
Professional Services
The slide highlights the high demand for hybrid working models among Gen Z and millennials and the need for businesses to adapt to this preference. It includes data on preferred working patterns and the benefits of remote work, such as cost savings and improved work-life balance.
Hybrid work, remote work, Gen Z, millennials, work-life balance
false
Operational Efficiency
Professional Services
Mixed Chart
Deloitte
Add to my slides
Remove from favorites
The slide features a series of column charts comparing current and preferred work patterns of Gen Zs and Millennials, highlighting preferences for hybrid and remote work models. The layout is clean and informative.
Technology and Digital Transformation
Telecommunications
The slide presents data on the hybrid and remote work preferences of Gen Zs and Millennials, showing current work patterns versus preferred arrangements, and emphasizing the desire for flexible work options and in-person collaboration under certain conditions.
Hybrid work, remote work, preferences, Gen Z, Millennials
false
Technology and Digital Transformation
Telecommunications
Multiple Chart
Deloitte
Add to my slides
Remove from favorites
Structured layout with three sections, bulleted lists of digital innovations, and images of diverse working settings.
Technology and Digital Transformation
Professional Services
Data on digital innovation adoption for workplace flexibility, wellbeing, and collaboration, emphasizing hybrid technologies and health certifications.
Hybrid Work, Wellbeing, Digital Innovation, Collaboration
false
Technology and Digital Transformation
Professional Services
Header Horizontal
EY
Add to my slides
Remove from favorites
The slide uses horizontal bar graphs and circular statistics to present current versus preferred work arrangements, emphasizing the contrast in hybrid working scenarios.
Market Analysis and Trends
Professional Services
Revealing the preferences and current states of hybrid workers, this slide sheds light on the gap between reality and preference for women's work arrangements. It could be pivotal in illustrating workforce expectations and company policy gaps in presentations aimed at HR professionals or management teams.
hybrid work, women, preferences, workforce
false
Market Analysis and Trends
Professional Services
Multiple Chart
Deloitte
Add to my slides
Remove from favorites
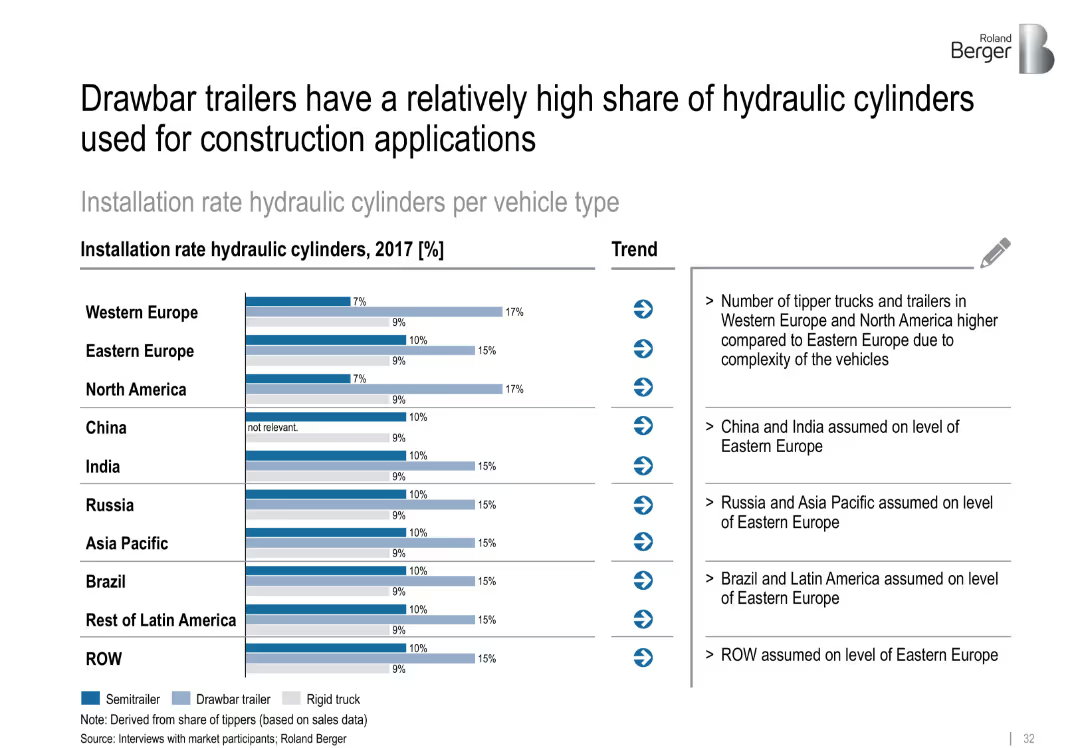
Horizontal bar chart showing hydraulic cylinder installation rate by trailer type and region
Product and Service Analysis
Industrial & Manufacturing
The slide presents data on the use of hydraulic cylinders across semitrailers, drawbar trailers, and rigid trucks by region. It concludes that drawbar trailers, especially in Western markets, have the highest usage for construction.
hydraulic cylinders, drawbar trailer, construction, tipper trucks, installation rates
false
Product and Service Analysis
Industrial & Manufacturing
Mixed Chart
Roland Berger
Add to my slides
Remove from favorites
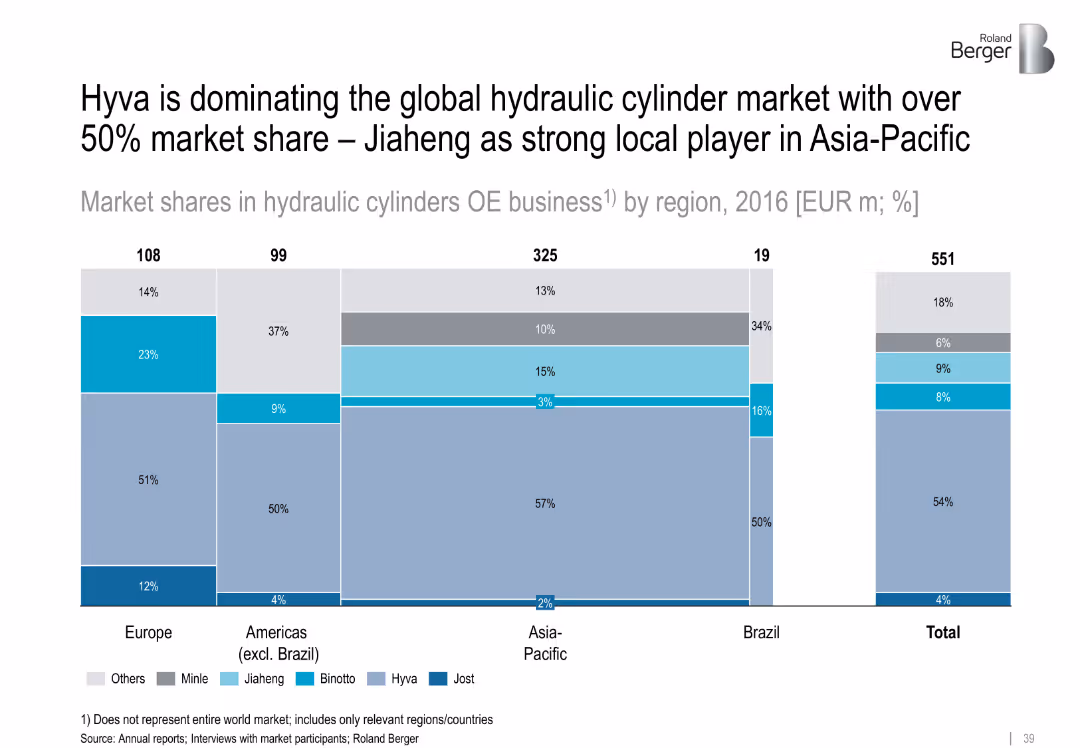
Segmented bar chart with regional breakdown (2016) for hydraulic cylinder OE market; company-specific market shares
Competitive Landscape
Transportation & Logistics
Hyva controls over half the global OE market for hydraulic cylinders, with strong positions across regions. Jiaheng is a notable regional competitor in Asia-Pacific. Overall market size is EUR 551m in 2016.
hydraulic cylinders, Hyva, Jiaheng, market dominance, regional players, OE business, market size
false
Competitive Landscape
Transportation & Logistics
Single Chart
Roland Berger
Add to my slides
Remove from favorites
Multiple line charts display Y/Y growth in four hydraulic markets: Industrial Machinery, Construction Equipment, Farm Machinery, Truck & Bus from 2012 to 2019.
Market Analysis and Trends
Industrial & Manufacturing
Analyzes yearly growth rates across several hydraulic markets, showing trends over time, useful for market analysis and understanding sector health.
hydraulics, industrial, construction, machinery, growth
false
Market Analysis and Trends
Industrial & Manufacturing
Single Chart
Deutsche Bank
Add to my slides
Remove from favorites
Displays column charts breaking down export potentials and timelines for ammonia and hydrogen from Chile to various regions.
Market Analysis and Trends
Energy & Utilities
Analyzes export potentials for Chile in hydrogen and ammonia, forecasting growth and identifying key markets.
hydrogen, ammonia, exports, Chile, market size, LATAM, Europe, Asia
false
Market Analysis and Trends
Energy & Utilities
Multiple Chart
McKinsey
Add to my slides
Remove from favorites
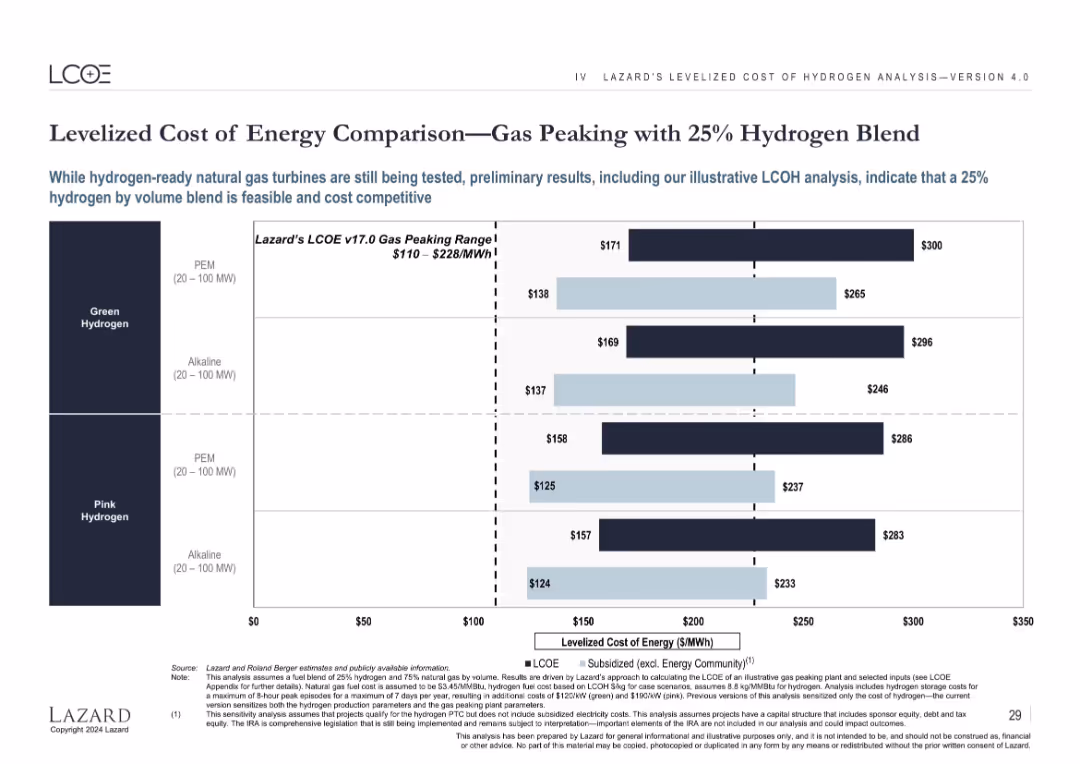
Bar chart comparing blended hydrogen LCOE with historical gas peaking ranges, showing cost competitiveness.
Strategic Planning
Energy & Utilities
Demonstrates the feasibility and cost competitiveness of blending 25% hydrogen with natural gas for peaking power plants. Compares four configurations of green and pink hydrogen sources and places them in context with Lazard’s historical gas peaking LCOE range.
hydrogen blend, gas peaking, energy cost, LCOE, PEM, alkaline, green hydrogen, pink
false
Strategic Planning
Energy & Utilities
Single Chart
Roland Berger
Add to my slides
Remove from favorites
Contains a prioritization matrix with bubbles representing market potential, plotted against uncertainty and cost evolution from 2025 to 2035.
Strategic Planning
Energy & Utilities
Predicts the economic timeline for hydrogen applications in transport and industry, focusing on domestic and export markets.
hydrogen, breakeven, ammonia, FCEV, export, domestic, market
false
Strategic Planning
Energy & Utilities
Mixed Chart
McKinsey
Add to my slides
Remove from favorites
Lists key factors (financing, regulation, infrastructure, etc.) affecting hydrogen projects, using icons and brief descriptions.
Regulatory and Compliance
Energy & Utilities
Discusses critical factors that could influence the success of hydrogen projects, useful for planning and compliance strategies.
hydrogen, business cases, financing, regulation, infrastructure, R&D, labor
false
Regulatory and Compliance
Energy & Utilities
Table
McKinsey
Add to my slides
Remove from favorites
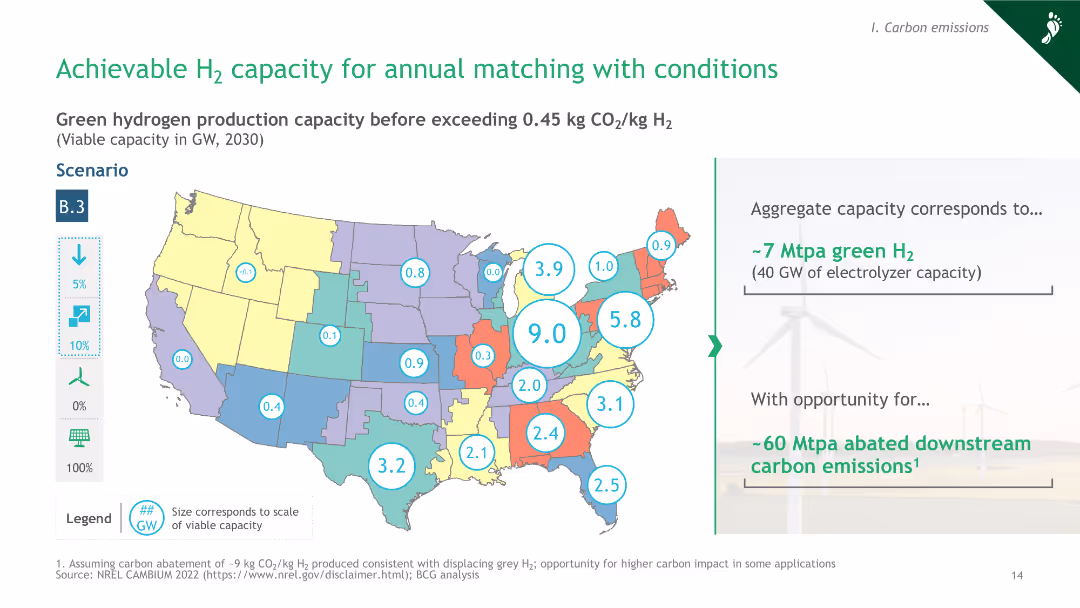
A map of the United States with color-coded states and numerical data points indicating green hydrogen production capacity, along with a column chart.
Market Analysis and Trends
Energy & Utilities
The slide presents a scenario analysis of green hydrogen production capacity across the U.S., projecting viable capacity before exceeding CO2 limits.
hydrogen, capacity, carbon emissions, scenario, 2030
false
Market Analysis and Trends
Energy & Utilities
Graphic
BCG
Add to my slides
Remove from favorites
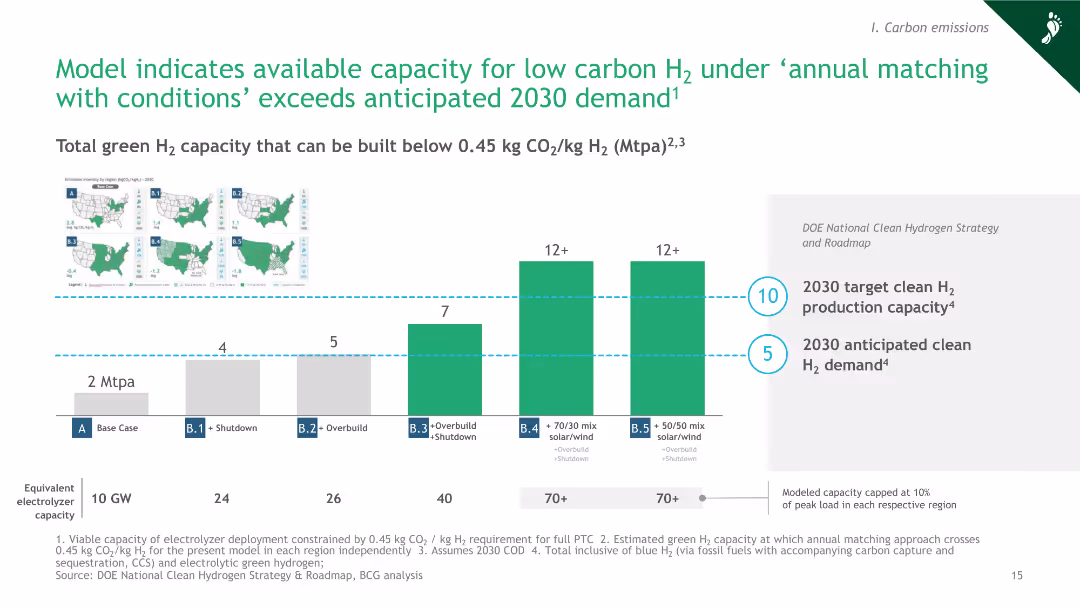
A column chart illustrating various scenarios of green hydrogen capacity under different conditions, with a comparison to target production capacity.
Market Analysis and Trends
Energy & Utilities
It highlights green hydrogen capacity projections under different scenarios and compares these against the 2030 target for clean H2 production.
hydrogen, capacity, production, 2030, comparison
false
Market Analysis and Trends
Energy & Utilities
Mixed Chart
BCG
Add to my slides
Remove from favorites
The slide features a column chart comparing the estimated levelized cost of hydrogen from different sources for 2019 and 2050. It includes a mix of gray and purple bars to indicate different hydrogen production methods.
Market Analysis and Trends
Energy & Utilities
The slide discusses the competitiveness of fossil fuels with CCUS (Carbon Capture, Utilization, and Storage) in hydrogen production compared to other methods considering low carbon electricity prices.
hydrogen, CCUS, cost comparison, fossil fuels, green hydrogen
false
Market Analysis and Trends
Energy & Utilities
Single Chart
Kearney
Add to my slides
Remove from favorites
The slide includes images of ammonia and methanol production plants, a pie chart, and detailed text on the hydrogen market trends and sources.
Market Analysis and Trends
Energy & Utilities
The slide discusses hydrogen consumption in the chemicals industry, focusing on ammonia and methanol synthesis, market trends, and sources of hydrogen within the industry.
hydrogen, chemicals, ammonia, methanol, synthesis, market trends, case study
false
Market Analysis and Trends
Energy & Utilities
Mixed Chart
Kearney
Add to my slides
Remove from favorites
A vertical column chart showing hydrogen consumption by category. The categories include oil refining, ammonia production, steel production, methanol production, and others.
Market Analysis and Trends
Energy & Utilities
The slide highlights the hydrogen consumption by different industries, with a focus on chemicals, oil refining, and steel industries, presenting data from 2018.
hydrogen, consumption, industry, chemicals, oil refining, steel, market analysis, data, column chart
false
Market Analysis and Trends
Energy & Utilities
Single Chart
Kearney
Add to my slides
Remove from favorites
A vertical column chart projecting hydrogen consumption by 2050 in various sectors, including mobility, industrial energy, and power generation.
Market Analysis and Trends
Energy & Utilities
The slide projects potential hydrogen consumption by 2050, emphasizing industrial processes and transportation as key drivers for the increase, with detailed numerical data.
hydrogen, consumption, projection, 2050, industry, transportation, energy, column chart, data
false
Market Analysis and Trends
Energy & Utilities
Single Chart
Kearney
Add to my slides
Remove from favorites
Includes a detailed diagram categorizing H2 production technologies by primary source and conversion technology, along with associated hydrogen categories.
Technology and Digital Transformation
Energy & Utilities
Outlines different hydrogen production technologies, categorized into thermochemical, electrolysis, microbial, and photolytic methods, and their respective applications.
Hydrogen, conversion technologies, thermochemical, electrolysis, production methods
false
Technology and Digital Transformation
Energy & Utilities
Diagram
Kearney
Add to my slides
Remove from favorites
The slide presents a table with multiple columns and rows detailing material-based technologies for hydrogen conversion, including their density, energy input, process maturity, advantages, and disadvantages. It uses color coding to differentiate technology advantages (Low, Medium, High).
Market Analysis and Trends
Energy & Utilities
This slide offers a comprehensive comparison of various hydrogen conversion and reconversion technologies. It includes key metrics like density, energy input, and process maturity, along with a summary of advantages and disadvantages for each technology.
Hydrogen, Conversion, Technology, Energy, Advantages
false
Market Analysis and Trends
Energy & Utilities
Table
Kearney
Add to my slides
Remove from favorites
Contains a column chart comparing H2/CO ratios across different production methods, with key comments on the right explaining the implications of these ratios.
Technology and Digital Transformation
Energy & Utilities
Highlights the importance of the H2/CO ratio in hydrogen production, comparing different methods and discussing the impact on end applications and flexibility.
Hydrogen, CO ratio, production methods, flexibility, end applications
false
Technology and Digital Transformation
Energy & Utilities
Mixed Chart
Kearney
Add to my slides
Remove from favorites
Column chart comparing levelized costs of green and pink hydrogen production, with and without subsidies, across different production technologies.
Financial Performance
Energy & Utilities
The slide illustrates the levelized costs of producing green and pink hydrogen, showing cost differences based on subsidies and production technologies.
Hydrogen, Cost analysis, Green hydrogen, Pink hydrogen, Subsidies
false
Financial Performance
Energy & Utilities
Single Chart
Roland Berger
Add to my slides
Remove from favorites
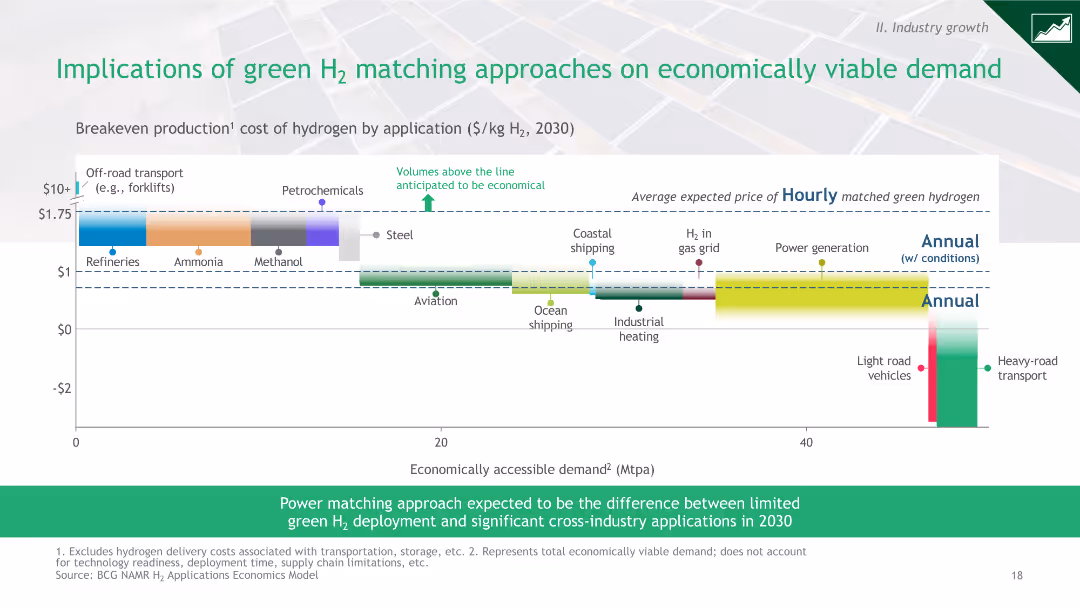
A bar chart showing the breakeven production cost of hydrogen by application in 2030, highlighting economic viability across different sectors.
Market Analysis and Trends
Energy & Utilities
The slide analyzes the economic implications of green hydrogen production costs across various applications, identifying which are economically viable.
hydrogen, cost, applications, economic viability, 2030
false
Market Analysis and Trends
Energy & Utilities
Mixed Chart
BCG
Add to my slides
Remove from favorites
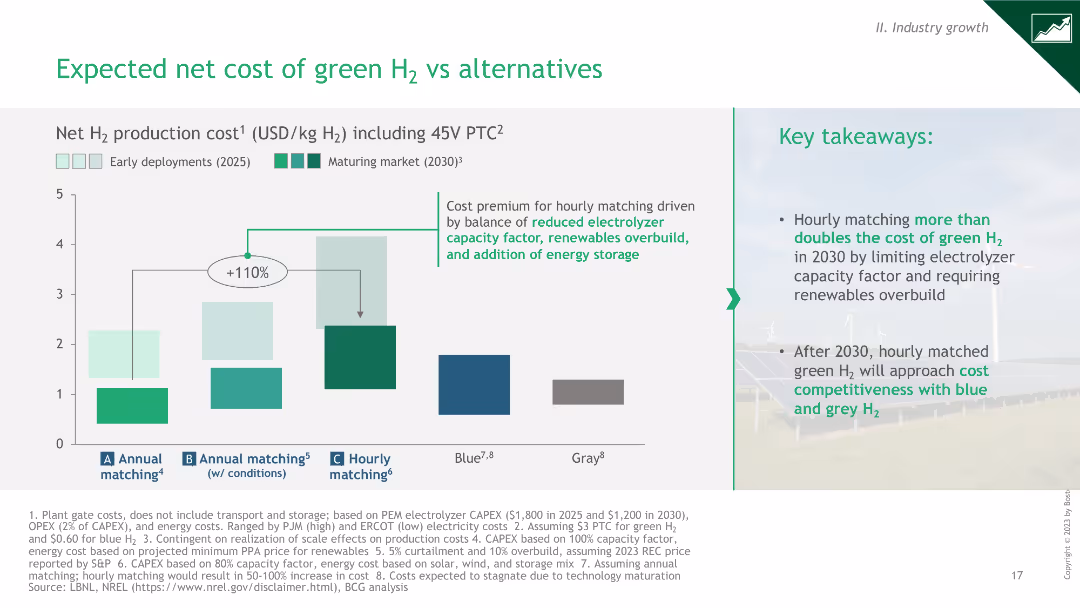
A column chart showing the net production cost of green hydrogen, including a comparison between early deployments and maturing market costs by 2030.
Financial Performance
Energy & Utilities
This slide compares the net production costs of green hydrogen with other alternatives, focusing on cost trends from 2025 to 2030 under different scenarios.
hydrogen, cost, comparison, market, 2030
false
Financial Performance
Energy & Utilities
Mixed Chart
BCG
Add to my slides
Remove from favorites
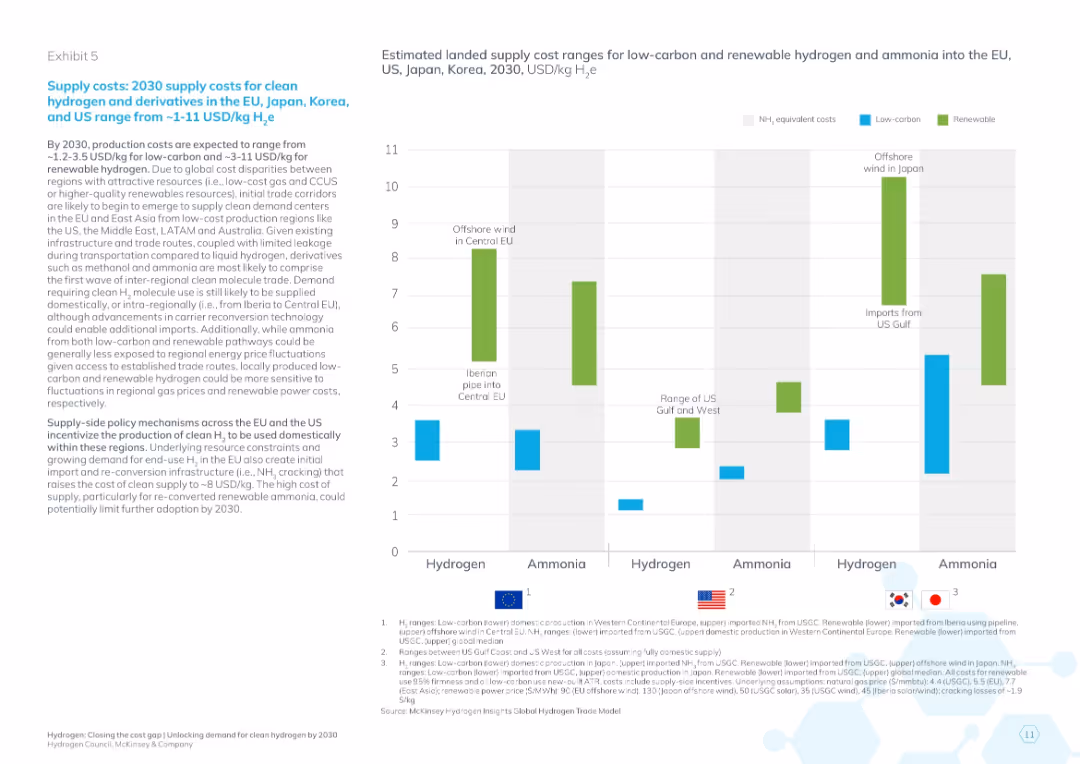
Text on the left discusses 2030 supply cost ranges; right side has a bar graph comparing hydrogen and ammonia cost ranges by source and geography.
Pricing Strategies
Energy & Utilities
Analyzes expected 2030 supply costs of clean hydrogen and derivatives across regions. Visualizes cost differences between low-carbon and renewable sources, emphasizing cost competitiveness by region.
hydrogen cost, renewable supply, EU energy, pricing strategy, ammonia, 2030 projections, energy policy, regional comparison, low-carbon fuels
false
Pricing Strategies
Energy & Utilities
Mixed Chart
McKinsey
Add to my slides
Remove from favorites
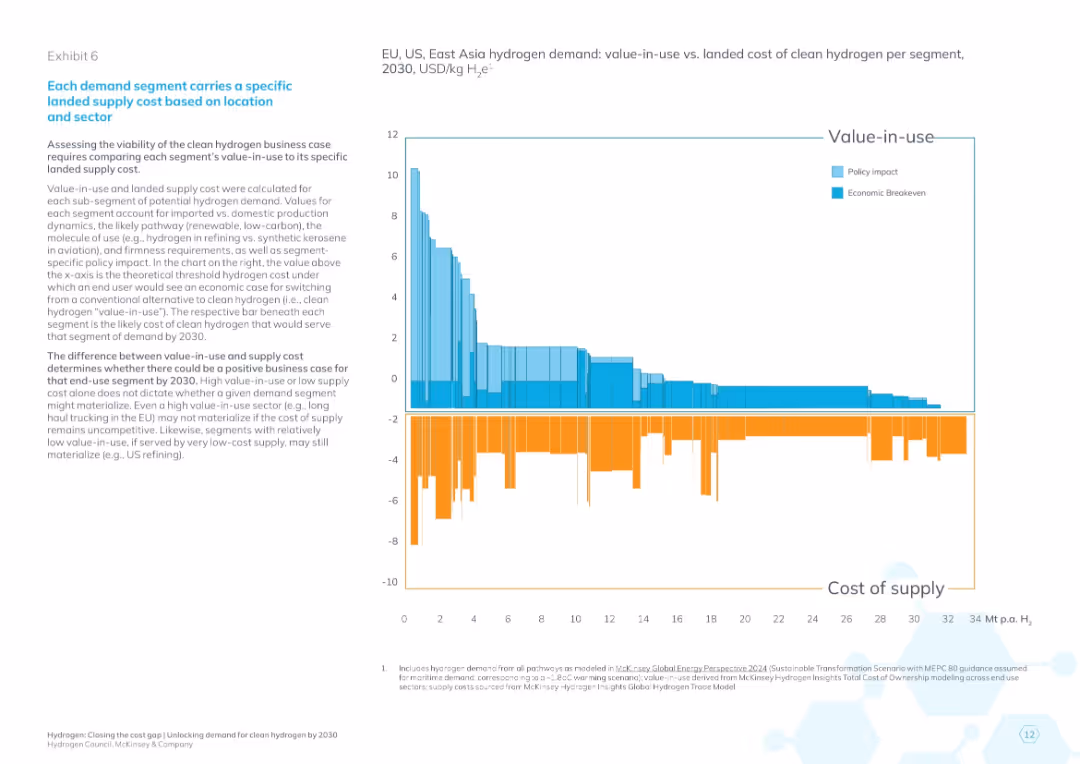
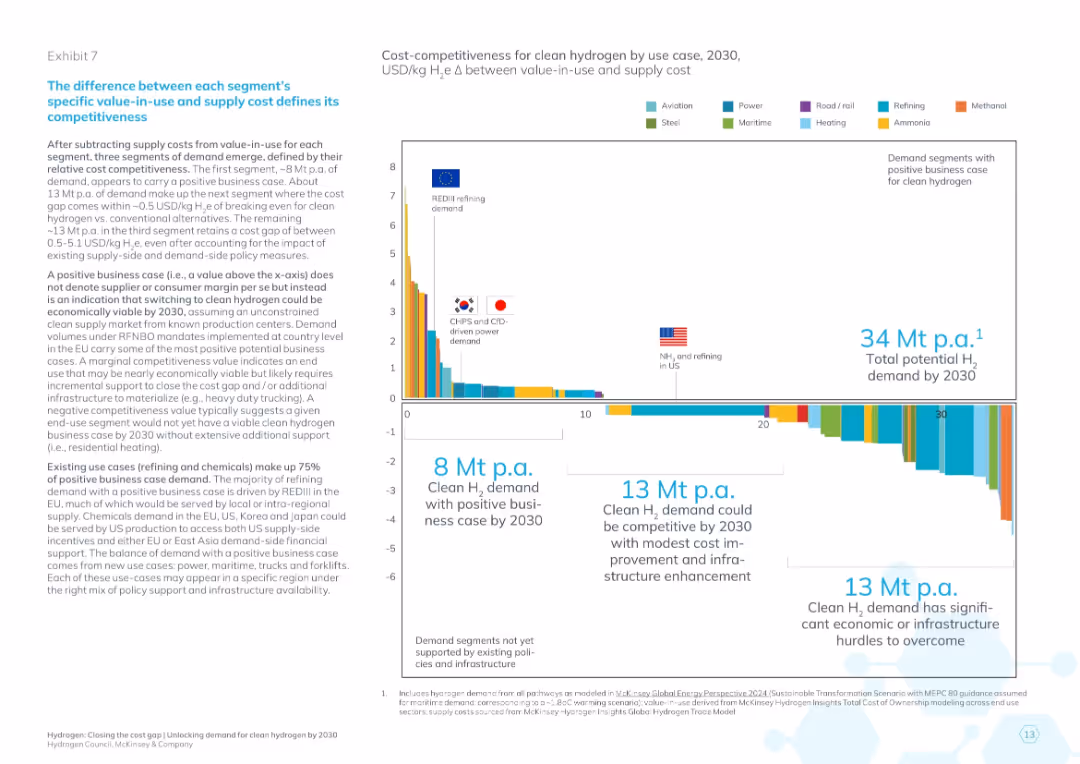
Bar chart with color-coded bars (light/dark blue above x-axis for value-in-use, orange below for cost of supply), descriptive text left, large title header
Investment Analysis
Energy & Utilities
The slide compares hydrogen's value-in-use against its cost of supply across different segments and geographies (EU, US, East Asia) projected to 2030. It visually assesses the economic viability of hydrogen adoption using breakeven and policy-adjusted thresholds, identifying segments where business cases exist or require support.
hydrogen cost, value-in-use, breakeven, policy impact, segment economics, 2030 projection, clean energy, EU US Asia, investment decision
false
Investment Analysis
Energy & Utilities
Mixed Chart
McKinsey
Add to my slides
Remove from favorites
Contains a process diagram of dark fermentation, supported by text descriptions of the biochemical reactions involved, along with pros, cons, and key feature estimates.
Technology and Digital Transformation
Energy & Utilities
Describes dark fermentation as a method of hydrogen production from organic matter, detailing the biochemical reactions, process steps, and advantages and disadvantages.
Hydrogen, dark fermentation, biochemical reactions, organic matter, production process
false
Technology and Digital Transformation
Energy & Utilities
Diagram
Kearney
Add to my slides
Remove from favorites
Contains a matrix comparing potential applications of various decarbonization technologies, including hydrogen, across different sectors consuming fossil fuels.
Competitive Landscape
Energy & Utilities
Compares hydrogen's role and applicability with other decarbonization technologies in sectors like aviation, shipping, rail, trucks, industry, and power.
Hydrogen, decarbonization, low carbon, fossil fuels, competitive analysis
false
Competitive Landscape
Energy & Utilities
Table
Kearney
Add to my slides
Remove from favorites
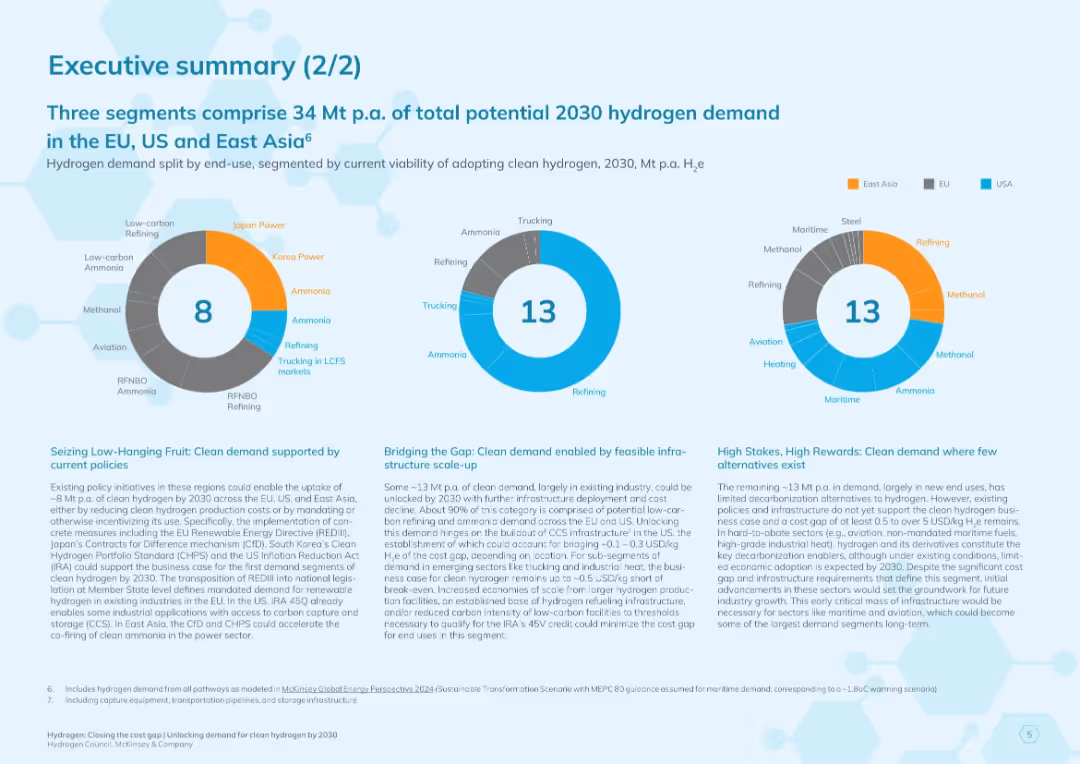
Blue-themed slide with three donut charts labeled with segment values (8, 13, 13). Bottom contains three text blocks summarizing segment potential and clean hydrogen adoption.
Market Analysis and Trends
Energy & Utilities
Summarizes three segments contributing to 2030 hydrogen demand across EU, US, and East Asia. Uses charts to split by feasibility and policy support. Describes strategic implications for hydrogen deployment.
hydrogen demand, clean energy, 2030 projections, East Asia, EU, USA, policy support, energy infrastructure, ammonia, refining
false
Market Analysis and Trends
Energy & Utilities
Multiple Chart
McKinsey
Add to my slides
Remove from favorites
Infographic with forecasted US hydrogen demand across various sectors, accompanied by a description of hydrogen types and their applications in the power sector.
Market Analysis and Trends
Energy & Utilities
The slide discusses the forecasted demand for hydrogen in the US, breaking down usage by sector and explaining different types of hydrogen and their power sector applications.
Hydrogen, Demand forecast, Economy, Power sector, Applications
false
Market Analysis and Trends
Energy & Utilities
Mixed Chart
Roland Berger
Add to my slides
Remove from favorites
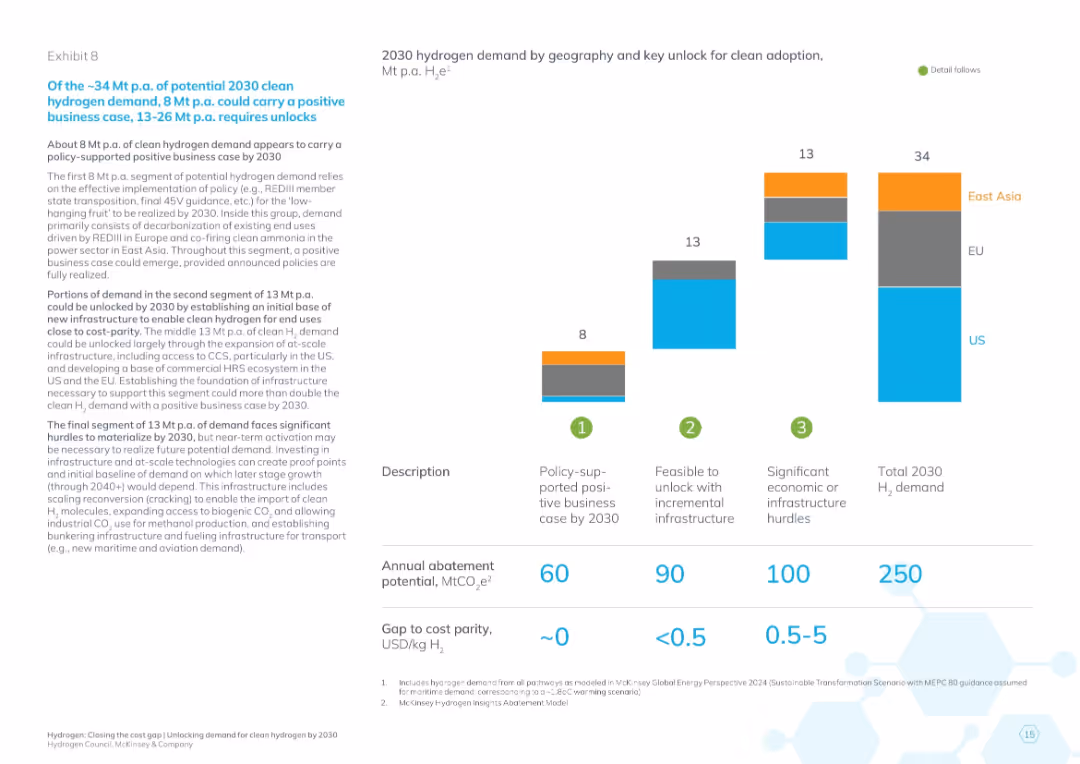
Stacked bar chart of H₂ demand by region (US, EU, East Asia) and business case viability; table below with abatement and cost gap metrics
Strategic Planning
Energy & Utilities
The slide breaks down 2030 hydrogen demand by geography and the policy or infrastructure required to unlock its potential. It classifies 34 Mt of demand into policy-supported, feasible with incremental infrastructure, and requiring significant unlocks, quantifying potential CO₂ abatement and cost gaps for each.
hydrogen demand, policy support, infrastructure unlock, CO₂ abatement, cost parity, 2030 forecast, regional demand
false
Strategic Planning
Energy & Utilities
Mixed Chart
McKinsey
Add to my slides
Remove from favorites
Features bar graphs highlighting hydrogen demand changes by sector from 2019 to 2050, using a blue color scheme.
Market Analysis and Trends
Energy & Utilities
Analyzes sector-specific growth in hydrogen demand up to 2050, useful for market analysis in energy and industrial sectors considering a shift towards low-carbon solutions.
Hydrogen Demand, Sector Growth, 2050 Forecast, Market Analysis, Low-Carbon Transition
false
Market Analysis and Trends
Energy & Utilities
Single Chart
McKinsey
Add to my slides
Remove from favorites
Visualizes application timelines using horizontal bars across a timeline from 2020 to 2040, detailing stages like pilot starts and full ramp-ups.
Operational Efficiency
Energy & Utilities
Shows the anticipated domestic rollout of hydrogen applications in sectors like refining and transport.
hydrogen, domestic, application, rollout, mining, trucks, fertilizers
false
Operational Efficiency
Energy & Utilities
Multiple Chart
McKinsey
Add to my slides
Remove from favorites
Combines column charts and line graphs depicting hydrogen uptake volumes and percentages across various applications up to 2050.
Performance Metrics and KPIs
Energy & Utilities
Analyzes projected hydrogen consumption for domestic applications, highlighting growth areas like mining and public transport.
hydrogen, domestic, uptake, mining, trucks, buses, refineries
false
Performance Metrics and KPIs
Energy & Utilities
Multiple Chart
McKinsey
Add to my slides
Remove from favorites
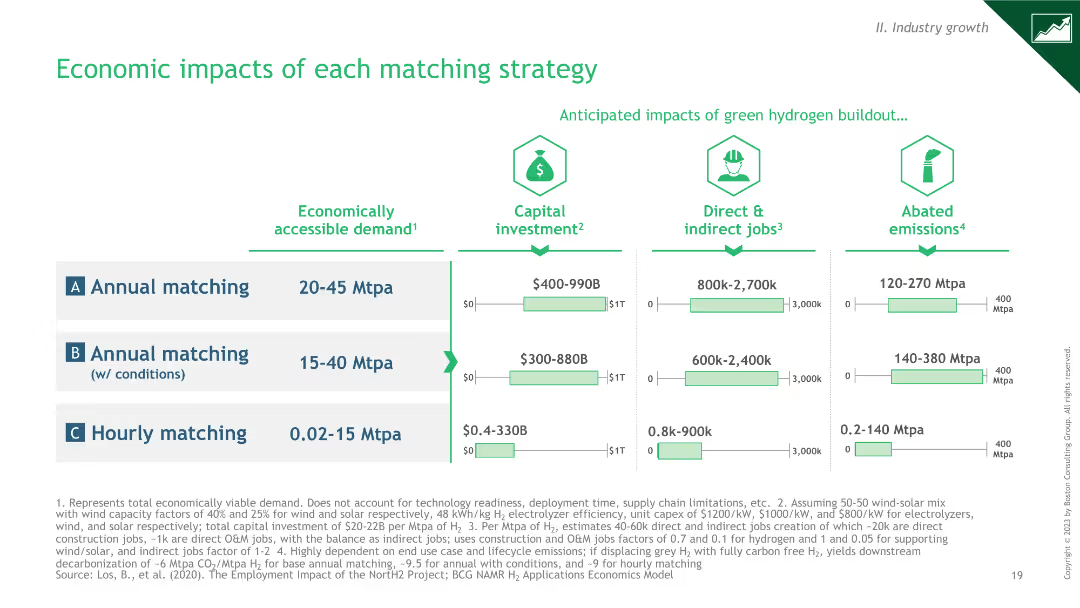
A comparative chart illustrating the economic impacts of different green hydrogen matching strategies, including demand, investment, and job impacts.
Financial Performance
Energy & Utilities
It assesses the economic impacts of different green hydrogen production matching strategies, focusing on demand, capital investment, and job creation.
hydrogen, economic impact, strategies, investment, jobs
false
Financial Performance
Energy & Utilities
Multiple Chart
BCG
Add to my slides
Remove from favorites
Features a timeline illustrating the history of hydrogen production technologies from the 1800s to the present, using boxes to highlight key milestones and developments.
Technology and Digital Transformation
Energy & Utilities
Describes the historical progression of hydrogen production technologies, emphasizing the shift from electrolysis to fossil fuel-based methods in the 1970s.
Hydrogen, electrolysis, fossil fuels, timeline, production technologies
false
Technology and Digital Transformation
Energy & Utilities
Linear Flow
Kearney
Add to my slides
Remove from favorites
The slide includes a segmented bar chart on the left for GHG emissions by segment and a table on the right detailing hydrogen use cases and substitution methods.
Technology and Digital Transformation
Energy & Utilities
Details how hydrogen can be used to decarbonize sectors responsible for over 65% of global emissions, with specific use cases and substitution methods highlighted.
Hydrogen, emissions, decarbonization, energy transition, GHG
false
Technology and Digital Transformation
Energy & Utilities
Mixed Chart
Kearney
Add to my slides
Remove from favorites
The slide includes a detailed text description, bullet points, and a graph comparing specific energy and energy density of various fuels.
Technology and Digital Transformation
Energy & Utilities
Provides an overview of hydrogen's properties, advantages, disadvantages, and physical properties, emphasizing its high energy density and applications.
Hydrogen, energy density, properties, advantages, disadvantages
false
Technology and Digital Transformation
Energy & Utilities
Mixed Chart
Kearney
Add to my slides
Remove from favorites
Slide includes diagrams and text comparing production methods of grey, blue, and green hydrogen, highlighting CO2 emissions and investment requirements.
Strategic Planning
Energy & Utilities
Provides an overview of different hydrogen production methods with a focus on their potential, investment needs, and carbon footprint, relevant for strategic planning in energy sector.
hydrogen, energy, low-carbon, investment, production methods, CO2 emissions
false
Strategic Planning
Energy & Utilities
Table
McKinsey
Add to my slides
Remove from favorites
The slide features a flowchart diagram divided into two main categories: Physical transformation and Chemical combination, showing various methods of hydrogen conditioning such as Compression, Liquefaction, Chemical H₂, LOHC, Interstitial hydride, Complex hydride, and Adsorbent.
Technology and Digital Transformation
Energy & Utilities
The slide describes the process of hydrogen conditioning to increase energy density before storage and transport. It outlines physical and chemical transformation methods including compression, liquefaction, and various chemical combinations.
Hydrogen, Energy, Storage, Conditioning, Transport
false
Technology and Digital Transformation
Energy & Utilities
Diagram
Kearney
Add to my slides
Remove from favorites
Simplified value chain diagram of hydrogen-based energy conversion solutions with various flow elements like gas network, power network, and liquid fuel network.
Technology and Digital Transformation
Energy & Utilities
Illustrates the role of hydrogen in the energy transition, linking multiple energy sources and industrial applications through a comprehensive value chain diagram.
Hydrogen, energy transition, value chain, energy sources, industrial applications
false
Technology and Digital Transformation
Energy & Utilities
Diagram
Kearney
Add to my slides
Remove from favorites
This slide features column charts, a pie chart, and bullet-point text. The layout is divided into three columns detailing the EU’s hydrogen strategy and its investment needs.
Industry Overview
Energy & Utilities
The slide outlines the European Union's hydrogen strategy, key action areas, and investment plans through 2050, aimed at achieving a climate-neutral Europe by promoting green hydrogen solutions.
Hydrogen, EU, Investment, Strategy, Climate
false
Industry Overview
Energy & Utilities
Multiple Chart
McKinsey
Add to my slides
Remove from favorites
The slide is divided into sections detailing objectives, policy change propositions, and focuses on the European Union. Includes a map and objectives for decarbonizing various sectors.
Regulatory and Compliance
Government & Public Sector
Discusses the HyLaw initiative launched by Hydrogen Europe to identify and address legal barriers to hydrogen deployment, focusing on policy changes and integration in the EU.
Hydrogen Europe, HyLaw, legal barriers, policy changes, EU, decarbonization, integration, objectives
false
Regulatory and Compliance
Government & Public Sector
Table
Kearney
Add to my slides
Remove from favorites
Discusses factors impacting Chile’s competitiveness in hydrogen exports, illustrated with a comparative column chart.
Competitive Landscape
Energy & Utilities
Evaluates competitive factors for Chile in the hydrogen market, considering production and transportation costs.
hydrogen, export, competitiveness, Chile, production costs, market share
false
Competitive Landscape
Energy & Utilities
Mixed Chart
McKinsey
Add to my slides
Remove from favorites
Presents potential hydrogen demand across countries using column charts, with scenarios up to 2050.
Strategic Planning
Energy & Utilities
Details Chile’s potential as a hydrogen exporter, considering demand forecasts in key global markets.
hydrogen, exports, Chile, demand, markets, Japan, EU, USA
false
Strategic Planning
Energy & Utilities
Multiple Chart
McKinsey
Add to my slides
Remove from favorites
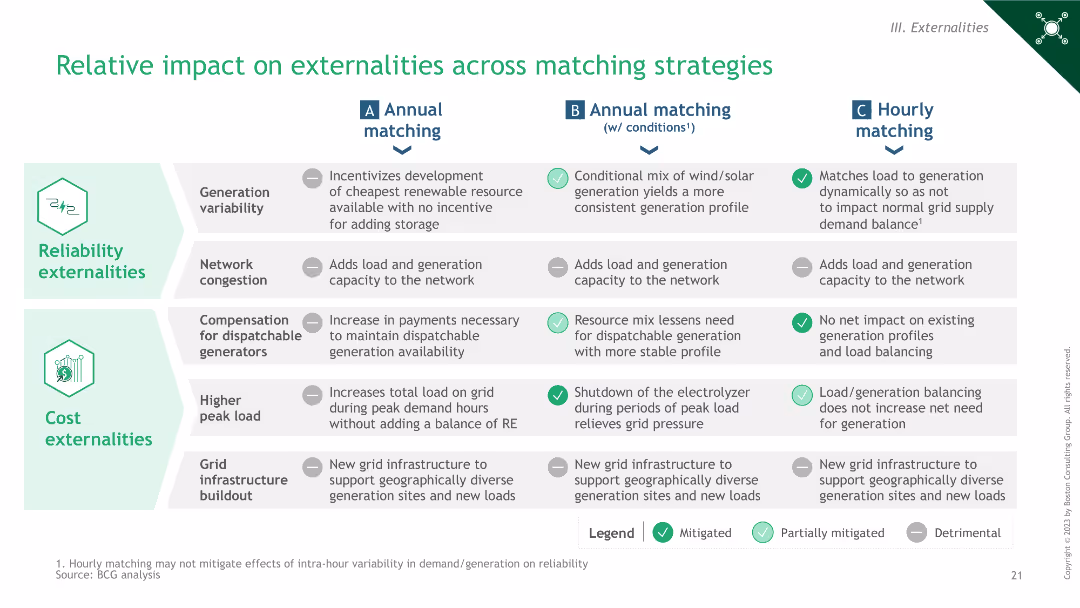
A comparative table showing the relative impact on externalities like reliability and cost for different green hydrogen matching strategies.
Risk Assessment and Management
Energy & Utilities
This slide compares the relative impact on externalities such as reliability and cost across different hydrogen matching strategies.
hydrogen, externalities, comparison, reliability, cost
false
Risk Assessment and Management
Energy & Utilities
Table
BCG
Add to my slides
Remove from favorites
This slide utilizes a two-column layout with a list of capabilities required on the left, paired with key disruption points presented as bullet points on the right. Icons accompany each disruption point for visual emphasis. The slide uses a mix of bullet points and statistics, complemented by a blue and black color scheme.
Regulatory and Compliance
Energy & Utilities
The slide outlines the role of hydrogen-based fuels in transforming the energy sector. It outlines required reductions in production costs, increased production efficiency, and infrastructure development for scaling hydrogen production. The content is critical for understanding the regulatory and compliance aspects within the energy sector, projecting the share of green hydrogen in final energy consumption by 2050 and its impact on decarbonization efforts. Target audiences include industry experts, policymakers, and stakeholders looking at the future role of hydrogen in meeting energy demands and sustainability goals.
hydrogen fuels, production costs, efficiency, infrastructure development, green hydrogen, energy consumption, decarbonization, regulatory, sustainability, industry impact
false
Regulatory and Compliance
Energy & Utilities
Boxed
McKinsey
Add to my slides
Remove from favorites
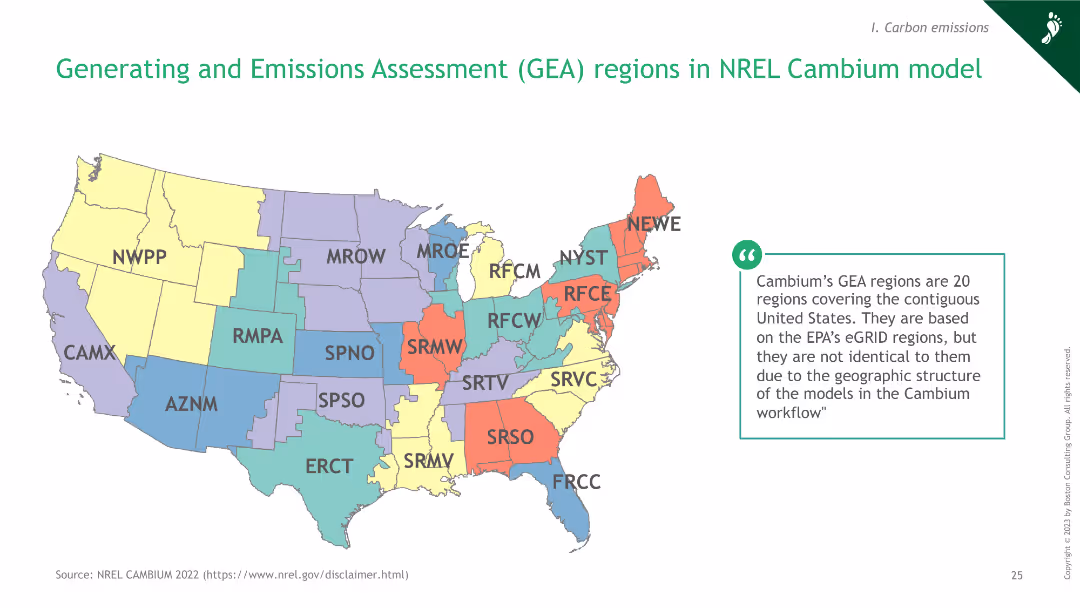
A map of the United States showing the Generating and Emissions Assessment regions as defined by the NREL Cambium model.
Regulatory and Compliance
Energy & Utilities
The slide presents the GEA regions within the NREL Cambium model, outlining the regional coverage for emissions and generation assessments.
hydrogen, GEA, regions, NREL, emissions
false
Regulatory and Compliance
Energy & Utilities
Graphic
BCG
Add to my slides
Remove from favorites
Slide contains a bar chart showing hydrogen production costs over time comparing grey, blue, and green hydrogen.
Investment Analysis
Energy & Utilities
Analyzes cost trends in hydrogen production, emphasizing the economic shift towards green hydrogen as a viable future investment in energy.
hydrogen, green energy, cost trends, investment analysis, energy sector
false
Investment Analysis
Energy & Utilities
Linear Flow
McKinsey
Add to my slides
Remove from favorites
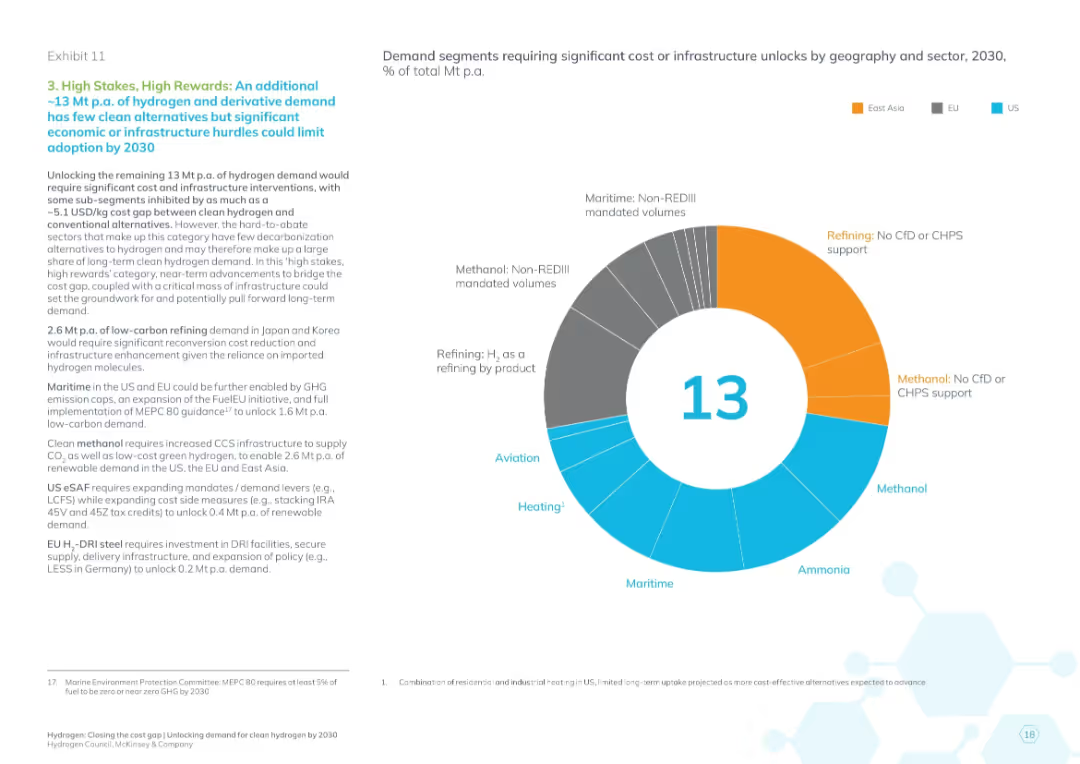
Donut chart of 13 Mt demand showing high unlock effort segments; explanatory text left with sector detail
Risk Assessment and Management
Energy & Utilities
This slide highlights the most difficult segments to unlock for clean hydrogen, requiring high cost reductions or infrastructure buildout. It includes aviation, maritime, heating, and methanol sectors. Despite high potential, economic and logistical barriers may limit 2030 adoption.
hydrogen hurdles, high cost gap, aviation, maritime, methanol, infrastructure challenge, hard-to-abate
false
Risk Assessment and Management
Energy & Utilities
Mixed Chart
McKinsey
Add to my slides
Remove from favorites
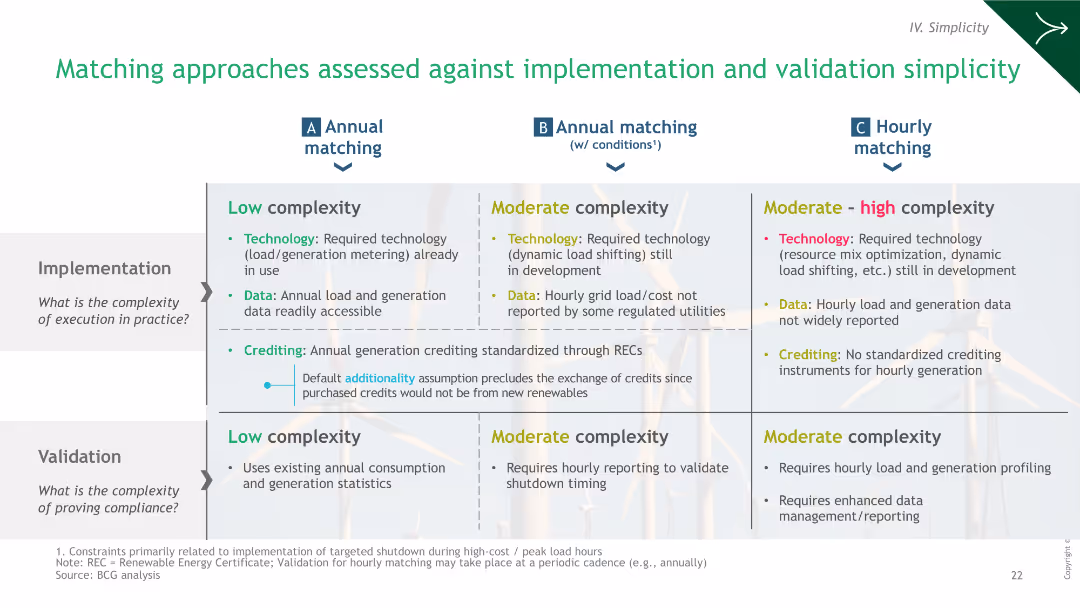
A comparative table evaluating the complexity of implementation and validation of different green hydrogen matching strategies.
Operational Efficiency
Energy & Utilities
The slide evaluates the implementation and validation complexities of different hydrogen matching approaches, assessing technology, data, and crediting.
hydrogen, implementation, validation, strategies, complexity
false
Operational Efficiency
Energy & Utilities
Table
BCG
Add to my slides
Remove from favorites
Slide presents a timeline showing significant events and milestones in the hydrogen industry from 2018 onwards.
Market Analysis and Trends
Energy & Utilities
Provides a historical timeline of key developments in the hydrogen industry, highlighting its growing momentum and relevance for strategic market analysis.
hydrogen industry, timeline, market development, strategic analysis, energy trends
false
Market Analysis and Trends
Energy & Utilities
Linear Flow
McKinsey
Add to my slides
Remove from favorites
The slide features a column chart and lists safety and performance issues related to hydrogen injection potential. It is moderately detailed with clear safety metrics.
Technology and Digital Transformation
Energy & Utilities
Addresses the limitations and potential of hydrogen injection into gas networks, focusing on safety, performance, and end-use applications.
hydrogen injection, safety, performance, gas networks, limitations, end applications, potential, transformation
false
Technology and Digital Transformation
Energy & Utilities
Mixed Chart
Kearney
Add to my slides
Remove from favorites
Features a timeline of major mergers, acquisitions, joint ventures, and partnerships in hydrogen technology from 2016 to 2019. Key events are highlighted with brief descriptions.
Mergers and Acquisitions
Energy & Utilities
Details the increasing interest of large corporations in hydrogen technology through various strategic partnerships and acquisitions over the years.
Hydrogen, M&A, joint ventures, partnerships, timeline, corporations, interest, technology
false
Mergers and Acquisitions
Energy & Utilities
Linear Flow
Kearney
Add to my slides
Remove from favorites
Features a column chart showing market size projections from 2025 to 2050 for domestic and international markets.
Market Analysis and Trends
Energy & Utilities
Outlines the growth trajectory of Chile’s hydrogen market, emphasizing the phased expansion and export potential.
hydrogen, market size, Chile, domestic, international, growth, projections
false
Market Analysis and Trends
Energy & Utilities
Single Chart
McKinsey
Add to my slides
Remove from favorites
Contains a detailed process diagram of steam methane reforming, supported by text descriptions of each step and key feature estimates in a table format.
Technology and Digital Transformation
Energy & Utilities
Explains the process of steam methane reforming, highlighting the steps involved in separating hydrogen from methane, along with the pros, cons, and key feature estimates.
Hydrogen, methane, steam reforming, CO2, production process
false
Technology and Digital Transformation
Energy & Utilities
Diagram
Kearney
Add to my slides
Remove from favorites
A column chart shows the levelized cost of hydrogen for mobility across different grid utilizations (wind, solar, grid wind, grid solar) for various capacities (1 MW, 10 MW, 100 MW) by 2030.
Market Analysis and Trends
Energy & Utilities
The slide discusses the potential for hydrogen to become competitive with internal combustion engine (ICE) fuels, noting the low levelized cost of hydrogen (LCOH) as low as $4 to $5 per kg.
hydrogen, mobility, levelized cost, grid, wind, solar, LCOH, ICE fuels, competitiveness, future cost
false
Market Analysis and Trends
Energy & Utilities
Multiple Chart
Kearney
Add to my slides
Remove from favorites
The slide features a mix of text boxes and images, including a pie chart and photographs of an HDS unit and a hydrocracking plant.
Market Analysis and Trends
Energy & Utilities
The slide details the hydrogen consumption in oil refining, including hydrotreatment and hydrocracking processes, market trends, and sources of hydrogen in oil refining.
hydrogen, oil refining, hydrotreatment, hydrocracking, consumption, market trends, case study
false
Market Analysis and Trends
Energy & Utilities
Mixed Chart
Kearney
Add to my slides
Remove from favorites
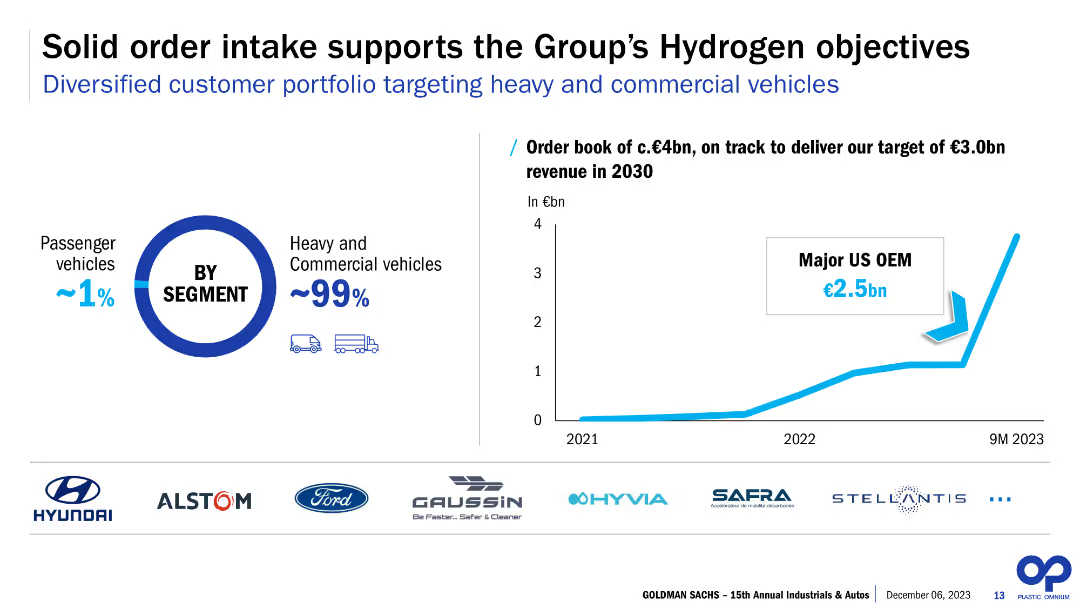
The slide features a column chart illustrating the order book from 2021 to 9M 2023, and a pie chart showing the segment distribution between passenger and commercial vehicles. It also lists logos of major clients and shows a projected revenue target for 2030.
Strategic Planning
Energy & Utilities
The slide discusses the solid order intake supporting Plastic Omnium’s hydrogen objectives, with a focus on heavy and commercial vehicles. It highlights major clients and sets a revenue target of €3.0bn by 2030, indicating strong future prospects and strategic planning in the hydrogen sector.
Hydrogen, order intake, commercial vehicles, passenger vehicles, revenue target, major clients, strategic planning, future prospects, Plastic Omnium, 2030
false
Strategic Planning
Energy & Utilities
Multiple Chart
Goldman Sachs
Add to my slides
Remove from favorites
The slide showcases a rising trend line chart for order intake over three years, with logos of major customers below. It includes a text box highlighting a significant order value from a major U.S. OEM. The design is straightforward with a clear focus on the upward trend, utilizing shades of blue and an accent color for the key figure.
Investment Analysis
Industrial & Manufacturing
It highlights the company's solid order intake, emphasizing its alignment with the group's hydrogen objectives. The focus on heavy and commercial vehicles, as indicated by the segment breakdown, suggests a strategic shift towards this market. This could be used to discuss investment potential in the hydrogen sector and the company's positioning for future revenue growth.
Hydrogen, Order Intake, Commercial Vehicles, Trend Line, Strategic Direction, Major Customers, Industrial, Revenue Projections
false
Investment Analysis
Industrial & Manufacturing
Multiple Chart
Goldman Sachs
Add to my slides
Remove from favorites
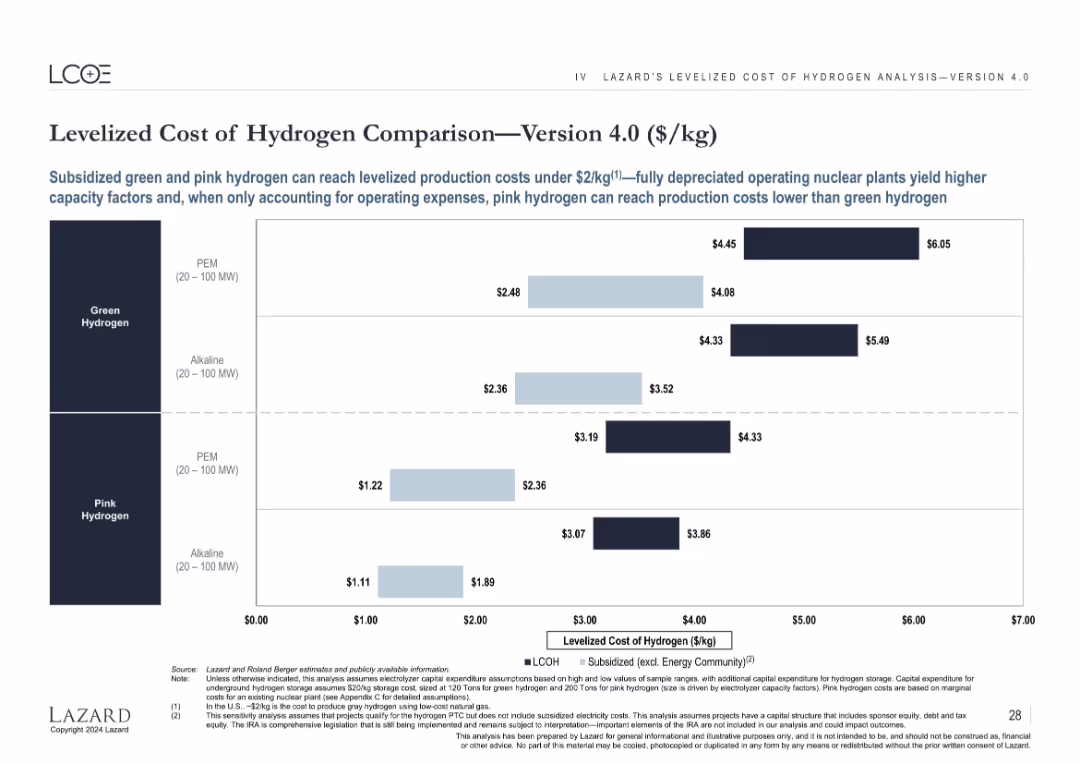
Bar chart comparing LCOH for green and pink hydrogen using PEM and alkaline tech, with/without subsidies.
Market Analysis and Trends
Energy & Utilities
Highlights cost differences for producing hydrogen via electrolysis, showing both subsidized and unsubsidized costs for green and pink hydrogen across PEM and alkaline technologies. Emphasizes how subsidies and technology type impact cost competitiveness.
hydrogen, PEM, alkaline, LCOH, green hydrogen, pink hydrogen, subsidies, electrolysis
false
Market Analysis and Trends
Energy & Utilities
Single Chart
Roland Berger
Add to my slides
Remove from favorites
Features a process diagram of photolytic conversion technologies, supported by text descriptions of the reactions and processes involved, along with pros, cons, and key features.
Technology and Digital Transformation
Energy & Utilities
Explains photolytic technologies for hydrogen production, focusing on converting sunlight into hydrogen, with details on the processes, pros, cons, and key features.
Hydrogen, photolytic conversion, sunlight, production technologies, renewable energy
false
Technology and Digital Transformation
Energy & Utilities
Graphic
Kearney
Add to my slides
Remove from favorites
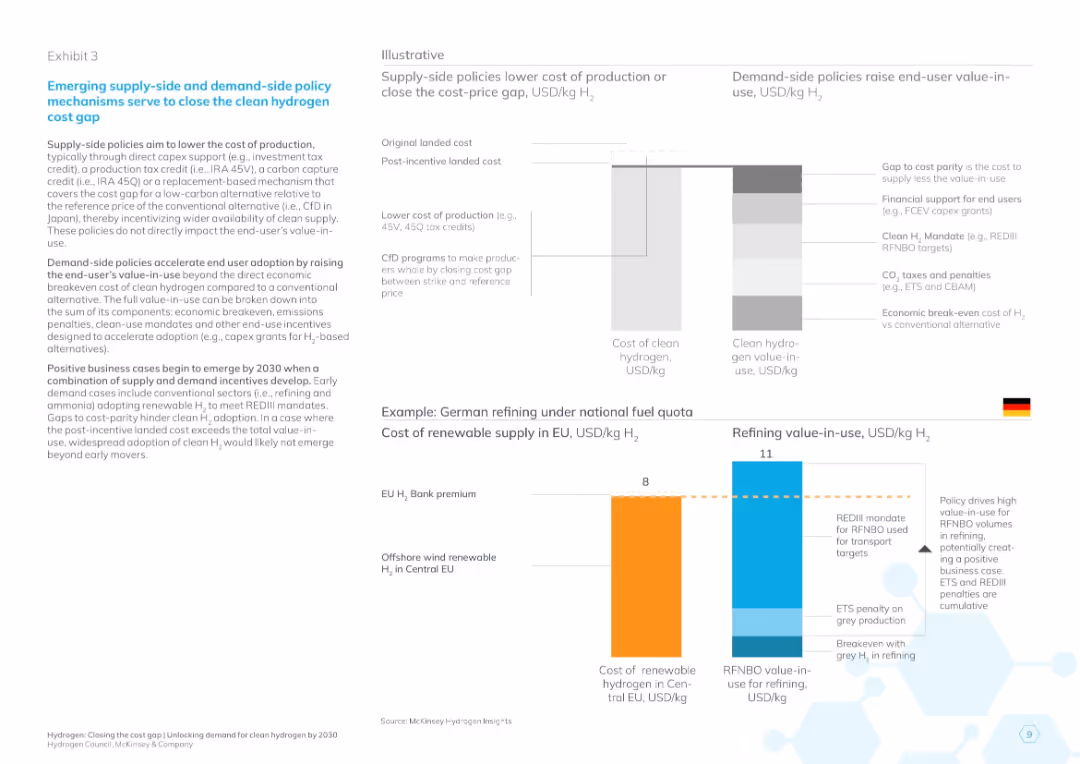
Left text explains policies; right side includes two diagrams: a bar visual of cost reductions and a Germany-focused comparison of hydrogen costs and value-in-use.
Regulatory and Compliance
Energy & Utilities
Explains supply- and demand-side policy mechanisms to narrow hydrogen cost gaps. Uses visual examples to illustrate how incentives can make clean hydrogen financially viable in sectors like German refining.
hydrogen policy, cost gap, value-in-use, subsidies, clean energy incentives, EU energy, Germany, REDIII, CFd, 2030 projections
false
Regulatory and Compliance
Energy & Utilities
Multiple Chart
McKinsey
Add to my slides
Remove from favorites
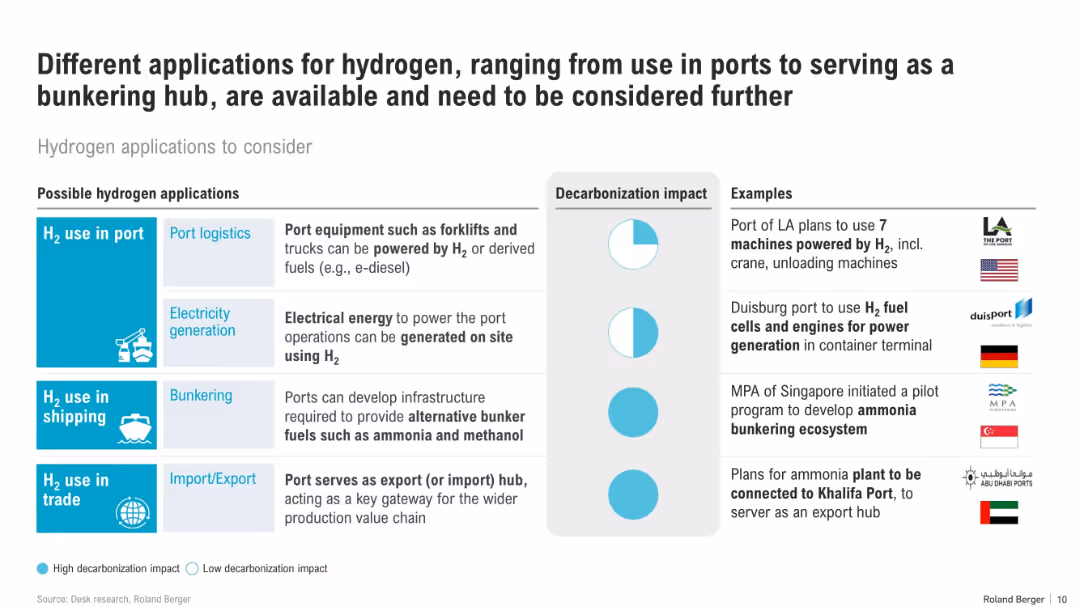
Table layout with rows for different hydrogen use cases, including icons, decarbonization impact ratings, and real-world examples.
Technology and Digital Transformation
Energy & Utilities
The slide categorizes hydrogen applications in port logistics, shipping, and trade, assessing their decarbonization potential. It features case studies from ports worldwide, such as LA, Duisburg, and Abu Dhabi.
hydrogen, ports, shipping, bunkering, H2 applications, decarbonization, logistics, fuel cell, global ports
false
Technology and Digital Transformation
Energy & Utilities
Mixed Chart
Roland Berger
Add to my slides
Remove from favorites
Features a column chart showing global hydrogen production by source and a text box with key considerations related to hydrogen production and CO2 emissions.
Market Analysis and Trends
Energy & Utilities
Explains the annual global hydrogen production and associated CO2 emissions, highlighting the predominance of fossil fuel-based production and its environmental impact.
Hydrogen production, CO2 emissions, fossil fuels, environmental impact, market trends
false
Market Analysis and Trends
Energy & Utilities
Multiple Chart
Kearney
Add to my slides
Remove from favorites
Includes a stacked chart displaying the levelized cost of hydrogen production over time, comparing different methods.
Financial Performance
Energy & Utilities
Analyzes how incentives impact the cost-effectiveness of hydrogen production methods, useful for financial planning in energy markets.
hydrogen production, cost analysis, incentives, energy market, financial planning, green energy
false
Financial Performance
Energy & Utilities
Multiple Chart
BCG
Add to my slides
Remove from favorites
Features a detailed diagram of the hydrogen value chain, including production technologies and applications across different sectors.
Technology and Digital Transformation
Energy & Utilities
Describes various hydrogen production technologies and their applications in different sectors, highlighting multiple pathways in the hydrogen value chain.
Hydrogen, production, value chain, technologies, applications
false
Technology and Digital Transformation
Energy & Utilities
Table
Kearney
Add to my slides
Remove from favorites
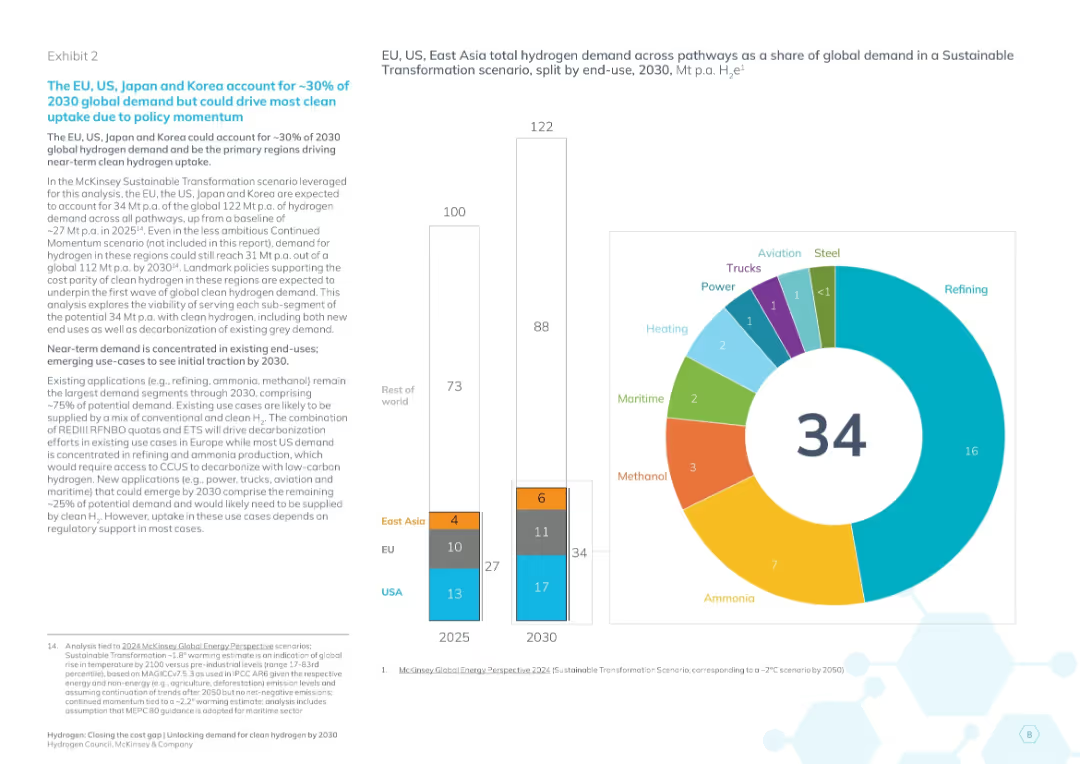
Left text column with hydrogen market narrative; right features bar chart and donut chart depicting hydrogen demand by geography and end-use for 2030.
Industry Overview
Energy & Utilities
Projects regional shares of global hydrogen demand by 2030, highlighting the roles of EU, US, and East Asia. Visualizes contribution across end-use sectors and geographies with detailed demand segmentation.
hydrogen projections, global demand, regional energy markets, end-use analysis, EU hydrogen, US hydrogen, East Asia energy, 2030 goals
false
Industry Overview
Energy & Utilities
Multiple Chart
McKinsey
Add to my slides
Remove from favorites
Slide features a world map pinpointing major hydrogen projects globally, supplemented by logos of participating companies.
Strategic Planning
Energy & Utilities
Highlights global investment in hydrogen projects, showing collaborations that aim to achieve technological and commercial maturity in the energy sector.
hydrogen projects, global investment, strategic planning, energy sector, industrial collaboration
false
Strategic Planning
Energy & Utilities
Graphic
McKinsey
Add to my slides
Remove from favorites
The slide shows a detailed timeline of hydrogen utilization projects for energy, fertilizers, and oil refining from 1980 to 2040. Purple bars indicate development and operational phases.
Strategic Planning
Energy & Utilities
The slide provides an overview of the expected timeline for various hydrogen utilization projects to come on stream, highlighting development and operational phases for different sectors.
hydrogen projects, timeline, energy, fertilizers, oil refining
false
Strategic Planning
Energy & Utilities
Single Chart
Kearney
Add to my slides
Remove from favorites
The slide features a comparative analysis with column charts illustrating refueling speed, space requirements, and investment costs for petrol, H2 station, and electric fast charger.
Operational Efficiency
Energy & Utilities
The slide compares hydrogen refueling with petrol and electric fast chargers in terms of refueling speed, space requirements, and investment costs, highlighting efficiency benefits.
hydrogen, refueling, space, investment, efficiency
false
Operational Efficiency
Energy & Utilities
Multiple Chart
Kearney
Add to my slides
Remove from favorites
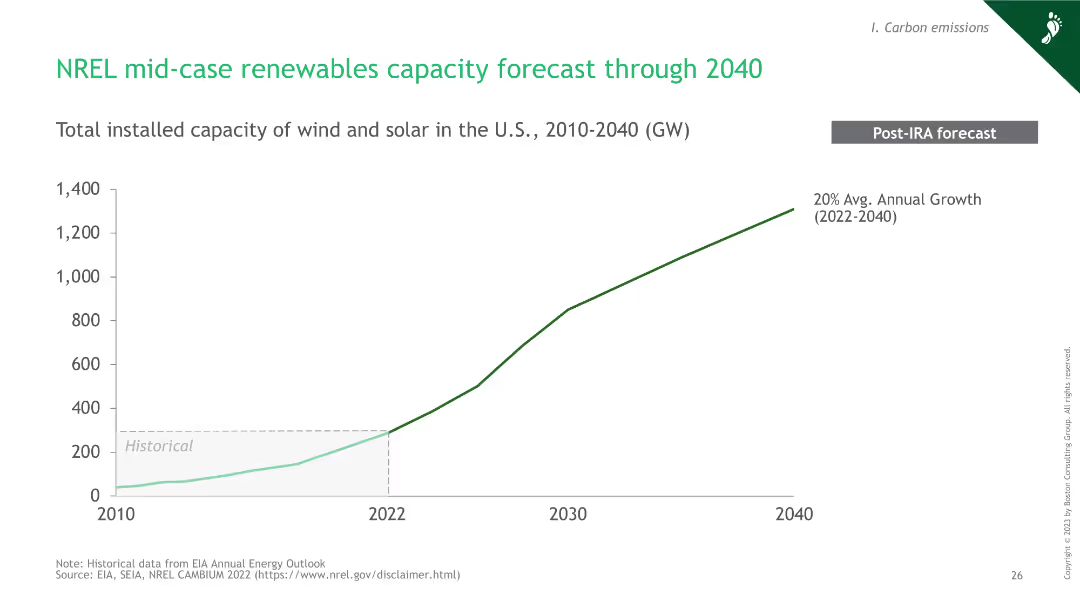
A line chart showing the forecasted growth of renewable energy capacity in the U.S. from 2010 to 2040.
Market Analysis and Trends
Energy & Utilities
This slide forecasts the growth of wind and solar capacity in the U.S. through 2040, indicating a 20% average annual growth rate post-IRA.
hydrogen, renewables, capacity, forecast, 2040
false
Market Analysis and Trends
Energy & Utilities
Single Chart
BCG
Add to my slides
Remove from favorites
The slide presents three scenarios (minimum, reference, and maximum scope) for hydrogen demand and related carbon impacts, using vertical column charts for each scope.
Strategic Planning
Energy & Utilities
The slide explores different scenarios for hydrogen demand by 2050, detailing the carbon impact and adjustments needed for each scope. It includes minimum, reference, and maximum scenarios, emphasizing the potential for reducing carbon emissions through hydrogen use.
hydrogen, scenarios, carbon impact, 2050, demand
false
Strategic Planning
Energy & Utilities
Mixed Chart
Kearney
Add to my slides
Remove from favorites
Vertical bar chart color-coded by use case; right side text box with key metrics; bottom with volume segments and annotations
Market Analysis and Trends
Energy & Utilities
This slide analyzes competitiveness by comparing value-in-use and cost of clean hydrogen across use cases. It segments demand into three groups: positive business case, marginally viable, and segments needing significant support. Key insights show which sectors and geographies are most likely to adopt clean hydrogen based on cost dynamics.
hydrogen segments, competitiveness, value-in-use, cost delta, demand breakdown, business case, EU policy, CHPS, refining
false
Market Analysis and Trends
Energy & Utilities
Mixed Chart
McKinsey
Add to my slides
Remove from favorites
The slide features a detailed process diagram for hydrogen-based direct reduction of iron and text on using hydrogen to lower emissions in steel production.
Market Analysis and Trends
Energy & Utilities
The slide explains how adopting hydrogen and other low carbon energy sources can help decarbonize steel production, supported by a detailed process diagram and explanatory text.
hydrogen, steel, decarbonization, reduction, emissions, process diagram, low carbon
false
Market Analysis and Trends
Energy & Utilities
Diagram
Kearney
Add to my slides
Remove from favorites
The slide features a vertical column chart showing energy and hydrogen requirements for DRI-EAF production route from 2018 to 2030 and projected demand to 2050.
Market Analysis and Trends
Energy & Utilities
The slide projects the growth in demand for dedicated hydrogen production in steelmaking, showing energy and hydrogen requirements and projected demand through charts and text.
hydrogen, steelmaking, DRI-EAF, production, demand, projection, energy requirements, chart
false
Market Analysis and Trends
Energy & Utilities
Multiple Chart
Kearney
Add to my slides
Remove from favorites
The slide has two sections with descriptions of the basic oxygen furnace and direct reduction of iron processes, including images of the relevant furnaces.
Market Analysis and Trends
Energy & Utilities
The slide details hydrogen consumption in the steel industry, explaining basic oxygen furnace and direct reduction of iron processes, market trends, and hydrogen sources.
hydrogen, steel, oxygen furnace, direct reduction, iron, market trends, case study
false
Market Analysis and Trends
Energy & Utilities
Mixed Chart
Kearney
Add to my slides
Remove from favorites
A vertical column chart comparing the costs of different steel production methods, including hydrogen-based methods, with detailed cost components for each method.
Market Analysis and Trends
Energy & Utilities
The slide analyzes the economic viability of hydrogen-based steel production compared to established alternatives, using a detailed cost comparison for various production routes.
hydrogen, steel production, cost comparison, economic viability, chart, established methods, alternatives
false
Market Analysis and Trends
Energy & Utilities
Single Chart
Kearney
Add to my slides
Remove from favorites
The slide has a description box, a market trends box, and an overview of technologies. It includes a small diagram showing the comparative size and cost of various storage technologies like PHES, CAES, Li-ion, and compressed H₂.
Strategic Planning
Energy & Utilities
The slide discusses the viability of compressed hydrogen storage in salt caverns for long-term energy storage, highlighting market trends, competing technologies, and economic feasibility.
Hydrogen, Storage, Salt Caverns, Market Trends, Technology
false
Strategic Planning
Energy & Utilities
Mixed Chart
Kearney
Add to my slides
Remove from favorites
Slide includes a detailed table comparing hydrogen roadmaps by country, focusing on production goals and policy details.
Regulatory and Compliance
Energy & Utilities
Compares national hydrogen strategy details to assess regulatory environments and strategic directions in the energy sector.
hydrogen, strategic planning, regulatory framework, national policies, energy policies
false
Regulatory and Compliance
Energy & Utilities
Table
McKinsey
Add to my slides
Remove from favorites
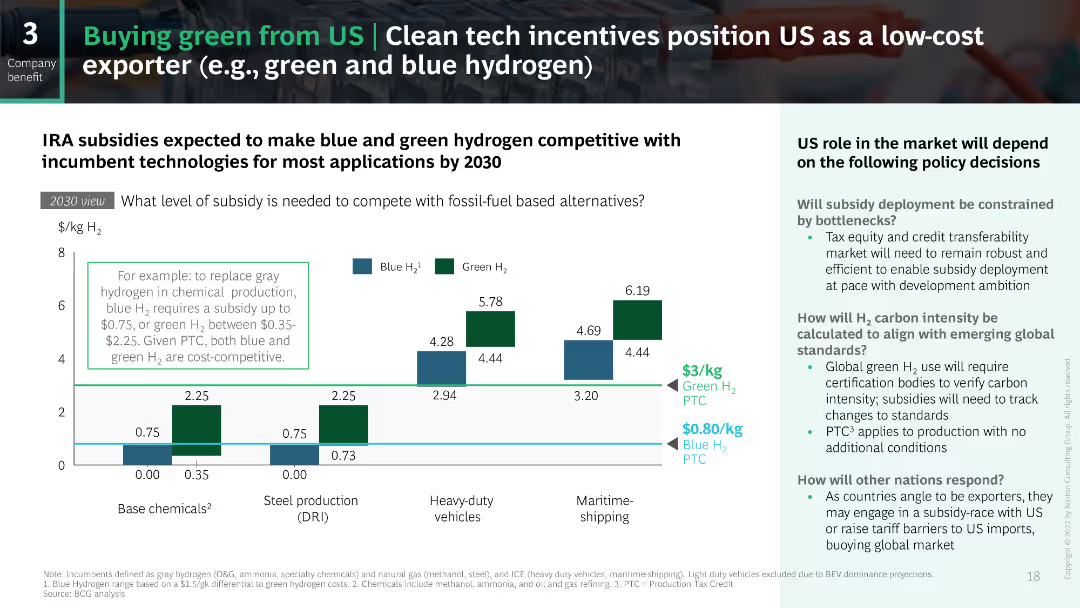
The slide uses a series of bar charts to depict the subsidy levels needed to make green and blue hydrogen competitive by 2030. The charts are color-coded to distinguish between green and blue hydrogen, and the layout is balanced with explanatory text on the side.
Strategic Planning
Energy & Utilities
This slide outlines the expected subsidy levels required for green and blue hydrogen to compete with fossil fuels by 2030, discussing the potential role of the US in the global market and the impact of various policy decisions on subsidy deployment.
hydrogen, subsidies, green, blue, competitive
false
Strategic Planning
Energy & Utilities
Mixed Chart
BCG
Add to my slides
Remove from favorites
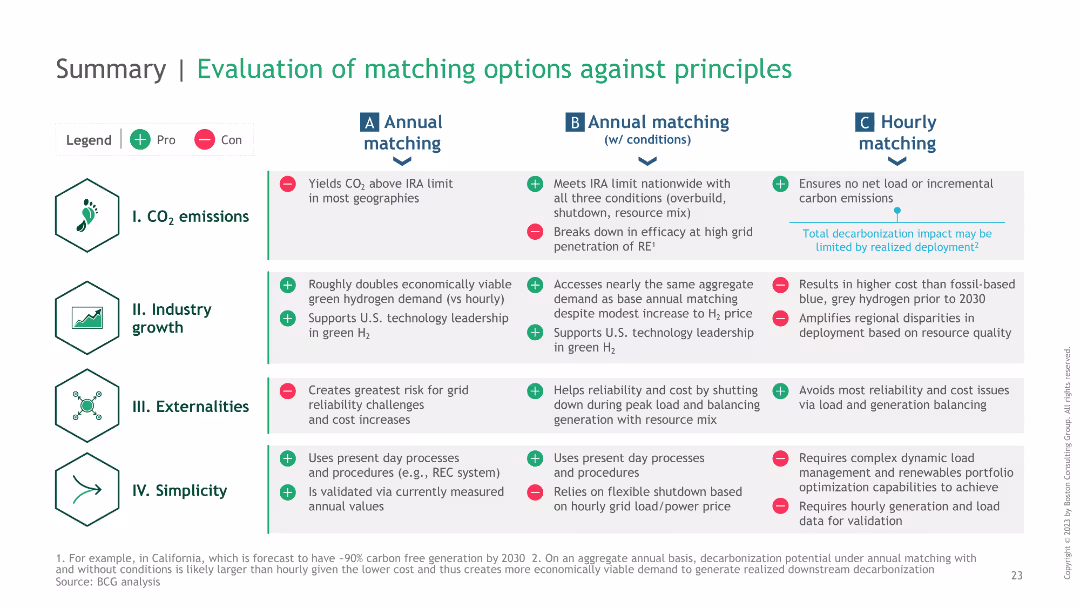
A summary table comparing different green hydrogen matching strategies against principles like CO2 emissions, industry growth, externalities, and simplicity.
Strategic Planning
Energy & Utilities
It summarizes the evaluation of different hydrogen matching strategies against key principles, providing a high-level overview of their benefits and drawbacks.
hydrogen, summary, strategies, principles, evaluation
false
Strategic Planning
Energy & Utilities
Table
BCG
Add to my slides
Remove from favorites
The slide features a column chart showing the number of countries supporting hydrogen initiatives in various sectors like transportation, refueling stations, buses, and trucks.
Regulatory and Compliance
Energy & Utilities
Highlights global initiatives supporting hydrogen deployment across different sectors, emphasizing the number of countries involved in each initiative.
Hydrogen, support initiatives, countries, deployment, transportation, refueling, buses, trucks
false
Regulatory and Compliance
Energy & Utilities
Single Chart
Kearney
Add to my slides
Remove from favorites
The slide shows a technology maturity curve graph, plotting various hydrogen production technologies against time and risk. The chart includes technologies like SMR, Alkaline electrolysis, and Methane cracking, color-coded by thermochemical production, electrolysis production, and others.
Market Analysis and Trends
Energy & Utilities
This slide presents a maturity curve for hydrogen production technologies, categorizing them based on their development stage and associated risks. It highlights the transition from research to deployment phases, illustrating the technological advancements in hydrogen production.
Hydrogen, Technology, Maturity, Production, Risk
false
Market Analysis and Trends
Energy & Utilities
Single Chart
Kearney
Add to my slides
Remove from favorites
The slide uses a timeline chart to depict the expected commercial maturity of various hydrogen applications from 2020 to 2050.
Market Analysis and Trends
Energy & Utilities
The slide shows the expected timeline for the commercial maturity of various hydrogen applications, including industrial applications and mobility, from 2020 to 2050.
hydrogen, timeline, maturity, industrial, mobility, applications, 2050, commercial, chart
false
Market Analysis and Trends
Energy & Utilities
Table
Kearney
Add to my slides
Remove from favorites
Previous
Next
You don't have any favorites yet.
Please wait loading your favorites slides...
Create a FREE account to continue browsing
Receive Instant Access to 1,000+ slides from companies like McKinsey, Google, and Goldman Sachs
First Name
Last Name
Email
Password
I agree to all
Terms & Privacy Policy
Thank you! Your submission has been received!
Oops! Something went wrong while submitting the form.
Have an account?
Sign in
Upgrade to PRO to Save slides
Advanced Search and Filters
Access to 15,000+ slides
Access to Category Pages
Save/Bookmark Slides
PowerPoint Template Library
Pick a Plan
MONTHLY
$12/month
Billed every month, Cancel anytime.
YEARLY
$9/year
Billed $108 annually, Cancel anytime.
Checkout for $12/month
Checkout for $108/yr
Secured by Stripe | AES-256 bit encryption