My Account
My Slides
Search by Category
Companies
Slide Type
Use Case
Industry
Pricing
Templates
View All Templates
Download Template Slides
✦ AI
AI Prompt Library
AI Search
Feedback
Login
Logout
Get Started
Browse all Slides
Browse all Slides
Create a FREE Account
Instant access to 1,000+ real slides from top companies like McKinsey, BCG, Goldman Sachs, Google and many more!
First Name
Last Name
Email
Password
I agree to all
Terms & Privacy Policy
Thank you! Your submission has been received!
Oops! Something went wrong while submitting the form.
Have an account?
Sign in
Saved Slides
Total No. of slides saved
0
↻ Refresh
✖ Clear all
Image of the Taj Mahal with accompanying text about India's UPI system, and a line chart showing the exponential growth of UPI transactions.
Market Analysis and Trends
Financial Services
Highlights the growth of UPI in India, showing its increasing use and impact on the payment landscape, with a focus on transaction volumes and values.
India, UPI, payments, growth, transactions, exponential, financial, services, system
false
Market Analysis and Trends
Financial Services
Mixed Chart
PwC/Strategy&
Add to my slides
Remove from favorites
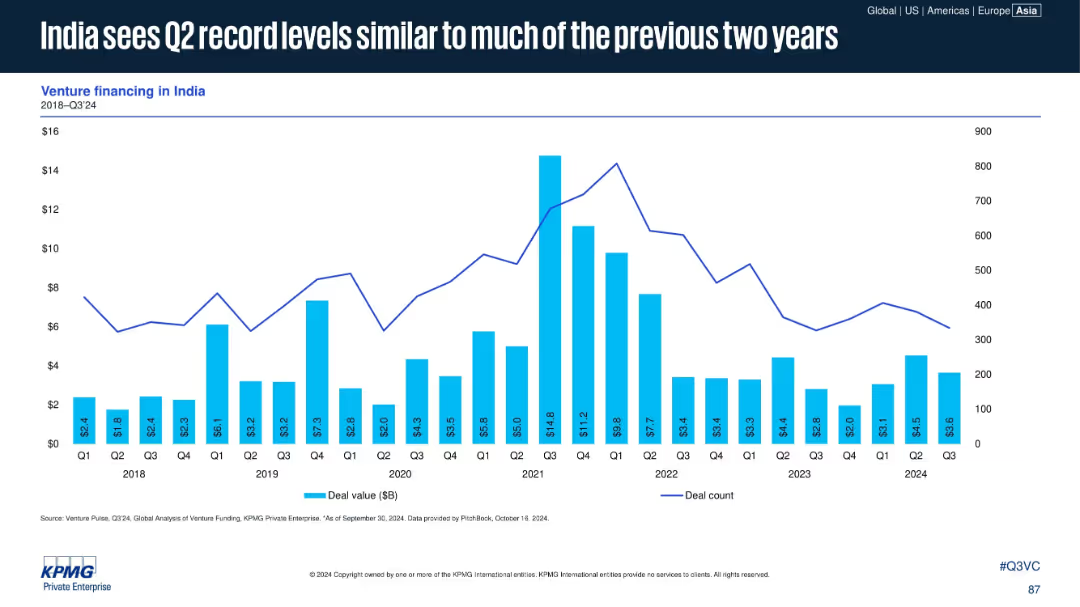
Bar and line chart tracking venture financing (deal value and count) in India from 2018 to Q3 2024.
Investment Analysis
Financial Services
Despite global VC downturns, India maintains steady investment activity with strong Q2 results in 2024. While deal counts are declining, several quarters show high deal values, reflecting fewer but larger transactions.
India, venture financing, deal value, deal count, 2024, investment trends, KPMG
false
Investment Analysis
Financial Services
Single Chart
KPMG
Add to my slides
Remove from favorites
Pie charts, text description, icons.
Market Analysis and Trends
Retail & E-commerce
Discusses significant growth in indie beauty market.
indie, beauty, skincare, growth, CAGR
false
Market Analysis and Trends
Retail & E-commerce
Mixed Chart
Bain
Add to my slides
Remove from favorites
A bar chart on the left shows typical indirect spend per category, with pie charts on the right indicating Commercial and Demand management focus.
Operational Efficiency
Professional Services
This slide depicts typical indirect spend by category (Professional Services, Human Resource, etc.) and their focus on Commercial and Demand management.
Indirect spend, categories, commercial, demand management, bar chart, pie chart
false
Operational Efficiency
Professional Services
Single Chart
EY
Add to my slides
Remove from favorites
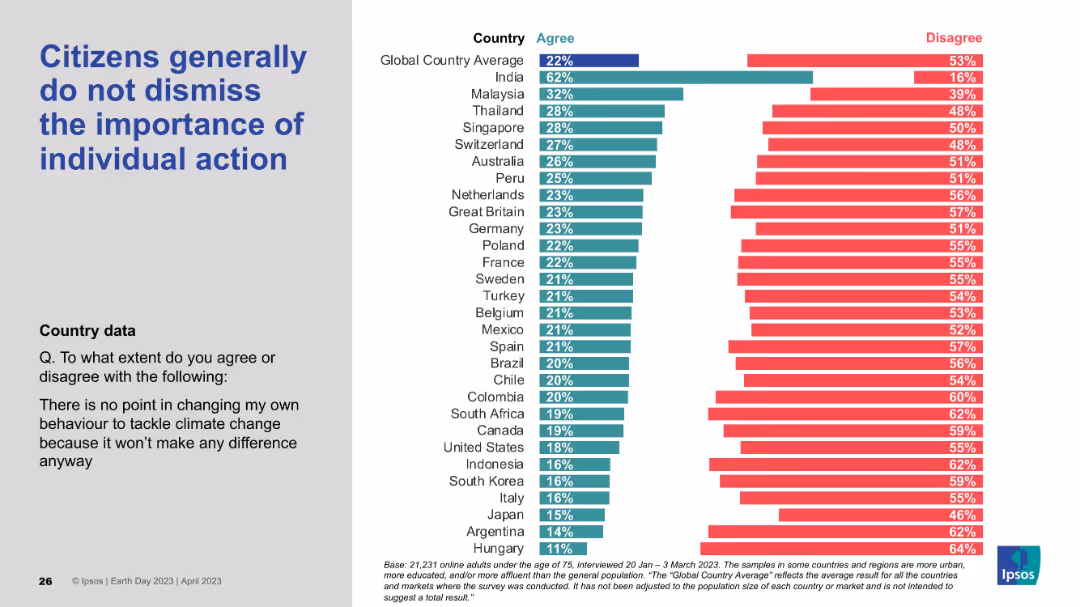
Left-hand statement in large blue font; right side includes a horizontal agreement/disagreement bar chart with minimal agreement levels shown.
Customer and Market Segmentation
Environmental Services & Sustainability
This slide indicates that while a small percentage agree that individual actions are meaningless, the majority disagree. It underscores the global recognition of individual impact, even if levels of strong belief vary across countries.
individual action, behavior change, climate impact, personal responsibility, public opinion, Ipsos, Earth Day
false
Customer and Market Segmentation
Environmental Services & Sustainability
Mixed Chart
IPSOS
Add to my slides
Remove from favorites
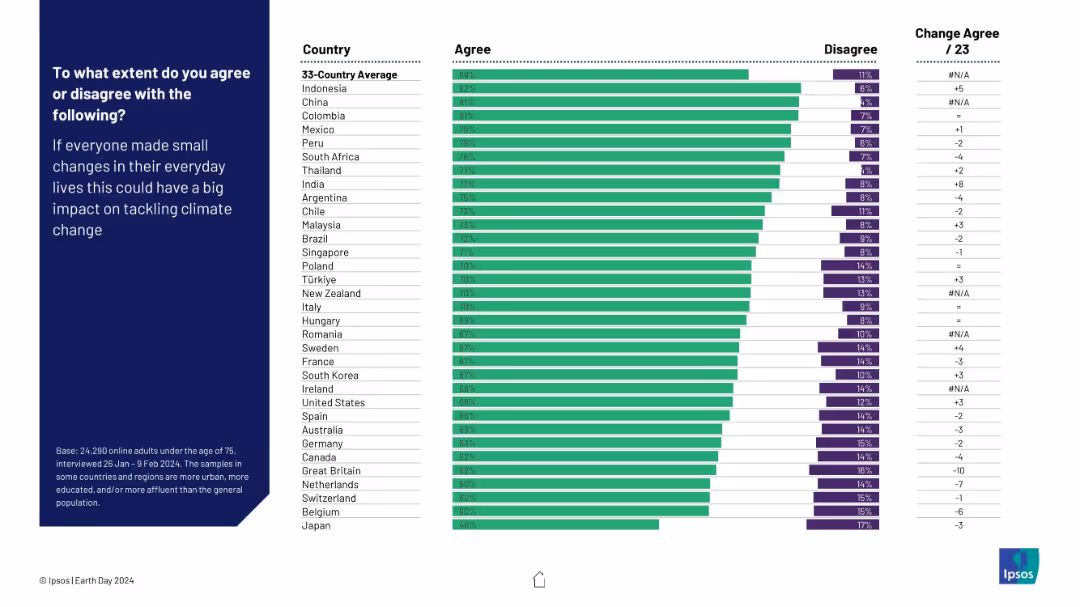
Horizontal bar chart of agreement by country on small lifestyle changes making a climate impact. Visual format same as previous charts.
Customer and Market Segmentation
Environmental Services & Sustainability
This slide examines the global belief in the power of individual behavior change to address climate change. High agreement rates suggest widespread belief in personal impact.
individual action, lifestyle change, climate mitigation, perception, Ipsos, public opinion, Earth Day
false
Customer and Market Segmentation
Environmental Services & Sustainability
Mixed Chart
IPSOS
Add to my slides
Remove from favorites
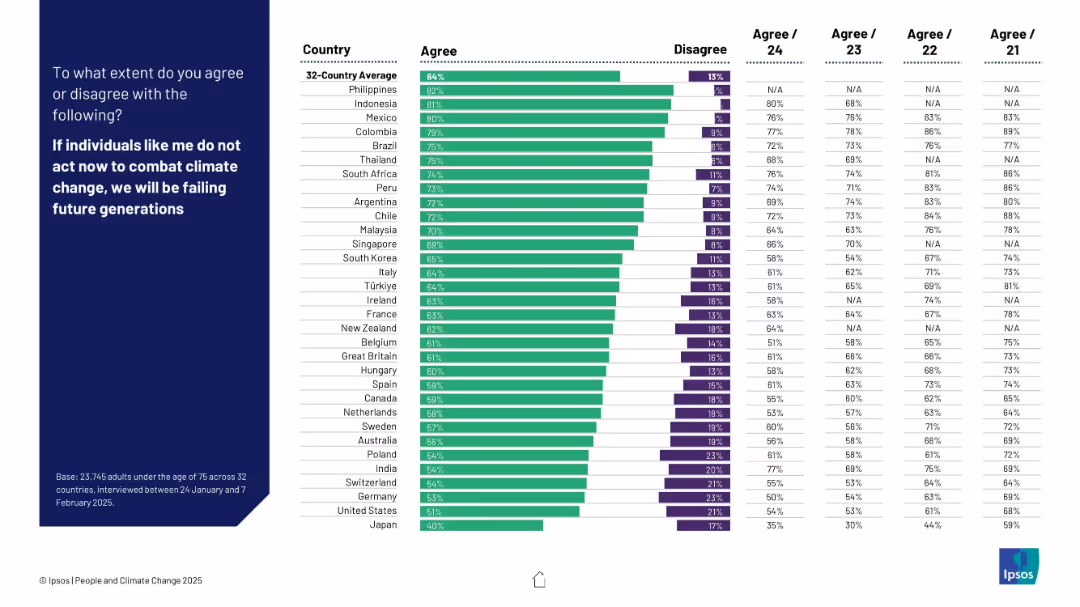
Horizontal bar chart showing agreement levels by country, with historical comparison columns for 2021–2024
Strategic Planning
Environmental Services & Sustainability
This slide highlights levels of agreement that individual action on climate change is necessary to avoid failing future generations. The Philippines and Indonesia show highest concern; Japan and the U.S. are lowest. Trend data indicates shifting views.
individual responsibility, climate change, future generations, concern, Ipsos, public action, sustainability, global trends
false
Strategic Planning
Environmental Services & Sustainability
Mixed Chart
IPSOS
Add to my slides
Remove from favorites
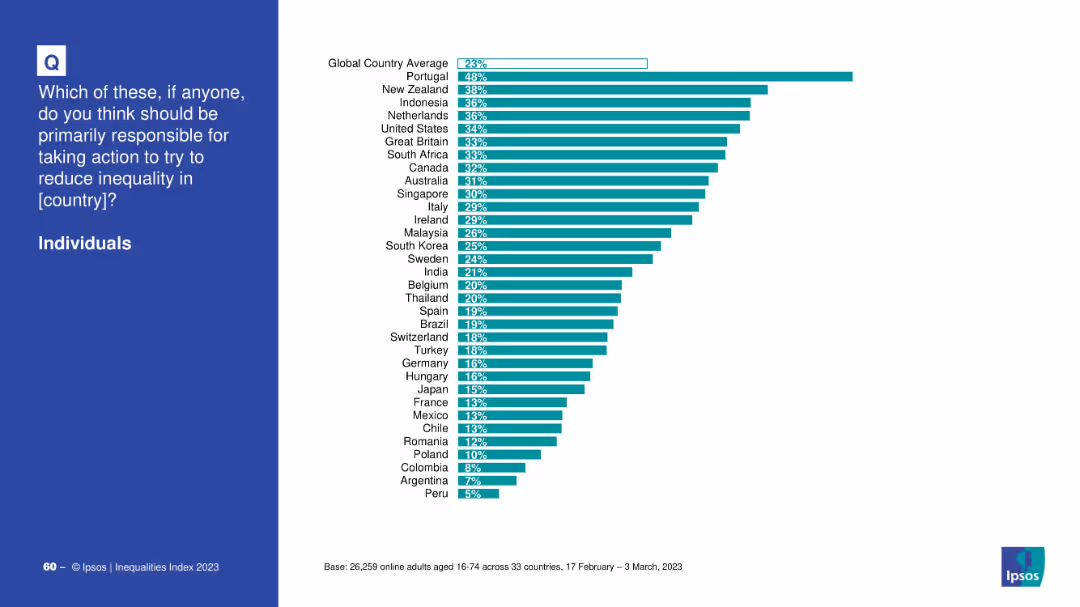
Country ranking bar chart of support for individuals as primary actors on inequality.
Market Analysis and Trends
Professional Services
This slide shows which countries favor individuals as responsible for addressing inequality. Portugal leads with 48%, followed by New Zealand and Indonesia. Latin American countries rank lowest.
individuals, responsibility, inequality, Ipsos, bar chart, Portugal, country comparison, global opinion
false
Market Analysis and Trends
Professional Services
Mixed Chart
IPSOS
Add to my slides
Remove from favorites
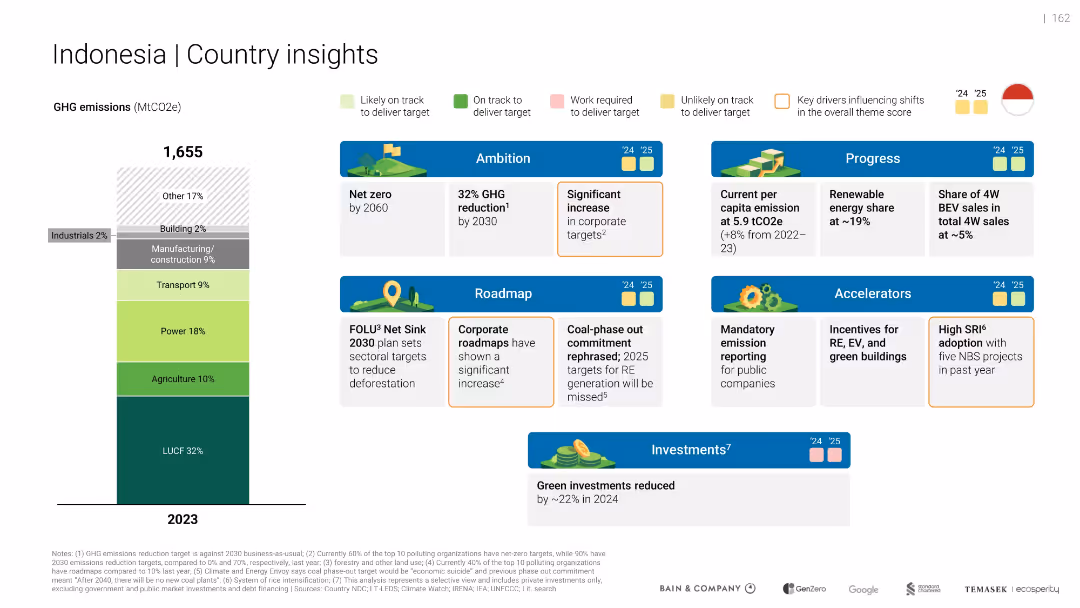
Vertical emissions bar with categories; multiple blue-highlighted cards for ambition, roadmap, progress, investment
Strategic Planning
Environmental Services & Sustainability
Provides Indonesia's green economy profile. Emphasizes emissions sources, current targets (e.g., net zero by 2060), and reduced green investment in 2024. Notes recent rollback on coal phase-out.
Indonesia
false
Strategic Planning
Environmental Services & Sustainability
Mixed Chart
Bain
Add to my slides
Remove from favorites
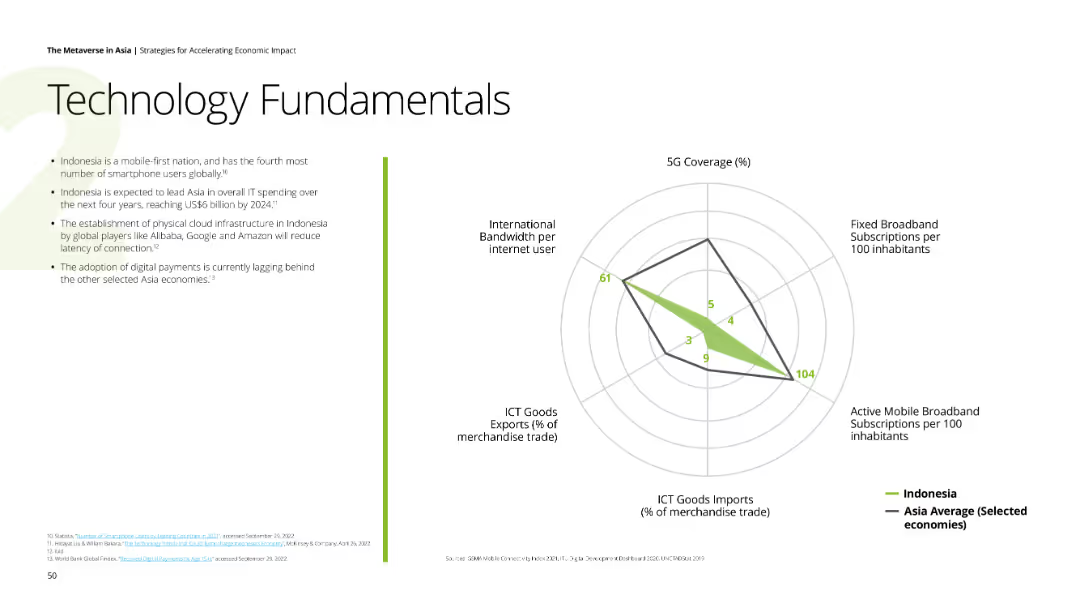
The slide contains a spider chart comparing 5G coverage, fixed broadband subscriptions, active mobile broadband subscriptions, ICT goods imports, and international bandwidth per internet user for Indonesia and Asia average. The background is white with text and charts.
Technology and Digital Transformation
Technology & Software
Discusses Indonesia's position in the ICT sector with a focus on mobile-first adoption, cloud infrastructure, digital payments, and IT spending.
Indonesia, 5G, ICT, mobile broadband, digital payments
false
Technology and Digital Transformation
Technology & Software
Mixed Chart
Deloitte
Add to my slides
Remove from favorites
Slide contains maps and infographics illustrating Indonesia’s status as the world’s largest island country, highlighting the variances in connectivity setup.
Market Analysis and Trends
Telecommunications
Examines Indonesia's unique challenges in developing ICT infrastructure due to its extensive archipelago, focusing on connectivity issues and regional disparities.
Indonesia, connectivity, islands, infrastructure, challenges
false
Market Analysis and Trends
Telecommunications
Boxed
BCG
Add to my slides
Remove from favorites
Slide shows a combination of maps, demographic tables, and data points illustrating the connectivity challenges in different regions of Indonesia.
Market Analysis and Trends
Telecommunications
Provides a comprehensive overview of Indonesia's connectivity challenges, focusing on demographic factors, school internet access, and regional disparities in connectivity.
Indonesia, demographics, connectivity, challenges, schools
false
Market Analysis and Trends
Telecommunications
Mixed Chart
BCG
Add to my slides
Remove from favorites
A bar chart with segments showing digital consumer population in SEA countries for 2021 and new digital consumers in 2022.
Market Analysis and Trends
Retail & E-commerce
Examines Indonesia's leading position in SEA's digital consumer base for 2021, with added numbers for 2022, providing a quick comparative regional analysis.
Indonesia, digital consumers, SEA, market analysis, growth trend
false
Market Analysis and Trends
Retail & E-commerce
Single Chart
Bain
Add to my slides
Remove from favorites
Detailed slide with multiple column charts, each representing a different aspect of Indonesia's digital financial services. Utilizes shades of blue for a clean look.
Financial Performance
Financial Services
This slide gives an in-depth view of the projected growth in digital lending, payments, insurance, and wealth in Indonesia's financial sector.
Indonesia, Digital Financial Services, Lending, Payments, Insurance, Wealth, Growth Projections, Financial Sector
false
Financial Performance
Financial Services
Multiple Chart
Bain
Add to my slides
Remove from favorites
A combination of column and bar charts, and infographic elements on a white background. The top section features a...
Market Analysis and Trends
Technology & Software
Showcasing Indonesia's digital consumer growth, this slide compares pre-pandemic and new digital consumers,...
Indonesia, digital growth, consumers, services, e-commerce, convenience, routine, penetration
false
Market Analysis and Trends
Technology & Software
Multiple Chart
Bain
Add to my slides
Remove from favorites
The slide features three sets of vertical column charts, color-coded in blue and yellow to distinguish between merchants’ anticipated usage increase and maintenance in digital services and tools in Indonesia.
Market Analysis and Trends
Technology & Software
Depicts Indonesian digital merchants' reliance on digital platforms, financial services, and tools, anticipating increased tech adoption.
Indonesia, Digital Merchants, Tech-Savvy, Future Trends, Digital Tools, Usage Increase, Financial Services
false
Market Analysis and Trends
Technology & Software
Multiple Chart
Bain
Add to my slides
Remove from favorites
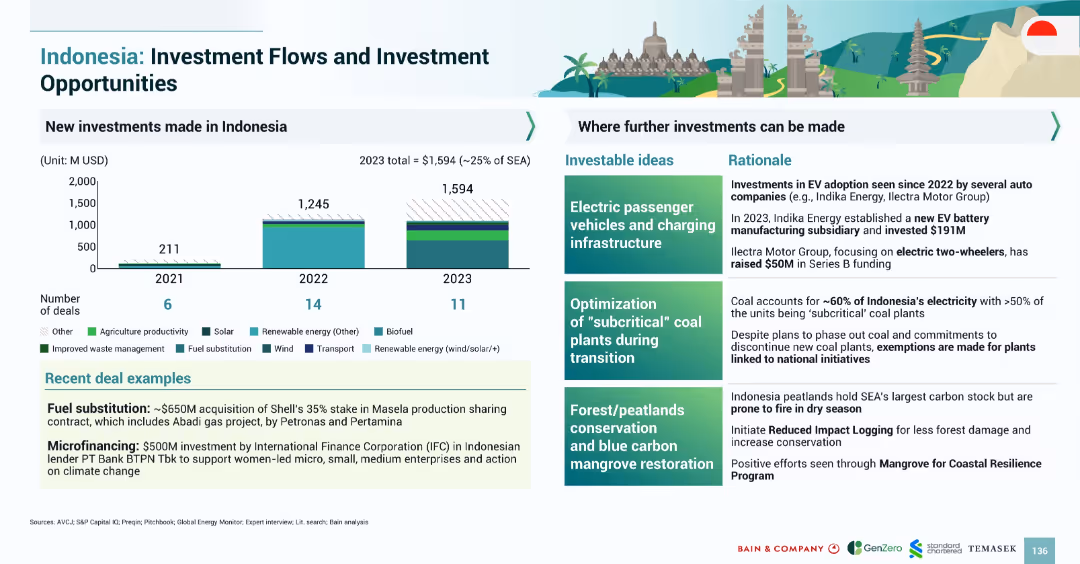
Bar chart showing investment volumes by year and type, with right-aligned boxes listing investable ideas and deal rationale
Investment Analysis
Financial Services
Highlights investment trends in Indonesia’s green sectors and identifies growth areas like EV infrastructure, coal transition, and mangrove restoration, backed by recent deal examples
Indonesia, EV, investment, fuel substitution, climate finance, mangroves, coal phaseout, renewables
false
Investment Analysis
Financial Services
Mixed Chart
Bain
Add to my slides
Remove from favorites
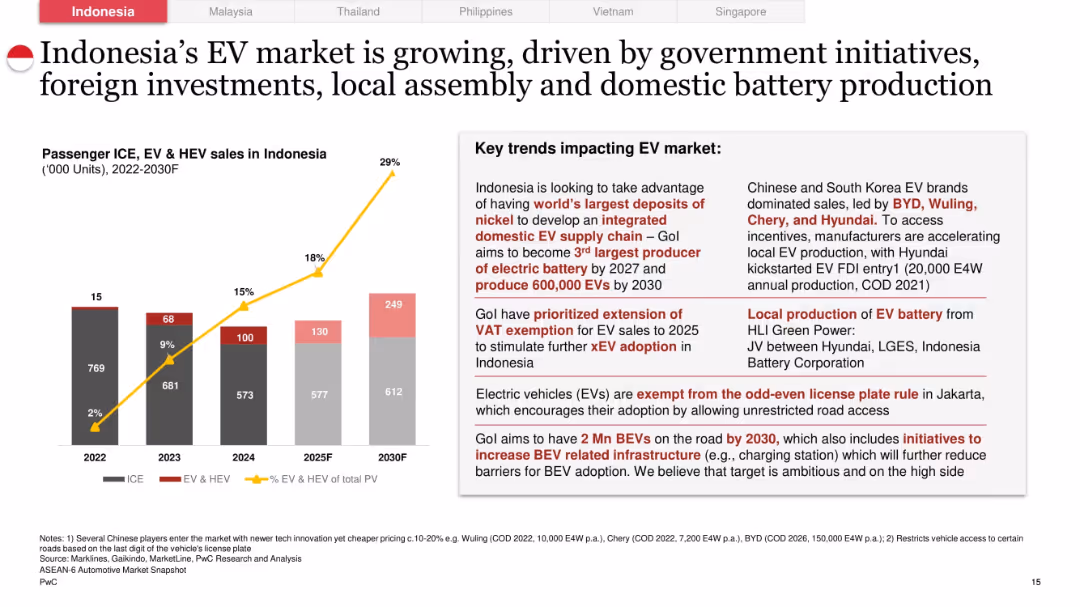
Left side has a stacked bar chart (ICE vs EV & HEV) and line chart (% EV of total PV); right side features detailed text on market drivers including incentives, infrastructure, and OEM strategies.
Technology and Digital Transformation
Industrial & Manufacturing
Explores Indonesia’s EV market growth through 2030. Highlights the rise in EV share of total passenger vehicles, supported by government incentives, battery production, VAT exemptions, and favorable road regulations. Forecasts 2 million BEVs by 2030 and positions Indonesia as a future battery and EV production hub.
Indonesia, EV market, BEVs, battery production, incentives, infrastructure, government policy
false
Technology and Digital Transformation
Industrial & Manufacturing
Mixed Chart
PwC/Strategy&
Add to my slides
Remove from favorites
Provides a detailed case study of Jejak.in with photos, icons, and data points about their programs and achievements in forest conservation in Indonesia.
Market Analysis and Trends
Environmental Services & Sustainability
Slide presents a case study on Jejak.in's efforts in forest conservation using digital monitoring and carbon credits, suitable for discussions on technological impacts on environmental efforts.
Indonesia, forest conservation, Jejak.in, case study, carbon sequestration, digital monitoring, technology, carbon credits
false
Market Analysis and Trends
Environmental Services & Sustainability
Header Vertical
Bain
Add to my slides
Remove from favorites
Displays text and graphics detailing the cost structure, funding, and operational models for connecting schools in Indonesia's less developed regions.
Investment Analysis
Telecommunications
Analyzes specific funding and operational models to enhance school connectivity in Indonesia's remote regions, detailing costs and potential operational models.
Indonesia, funding, schools, connectivity, models
false
Investment Analysis
Telecommunications
Pillar
BCG
Add to my slides
Remove from favorites
Graphs and statistics about Indonesia's GDP, population demographics, and digital investment growth are presented on a dark background.
Financial Performance
Technology & Software
The slide discusses Indonesia's economic profile, internet users, and investment growth, positioning it as a future digital hub.
Indonesia, GDP, digital hub, investment, economic profile, internet users, growth
false
Financial Performance
Technology & Software
Pillar
Kearney
Add to my slides
Remove from favorites
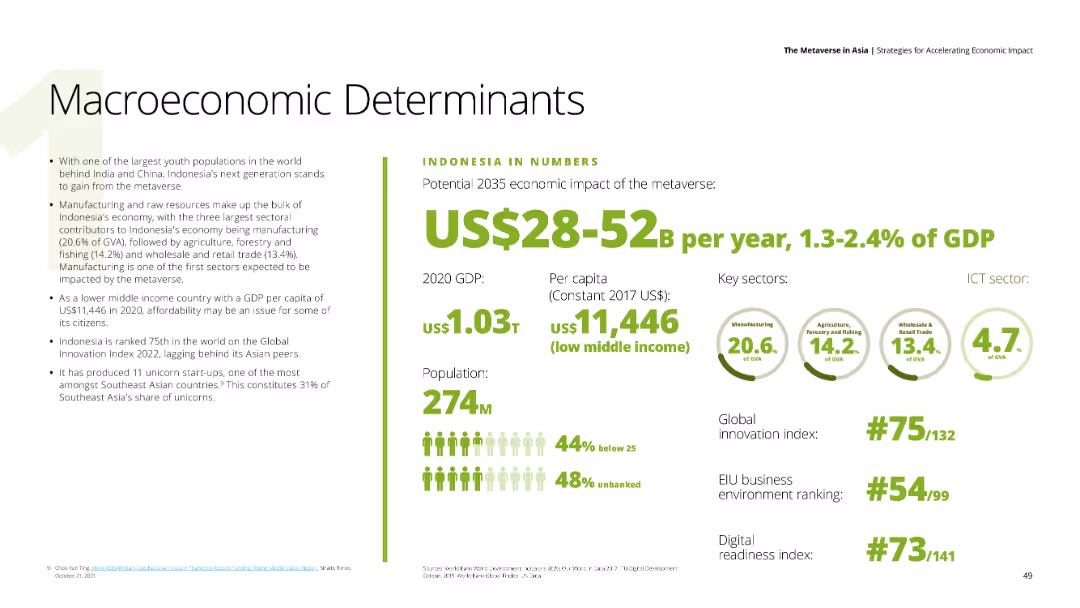
A data-driven slide with key economic indicators for Indonesia, including GDP, population, and sector contributions.
Financial Performance
Financial Services
The slide presents Indonesia’s macroeconomic determinants, highlighting the potential economic impact of the metaverse by 2035.
Indonesia, GDP, economic impact, metaverse, financial indicators
false
Financial Performance
Financial Services
Mixed Chart
Deloitte
Add to my slides
Remove from favorites
Includes a detailed map of Indonesia with demographic stats, focusing on the challenges of connecting remote areas and the socio-demographic diversity across regions.
Strategic Planning
Government & Public Sector
Discusses the challenges posed by Indonesia's geography on connectivity efforts, emphasizing the socio-demographic disparities and the impact on infrastructure development efforts.
Indonesia, geography, connectivity, challenges, demographics
false
Strategic Planning
Government & Public Sector
Graphic
BCG
Add to my slides
Remove from favorites
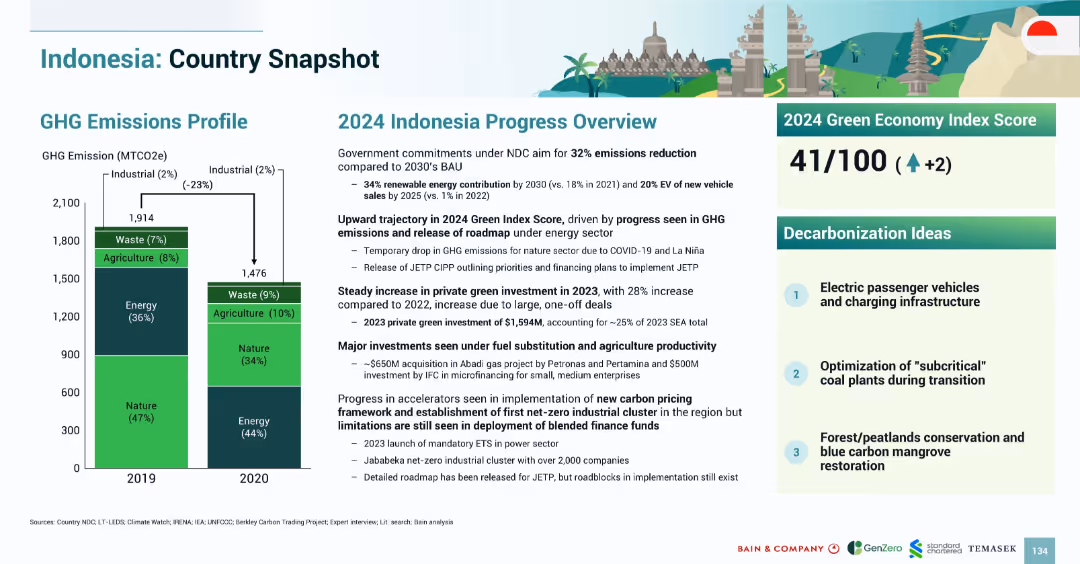
Left-side chart of GHG emissions over time; right-side lists national targets, progress summary, and decarbonization ideas
Financial Performance
Government & Public Sector
Outlines Indonesia’s progress in green investment and emissions reductions, including key metrics, policy commitments, EV goals, and forest conservation ideas, with a Green Index score improvement
Indonesia, GHG, green economy, emissions, EV, renewable energy, forest conservation, sustainability
false
Financial Performance
Government & Public Sector
Mixed Chart
Bain
Add to my slides
Remove from favorites
Two column charts comparing household debt to GDP and government debt to GDP among various countries as of December 29, 2022.
Market Analysis and Trends
Financial Services
The slide evaluates Indonesia's economic positioning by comparing its household and government debt levels to other countries, showing its relatively strong position.
Indonesia, Household Debt, Government Debt, GDP, Comparison
false
Market Analysis and Trends
Financial Services
Multiple Chart
Morgan Stanley
Add to my slides
Remove from favorites
Slide with bar graphs comparing HVU and non-HVU spending in Indonesia. Blue bars represent the HVU spend, with clear labels for each category.
Customer and Market Segmentation
Technology & Software
The slide compares the spending habits of HVUs to non-HVUs in Indonesia, especially highlighting the difference in travel spend.
Indonesia, HVUs, Non-HVUs, Spending Habits, Travel, Groceries, Streaming, Gaming, Food Delivery, E-commerce
false
Customer and Market Segmentation
Technology & Software
Multiple Chart
Bain
Add to my slides
Remove from favorites
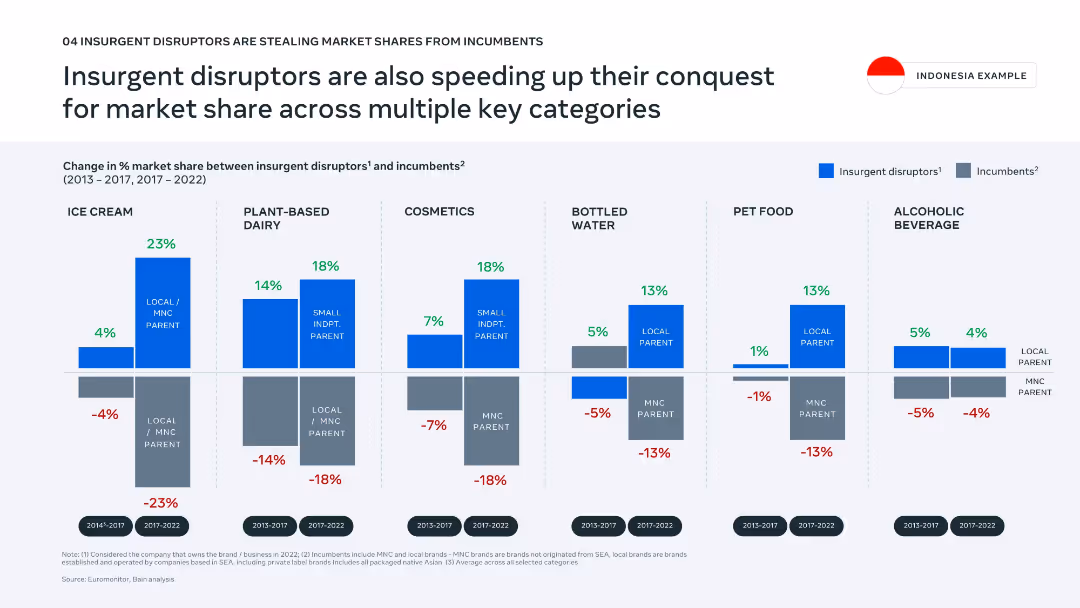
Horizontal bar graphs showing % market share change across categories in Indonesia; strong category-label alignment.
Competitive Landscape
Consumer Goods
This slide focuses on Indonesia, detailing how insurgent disruptors are gaining share in specific categories like ice cream, plant-based dairy, and cosmetics, often at the expense of multinational incumbents.
Indonesia, insurgent brands, market share, product categories, competition, local brands, disruptor growth, incumbents, consumer products, SEA
false
Competitive Landscape
Consumer Goods
Single Chart
Bain
Add to my slides
Remove from favorites
The slide features bar graphs comparing projections from 2020 to 2025 in different sectors of Indonesia's Internet economy, like e-commerce and health-tech. It has a moderate visual complexity with clear labels.
Market Analysis and Trends
Technology & Software
The slide analyzes projected growth in sectors of Indonesia's Internet economy, providing insights for investors and companies planning expansion or entry into these markets.
Indonesia, Internet economy, e-commerce, growth, health-tech, ride-hailing, payments, lending, projections, investors
false
Market Analysis and Trends
Technology & Software
Multiple Chart
Kearney
Add to my slides
Remove from favorites
This slide presents a column chart showing growth in Indonesia's internet economy GMV from 2015 to 2025 with projected CAGR. It uses a simple layout with a clear color distinction for different years.
Market Analysis and Trends
Technology & Software
The slide illustrates the growth of Indonesia's internet economy reaching US $44B despite economic challenges, with a focus on past and projected GMV values.
Indonesia, Internet economy, GMV, Growth, Projections, CAGR, Economic challenges, 2015, 2020, 2025
false
Market Analysis and Trends
Technology & Software
Single Chart
Bain
Add to my slides
Remove from favorites
A large column chart displays the growth of Indonesia’s internet economy, with projections to 2025. A smaller line graph shows the Compound Annual Growth Rate (CAGR).
Market Analysis and Trends
Technology & Software
Shows Indonesia's growing internet economy with projections suggesting robust future growth, symbolizing a positive economic outlook.
Indonesia, Internet Economy, Growth, Projection, CAGR, Optimism, $70B, 2025
false
Market Analysis and Trends
Technology & Software
Single Chart
Bain
Add to my slides
Remove from favorites
The slide uses column charts to show the growth of investment values in Indonesia from 2012 to 2017, illustrating exponential increases.
Market Analysis and Trends
Financial Services
Provides an analysis of the rapid growth in Indonesia’s investment values, showing significant increases from 2012 to mid-2017.
Indonesia, Investment, Growth, Trends
false
Market Analysis and Trends
Financial Services
Multiple Chart
Kearney
Add to my slides
Remove from favorites
Comprises a vertical column chart showcasing deal values over years and the number of deals, with a marked increase in the first half of 2021.
Investment Analysis
Financial Services
Indicates a surge in investment deal values in Indonesia within the first half of 2021, exceeding the past four years’ totals.
Indonesia, Investments, Deal Value, 2021, H1, Growth, Financial Analysis
false
Investment Analysis
Financial Services
Single Chart
Bain
Add to my slides
Remove from favorites
The slide features two doughnut charts detailing the number of deals and investment value distribution across different stages in Indonesia for 2017.
Market Analysis and Trends
Financial Services
Discusses the stages of investment in Indonesia, highlighting the predominance of seed and early-stage investments generating most of the value.
Indonesia, Investment Stages, Seed, Trends
false
Market Analysis and Trends
Financial Services
Mixed Chart
Kearney
Add to my slides
Remove from favorites
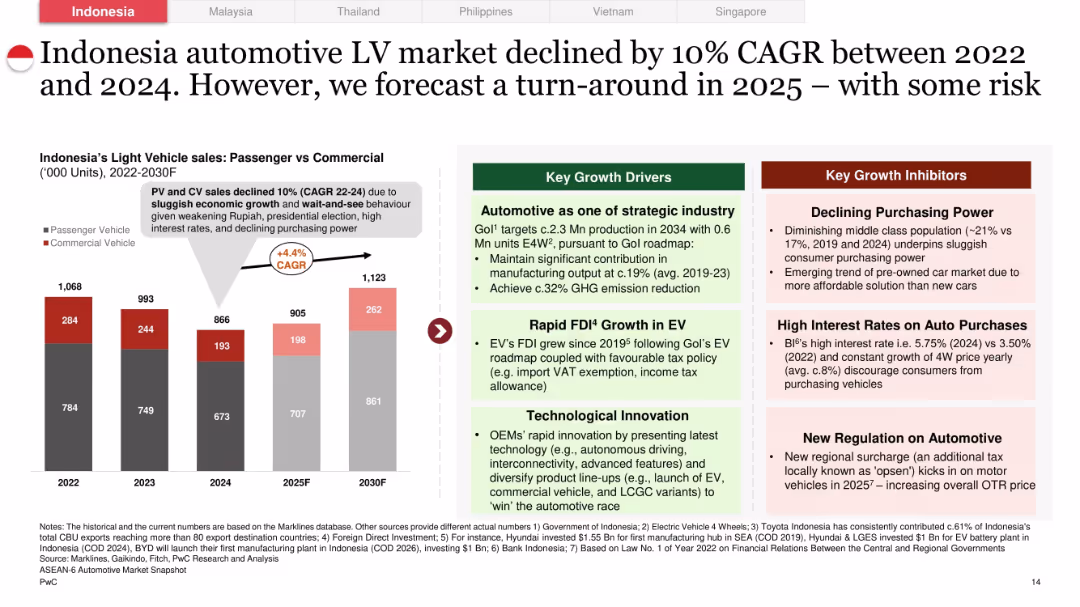
Left side includes a column chart of passenger vs commercial vehicles (2022–2030F); right side has green/red panels with key growth drivers and inhibitors.
Market Analysis and Trends
Industrial & Manufacturing
Analyzes Indonesia’s automotive LV market, highlighting a 10% decline from 2022–2024, followed by expected recovery. Lists drivers like EV investment and FDI, versus risks like declining purchasing power and high interest rates. Forecasts a turnaround in 2025 despite regulatory uncertainty.
Indonesia, LV market, growth drivers, inhibitors, forecast, FDI, EV roadmap
false
Market Analysis and Trends
Industrial & Manufacturing
Mixed Chart
PwC/Strategy&
Add to my slides
Remove from favorites
Complex slide with multiple infographics, including a table, column charts, and a roadmap layout. Visual elements are densely packed with a clear focus on data presentation.
Regulatory and Compliance
Energy & Utilities
Details Indonesia's commitments and challenges in achieving net zero emissions, emphasizing government actions and market practices affecting environmental and investment strategies.
Indonesia, net zero, emissions, government, environmental policy
false
Regulatory and Compliance
Energy & Utilities
Mixed Chart
Bain
Add to my slides
Remove from favorites
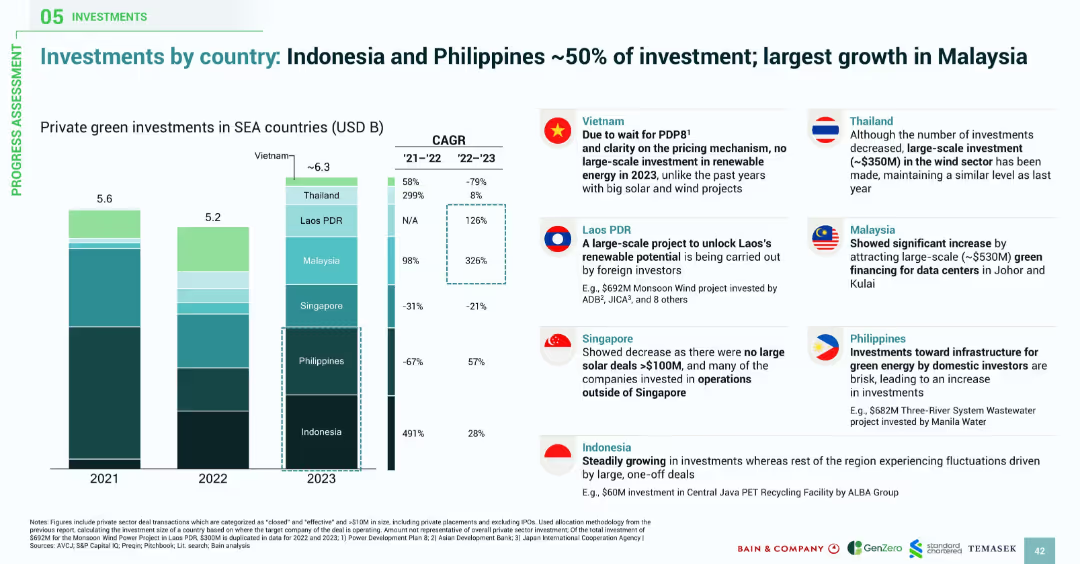
Bar charts display green investment volumes by country (2021–2023); flags and callouts summarize country-specific developments; vertical CAGR figures included.
Investment Analysis
Environmental Services & Sustainability
This slide presents country-level breakdowns of green investments in SEA. Indonesia and the Philippines lead in total volumes, while Malaysia shows the fastest growth due to large-scale data center financing. Side boxes detail major projects and strategic movements in each country, including policy and investor behavior.
Indonesia, Philippines, Malaysia, Laos, Vietnam, Thailand, green finance, renewable energy, investments, SEA
false
Investment Analysis
Environmental Services & Sustainability
Mixed Chart
Bain
Add to my slides
Remove from favorites
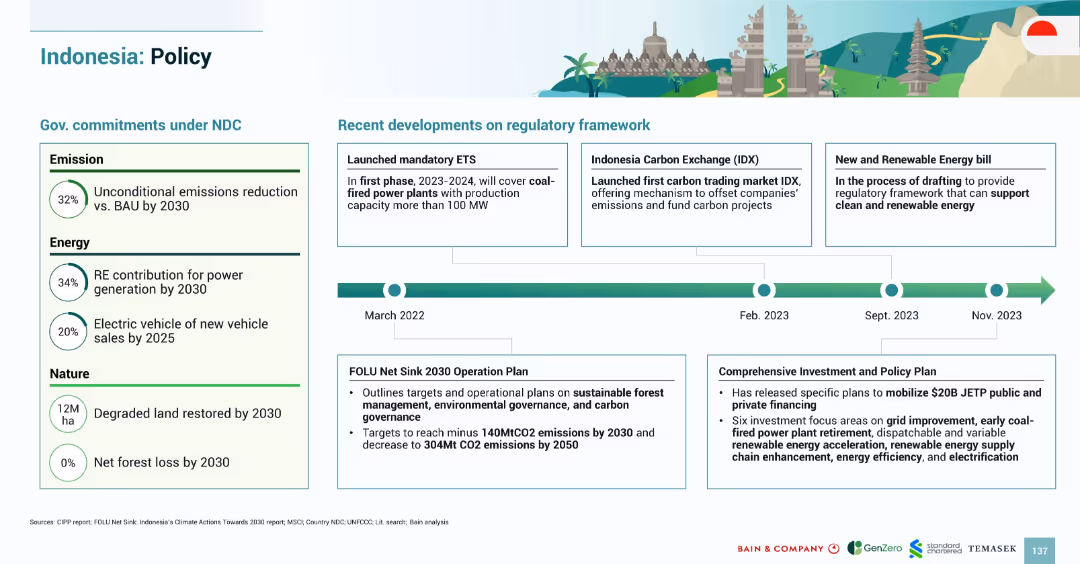
Timeline-based layout with left-side policy targets and right-side regulatory updates; illustrations and flags add clarity
Regulatory and Compliance
Government & Public Sector
Summarizes Indonesia’s regulatory progress on green policy, including NDC commitments, ETS launch, and carbon exchange developments, along with forest and investment frameworks
Indonesia policy, ETS, IDX, NDC, forest carbon, emissions targets, energy bill, regulatory updates
false
Regulatory and Compliance
Government & Public Sector
Mixed Chart
Bain
Add to my slides
Remove from favorites
Displays a series of stacked column charts detailing the sharp decline in private funding across sectors in Indonesia from 2019 to H1 2023. The slide is organized similarly to slide 1821, with a legend and data source included.
Market Analysis and Trends
Technology & Software
Highlights the dramatic reduction in private funding across different sectors in Indonesia, with implications for market analysis and investment strategies.
Indonesia, private funding, sector analysis, 2019-2023 trends, stacked column charts, funding decline.
false
Market Analysis and Trends
Technology & Software
Single Chart
Bain
Add to my slides
Remove from favorites
Features multiple column charts detailing the Gross Merchandise Value (GMV) growth by sector, including e-commerce and transport, with percentage increases noted.
Market Analysis and Trends
Technology & Software
Highlights the growth in all sectors of Indonesia's economy in 2021, with e-commerce showing significant increases.
Indonesia, Sector Growth, E-commerce, Transport, Double-Digit Growth, 2021, GMV
false
Market Analysis and Trends
Technology & Software
Multiple Chart
Bain
Add to my slides
Remove from favorites
The slide features tables, regional maps, and icons. It visually separates information by countries and key international alliances.
Market Analysis and Trends
Government & Public Sector
Analyzes the strengthening of Australia's international alliances in the Indo-Pacific, influencing Australia's battery industries.
Indo-Pacific, alliances, Australia, trade agreements
false
Market Analysis and Trends
Government & Public Sector
Table
Accenture
Add to my slides
Remove from favorites
The slide includes various data visualizations, such as column charts and graphs, showing the growth of the industrial automation market and its segments across different regions.
Market Analysis and Trends
Industrial & Manufacturing
The slide discusses the rapid growth of the industrial automation market, highlighting key drivers such as technological advances, COVID-19 impact, and regional market differences.
industrial automation, market growth, COVID-19, technology, regional markets, drivers
false
Market Analysis and Trends
Industrial & Manufacturing
Multiple Chart
LEK
Add to my slides
Remove from favorites
Moderate visual complexity with text sections and graphic elements delineating the three key subsectors of industrial automation and their end-industries. The design integrates visuals and texts seamlessly, with a color code for each subsector.
Technology and Digital Transformation
Industrial & Manufacturing
This slide provides a segmented overview of the industrial automation sector, detailing the key subsectors and relevant end industries. It helps in understanding the broad categories within industrial automation and how they are applicable across different market segments.
Industrial automation, Subsectors, Market segmentation, End-industries
false
Technology and Digital Transformation
Industrial & Manufacturing
Diagram
LEK
Add to my slides
Remove from favorites
The slide uses a comparative layout to illustrate three subsectors of industrial automation: Process Industry Automation, Discrete (Factory) Automation, and Warehouse Automation.
Market Analysis and Trends
Industrial & Manufacturing
The slide explains the different types of industrial automation and their applications across various end-industries, such as automotive, healthcare, and e-commerce.
industrial automation, subsectors, process industry, discrete automation, warehouse automation, end-industries
false
Market Analysis and Trends
Industrial & Manufacturing
Diagram
LEK
Add to my slides
Remove from favorites
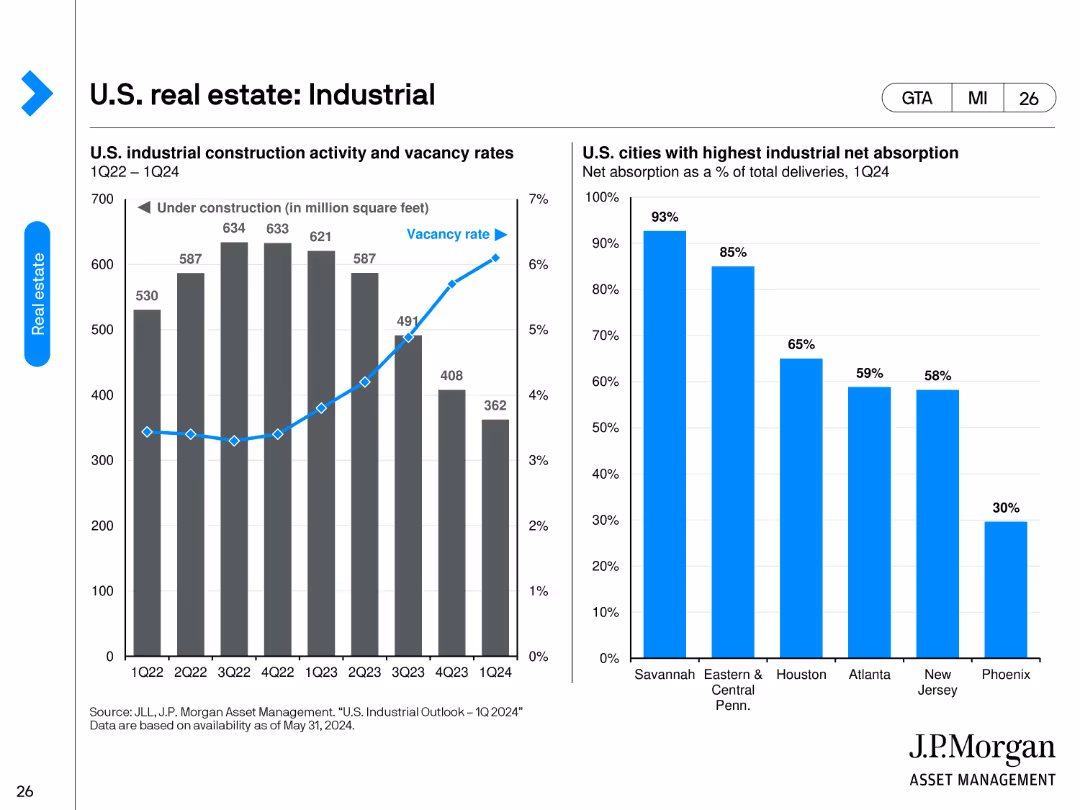
The slide features two charts. The left chart shows U.S. industrial construction activity and vacancy rates from 1Q22 to 1Q24. The right chart highlights the U.S. cities with the highest industrial net absorption as a percentage of total deliveries for 1Q24.
Market Analysis and Trends
Real Estate & Construction
This slide presents data on U.S. industrial construction activity, vacancy rates, and net absorption by city, providing insights into the industrial real estate market's performance and demand trends across major cities.
industrial construction, vacancy rates, net absorption, real estate market, city comparison
false
Market Analysis and Trends
Real Estate & Construction
Multiple Chart
JP Morgan
Add to my slides
Remove from favorites
A table comparing industrial distributor profiles and their profitability drivers, such as inventory turns and technical expertise, with case studies.
Operational Efficiency
Financial Services
The slide profiles industrial distributors, focusing on how technical expertise and value-added services contribute to higher profit margins.
industrial distributors, technical expertise, value-added services, profitability drivers, EBITDA, inventory turns
false
Operational Efficiency
Financial Services
Table
EY
Add to my slides
Remove from favorites
The slide includes line graphs representing occupancy rates by country and a bar chart showing portfolio weighting by country. It uses a palette of blue, teal, and dark green for the graphs, which are set against a white background for contrast.
Performance Metrics and KPIs
Transportation & Logistics
It highlights the stable occupancy rates in the light industrial and logistics sector across various countries and the corresponding portfolio weightings. This slide could be pivotal for logistics companies assessing market stability, portfolio managers strategizing on asset allocation, or investors looking for robust sectors with stable yields.
industrial, logistics, occupancy rates, portfolio weighting, market stability
false
Performance Metrics and KPIs
Transportation & Logistics
Multiple Chart
Morgan Stanley
Add to my slides
Remove from favorites
Column chart with three years (FY-21, FY-22, FY-23) of deal volumes by sector in the Middle East, including consumer markets, financial services, etc.
Market Analysis and Trends
Industrial & Manufacturing
Reviews the strategic importance of the Middle East in global manufacturing and automotive sectors, citing major deals and investments.
Industrial, Manufacturing, Automotive, Deal Volumes, Middle East
false
Market Analysis and Trends
Industrial & Manufacturing
Mixed Chart
PwC/Strategy&
Add to my slides
Remove from favorites
The slide includes a bar chart showing government industrial policy commitments and a line chart depicting increasing net debt as a percentage of GDP for advanced economies.
Regulatory and Compliance
Government & Public Sector
The slide discusses the impact of industrial policies on government finances, highlighting spending commitments and the resulting fiscal sustainability challenges in advanced economies.
industrial policy, government spending, fiscal sustainability, GDP, debt
false
Regulatory and Compliance
Government & Public Sector
Multiple Chart
Accenture
Add to my slides
Remove from favorites
The slide presents four column charts showing the increase in levelized cost of production for cement, steel, ammonia, and methanol when applying CCUS.
Market Analysis and Trends
Industrial & Manufacturing
The slide demonstrates that applying CCUS to industrial processes increases production costs. The charts break down the cost impacts for various industries, including cement, steel, ammonia, and methanol, comparing normal processes with those incorporating CCUS.
industrial processes, CCUS, production cost
false
Market Analysis and Trends
Industrial & Manufacturing
Multiple Chart
Kearney
Add to my slides
Remove from favorites
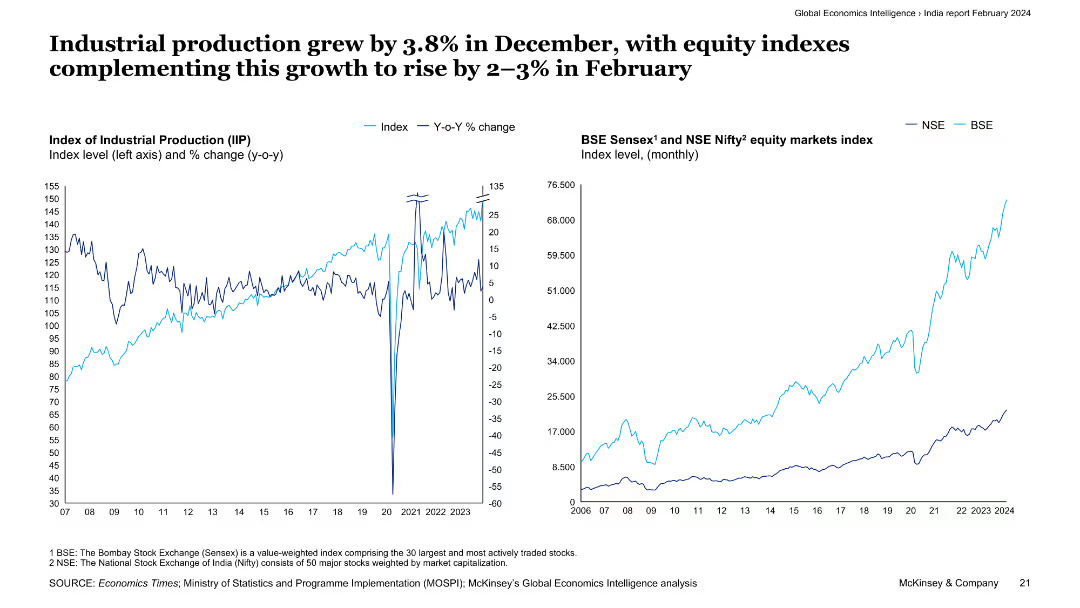
Two line charts are shown: the left chart illustrates the index and year-on-year change in industrial production, while the right chart depicts the BSE Sensex and NSE Nifty equity market indexes.
Market Analysis and Trends
Industrial & Manufacturing
The slide highlights a 3.8% growth in industrial production for December, supported by rising equity indexes in February. It provides an analysis of industrial output and stock market performance in India.
industrial production, equity indexes, BSE Sensex, NSE Nifty, market performance
false
Market Analysis and Trends
Industrial & Manufacturing
Multiple Chart
McKinsey
Add to my slides
Remove from favorites
Two juxtaposed line charts, one for Industrial Production and one for equity markets, with descriptive texts and a dark background.
Market Analysis and Trends
Financial Services
Slide compares trends in industrial production with equity market performances, useful for investment strategizing and economic assessments.
Industrial production, equity markets, Sensex, Nifty, economic trends, investment
false
Market Analysis and Trends
Financial Services
Multiple Chart
McKinsey
Add to my slides
Remove from favorites
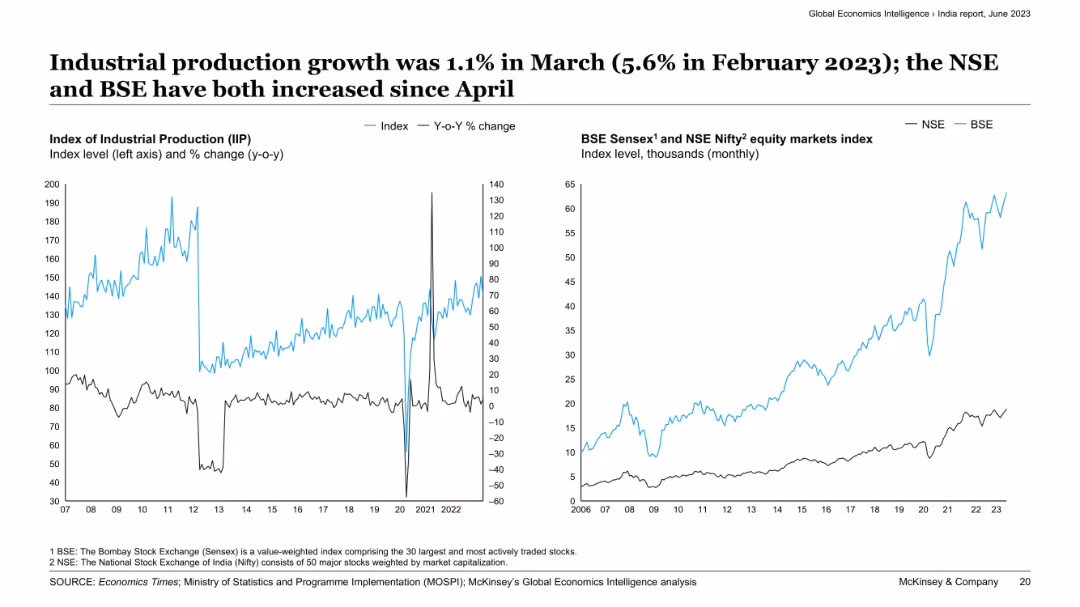
Dual-panel charts with IIP index and YoY growth (left) and stock index performance of NSE and BSE (right).
Performance Metrics and KPIs
Industrial & Manufacturing
The slide illustrates India’s industrial production performance with a modest YoY growth in March. Equity market indices (BSE and NSE) have increased since April, signaling investor confidence and possible economic recovery in the manufacturing and industrial sectors.
industrial production, India, IIP, BSE, NSE, stock market, growth, equity index, manufacturing, recovery
false
Performance Metrics and KPIs
Industrial & Manufacturing
Multiple Chart
McKinsey
Add to my slides
Remove from favorites
This slide is divided into two sections, each featuring a graph. On the left, the Index of Industrial Production is displayed with dual axes for level and percent change. On the right, the performance of stock markets (BSE Sensex and NSE Nifty) is shown in a line graph. The design is data-heavy and focused on visual representation of statistics.
Financial Performance
Industrial & Manufacturing
It explores India's industrial production growth with a year-on-year comparison and stock market indices' performance. The presentation of the data allows for analysis of economic health and investment potential, particularly beneficial for stakeholders in industrial and financial sectors seeking to understand market trends and economic vitality.
Industrial Production, NSE, BSE, Stock Market, India, Growth, Economy
false
Financial Performance
Industrial & Manufacturing
Multiple Chart
McKinsey
Add to my slides
Remove from favorites
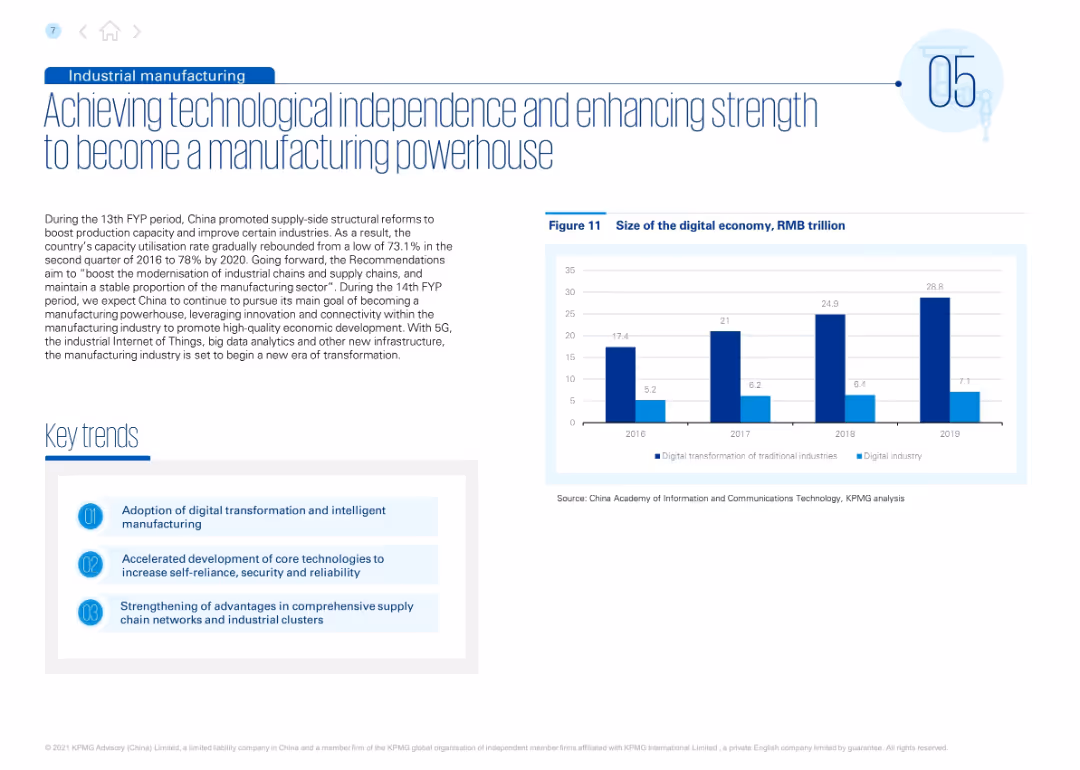
Split layout with text and “Key trends” on the left; right side includes a vertical bar chart showing growth of the digital economy by year.
Strategic Planning
Industrial & Manufacturing
This slide emphasizes China’s drive for technological self-reliance and manufacturing modernization. It outlines key policies and trends, including adoption of digital transformation, core tech development, and supply chain strengthening. Supporting chart illustrates digital economy expansion from 2016 to 2019.
industrial reform, manufacturing, supply chain, digital economy, innovation, 5G, IoT, AI, China strategy, economic development
false
Strategic Planning
Industrial & Manufacturing
Mixed Chart
KPMG
Add to my slides
Remove from favorites
The slide presents a diagram of the industrial technology stack, illustrating various components and sample companies involved in the process-level, system integration, and instruments levels.
Competitive Landscape
Industrial & Manufacturing
The slide categorizes different companies and technologies involved in industrial automation, highlighting the complexity and diversity of the industrial technology stack.
industrial technology, stack, companies, components, process-level, system integration, instruments
false
Competitive Landscape
Industrial & Manufacturing
Framework
LEK
Add to my slides
Remove from favorites
Includes a balance column chart showing job gains and losses across different industrial trends.
Market Analysis and Trends
Industrial & Manufacturing
Summarizes the net effect of various industrial trends on employment, showing overall stability despite fluctuations caused by factors like technology and offshoring. Provides a comprehensive view of the employment landscape.
Industrial Trends, Employment Stability, Job Gains, Job Losses
false
Market Analysis and Trends
Industrial & Manufacturing
Single Chart
BCG
Add to my slides
Remove from favorites
Displays a list of six key trends affecting industry employment with associated icons for each trend.
Market Analysis and Trends
Industrial & Manufacturing
Discusses major industrial trends such as technology evolution and market shifts, and their implications on employment in the sector. Offers a strategic overview of factors influencing job dynamics.
Industrial Trends, Employment, Technology Evolution, Market Shifts
false
Market Analysis and Trends
Industrial & Manufacturing
Header Vertical
BCG
Add to my slides
Remove from favorites
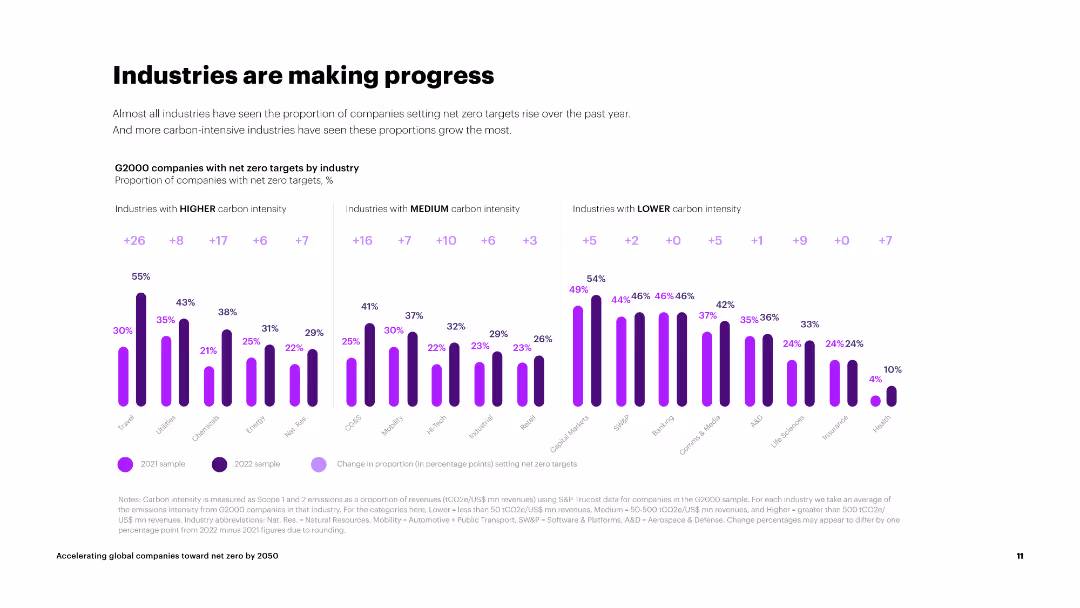
The slide shows three sets of column charts categorizing industries by carbon intensity and their net zero target progress.
Market Analysis and Trends
Environmental Services & Sustainability
The slide presents data on the progress of industries with different carbon intensities in setting net zero targets, showing significant improvements across sectors.
industries, carbon intensity, net zero targets, progress, high carbon, medium carbon, low carbon
false
Market Analysis and Trends
Environmental Services & Sustainability
Multiple Chart
Accenture
Add to my slides
Remove from favorites
The slide displays a series of bar charts depicting the digital marketing maturity levels across various industries like financial services, retail.
Competitive Landscape
Media & Entertainment
Examines digital marketing maturity across different industries, highlighting significant variances in maturity levels.
industries, digital marketing, maturity, financial services, retail, comparison
false
Competitive Landscape
Media & Entertainment
Single Chart
BCG
Add to my slides
Remove from favorites
Bubble chart correlating median industry earnings with job vulnerability and education levels, color-coded by percentage of jobs requiring a bachelor's degree.
Market Analysis and Trends
Education & Training
Correlates industries with wages and educational attainment, indicating the potential impact of COVID-19 on these factors.
industries, education, wages, vulnerability, COVID-19, bachelor's degree
false
Market Analysis and Trends
Education & Training
Single Chart
McKinsey
Add to my slides
Remove from favorites
This slide showcases a list of industries with relevant examples of how they are affected by software development trends. Icons and colored markers are used to denote the level of industry relevance, creating a clear visual hierarchy and focus points. The layout is simple, prioritizing clarity and readability.
Industry Overview
Technology & Software
The slide addresses the broad impact of software development trends across various industries, providing examples and common industry qualities. It emphasizes the transformative role of technology in sectors like financial services, healthcare, and manufacturing, making it relevant for a cross-industry audience.
Industries, Software Development, Impact, Financial Services, Healthcare, Manufacturing
false
Industry Overview
Technology & Software
Header Vertical
McKinsey
Add to my slides
Remove from favorites
Exhibit 2 displays a table categorizing technology trends and their relevance across multiple industries with color-coded relevance.
Industry Overview
Technology & Software
This table slide exhibits the relevance of various technology trends across different industry sectors.
Industries, Technology, Trends, Relevance, Silicon Age, Engineering Tomorrow
false
Industry Overview
Technology & Software
Single Chart
McKinsey
Add to my slides
Remove from favorites
This slide displays a bar chart with varying lengths representing the adoption of Industry 4.0 technologies like AI, robotics, and biotech in the food sector. Each technology is color-coded, enhancing readability and focus. The design is straightforward, emphasizing data presentation.
Customer and Market Segmentation
Agriculture & Food Production
It examines the adoption rates of Industry 4.0 technologies in the food sector, highlighting areas such as biotech, robotics, and AI. The slide is useful for discussions on technological advancements and strategic planning in the food industry.
Industry 4.0, technology adoption, food sector, AI, robotics, biotech, technological advancements, strategic planning
false
Customer and Market Segmentation
Agriculture & Food Production
Mixed Chart
Deloitte
Add to my slides
Remove from favorites
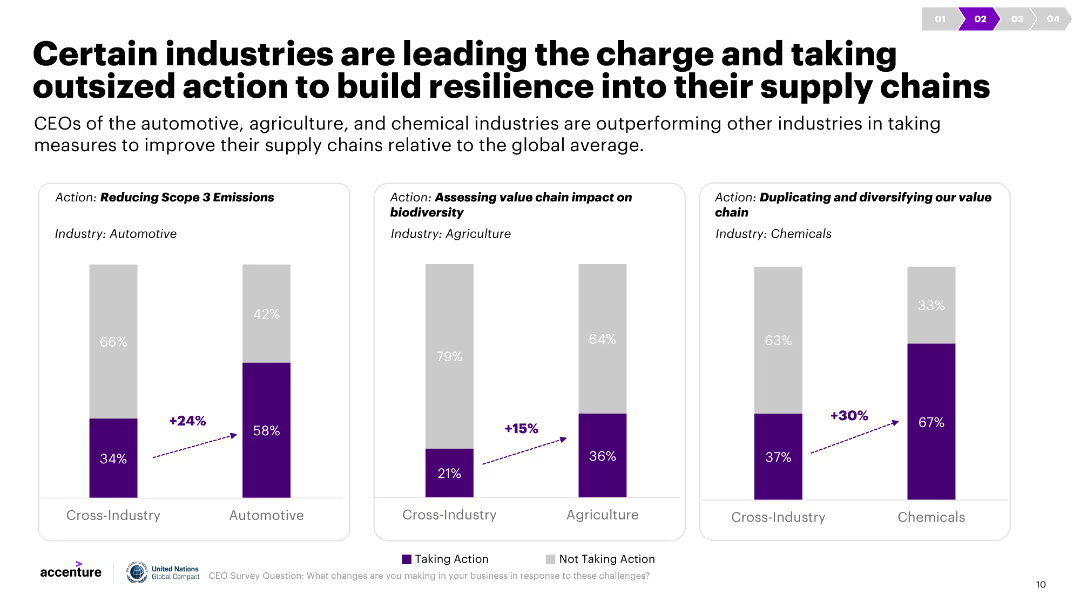
Three column charts illustrate actions taken by different industries to improve supply chain resilience, with cross-industry comparisons. Commentary explains the data.
Strategic Planning
Transportation & Logistics
The slide compares the automotive, agriculture, and chemical industries' efforts to improve supply chain resilience, highlighting measures like emissions reduction and biodiversity assessments.
Industry actions, supply chain, resilience, automotive, agriculture, chemicals
false
Strategic Planning
Transportation & Logistics
Multiple Chart
Accenture
Add to my slides
Remove from favorites
Stacked bar graph depicting anticipated approaches to agility in various industries by 2026, along with a pie chart of overall percentages.
Strategic Planning
Professional Services
Predicts the future of agility in different industries, providing a comparative look at expected strategic changes by 2026.
Industry Agility, Future Forecast, Strategic Change, Bar Graph, Pie Chart
false
Strategic Planning
Professional Services
Single Chart
Kearney
Add to my slides
Remove from favorites
Moderate visual complexity, the slide displays a matrix linking key industry sectors with specific automation applications that address the megatrends discussed earlier. It includes icons and a clear layout to illustrate these connections.
Technology and Digital Transformation
Industrial & Manufacturing
The slide delves into how new process automation applications are being deployed across various industry sectors in response to overarching megatrends. It explores specific examples within sectors, providing insights into the operational applications of these technologies.
Industry applications, Process automation, Sector-specific, Deployment
false
Technology and Digital Transformation
Industrial & Manufacturing
Table
LEK
Add to my slides
Remove from favorites
Features a bar graph with different industries represented by colored bars, indicating the percentage breakdown of survey respondents.
Market Analysis and Trends
Media & Entertainment
Provides an industry breakdown of survey participants, which can be used for analyzing market distribution and consumer segments.
Industry Breakdown, Survey Respondents, Market Distribution, Consumer Segments, Percentage Breakdown
false
Market Analysis and Trends
Media & Entertainment
Single Chart
Kearney
Add to my slides
Remove from favorites
Features a bar chart showing levels of collaboration with industry peers on cybersecurity.
Risk Assessment and Management
Telecommunications
Discusses the collaborative efforts between companies to enhance cybersecurity and reduce potential risks, with comparative data by region.
industry collaboration, cybersecurity, risk reduction, survey data, regional comparison
false
Risk Assessment and Management
Telecommunications
Mixed Chart
PwC/Strategy&
Add to my slides
Remove from favorites
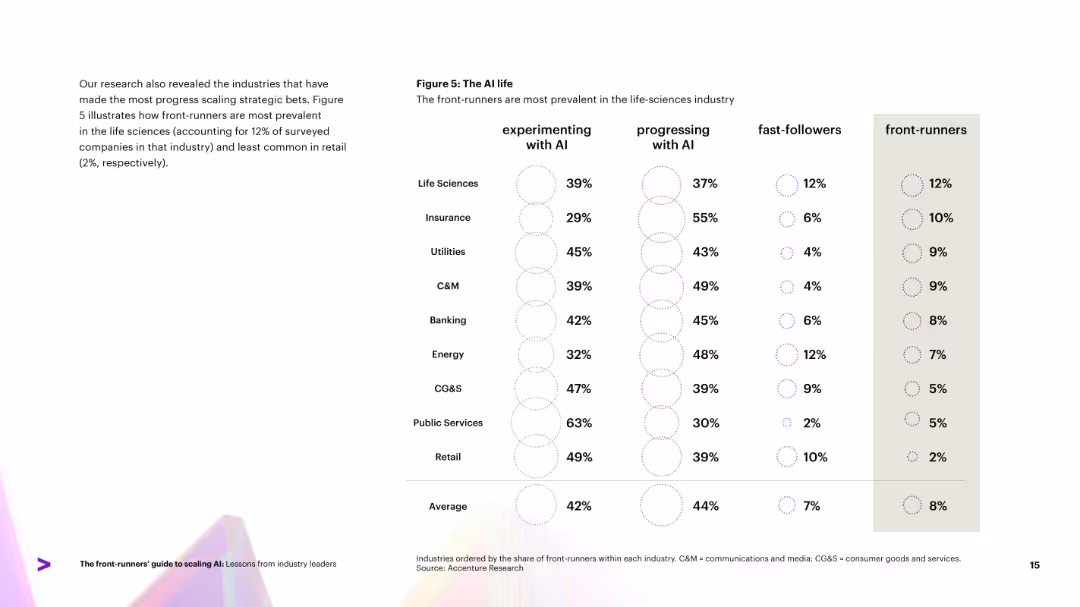
Table and dot matrix chart showing AI maturity distribution across industries. Columns for experimenting, progressing, fast-followers, and front-runners.
Industry Overview
Artificial Intelligence
Compares AI adoption stages across industries, identifying life sciences and insurance as leaders in producing AI front-runners, while retail lags. Displays maturity stage distributions to show where industries stand in their AI journey.
industry comparison, AI maturity, life sciences, front-runners, adoption
false
Industry Overview
Artificial Intelligence
Mixed Chart
Accenture
Add to my slides
Remove from favorites
The slide shows a stacked bar graph comparing the office dependency of various industries. The green shades represent different work models from fully remote to fully office-based.
Market Analysis and Trends
Professional Services
This analysis is critical for understanding industry-specific work patterns, potentially used by managers to benchmark their own company's remote work policies.
Industry Comparison, Office Dependency, Work Patterns, Benchmarking, Remote Work
false
Market Analysis and Trends
Professional Services
Single Chart
EY
Add to my slides
Remove from favorites
The slide features prominent statistics, infographics, and text. The use of white and purple colors divides the slide into different sections, aiding in the distribution of information.
Risk Assessment and Management
Technology & Software
Presenting executive insights into the benefits of industry convergence, this slide illustrates the perceived growth opportunities through convergence and examples of High Tech industry convergence opportunities such as smart mobility and digital health.
industry convergence, C-suite executives, long-term growth, competition, revenue growth, smart mobility, connected infrastructure, digital health, High Tech opportunities, executive agreement
true
Risk Assessment and Management
Technology & Software
Single Chart
Accenture
Add to my slides
Remove from favorites
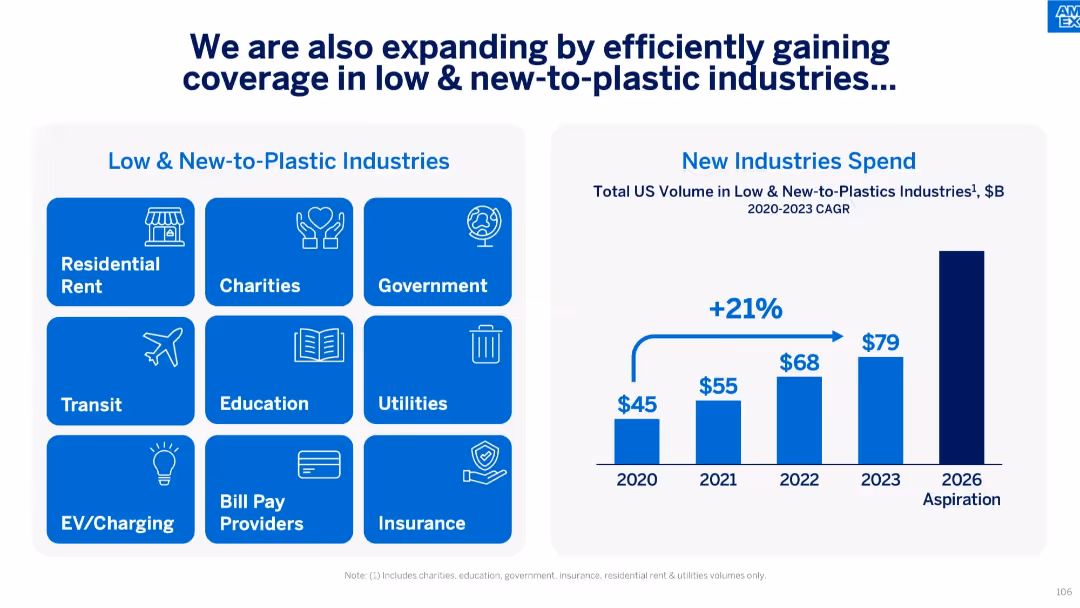
Left: grid of icons and industries; Right: bar chart showing industry volume growth from 2020 to 2023 and aspiration for 2026.
Market Analysis and Trends
Financial Services
The slide details expansion into low and new-to-plastic industries such as rent, education, and utilities. It shows a 21% CAGR in volume from 2020–2023, with expectations of further growth by 2026.
Industry Expansion, Low-to-Plastic, Growth, Volume, Education, Rent, Utilities, Spend
false
Market Analysis and Trends
Financial Services
Mixed Chart
McKinsey
Add to my slides
Remove from favorites
Bar graph showcasing the sales of US merchant wholesalers by segment, complemented by a side list detailing EY-Parthenon's relevant experience in the distribution sector.
Industry Overview
Financial Services
Introduces EY-Parthenon's industrial practices and experience, useful for establishing credibility in the field of distribution business consulting.
industry experience, distribution, EY-Parthenon, merchant wholesalers, market segmentation, due diligence, commercial strategy
false
Industry Overview
Financial Services
Single Chart
EY
Add to my slides
Remove from favorites
Features icons representing various industries arranged in a grid format. Each icon is labeled, and the slide uses a minimalist design with light colors.
Competitive Landscape
Professional Services
Displays Alvarez & Marsal's industry expertise across multiple sectors such as healthcare, automotive, and financial services. This slide is useful for showcasing the firm's wide-ranging capabilities and areas of operation.
industry expertise, automotive, healthcare, financial services, consulting
false
Competitive Landscape
Professional Services
Table
Alvarez & Marsal
Add to my slides
Remove from favorites
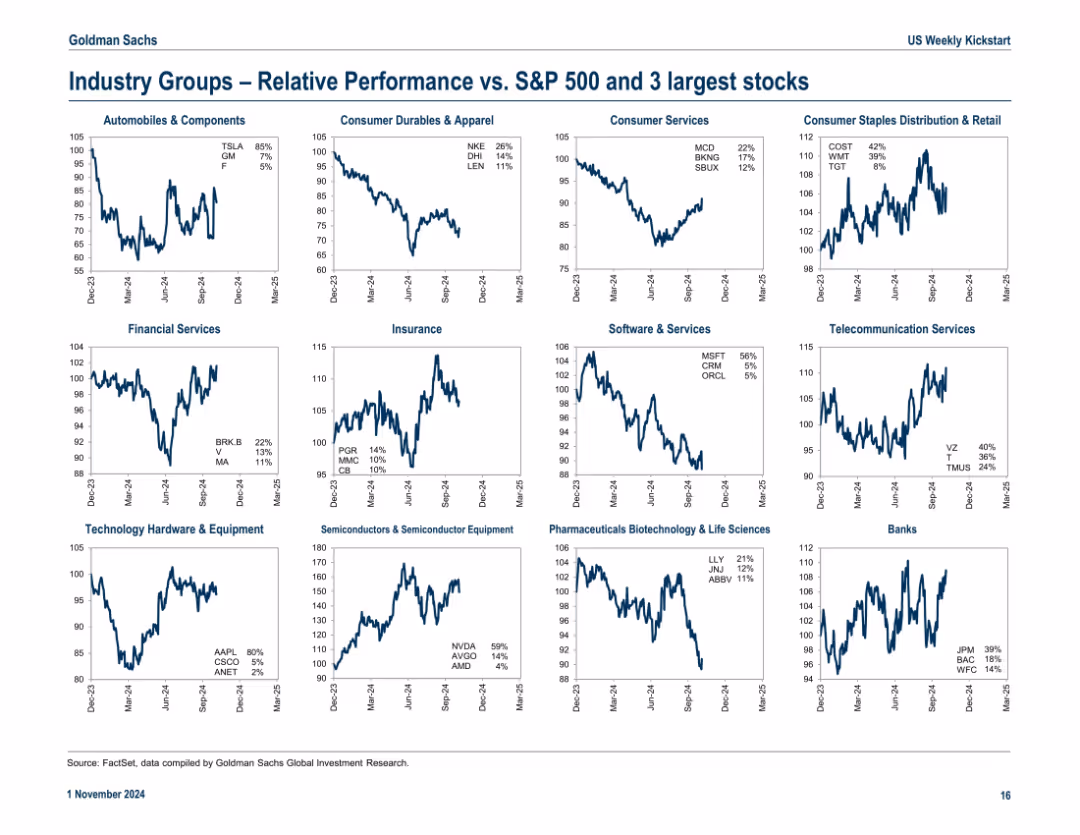
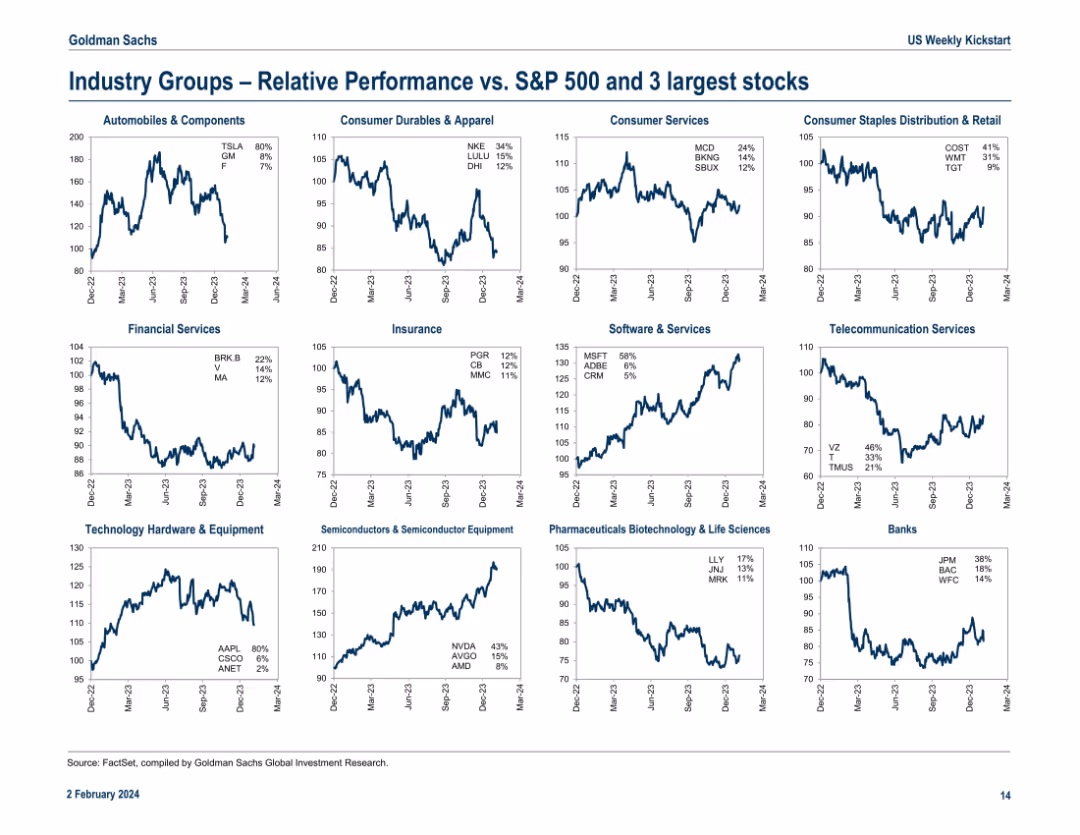
Grid of 15 charts showing relative performance of various industry groups with top 3 stocks highlighted in each panel
Market Analysis and Trends
Financial Services
Breaks down performance of specific industry groups, comparing them to the S&P 500 and identifying the three dominant companies by weight. Useful for granular sector-level insight.
industry groups, sector analysis, top holdings, stock weights, relative return
false
Market Analysis and Trends
Financial Services
Multiple Chart
Goldman Sachs
Add to my slides
Remove from favorites
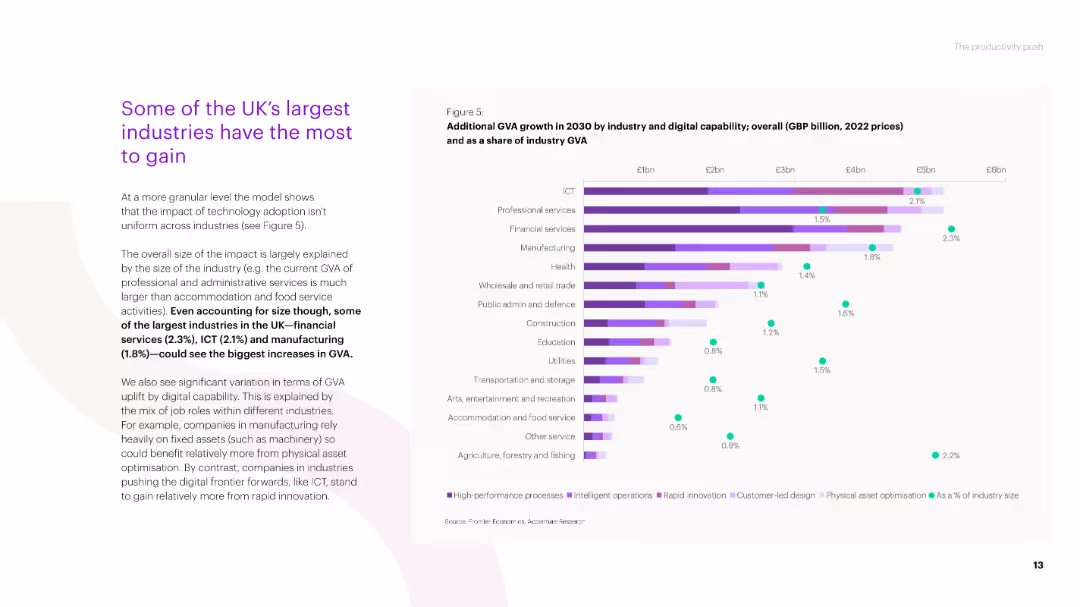
A mixed layout slide with text and a bar chart. The bar chart displays additional GVA growth by industry in 2030 due to digital capability, shown in GBP billion and as a share of industry GVA.
Market Analysis and Trends
Technology & Software
The slide outlines the industries in the UK that stand to gain the most from digital adoption, with a focus on professional services, ICT, and manufacturing, showing projected GVA growth by 2030.
industry growth, GVA, digital capability, professional services, ICT, manufacturing
false
Market Analysis and Trends
Technology & Software
Mixed Chart
Accenture
Add to my slides
Remove from favorites
Bar chart showing industry growth expectations and inflation sentiment. Majority bars are green and blue indicating positive/accurate sentiment.
Market Analysis and Trends
Financial Services
This slide presents industry growth expectations for 2023 and respondents' sentiments on inflation rates, suggesting that most expect growth despite low reported inflation.
Industry growth, inflation, expectations, sentiment, 2023, survey, respondents, positive, accuracy
false
Market Analysis and Trends
Financial Services
Multiple Chart
EY
Add to my slides
Remove from favorites
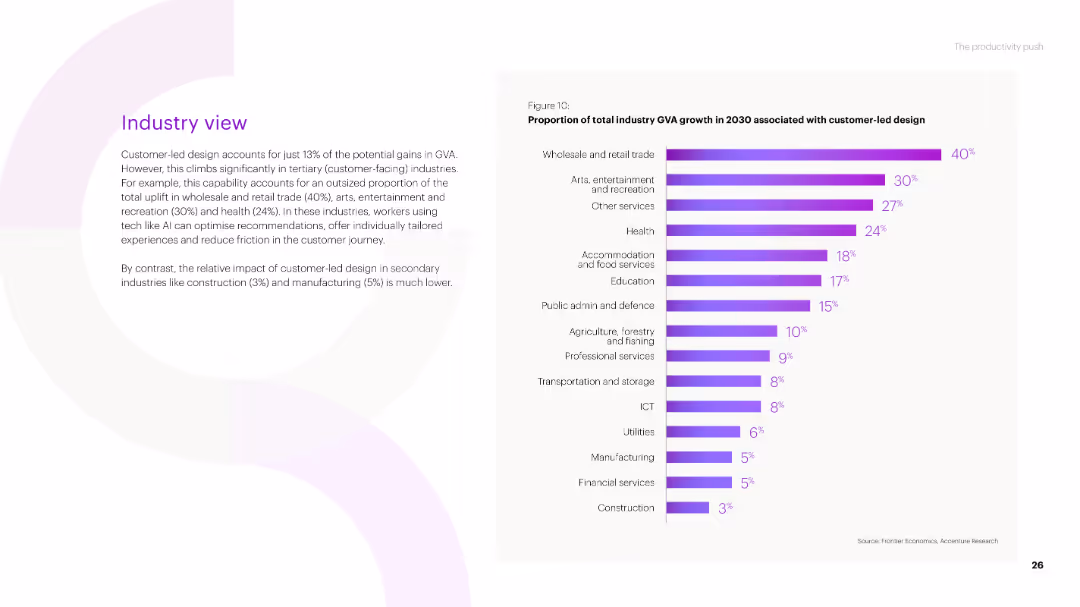
A bar chart showing the proportion of total industry GVA growth in 2030 associated with customer-led design across various industries, with percentages indicated for each industry.
Market Analysis and Trends
Technology & Software
The slide analyzes the role of customer-led design in driving industry GVA growth by 2030, emphasizing its impact on sectors like wholesale and retail trade, arts and entertainment, and health.
industry GVA, customer-led design, growth, wholesale and retail trade, arts and entertainment, health
false
Market Analysis and Trends
Technology & Software
Mixed Chart
Accenture
Add to my slides
Remove from favorites
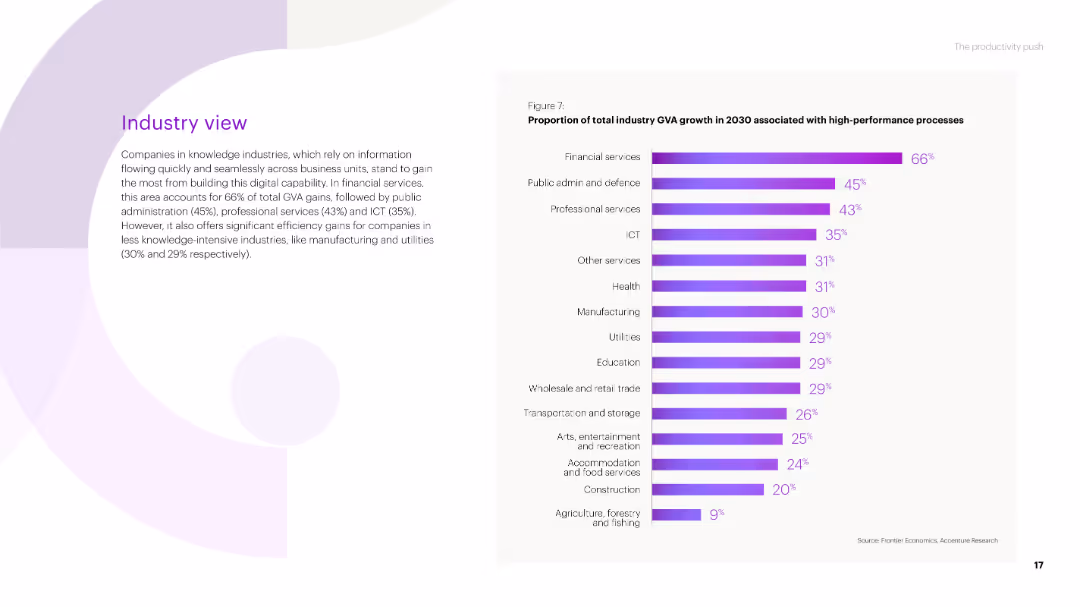
A bar chart showing the proportion of total industry GVA growth in 2030 associated with high-performance processes across various industries, with percentages indicated for each industry.
Market Analysis and Trends
Technology & Software
The slide presents data on the contribution of high-performance processes to GVA growth by industry, highlighting sectors like financial services, public administration, and ICT.
industry GVA, high-performance processes, growth, financial services, public administration
false
Market Analysis and Trends
Technology & Software
Mixed Chart
Accenture
Add to my slides
Remove from favorites
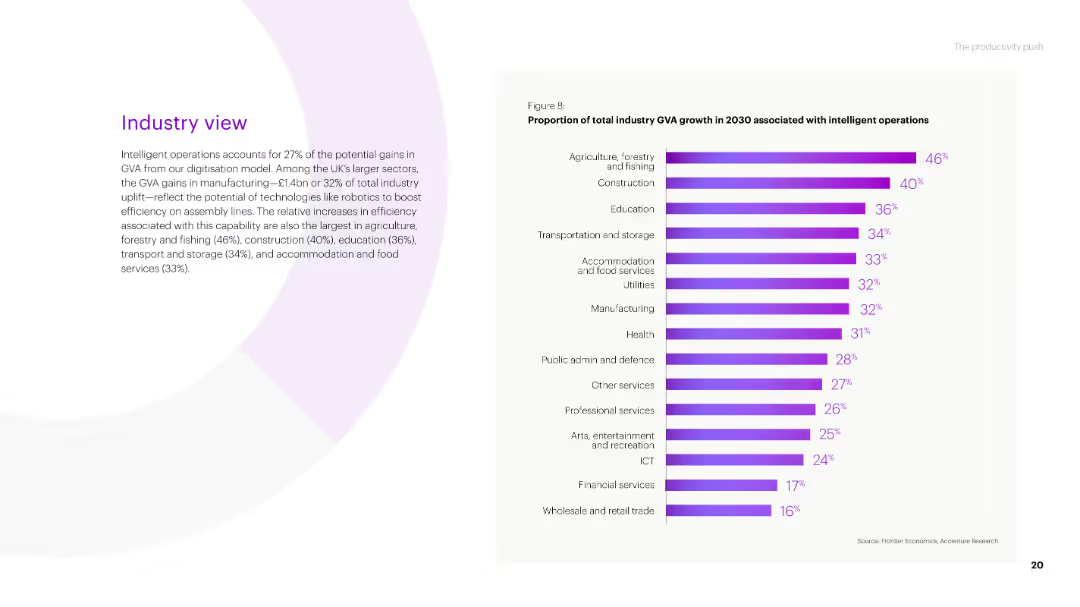
A bar chart showing the proportion of total industry GVA growth in 2030 associated with intelligent operations across various industries, with percentages indicated for each industry.
Market Analysis and Trends
Technology & Software
The slide focuses on the impact of intelligent operations on industry GVA growth by 2030, with significant contributions from sectors like agriculture, construction, and education.
industry GVA, intelligent operations, growth, agriculture, construction, education
false
Market Analysis and Trends
Technology & Software
Mixed Chart
Accenture
Add to my slides
Remove from favorites
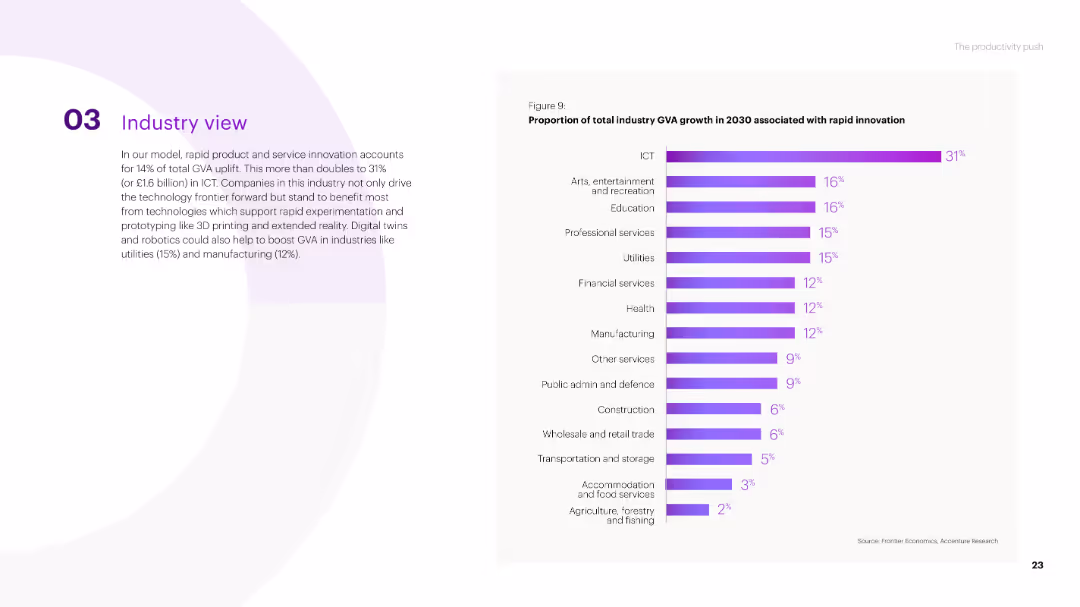
A bar chart showing the proportion of total industry GVA growth in 2030 associated with rapid innovation across various industries, with percentages indicated for each industry.
Market Analysis and Trends
Technology & Software
The slide highlights the impact of rapid product and service innovation on industry GVA growth by 2030, particularly in ICT, arts and entertainment, and education sectors.
industry GVA, rapid innovation, growth, ICT, arts and entertainment, education
false
Market Analysis and Trends
Technology & Software
Mixed Chart
Accenture
Add to my slides
Remove from favorites
A mixed format slide, combining column chart, pie charts, and iconographic bullets. The colors are muted tones of gray, green, and blue, highlighting specific metrics and stats.
Market Analysis and Trends
Financial Services
It presents the financial industry's challenges and the strategies to maintain performance, growth in ETFs, and value beyond products, emphasizing strong investment and client experience.
Industry Headwinds, Investment Performance, ETF Growth, Client Experience, Financial Services, Strategy, Value, Solutions
false
Market Analysis and Trends
Financial Services
Multiple Chart
JP Morgan
Add to my slides
Remove from favorites
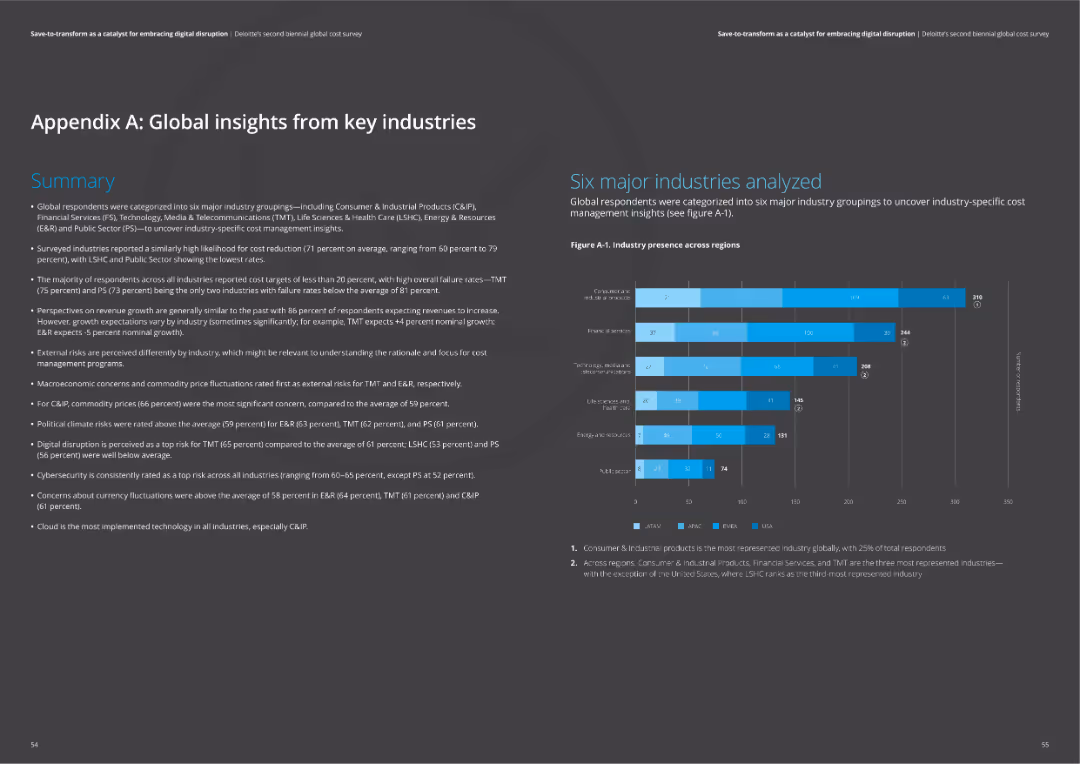
The slide has a dark background with a summary section and a bar chart showing industry presence across regions. It covers various industries such as C&IP, FS, TMT, and more.
Industry Overview
Professional Services
This slide provides a high-level summary of insights from key industries, detailing cost reduction trends and failure rates. It includes comparative data on industry presence and external risks like macroeconomic concerns and commodity prices.
industry insights, cost reduction, failure rates, macroeconomic concerns, commodity prices
false
Industry Overview
Professional Services
Mixed Chart
Deloitte
Add to my slides
Remove from favorites
Column charts for portfolio loans and line graph for utilization trend, accompanied by a small pie chart and key statistics in a tabular format. Clear segmentation of data.
Financial Performance
Industrial & Manufacturing
Focuses on commercial and industrial loan portfolio details with trends and key statistics. It can be used to track the performance and risk of loans in the industrial sector, helping stakeholders make informed decisions about lending and financial management.
Industry, Loans, Risk, Performance, Trends
false
Financial Performance
Industrial & Manufacturing
Multiple Chart
Morgan Stanley
Add to my slides
Remove from favorites
Charts showing the maturity level distribution across various industries.
Technology and Digital Transformation
Media & Entertainment
Analyzes the distribution of maturity levels within industries like retail, consumer goods, and telco.
industry, maturity, distribution, retail, CPG, telco
false
Technology and Digital Transformation
Media & Entertainment
Multiple Chart
BCG
Add to my slides
Remove from favorites
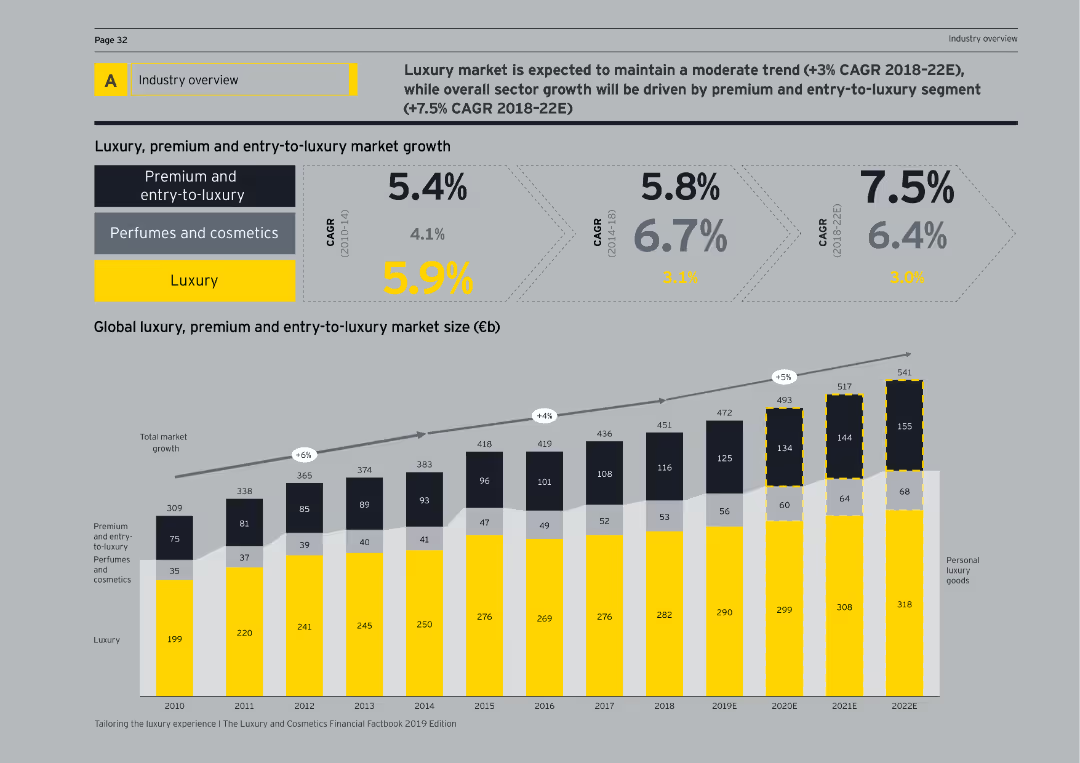
This slide presents growth rates in luxury, premium, and entry-to-luxury markets, supported by a column chart showing market size from 2010 to 2022E.
Industry Overview
Consumer Goods
Highlights the growth trends and market sizes for luxury, premium, and entry-to-luxury segments, projecting future trends and CAGR percentages.
industry overview, luxury, premium, entry-to-luxury, market growth, CAGR, market size, 2010-2022E, column chart, consumer goods
false
Industry Overview
Consumer Goods
Mixed Chart
EY
Add to my slides
Remove from favorites
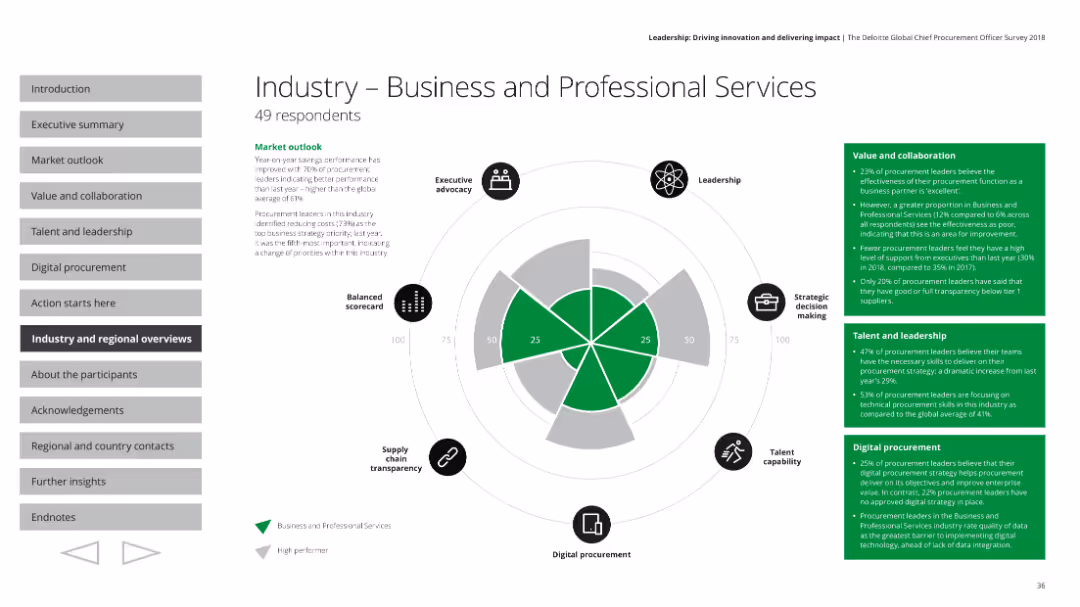
Includes a radar chart and text blocks summarizing key performance areas like market outlook, value and collaboration, and leadership in the industry.
Industry Overview
Professional Services
Provides an overview of the business and professional services industry, detailing performance metrics, strategic priorities, and leadership challenges.
Industry overview, performance, strategy, leadership
false
Industry Overview
Professional Services
Mixed Chart
Deloitte
Add to my slides
Remove from favorites
16-panel grid of line charts showing relative performance of specific industry groups versus the S&P 500. Each chart includes annotations for top 3 performing stocks in that group with respective YTD returns.
Competitive Landscape
Financial Services
The slide breaks down relative performance of key industry groups such as Automobiles, Software, and Banks against the S&P 500, highlighting leaders like TSLA, MSFT, and JPM. Performance trends since Dec 2022 are visualized with specific stock contributions, helping investors pinpoint which stocks are driving sector trends. This view is helpful for benchmarking and identifying outperformers within industries.
industry performance, S&P 500, TSLA, MSFT, JPM, stock returns, benchmarking, sector leaders, relative trends, outperformers
false
Competitive Landscape
Financial Services
Multiple Chart
Goldman Sachs
Add to my slides
Remove from favorites
This slide uses a table format to present examples of industry players in Web3, with a column for industry, example, and description. The design is straightforward with a white background and colored icons for visual differentiation.
Industry Overview
Technology & Software
Provides examples of influential companies and initiatives within various industries that are leveraging Web3 technologies, such as the USDF consortium in financial services and Nike's acquisition in gaming.
Industry Players, Web3, Innovation, Case Studies
false
Industry Overview
Technology & Software
Header Vertical
McKinsey
Add to my slides
Remove from favorites
Simple text layout with logos of recognizing bodies, highlighting industry accolades.
Market Analysis and Trends
Professional Services
Summarizes industry recognition and credentials in the field of disputes and investigations, emphasizing the firm’s standing and expertise recognized by several prestigious entities, fostering trust and credibility.
industry recognition, disputes, investigations, accolades, trust
false
Market Analysis and Trends
Professional Services
Table
Alvarez & Marsal
Add to my slides
Remove from favorites
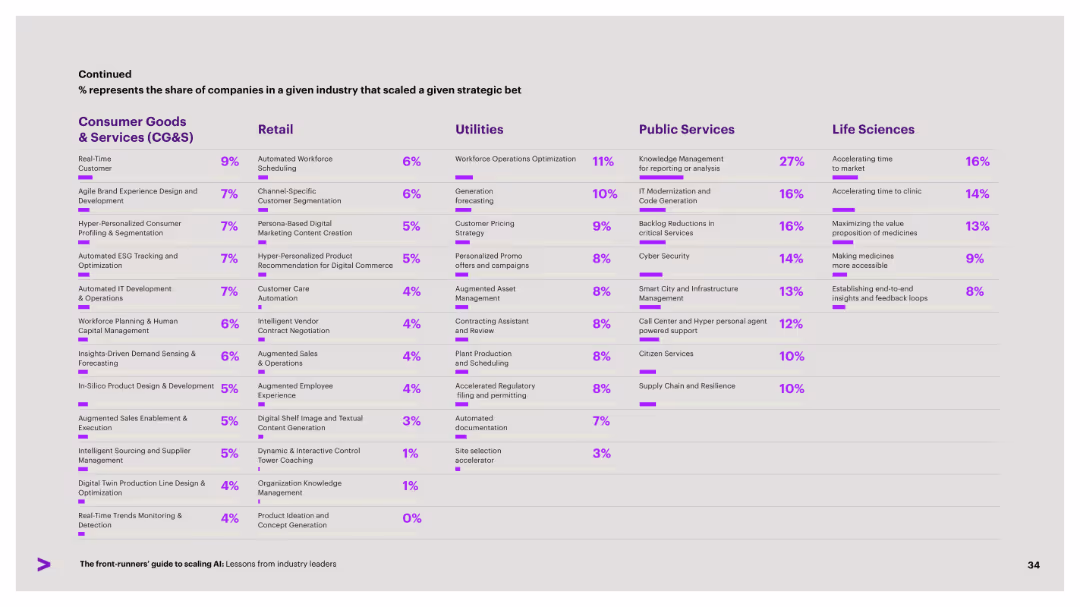
Continuation of previous slide in same layout, showing strategic AI bets by industry. Purple % bars illustrate adoption.
Strategic Planning
Artificial Intelligence
A continuation of strategic AI initiatives by industry, covering sectors like CG&S, Retail, Utilities, Public Services, and Life Sciences. The slide emphasizes the percentage of companies scaling each initiative.
industry scaling, AI strategy, CG&S, Life Sciences, digital innovation
false
Strategic Planning
Artificial Intelligence
Single Chart
Accenture
Add to my slides
Remove from favorites
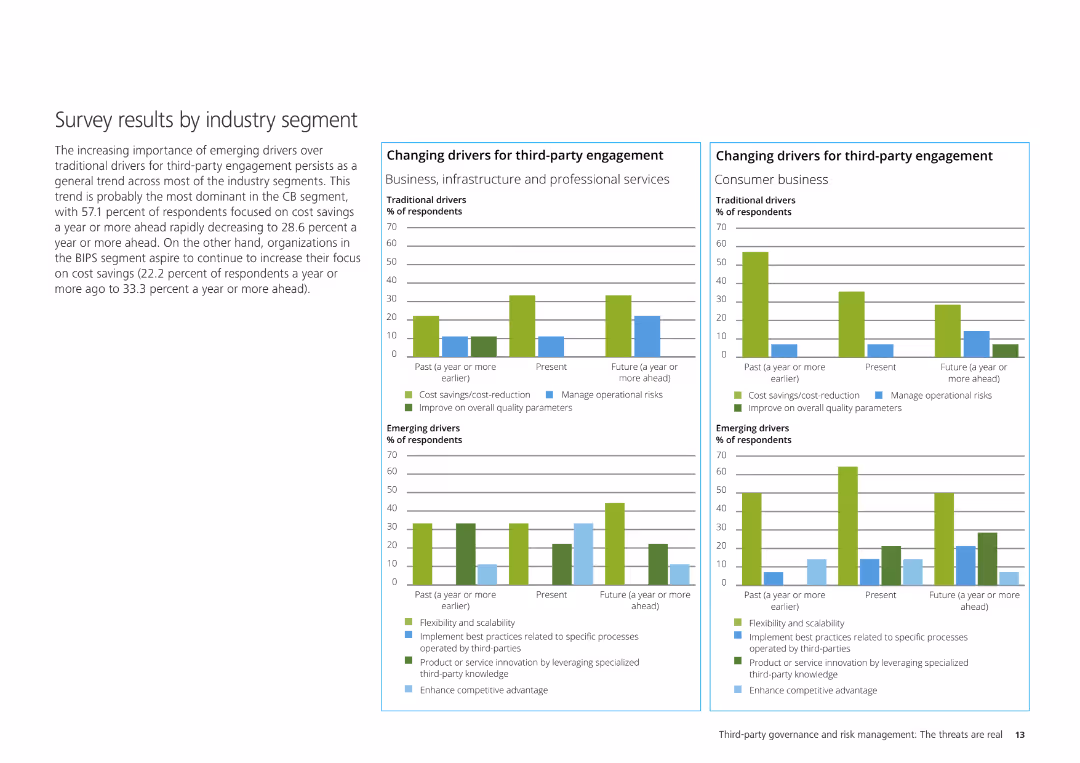
The slide contains three column charts displaying the changing drivers for third-party engagement across Business, Infrastructure & Professional Services, and Consumer.
Market Analysis and Trends
Professional Services
It shows survey results segmented by industry, analyzing traditional and emerging drivers for third-party engagement within specific industry segments.
Industry segment, third-party engagement, survey results, traditional drivers, emerging drivers
false
Market Analysis and Trends
Professional Services
Multiple Chart
Deloitte
Add to my slides
Remove from favorites
Uses icons and bullet points to represent 18 focus industries, with side panels discussing market strategies related to the innovation and green economy.
Industry Overview
Financial Services
Highlights the benefits of JPMorgan’s industry-specific coverage model, which enhances client value and risk management through specialized knowledge and sector-specific solutions.
Industry-Specific, Risk Management, Banking, Client Value, Innovation, Green Economy
false
Industry Overview
Financial Services
Table
JP Morgan
Add to my slides
Remove from favorites
This slide utilizes various icons and table to detail significant challenges across sectors such as Mining, Refining, Cell Manufacturing, and more, within the battery production industry.
Strategic Planning
Government & Public Sector
Reviews the necessary policy actions to support the Australian battery production industry, addressing challenges from trade protection to technology access and coordination.
industry support, policy action, Australia, battery production, trade protection, technology access, coordination challenges, sector analysis
false
Strategic Planning
Government & Public Sector
Table
Accenture
Add to my slides
Remove from favorites
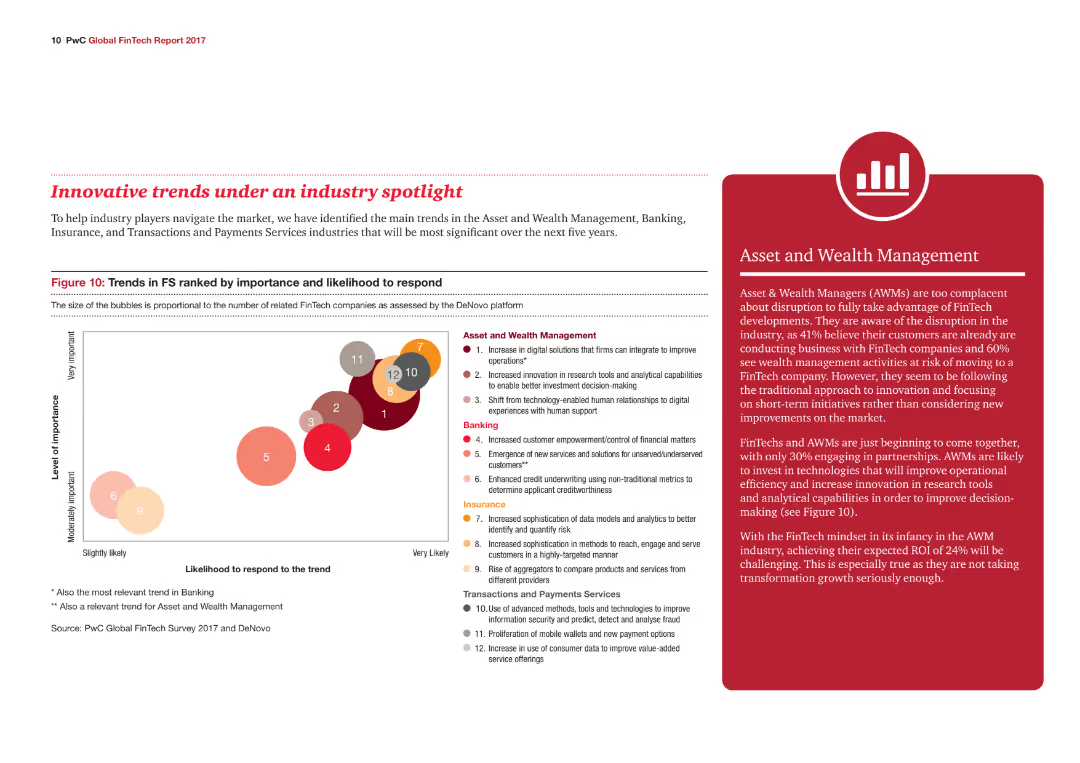
A bubble chart ranks trends in the financial services industry by importance and likelihood to respond, with different colored bubbles representing various industry trends.
Market Analysis and Trends
Financial Services
The slide outlines key trends in Asset and Wealth Management, Banking, Insurance, and Transactions and Payments Services, highlighting their importance and response likelihood.
Industry trends, Financial Services, Wealth Management, Banking, Insurance
false
Market Analysis and Trends
Financial Services
Mixed Chart
PwC/Strategy&
Add to my slides
Remove from favorites
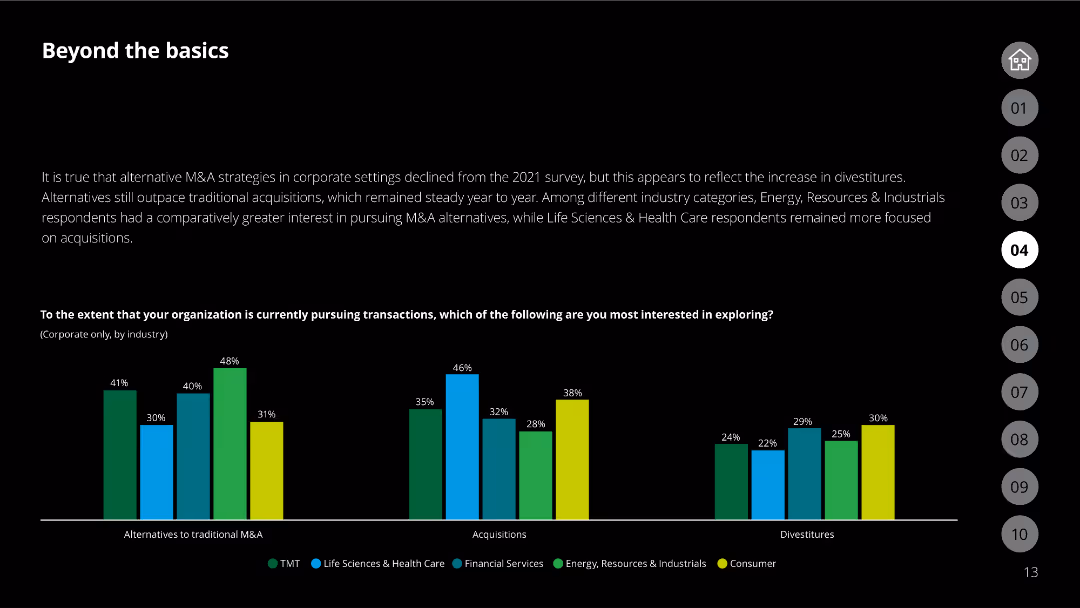
The slide has a column chart comparing interest in different M&A transaction types across various industries.
Market Analysis and Trends
Financial Services
Reflects the interest in alternative M&A strategies by different industry categories compared to 2021.
industry trends, M&A, corporate, acquisitions, divestitures
false
Market Analysis and Trends
Financial Services
Single Chart
Deloitte
Add to my slides
Remove from favorites
Contains bar charts reflecting managers' views on upcoming industry changes.
Market Analysis and Trends
Professional Services
Reviews how managers view potential industry shifts as opportunities or threats.
industry trends, managerial insights, digital transformation, generational impact, opportunity vs threat
false
Market Analysis and Trends
Professional Services
Multiple Chart
BCG
Add to my slides
Remove from favorites
Stacked bar graph showing the expected personalization approach across industries, with a focus on the move away from mass production.
Market Analysis and Trends
Retail & E-commerce
Details the shift towards personalization in industry product strategies by 2026, signaling a move away from solely mass-produced goods.
Industry Trends, Personalization, Mass Production, Strategic Planning, Bar Graph
false
Market Analysis and Trends
Retail & E-commerce
Single Chart
Kearney
Add to my slides
Remove from favorites
The slide features a column chart on the left side, text with icons in the middle, and a list of priorities on the right. The background shows shipping containers.
Market Analysis and Trends
Professional Services
It compares 3PE maturity across industries, expectations versus surprises in the 2022 study, and top priorities for 2022. It is used for highlighting industry trends.
Industry trends, procurement, priorities, maturity, expectations, surprises, collaboration, resilience
false
Market Analysis and Trends
Professional Services
Mixed Chart
Kearney
Add to my slides
Remove from favorites
The slide features a column chart on the left side, text with icons in the middle, and a list of priorities on the right. The background shows shipping containers.
Market Analysis and Trends
Professional Services
It compares 3PE maturity across industries, expectations versus surprises in the 2022 study, and top priorities for 2022. It is used for highlighting industry trends.
Industry trends, procurement, priorities, maturity, expectations, surprises, collaboration, resilience
false
Market Analysis and Trends
Professional Services
Multiple Chart
Kearney
Add to my slides
Remove from favorites
Previous
Next
You don't have any favorites yet.
Please wait loading your favorites slides...
Create a FREE account to continue browsing
Receive Instant Access to 1,000+ slides from companies like McKinsey, Google, and Goldman Sachs
First Name
Last Name
Email
Password
I agree to all
Terms & Privacy Policy
Thank you! Your submission has been received!
Oops! Something went wrong while submitting the form.
Have an account?
Sign in
Upgrade to PRO to Save slides
Advanced Search and Filters
Access to 15,000+ slides
Access to Category Pages
Save/Bookmark Slides
PowerPoint Template Library
Pick a Plan
MONTHLY
$12/month
Billed every month, Cancel anytime.
YEARLY
$9/year
Billed $108 annually, Cancel anytime.
Checkout for $12/month
Checkout for $108/yr
Secured by Stripe | AES-256 bit encryption