My Account
My Slides
Search by Category
Companies
Slide Type
Use Case
Industry
Pricing
Templates
View All Templates
Download Template Slides
✦ AI
AI Prompt Library
AI Search
Feedback
Login
Logout
Get Started
Browse all Slides
Browse all Slides
Create a FREE Account
Instant access to 1,000+ real slides from top companies like McKinsey, BCG, Goldman Sachs, Google and many more!
First Name
Last Name
Email
Password
I agree to all
Terms & Privacy Policy
Thank you! Your submission has been received!
Oops! Something went wrong while submitting the form.
Have an account?
Sign in
Saved Slides
Total No. of slides saved
0
↻ Refresh
✖ Clear all
Visuals include column charts for financial data, textual content for context, and a line graph for market trends.
Financial Performance
Financial Services
Reviews the performance of the CIB against industry wallet size and market share, including revenue and adjusted return on equity.
industry wallet, market share, CIB performance, capital requirements, return on equity, financial trends
false
Financial Performance
Financial Services
Multiple Chart
JP Morgan
Add to my slides
Remove from favorites
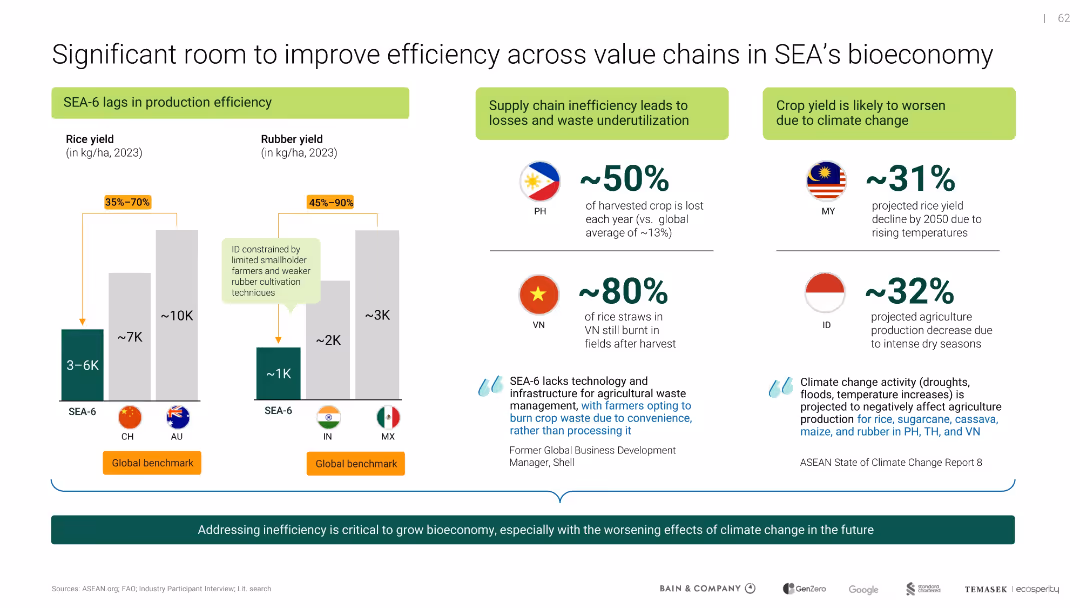
Combination of bar charts and icon-text blocks; segmented by inefficiency sources and climate threats
Operational Efficiency
Agriculture & Food Production
Illustrates production inefficiencies in SEA's rice and rubber sectors, with contributing factors like supply chain losses and climate change. Emphasizes the need for technology and waste management improvements.
inefficiency, value chain, rice yield, rubber yield, climate change, agriculture, SEA
false
Operational Efficiency
Agriculture & Food Production
Mixed Chart
Bain
Add to my slides
Remove from favorites
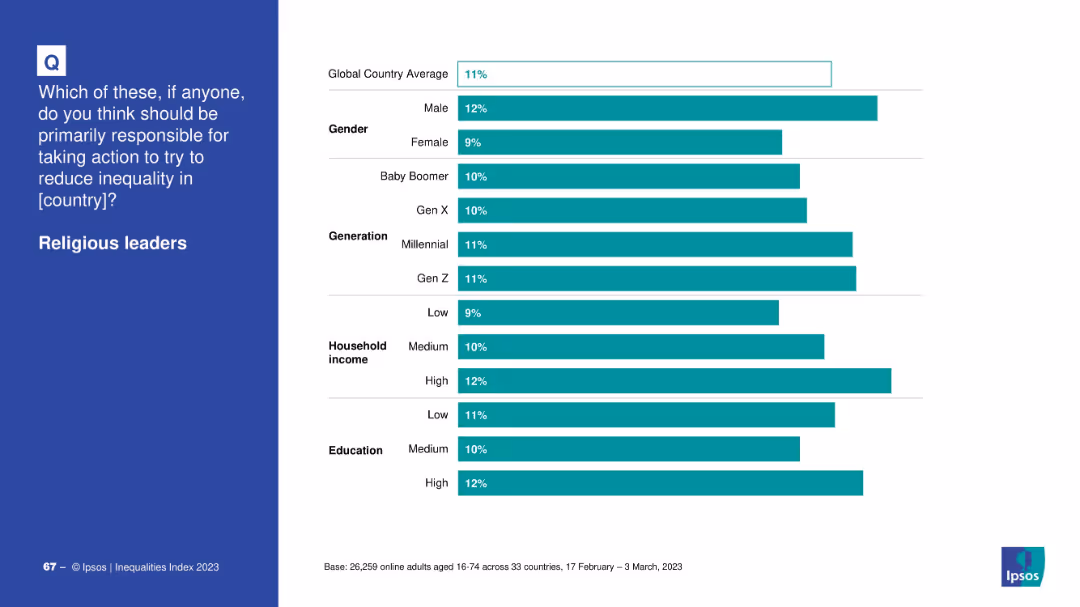
Horizontal bar chart segmented by demographic groups (gender, generation, income, education) with a left-side blue question prompt.
Market Analysis and Trends
Government & Public Sector
This slide shows a demographic breakdown of those who believe religious leaders should address inequality, noting slight gender and income-level differences.
inequality, demographics, religious responsibility, gender, income, education, generational views
false
Market Analysis and Trends
Government & Public Sector
Mixed Chart
IPSOS
Add to my slides
Remove from favorites
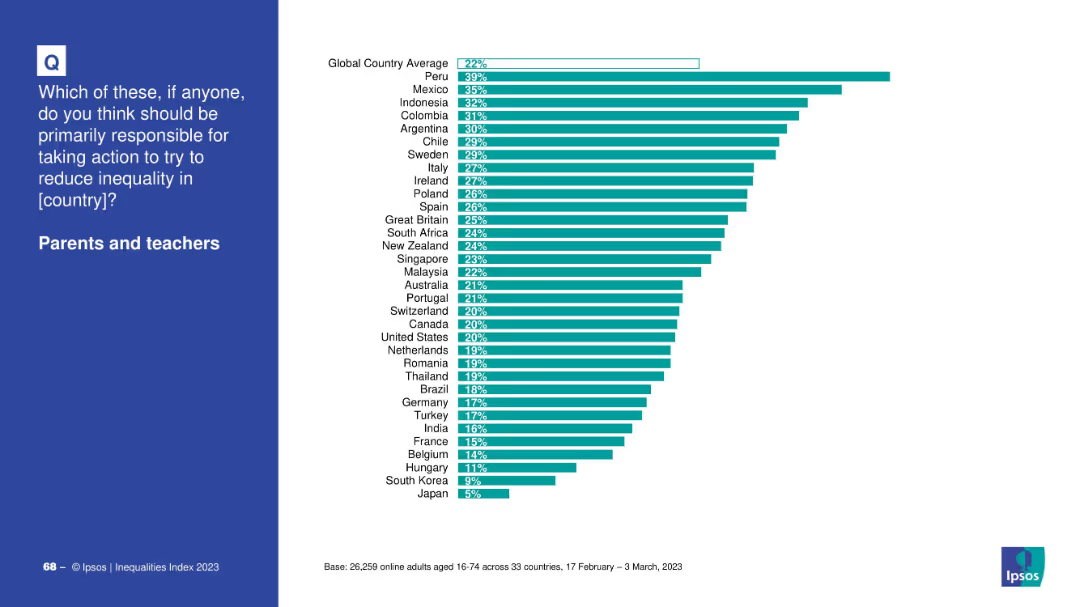
Country-level horizontal bar chart on white background indicating percentage support for parents and teachers as primary agents to reduce inequality.
Market Analysis and Trends
Education & Training
This slide highlights which countries most strongly support the idea that parents and teachers should play a leading role in reducing inequality.
inequality, education, country data, parents, teachers, societal roles, responsibility, global comparison
false
Market Analysis and Trends
Education & Training
Mixed Chart
IPSOS
Add to my slides
Remove from favorites
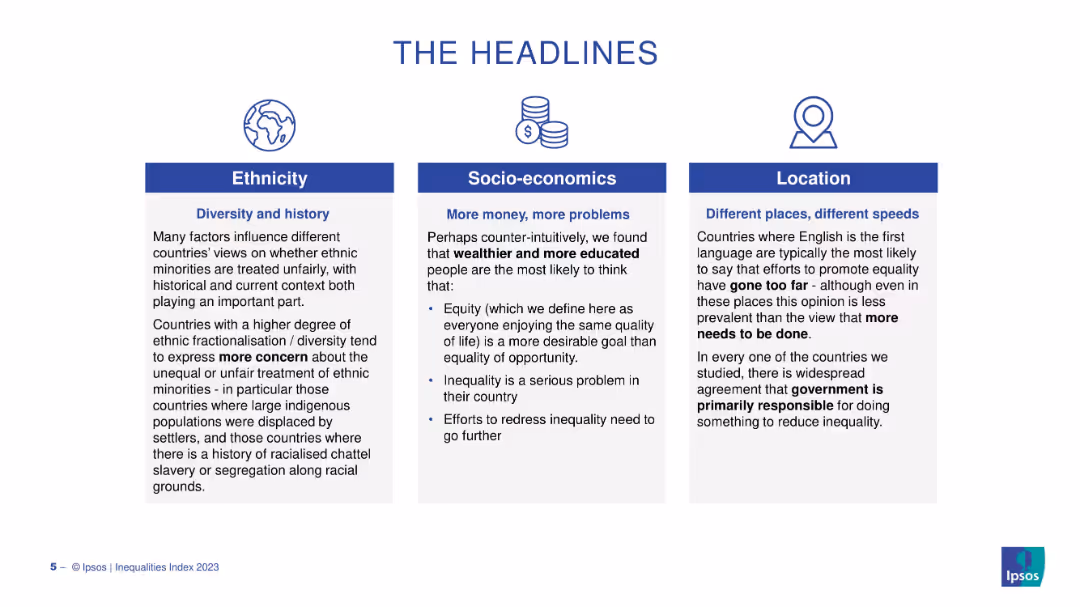
Three vertical panels under headings Ethnicity, Socio-economics, and Location. Text-heavy layout with icons and blue headers.
Strategic Planning
Government & Public Sector
This slide discusses how perceptions of inequality vary depending on ethnicity, wealth/education, and geography, showing how context affects views on fairness and responsibility in promoting equality.
inequality, ethnicity, geography, socioeconomics, fairness, global views
false
Strategic Planning
Government & Public Sector
Pillar
IPSOS
Add to my slides
Remove from favorites
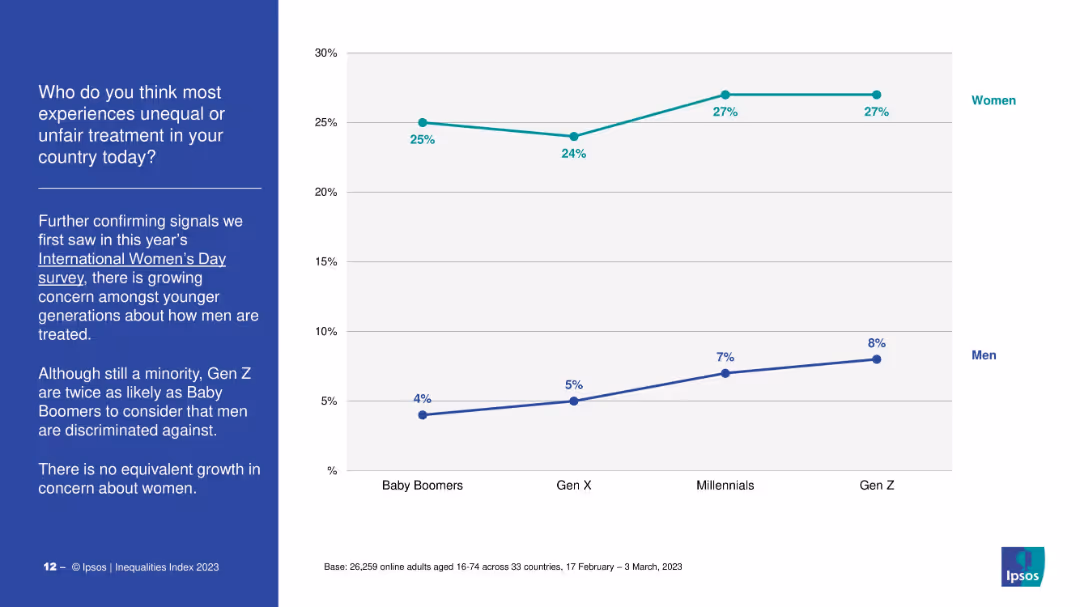
Split screen layout with left side text and right side line graph showing generational views on perceived discrimination against men and women. Blue and teal lines represent responses for men and women respectively, segmented by Baby Boomers to Gen Z.
Market Analysis and Trends
Government & Public Sector
The slide examines generational perceptions of unequal treatment, revealing that younger generations (especially Gen Z) are more likely to say men are discriminated against. Concern about women's treatment remains consistent, while concern about men increases with younger age groups.
inequality, gender, generational gap, discrimination, public opinion, Gen Z, Baby Boomers, Ipsos, fairness, survey
false
Market Analysis and Trends
Government & Public Sector
Mixed Chart
IPSOS
Add to my slides
Remove from favorites
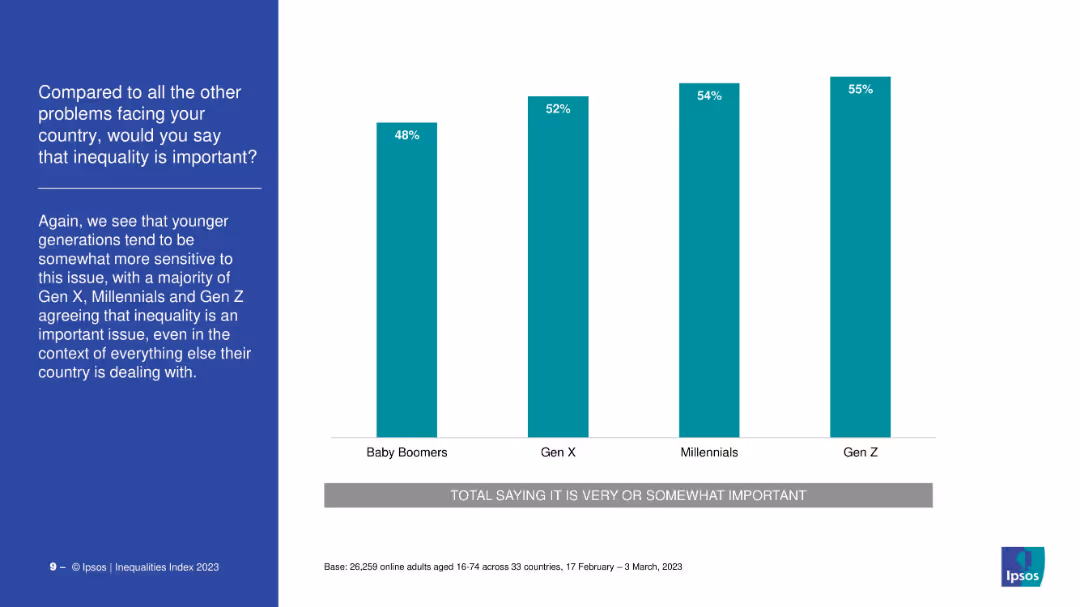
Vertical bar chart comparing importance of inequality by generation. Simple layout with teal bars and left-side title.
Market Analysis and Trends
Government & Public Sector
A generational comparison of perceived importance of inequality shows Gen Z rates it the highest (55%), followed by Millennials and Gen X, while Baby Boomers are least concerned at 48%.
inequality, generational attitudes, social concern, priorities, survey
false
Market Analysis and Trends
Government & Public Sector
Mixed Chart
IPSOS
Add to my slides
Remove from favorites
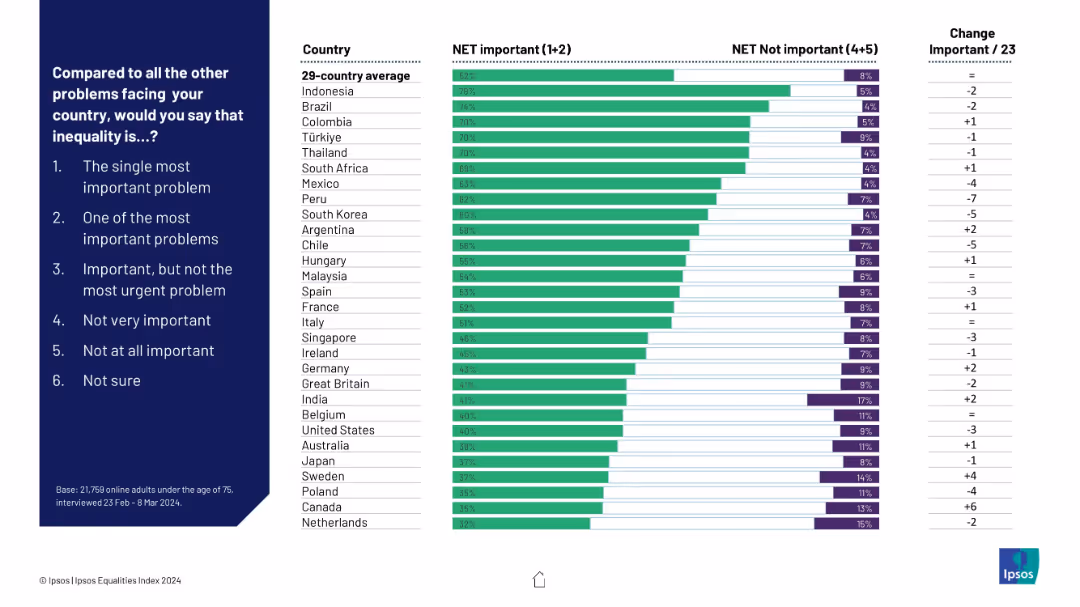
Horizontal bar chart on right, ranking countries by how many say inequality is important; color-coded bars (green = important, purple = not important); question and answer scale on left.
Market Analysis and Trends
Government & Public Sector
This slide presents country-by-country perceptions on the importance of inequality as a national problem. It compares the net percentage of people who consider it important vs. not important, highlighting changes over time and country averages.
inequality, global opinion, country ranking, importance scale, perceptions, Ipsos, net important, comparative chart, public opinion
false
Market Analysis and Trends
Government & Public Sector
Mixed Chart
IPSOS
Add to my slides
Remove from favorites
Horizontal bar chart ranking countries by perceived importance of inequality as a national issue.
Market Analysis and Trends
Government & Public Sector
This slide displays how important inequality is perceived compared to other national problems across different countries. It shows global averages and country-level responses, highlighting significant cross-country variation.
inequality, importance, perception, countries, comparison, public opinion, global index
false
Market Analysis and Trends
Government & Public Sector
Mixed Chart
IPSOS
Add to my slides
Remove from favorites
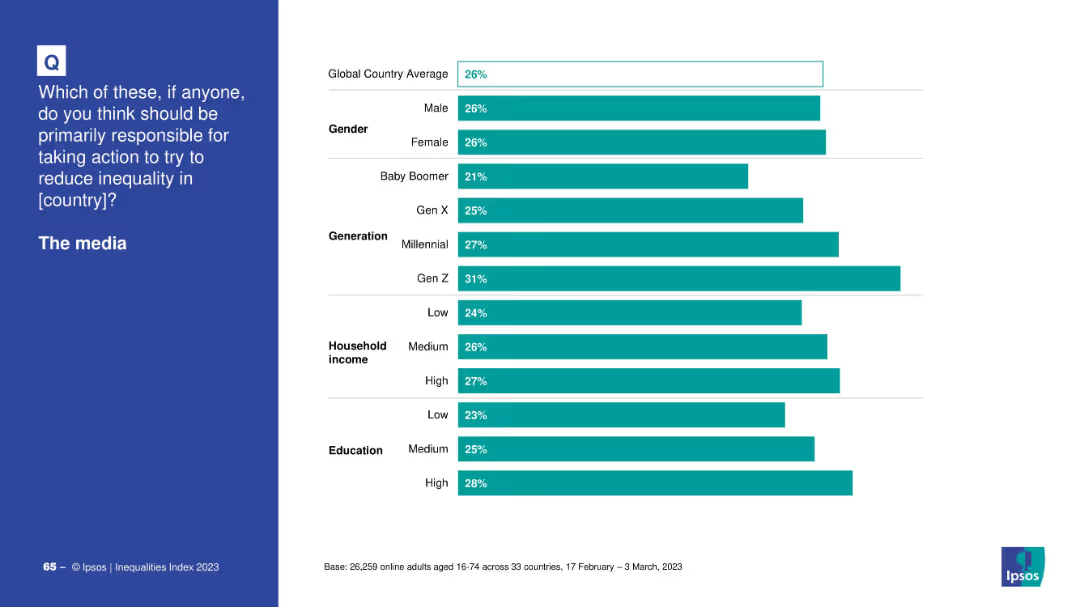
Split layout with a question on the left in white text over blue background, and a horizontal bar chart on the right against a white background.
Market Analysis and Trends
Media & Entertainment
This slide shows survey results about perceptions of media responsibility in reducing inequality, segmented by gender, generation, income, and education.
inequality, media, demographics, survey, responsibility, generations, income levels, education levels, global average
false
Market Analysis and Trends
Media & Entertainment
Mixed Chart
IPSOS
Add to my slides
Remove from favorites
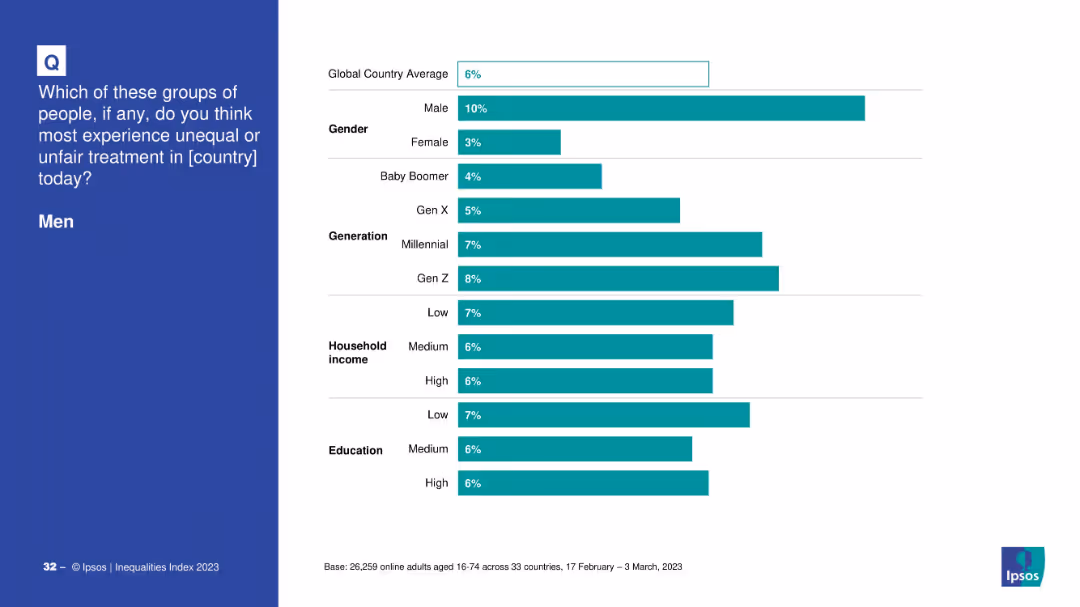
Demographic breakdown of perceptions about men experiencing unequal treatment.
Customer and Market Segmentation
Government & Public Sector
The slide disaggregates opinions by gender, generation, income, and education about whether men face unfair treatment, showing higher belief among men and younger generations.
inequality, men, perception, demographics, generational views, gender differences
false
Customer and Market Segmentation
Government & Public Sector
Mixed Chart
IPSOS
Add to my slides
Remove from favorites
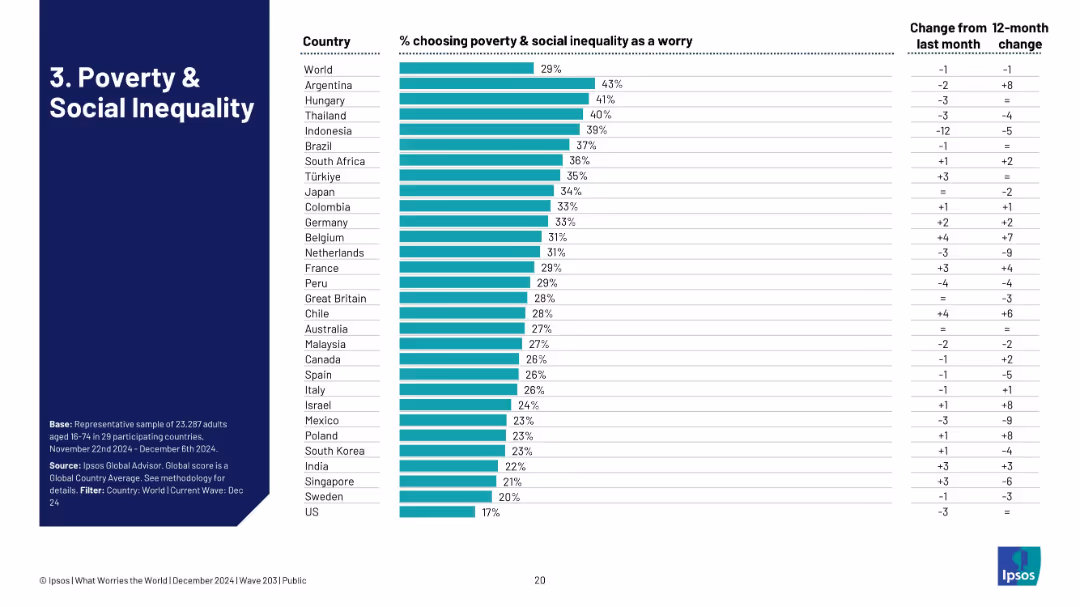
Country-ranking chart showing % of respondents citing poverty/inequality as a concern, with delta indicators.
Market Analysis and Trends
Professional Services
The slide ranks countries by the level of concern about poverty and social inequality. Indonesia, Argentina, and Hungary report the highest concern, with notable monthly increases. The data reflects the persistent salience of economic disparity in public opinion across multiple regions.
inequality, poverty, economic disparity, concern ranking, Ipsos, regional variation, public opinion
false
Market Analysis and Trends
Professional Services
Single Chart
IPSOS
Add to my slides
Remove from favorites
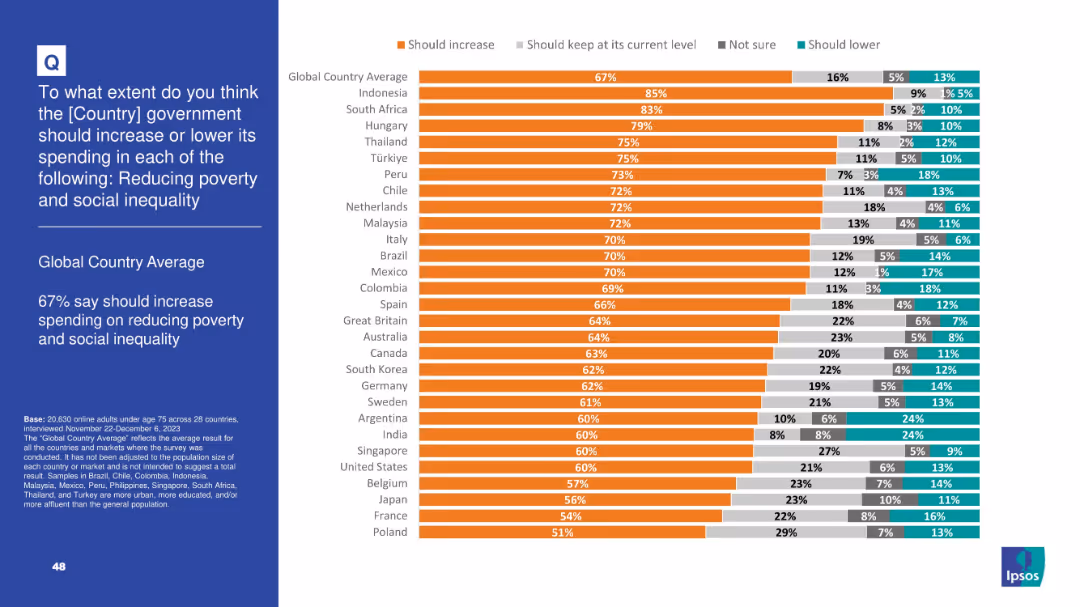
Similar split layout as 19061. Bar chart ranks countries by support for increasing government spending on poverty and inequality.
Market Analysis and Trends
Government & Public Sector
This slide presents survey results from 28 countries regarding support for government spending to reduce poverty and social inequality. Globally, 67% support more spending. The chart illustrates national variations in opinion.
inequality, poverty, public spending, survey, country ranking, economic policy, Ipsos, social policy, bar chart, global attitudes
false
Market Analysis and Trends
Government & Public Sector
Mixed Chart
IPSOS
Add to my slides
Remove from favorites
Vertical bar chart displaying concern levels by country over poverty and social inequality, with recent change statistics.
Customer and Market Segmentation
Government & Public Sector
This slide shows 29% globally are worried about poverty and inequality. Argentina, Hungary, and Thailand rank highest. The chart includes recent changes, highlighting shifts in social perception across countries.
inequality, poverty, social issues, Ipsos, economic divide, country analysis
false
Customer and Market Segmentation
Government & Public Sector
Single Chart
IPSOS
Add to my slides
Remove from favorites
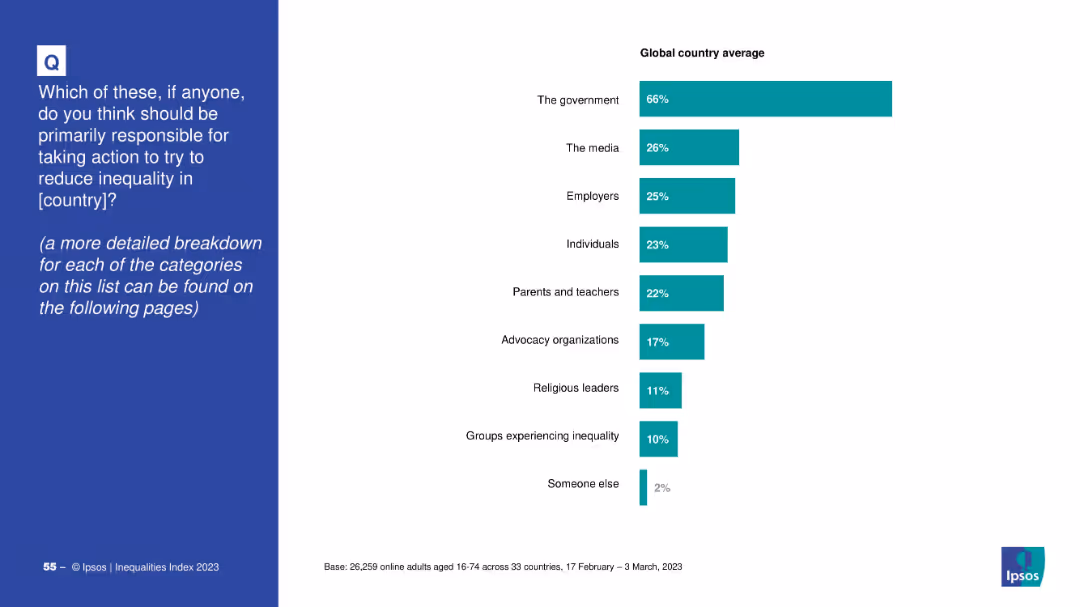
Split slide: left side has question text in a blue box; right side is a horizontal bar chart with global averages.
Market Analysis and Trends
Government & Public Sector
This slide presents global public opinion on who should be primarily responsible for reducing inequality. A horizontal bar chart shows that 66% believe the government should lead, followed by media, employers, and individuals.
inequality, responsibility, government, media, employers, public opinion, global survey, Ipsos, 2023, bar chart
false
Market Analysis and Trends
Government & Public Sector
Mixed Chart
IPSOS
Add to my slides
Remove from favorites
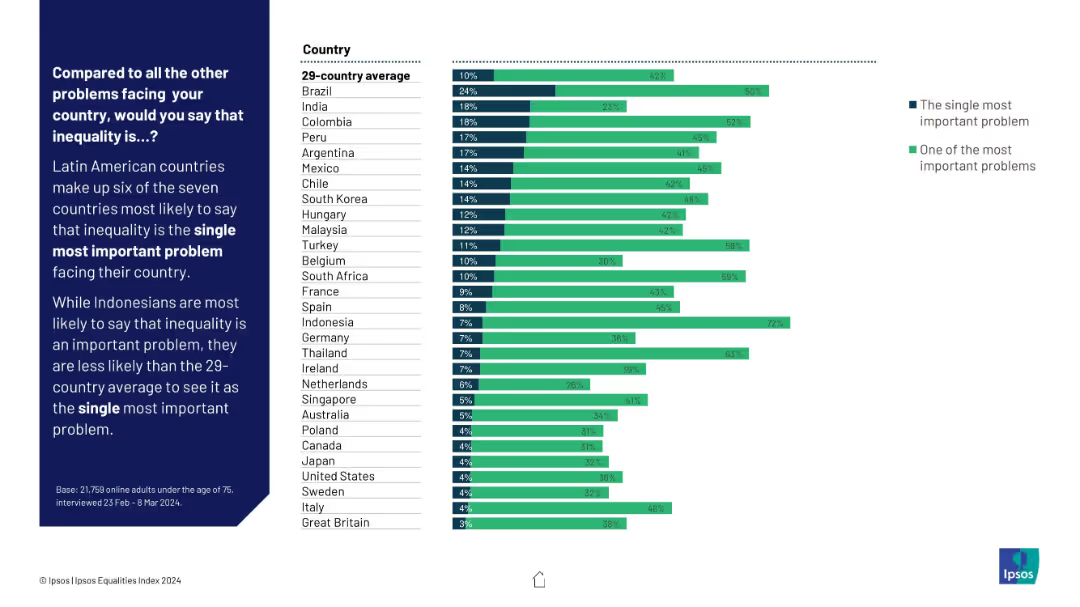
Stacked bar chart showing responses per country; dark blue for “most important”, green for “one of the most important”; text box highlights Latin America’s strong responses.
Market Analysis and Trends
Government & Public Sector
This slide breaks down which countries are most likely to consider inequality the single most important problem, with Latin American countries dominating the top ranks. It distinguishes between the strongest concern vs. secondary importance.
inequality, single most important problem, Latin America, Ipsos, country comparison, urgency, data visualization
false
Market Analysis and Trends
Government & Public Sector
Mixed Chart
IPSOS
Add to my slides
Remove from favorites
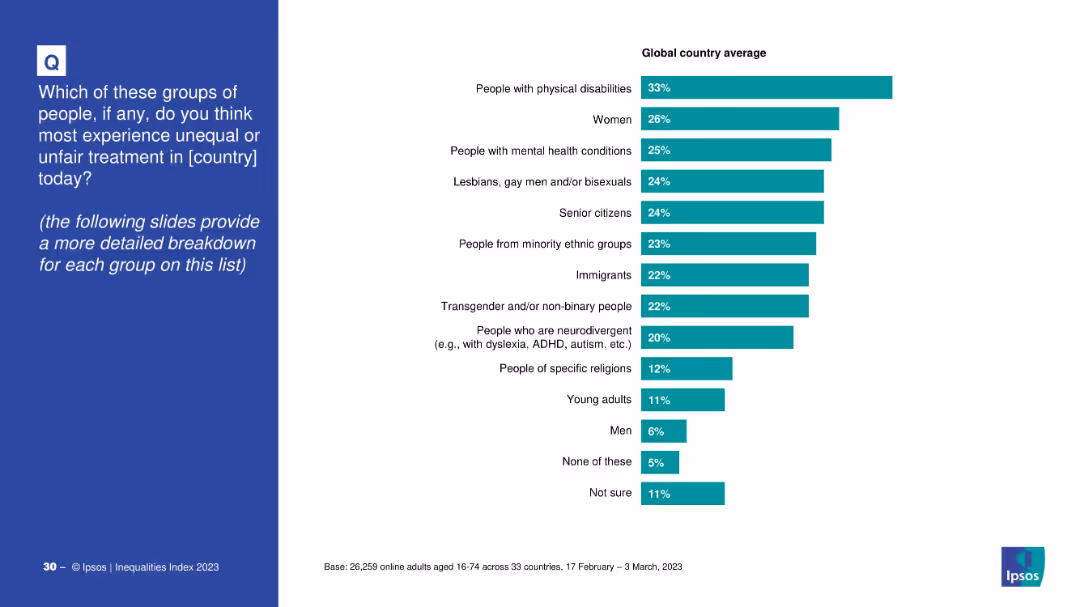
Bar chart showing public opinion on which groups face the most unequal treatment.
Customer and Market Segmentation
Government & Public Sector
This slide reveals which social groups are perceived to face the most unequal treatment, based on global averages. Top groups include people with physical disabilities, women, mental health sufferers, and LGBTQ+ individuals.
inequality, social groups, discrimination, public perception, unfair treatment, diversity
false
Customer and Market Segmentation
Government & Public Sector
Mixed Chart
IPSOS
Add to my slides
Remove from favorites
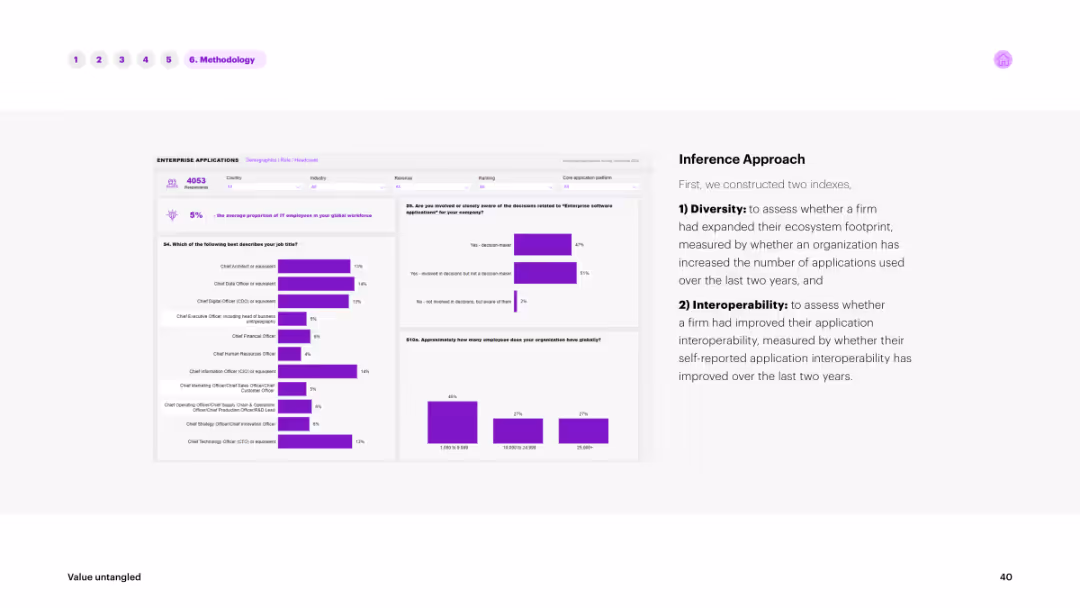
The slide includes text on the right explaining the inference approach and multiple bar charts on the left showing data distributions. The charts and text are in shades of purple against a white background.
Market Analysis and Trends
Technology & Software
Describes the inference approach used in the survey, focusing on diversity and interoperability indices. The bar charts show the distribution of responses, providing insights into ecosystem footprints and application interoperability improvements.
inference, approach, survey, diversity, interoperability
false
Market Analysis and Trends
Technology & Software
Multiple Chart
Accenture
Add to my slides
Remove from favorites
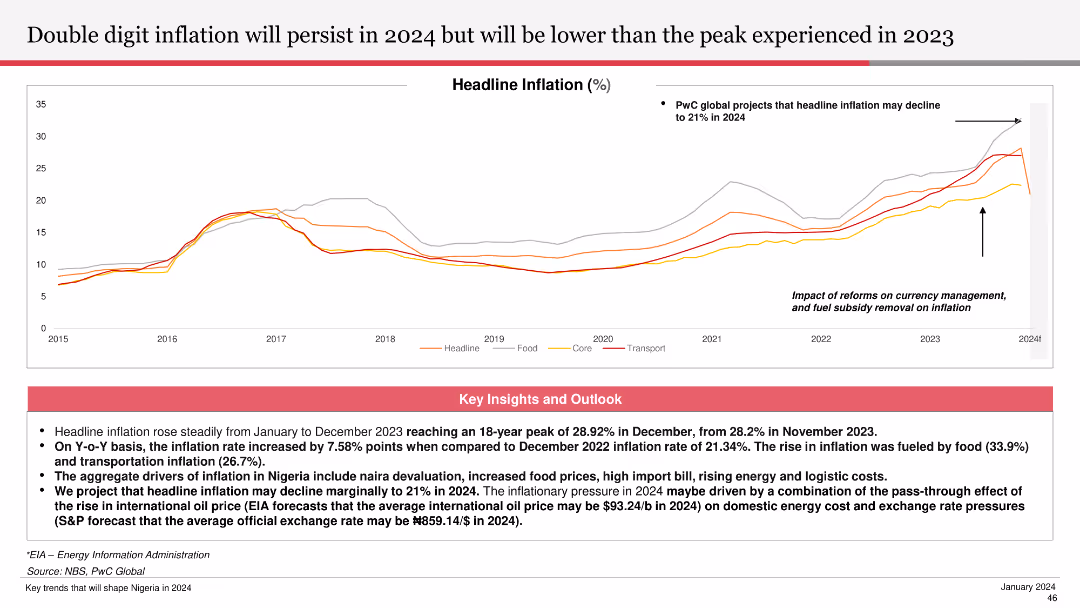
Shows a line chart depicting headline inflation from 2015 to 2024, with projections and annotations highlighting key points.
Financial Performance
Financial Services
Forecasts the continuation of double-digit inflation in 2024, lower than the 2023 peak. Explains factors driving inflation and potential future trends.
inflation, 2024, headline inflation, projections, financial services, trends, 2023 peak
false
Financial Performance
Financial Services
Mixed Chart
PwC/Strategy&
Add to my slides
Remove from favorites
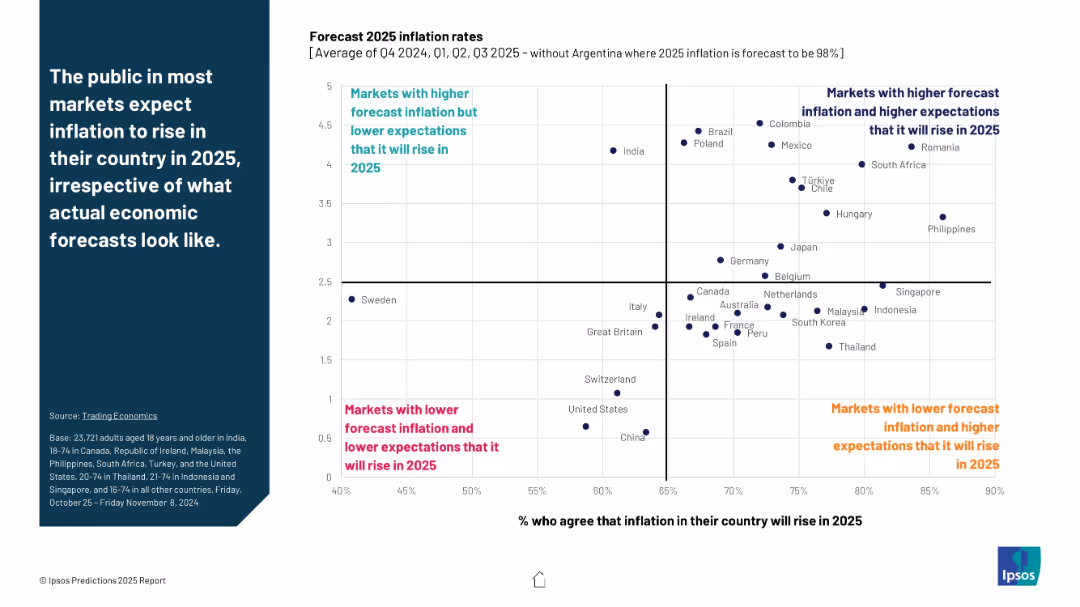
Scatterplot chart overlaid on a quadrant grid, categorized by inflation forecast and public expectation. Left-aligned text box with a summary statement. Bold color-coded quadrant labels. Small font notes at the bottom.
Market Analysis and Trends
Financial Services
This slide compares forecasted inflation rates for 2025 against public expectations in various countries. It reveals a general mismatch, with most people expecting inflation to rise, even in markets where it’s forecasted to remain low. Countries are categorized into four quadrants based on inflation forecast and public sentiment.
inflation, 2025, public expectations, economic forecast, global markets
false
Market Analysis and Trends
Financial Services
Mixed Chart
IPSOS
Add to my slides
Remove from favorites
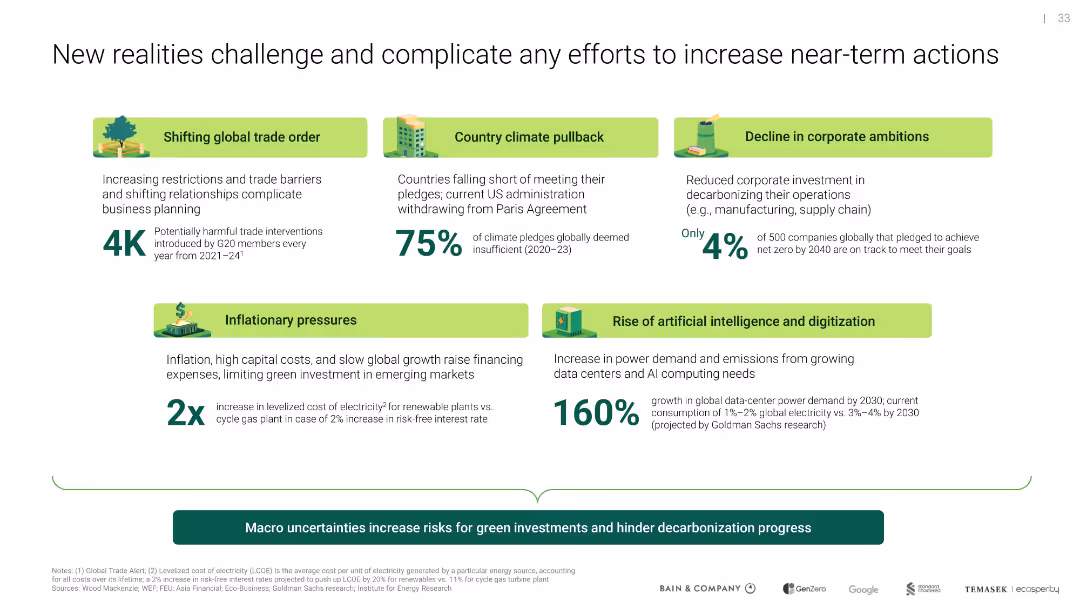
Two-tier icon layout with statistic highlights; each row tackles a new global or macroeconomic headwind
Risk Assessment and Management
Environmental Services & Sustainability
Identifies current global and economic challenges (e.g., climate policy setbacks, inflation, AI power use) that complicate decarbonization efforts and increase risk for investors in green transitions.
inflation, AI, climate policy, global trade, decarbonization risks
false
Risk Assessment and Management
Environmental Services & Sustainability
Header Vertical
Bain
Add to my slides
Remove from favorites
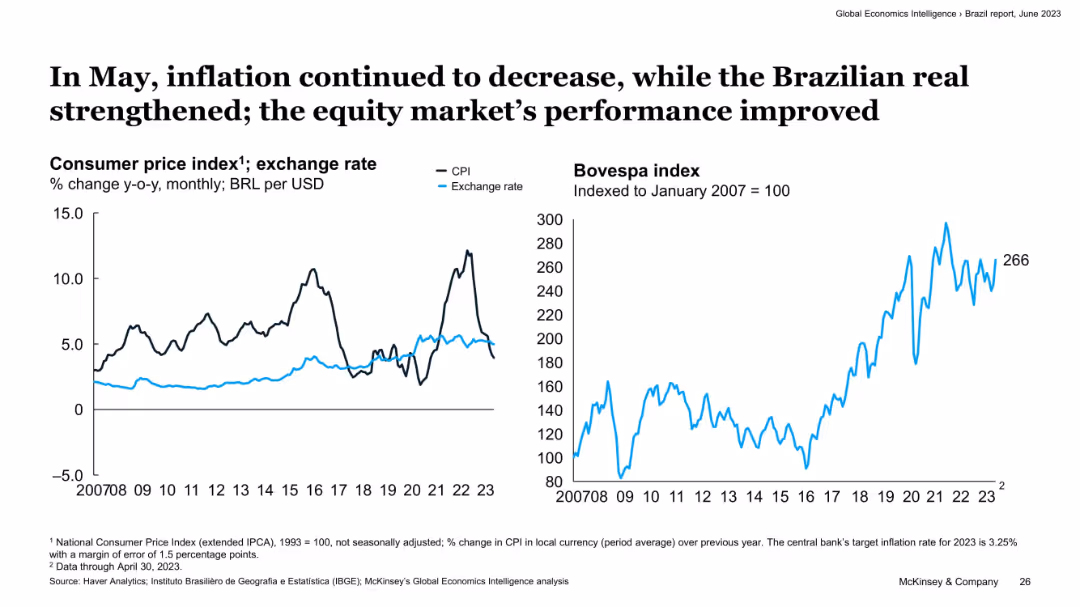
Two-panel layout with line charts; left shows CPI and exchange rate over time, right shows Bovespa index trend. Minimalist design with emphasis on data visualization.
Market Analysis and Trends
Financial Services
This slide highlights the economic performance in Brazil as of May 2023. It shows a decline in inflation, a strengthening Brazilian real, and an improved equity market, illustrated by CPI, exchange rate, and Bovespa index trends.
inflation, Brazil, Bovespa, CPI, exchange rate, equity market, economic performance, 2023, trends, financial
false
Market Analysis and Trends
Financial Services
Multiple Chart
McKinsey
Add to my slides
Remove from favorites
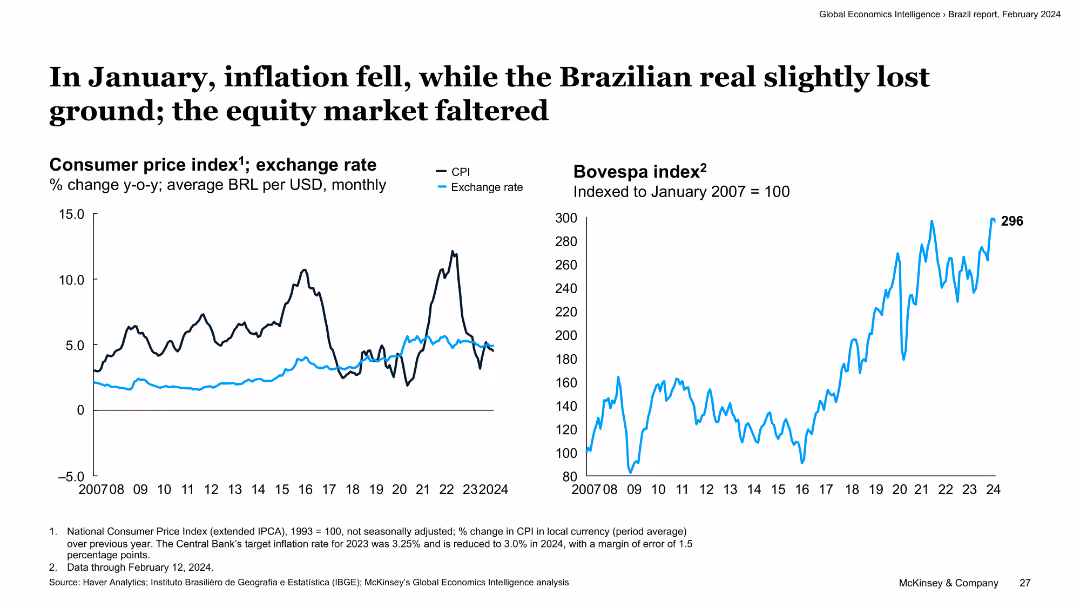
The slide displays two line charts: the left chart shows the consumer price index and exchange rate, while the right chart illustrates the Bovespa index performance.
Market Analysis and Trends
Financial Services
The slide analyzes Brazil's economic situation in January, highlighting a fall in inflation and a slight depreciation of the Brazilian real. It also examines the performance of the Bovespa equity index.
inflation, Brazilian real, Bovespa index, economic performance, exchange rate
false
Market Analysis and Trends
Financial Services
Multiple Chart
McKinsey
Add to my slides
Remove from favorites
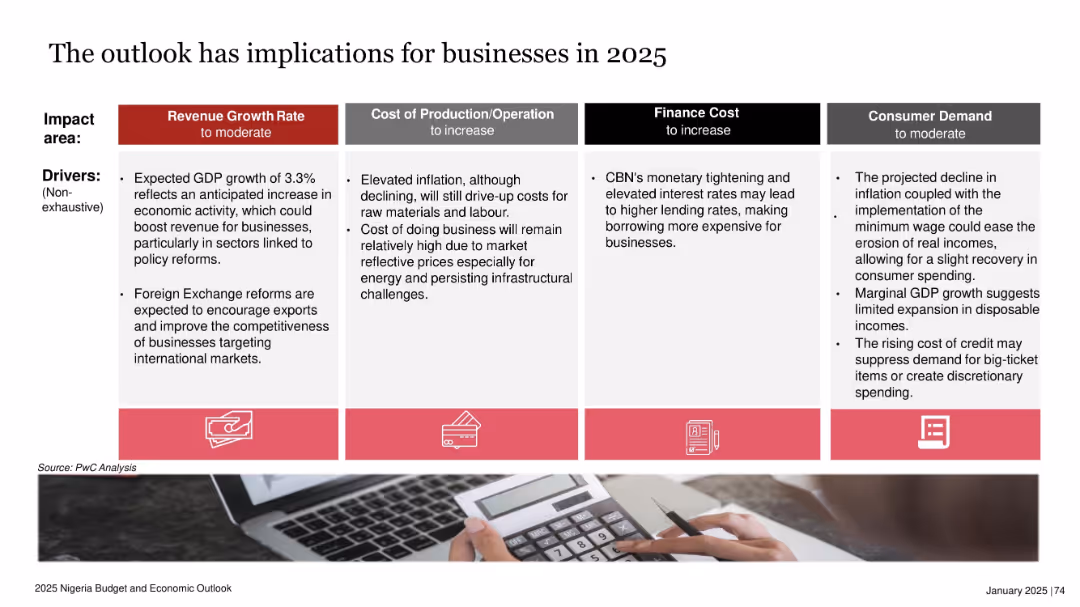
Four-column layout detailing impact areas (revenue, cost, finance, demand) and drivers in bullet points
Strategic Planning
Professional Services
The slide forecasts how Nigeria’s 2025 economic conditions will affect businesses. GDP growth may aid revenue but inflation and interest rates will raise costs and financing burdens. Consumer demand may remain moderate due to constrained disposable incomes. The slide aims to help businesses plan amid inflation and fiscal tightening.
inflation, business cost, GDP, revenue, finance, demand, Nigeria, 2025 outlook
false
Strategic Planning
Professional Services
Table
PwC/Strategy&
Add to my slides
Remove from favorites
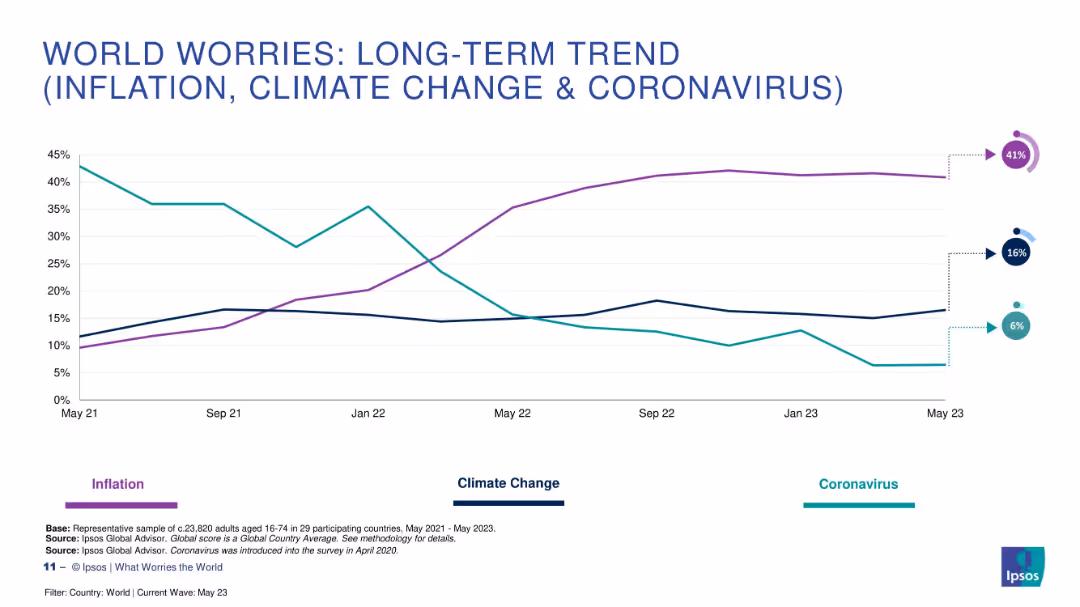
Focused line graph comparing inflation, climate change, and coronavirus trends since May 2021
Market Analysis and Trends
Environmental Services & Sustainability
This slide narrows in on three specific concerns—Inflation, Climate Change, and Coronavirus—highlighting how public anxiety over these issues has shifted in the past two years. Inflation surged while COVID-19 concern dropped sharply. Climate change worry remains relatively stable.
inflation, climate change, coronavirus, trends, opinions
false
Market Analysis and Trends
Environmental Services & Sustainability
Multiple Chart
IPSOS
Add to my slides
Remove from favorites
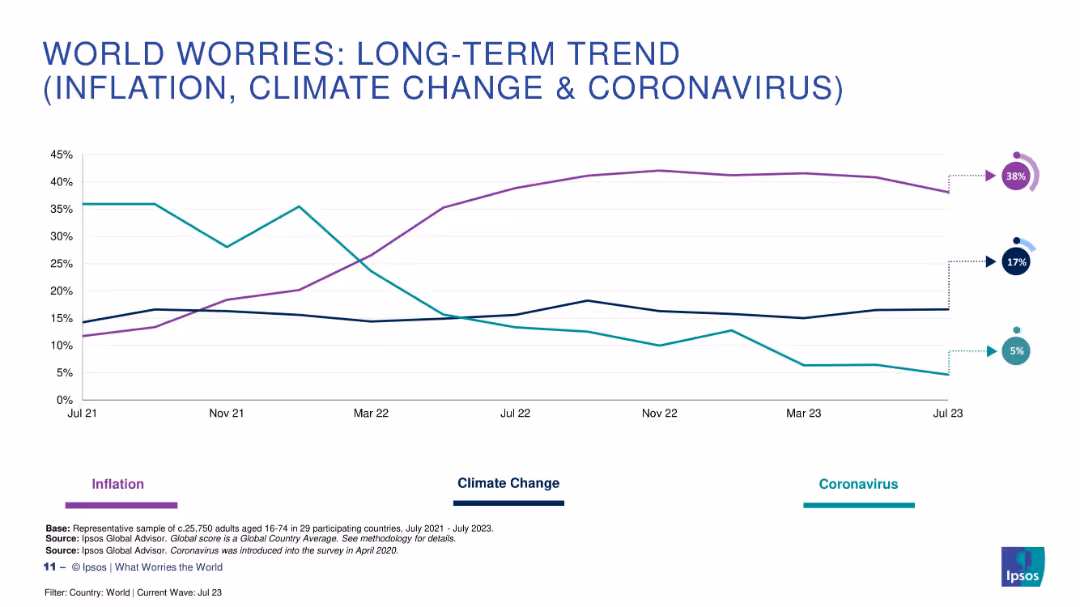
Focused line chart highlighting inflation, climate change, and coronavirus trends since 2021.
Market Analysis and Trends
Professional Services
This slide isolates three key global concerns—Inflation, Climate Change, and Coronavirus—showing how each has evolved in significance from July 2021 to July 2023 based on Ipsos survey responses.
inflation, climate change, covid-19, survey trends, global worries, public opinion
false
Market Analysis and Trends
Professional Services
Multiple Chart
IPSOS
Add to my slides
Remove from favorites
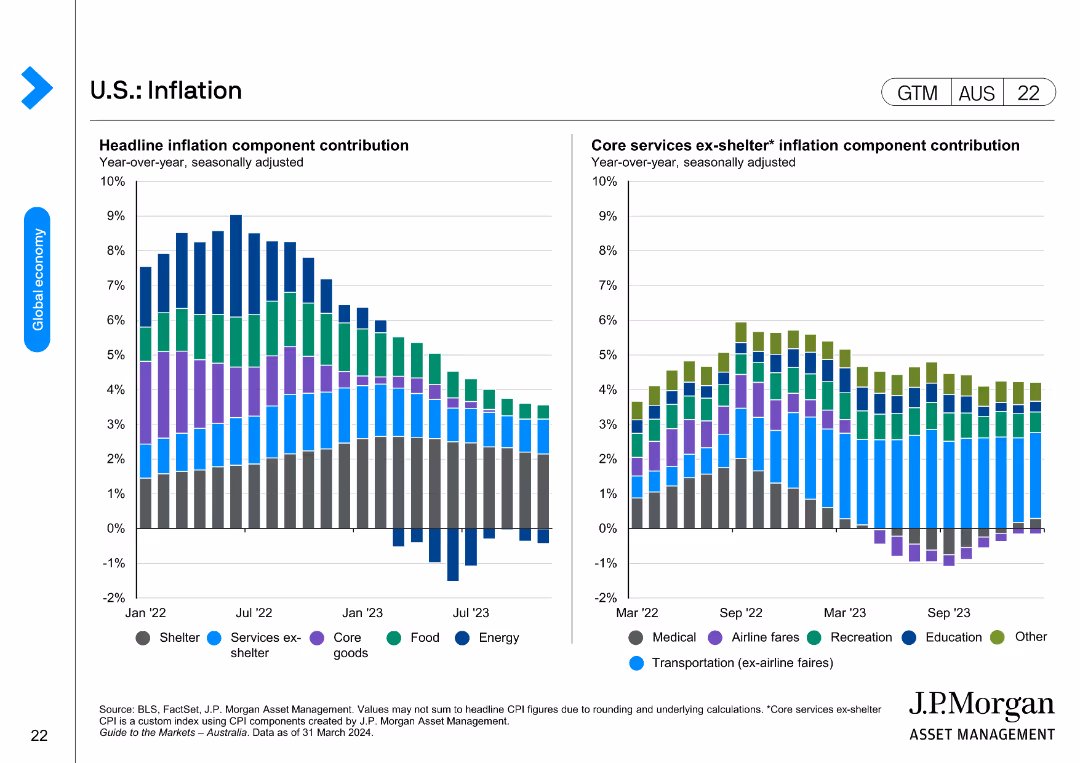
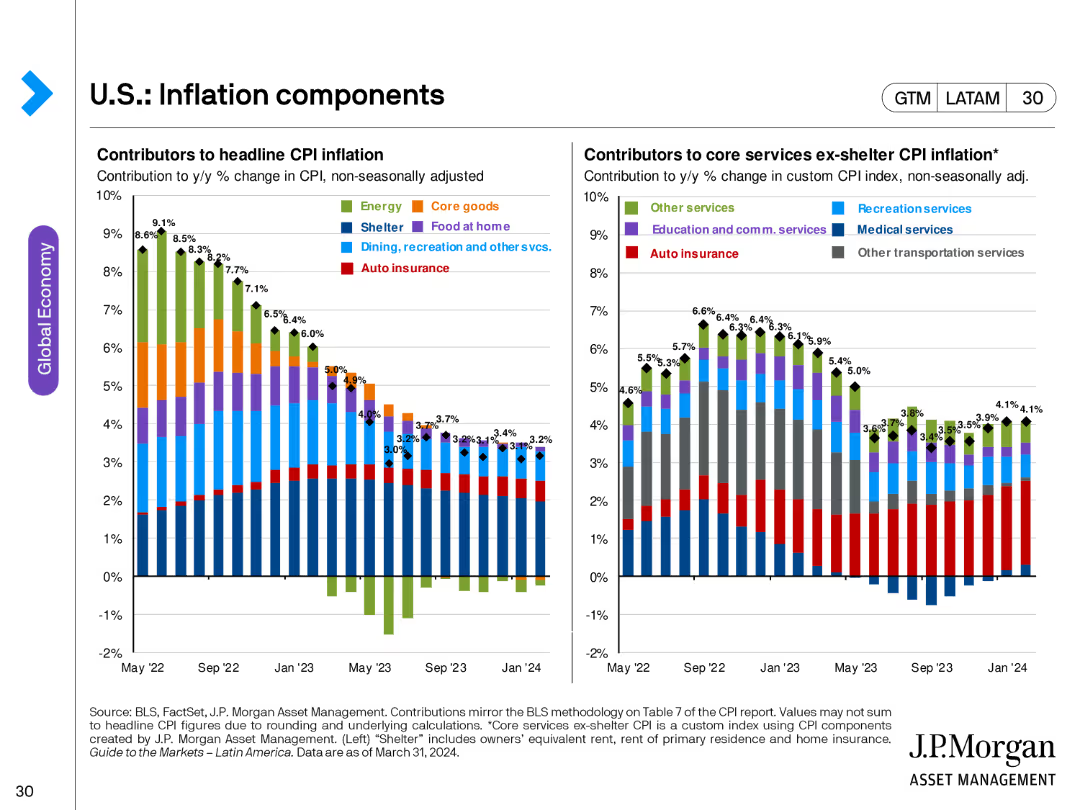
The slide features two bar charts. The left chart shows headline inflation component contributions (shelter, services ex-shelter, core goods, food, energy) year-over-year from Jan 2022 to Jul 2023. The right chart shows core services ex-shelter inflation component contributions.
Market Analysis and Trends
Financial Services
This slide breaks down the components of U.S. inflation, offering a detailed view of what drives inflation rates. It is useful for economic analysis and understanding inflation dynamics.
Inflation, Components, U.S., Headline, Core
false
Market Analysis and Trends
Financial Services
Multiple Chart
JP Morgan
Add to my slides
Remove from favorites
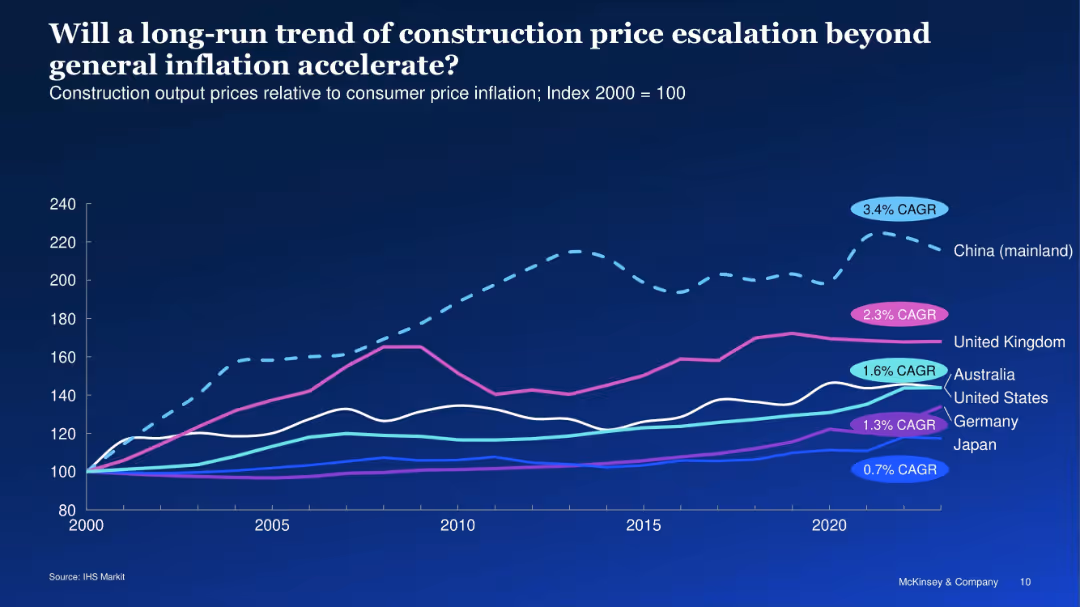
Line chart showing price indices of different countries since 2000
Market Analysis and Trends
Real Estate & Construction
This slide explores how construction prices have risen faster than consumer inflation, especially in China and the UK. It identifies the long-term trend of construction price escalation across major economies.
inflation, construction costs, price index, international trends, CAGR
false
Market Analysis and Trends
Real Estate & Construction
Single Chart
McKinsey
Add to my slides
Remove from favorites
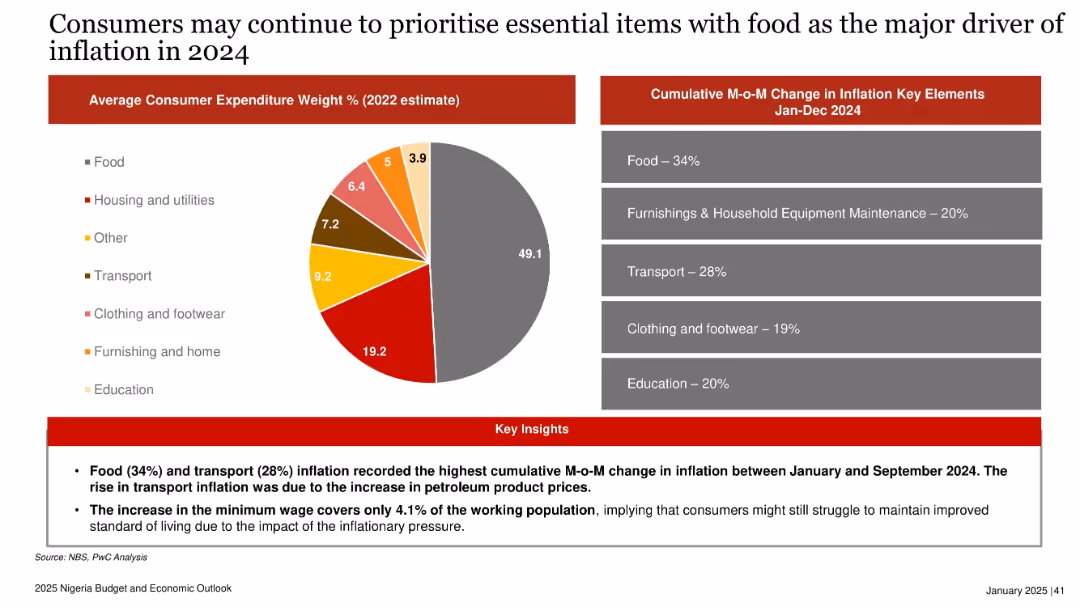
Pie chart of 2022 expenditure weights; bar-style panel of 2024 inflation contributors; insights below in red.
Market Analysis and Trends
Consumer Goods
Highlights that food and transport costs drove inflation in 2024. Consumers focused on essential items, and the new minimum wage had limited impact, covering just 4.1% of the workforce. Inflationary pressure likely to continue shaping spending behavior in 2025.
inflation, consumer spending, food, transport, minimum wage, Nigeria, 2024, price pressure, essential goods
false
Market Analysis and Trends
Consumer Goods
Mixed Chart
PwC/Strategy&
Add to my slides
Remove from favorites
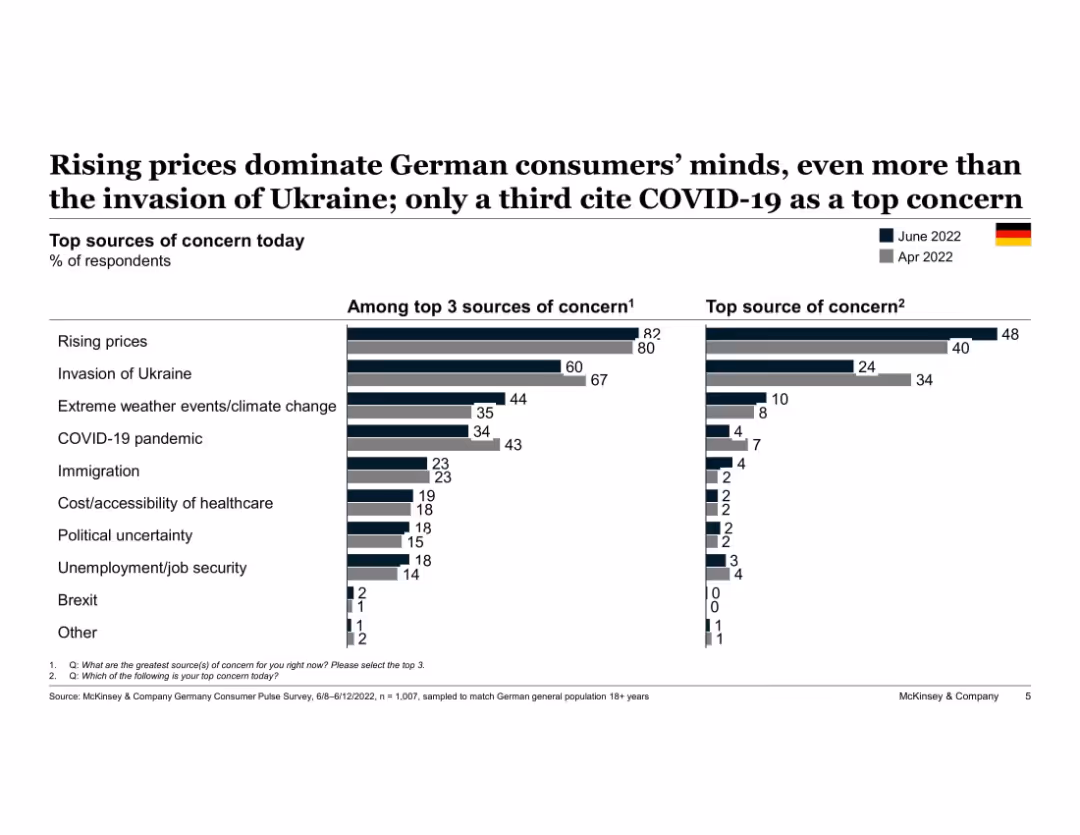
Side-by-side bar charts showing top concerns among German consumers. June vs. April 2022 comparisons are visualized with color-coded bars.
Market Analysis and Trends
Consumer Goods
The slide compares the evolution of German consumers' top concerns between April and June 2022. Rising prices remain the leading issue, followed by the Ukraine war and climate events, while concern over COVID-19 is declining.
inflation, consumer trends, Germany, geopolitical impact, survey comparison, economic perception, cost of living
false
Market Analysis and Trends
Consumer Goods
Single Chart
McKinsey
Add to my slides
Remove from favorites
The slide is a simple text-based title slide with black text on a white background and a gold stripe on the left. It provides contact information for a lead economist.
Industry Overview
Financial Services
This closing slide offers contact details for further discussion on inflation, serving as an open invitation for dialogue regarding the transitory or persistent nature of current inflation trends. It concludes a financial presentation, allowing for audience follow-up with the expert for deeper insights.
Inflation, Contact, Economics, Discussion, Expert, Finance, Research
false
Industry Overview
Financial Services
Title
JP Morgan
Add to my slides
Remove from favorites
The slide presents a segmented bar chart with text explanations on inflation impact responses and various cost increase management strategies.
Risk Assessment and Management
Consumer Goods
It explains how food & beverage companies manage inflation-driven cost increases through margin reduction, passing costs to customers, and other strategies.
Inflation, cost management, food & beverage, margin reduction, passing costs, supplier interventions, hedging, demand management
false
Risk Assessment and Management
Consumer Goods
Mixed Chart
Kearney
Add to my slides
Remove from favorites
Vertical bar chart ranking countries by the percentage of respondents selecting inflation as a top concern; includes two change columns (monthly and yearly).
Market Analysis and Trends
Financial Services
This slide highlights inflation as the top global concern (32%), with country-level breakdowns. Singapore ranks highest (60%). It includes month-over-month and year-over-year change indicators.
inflation, country comparison, Ipsos, economic concerns, financial pressure, global ranking
false
Market Analysis and Trends
Financial Services
Single Chart
IPSOS
Add to my slides
Remove from favorites
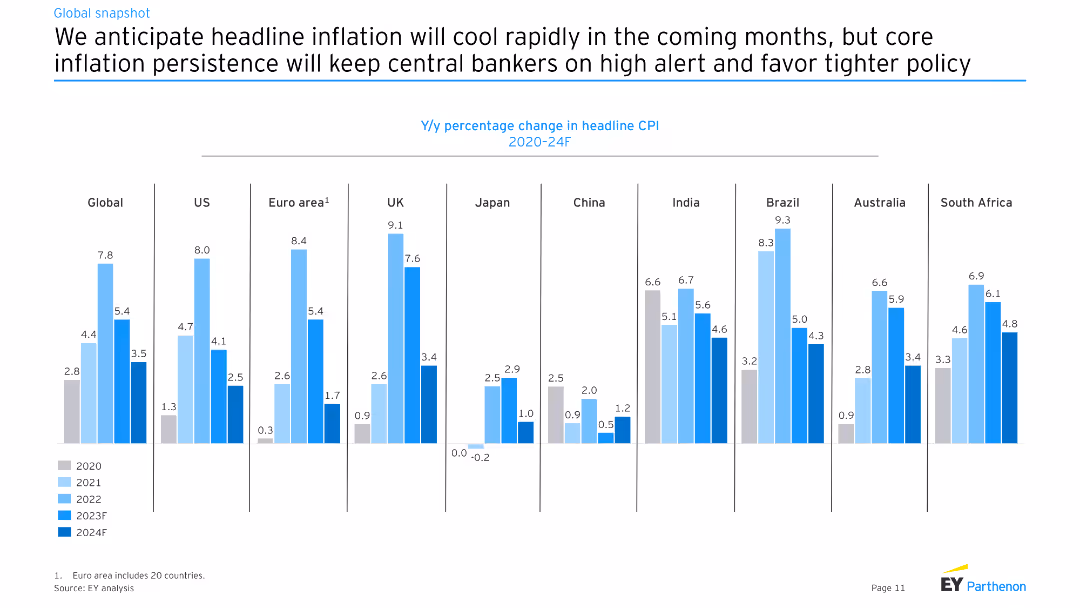
The slide contains a series of vertical column charts showing y/y percentage change in headline CPI for various countries from 2020 to 2024F. The charts are color-coded by year.
Market Analysis and Trends
Financial Services
This slide predicts the cooling of headline inflation in the coming months across major economies but warns that core inflation persistence will require tighter monetary policies.
inflation, CPI, central banks, global economy, forecasts
false
Market Analysis and Trends
Financial Services
Multiple Chart
EY
Add to my slides
Remove from favorites
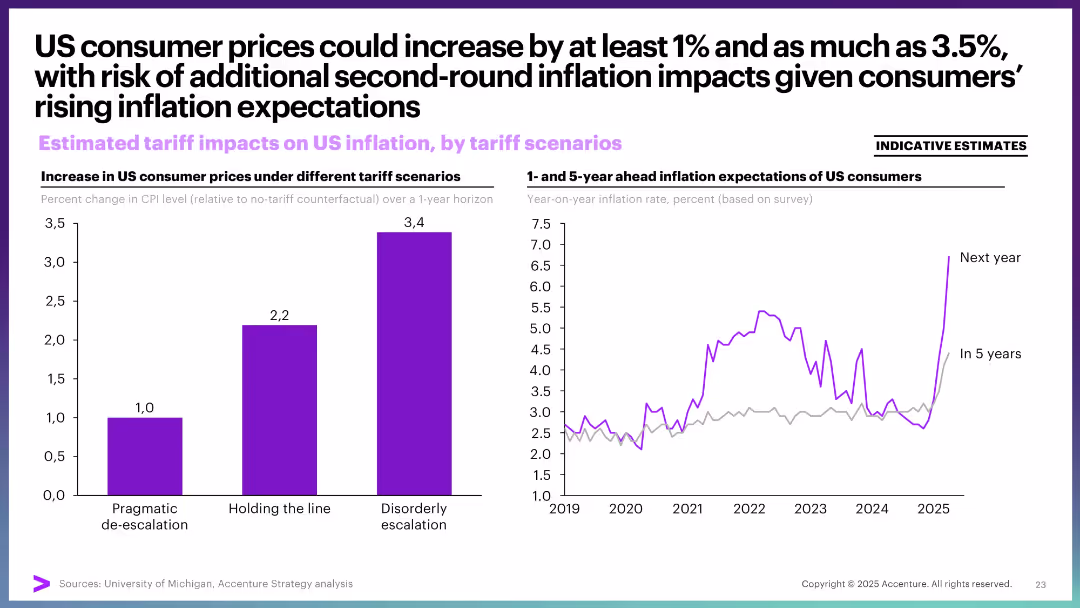
Left: bar graph comparing CPI change under three scenarios. Right: line graph showing inflation expectations over time. Simple and color-coded.
Market Analysis and Trends
Financial Services
This slide illustrates the inflationary effects of US tariffs, showing that even mild tariffs could raise consumer prices by at least 1%. It also highlights the trend in rising inflation expectations, suggesting a risk of second-round inflation due to consumer perception.
inflation, CPI, consumer prices, expectations, tariffs, economic policy, stagflation
false
Market Analysis and Trends
Financial Services
Multiple Chart
Accenture
Add to my slides
Remove from favorites
The slide shows a line chart of CPI and core CPI inflation and a stacked bar chart of inflation components contribution year-over-year.
Market Analysis and Trends
Financial Services
This slide examines inflation trends in Australia, detailing CPI and core CPI, and analyzing the contributions from different components over recent years.
inflation, CPI, core CPI, Australia, economic analysis
false
Market Analysis and Trends
Financial Services
Multiple Chart
JP Morgan
Add to my slides
Remove from favorites
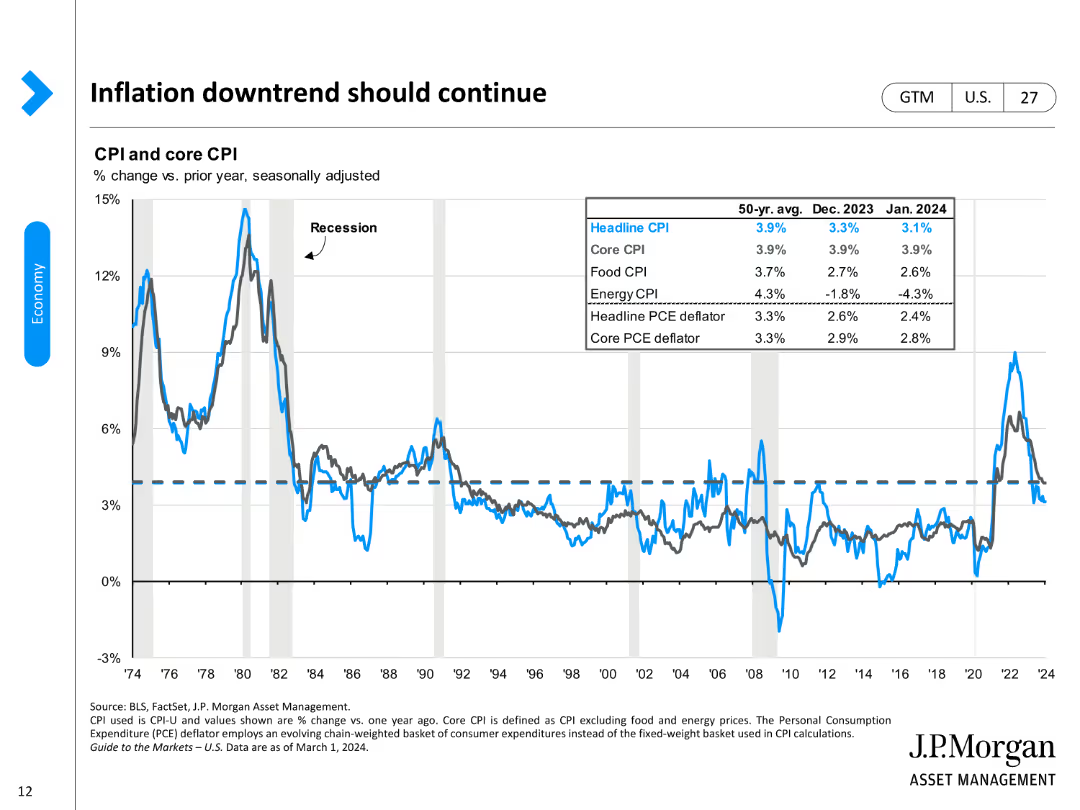
The slide features line charts for CPI and core CPI changes, with data points highlighted for different time periods.
Market Analysis and Trends
Financial Services
It predicts the continuation of the inflation downtrend, using historical and recent CPI data to support this forecast.
inflation, CPI, core CPI, economic trends, price changes
false
Market Analysis and Trends
Financial Services
Single Chart
JP Morgan
Add to my slides
Remove from favorites
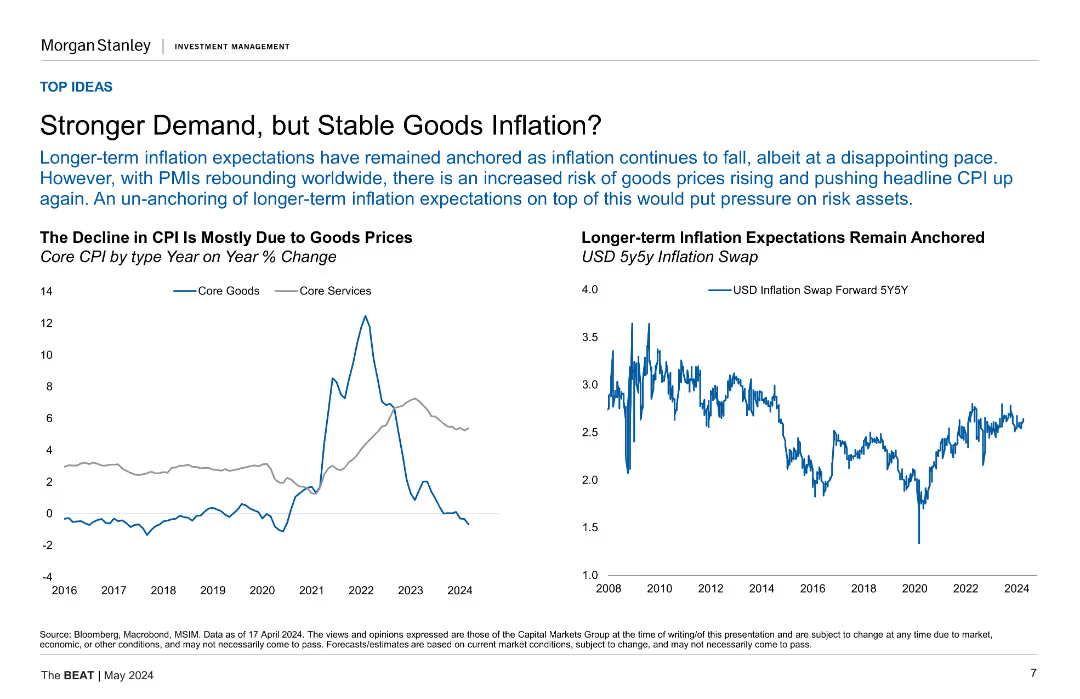
The slide features two line charts side by side. The left chart shows Core CPI by type (Goods and Services) over time, with data points from 2016 to 2024. The right chart displays USD 5y5y Inflation Swap rates from 2008 to 2024.
Market Analysis and Trends
Financial Services
The slide discusses how long-term inflation expectations have remained anchored despite recent CPI declines due to stable goods prices, while also highlighting the risks of rising goods prices amid rebounding PMIs.
Inflation, CPI, Core Goods, Core Services, USD, 5y5y, Inflation Swap, PMIs, Market Trends
false
Market Analysis and Trends
Financial Services
Multiple Chart
Morgan Stanley
Add to my slides
Remove from favorites
The slide includes two bar charts: one showing contributors to headline CPI inflation and another for core services ex-shelter CPI inflation, both broken down by various categories.
Market Analysis and Trends
Financial Services
This slide breaks down the components contributing to headline and core CPI inflation, offering a detailed view of inflationary pressures in the economy.
inflation, CPI, core services, economic analysis, price indices, headline CPI
false
Market Analysis and Trends
Financial Services
Multiple Chart
JP Morgan
Add to my slides
Remove from favorites
The slide is split into two line charts. The left chart shows CPI inflation rates for developed markets (Eurozone, U.S., Australia, Japan), while the right chart depicts CPI inflation for emerging markets (Brazil, India, Korea, China) from 2018 to 2024.
Market Analysis and Trends
Financial Services
This slide compares year-over-year CPI inflation rates between developed and emerging markets, providing insights into inflation trends across different economies. It is useful for economic analysis and policy assessment.
Inflation, CPI, Developed, Emerging, Markets
false
Market Analysis and Trends
Financial Services
Multiple Chart
JP Morgan
Add to my slides
Remove from favorites
This slide displays a line chart of CPI inflation in developed markets over a period spanning from the 1970s to the 2020s. The x-axis marks the years while the y-axis shows the percentage change. The chart shows significant fluctuations, with notable peaks and troughs.
Market Analysis and Trends
Financial Services
The slide presents historical data of CPI inflation in developed markets, with an emphasis on the trends over the past five decades. This could be used to analyze economic patterns, predict future inflation trends, and inform investment strategies.
Inflation, CPI, Developed Markets, Economic History, Trends, Data Analysis, Fluctuations
false
Market Analysis and Trends
Financial Services
Single Chart
JP Morgan
Add to my slides
Remove from favorites
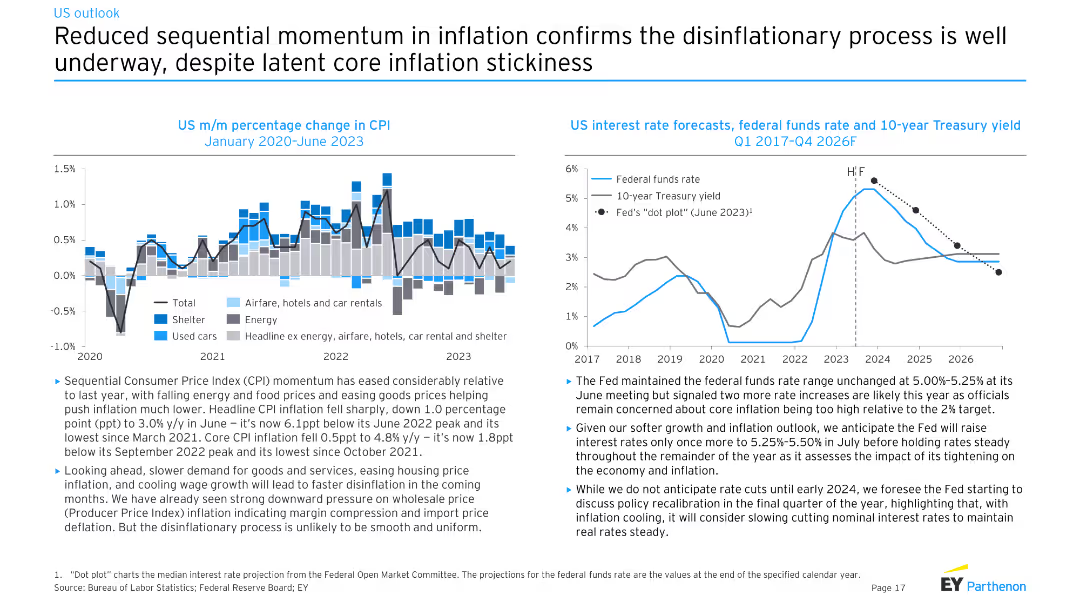
The slide has a bar chart showing US month-over-month percentage change in CPI from January 2020 to June 2023 and a line chart showing US interest rate forecasts, including federal funds rate and 10-year Treasury yield from Q1 2017 to Q4 2026F.
Market Analysis and Trends
Financial Services
This slide confirms the ongoing disinflationary process in the US, with falling CPI momentum and a forecast for steady interest rates through the remainder of the year.
inflation, CPI, disinflation, interest rates, forecasts
false
Market Analysis and Trends
Financial Services
Multiple Chart
EY
Add to my slides
Remove from favorites
A line chart showing the Consumer Price Index (CPI) for different regions, including the US, China, EU, ASEAN, Japan, and the Target. It uses various colors to distinguish between regions.
Market Analysis and Trends
Financial Services
The slide presents a comparative analysis of inflation trends across different regions from 2019 to 2023. It is used to understand regional inflation trends and economic conditions.
Inflation, CPI, Financial Trends, Regional Analysis, Economic Conditions
false
Market Analysis and Trends
Financial Services
Single Chart
Gartner
Add to my slides
Remove from favorites
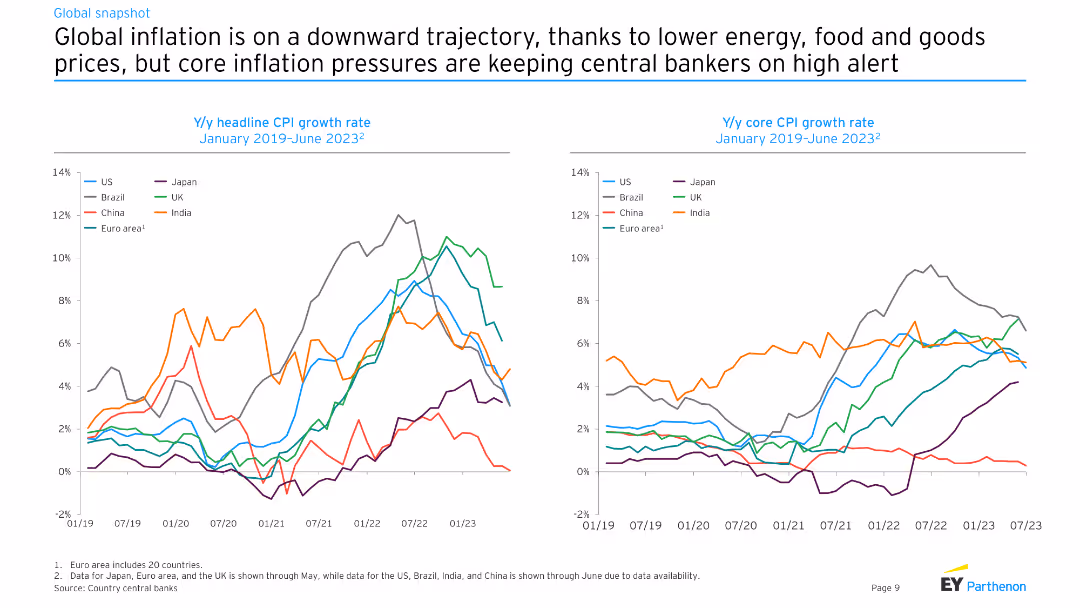
This slide displays two line charts: one showing the year-over-year headline CPI growth rate from January 2019 to June 2023, and another showing the core CPI growth rate over the same period for various countries.
Market Analysis and Trends
Financial Services
The slide tracks global inflation trends, analyzing the downward trajectory in headline CPI due to lower energy and food prices, while highlighting persistent core inflation pressures.
inflation, CPI, global, economy, prices, trends
false
Market Analysis and Trends
Financial Services
Multiple Chart
EY
Add to my slides
Remove from favorites
The slide features a comparative column chart showing year-over-year inflation rates and month-to-month changes for various countries, with color-coded arrows indicating trends.
Market Analysis and Trends
Financial Services
The slide presents a global view of CPI inflation rates, comparing changes across multiple countries and highlighting trends in disinflation.
inflation, CPI, global, trends, comparative
false
Market Analysis and Trends
Financial Services
Multiple Chart
Accenture
Add to my slides
Remove from favorites
A historical chart comparing CPI growth rates across different decades, annotated with tenure markers for investment roles.
Investment Analysis
Financial Services
Examines historical inflation trends and their impact on investment, emphasizing the experience of investors during various economic periods.
Inflation, CPI, Investment, Historical Trends, Economic Periods, Senior Partner, Market Stability, Financial History
false
Investment Analysis
Financial Services
Mixed Chart
Bain
Add to my slides
Remove from favorites
Two-column layout with column and line charts showing changes in CPI and PCE deflators from 2019-2025F.
Financial Performance
Financial Services
Discusses the challenges in reducing inflation to 2% by H2 2024, considering price sensitivity and economic factors.
inflation, CPI, PCE deflators, economic forecast, price sensitivity
false
Financial Performance
Financial Services
Multiple Chart
EY
Add to my slides
Remove from favorites
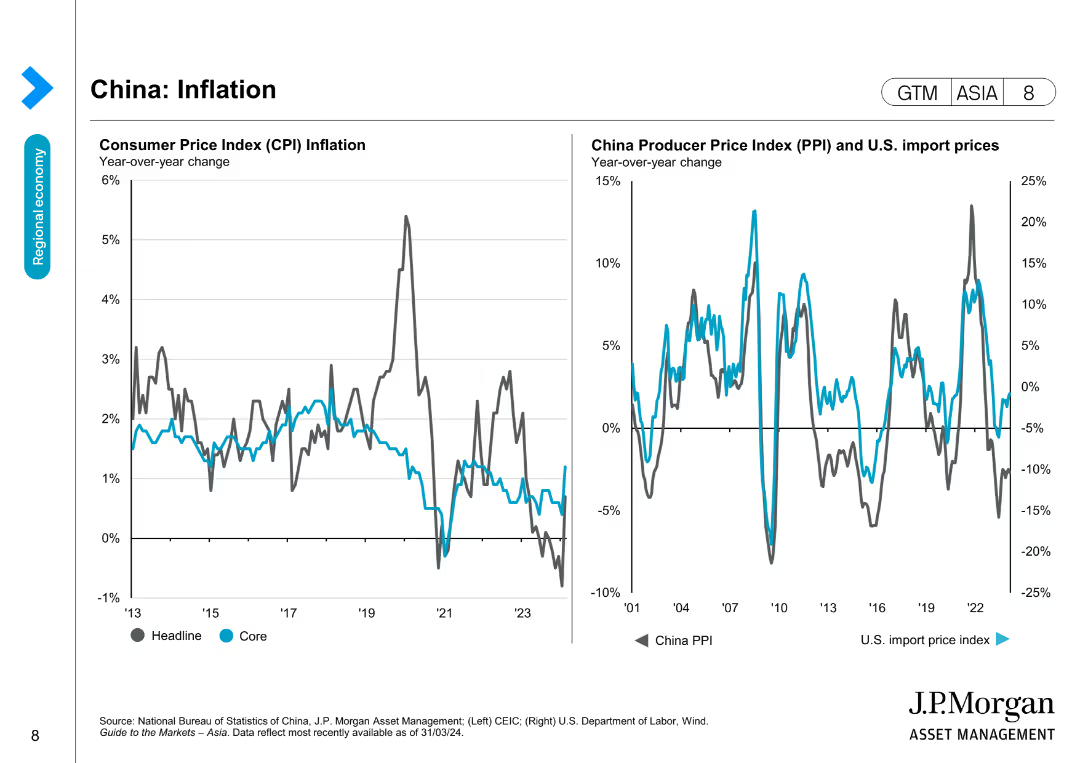
The slide presents two line charts: one for Consumer Price Index (CPI) inflation and another for Producer Price Index (PPI) and U.S. import prices, showing year-over-year changes.
Market Analysis and Trends
Financial Services
Shows inflation trends in China by analyzing CPI and PPI, useful for forecasting economic conditions and inflation impacts on the economy.
Inflation, CPI, PPI, China, Economic trends, Prices, Forecasting, Financial analysis, Import prices
false
Market Analysis and Trends
Financial Services
Multiple Chart
JP Morgan
Add to my slides
Remove from favorites
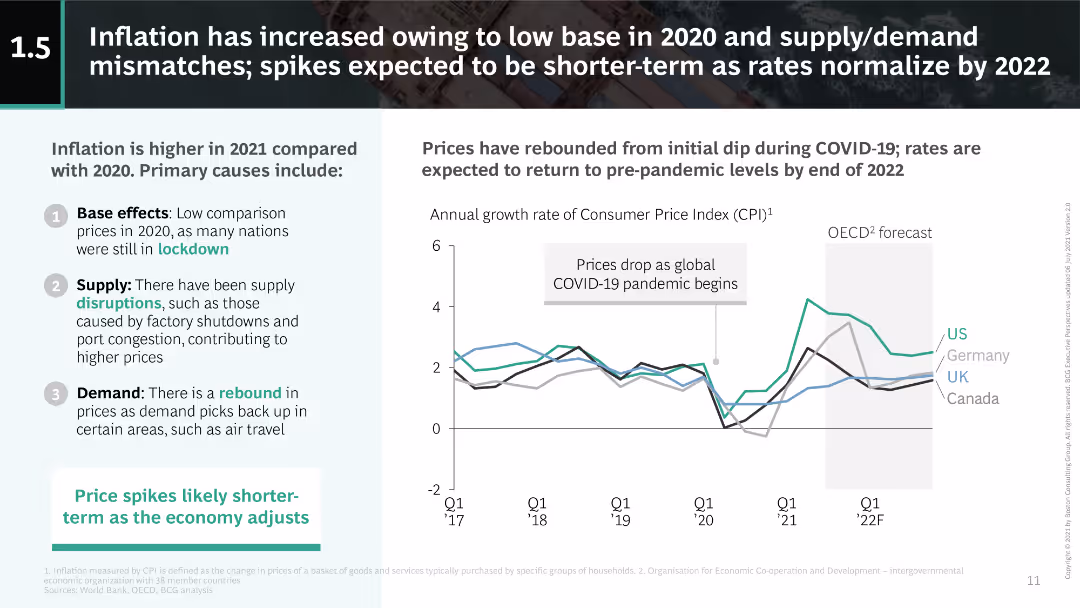
The slide features a line chart showing CPI changes from 2017-2022, with annotations on key points. Additional text explains the causes and expected short-term nature of inflation spikes.
Market Analysis and Trends
Financial Services
The slide covers the causes of inflation increase post-COVID-19 and predicts a return to pre-pandemic levels by 2022. It highlights supply disruptions and demand rebound effects.
inflation, CPI, supply-demand, COVID-19, 2022
false
Market Analysis and Trends
Financial Services
Mixed Chart
BCG
Add to my slides
Remove from favorites
This slide includes three distinct line charts, plotted over time to illustrate the trend in headline inflation numbers across China, the United States, and the Euro Area. The layout is simple and focused.
Regulatory and Compliance
Financial Services
The slide compares inflation trends, essential for financial and economic analysts assessing monetary policy implications and market strategies. It visualizes inflation data in a way that is likely to impact investment and regulatory decisions within the financial services industry.
Inflation, CPI, Trends, Economic
false
Regulatory and Compliance
Financial Services
Single Chart
Morgan Stanley
Add to my slides
Remove from favorites
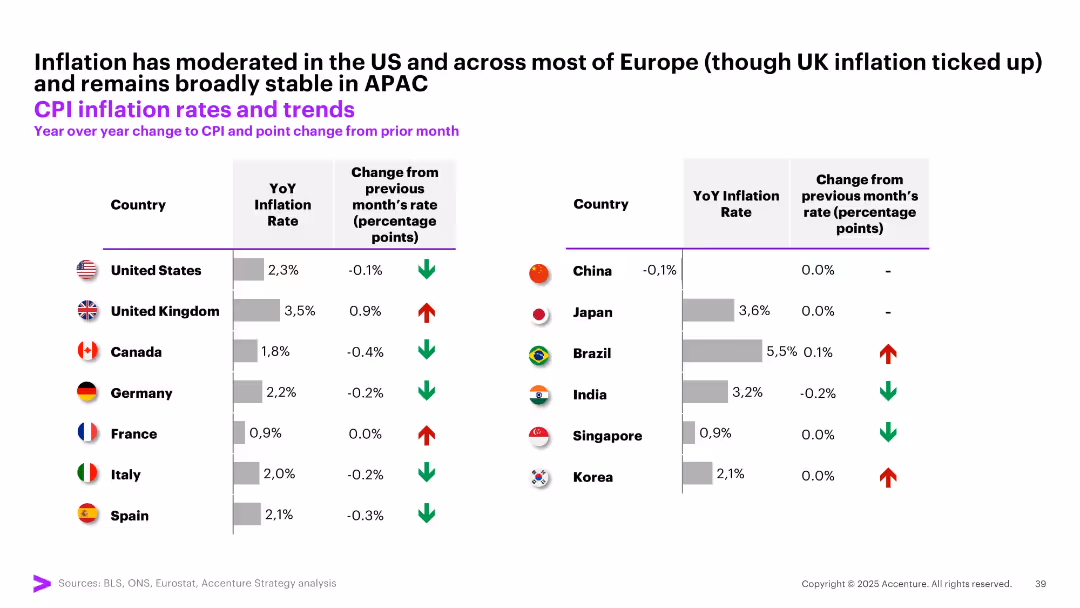
Dual comparison tables showing YoY inflation rates and monthly changes across multiple countries (Americas, Europe, and APAC) with arrow indicators.
Market Analysis and Trends
Financial Services
The slide tracks CPI-based inflation trends across various regions. While the US and most of Europe see moderating inflation, some countries like Brazil and the UK have recent upticks. APAC remains relatively stable.
inflation, CPI, trends, global, comparison, YoY, monthly change, moderation, APAC, Brazil
false
Market Analysis and Trends
Financial Services
Single Chart
Accenture
Add to my slides
Remove from favorites
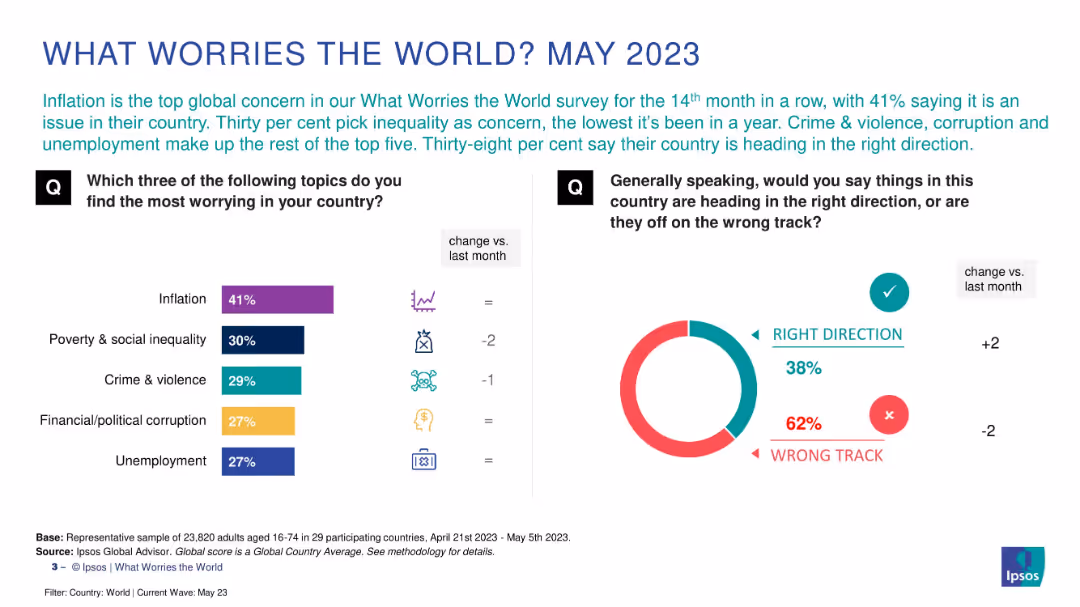
Split layout with left side showing horizontal bar chart and icons; right side has a donut chart and icons
Market Analysis and Trends
Professional Services
This slide shows global public opinion on top national concerns, with inflation topping the list (41%), followed by poverty, crime, corruption, and unemployment. A pie chart reveals 38% believe their country is heading in the right direction. Trend icons show month-over-month changes for each worry.
inflation, crime, inequality, unemployment, global survey
false
Market Analysis and Trends
Professional Services
Multiple Chart
IPSOS
Add to my slides
Remove from favorites
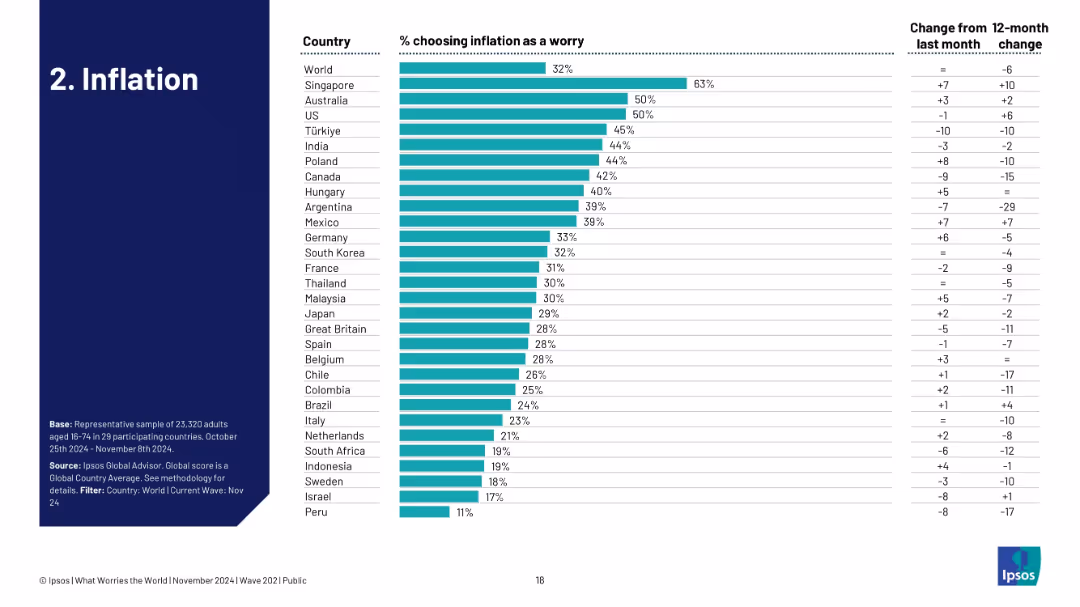
Ranked bar chart by country showing concern about inflation, with month/year change indicators.
Market Analysis and Trends
Professional Services
This slide displays country-level concern about inflation, with Singapore and Australia showing the highest worry levels. Month-over-month and year-over-year trends indicate a mixed change in perception, suggesting ongoing uncertainty about inflationary pressure.
inflation, economic pressure, global comparison, country ranking, Ipsos, financial stress, perception
false
Market Analysis and Trends
Professional Services
Single Chart
IPSOS
Add to my slides
Remove from favorites
This slide features a complex line chart comparing inflation trends over time among the US, Eurozone, and UK. The chart is accompanied by detailed text explanations on both sides, highlighting key statistics and analysis.
Financial Performance
Financial Services
The slide compares inflation rates across developed economies with insights into potential economic rebounds and consumer confidence. It's suited for financial analysis presentations or economic briefings, offering a detailed view of inflation trends and their implications for future policies and decisions.
inflation, economic trends, line chart, developed economies, financial analysis, policy implications
false
Financial Performance
Financial Services
Mixed Chart
McKinsey
Add to my slides
Remove from favorites
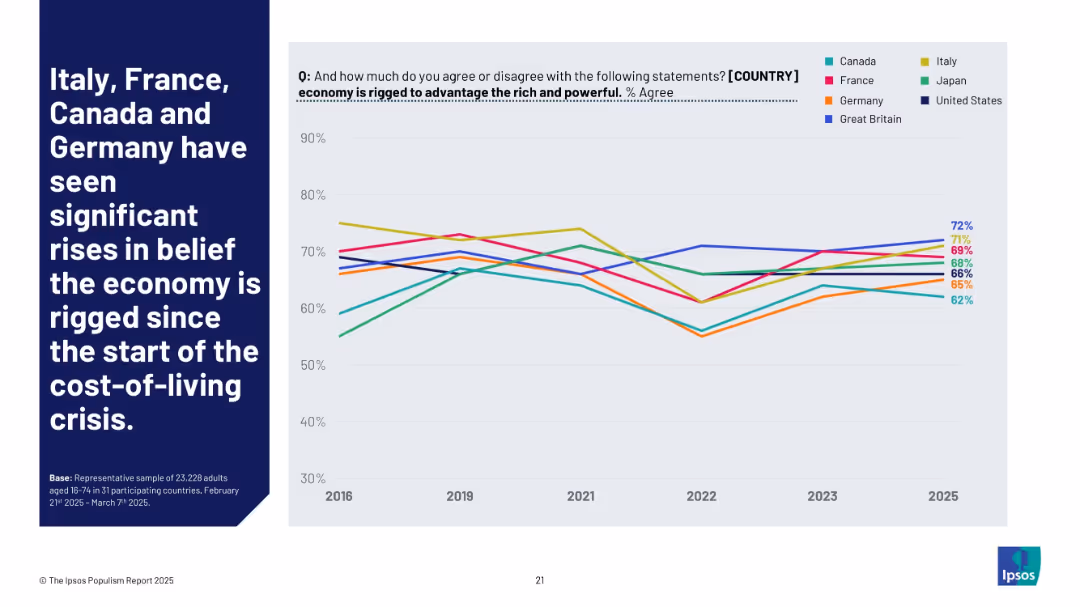
Line graph (2016–2025) showing how belief in economic rigging has trended across selected countries. Each country is shown with a distinct color-coded line.
Market Analysis and Trends
Government & Public Sector
This chart illustrates rising belief that national economies are biased in favor of elites. Italy, France, Canada, and Germany show sharp upward trends—especially since 2021—suggesting an impact from inflation and affordability concerns.
inflation, economy rigged, cost-of-living, public sentiment, trend data, Ipsos, inequality
false
Market Analysis and Trends
Government & Public Sector
Mixed Chart
IPSOS
Add to my slides
Remove from favorites
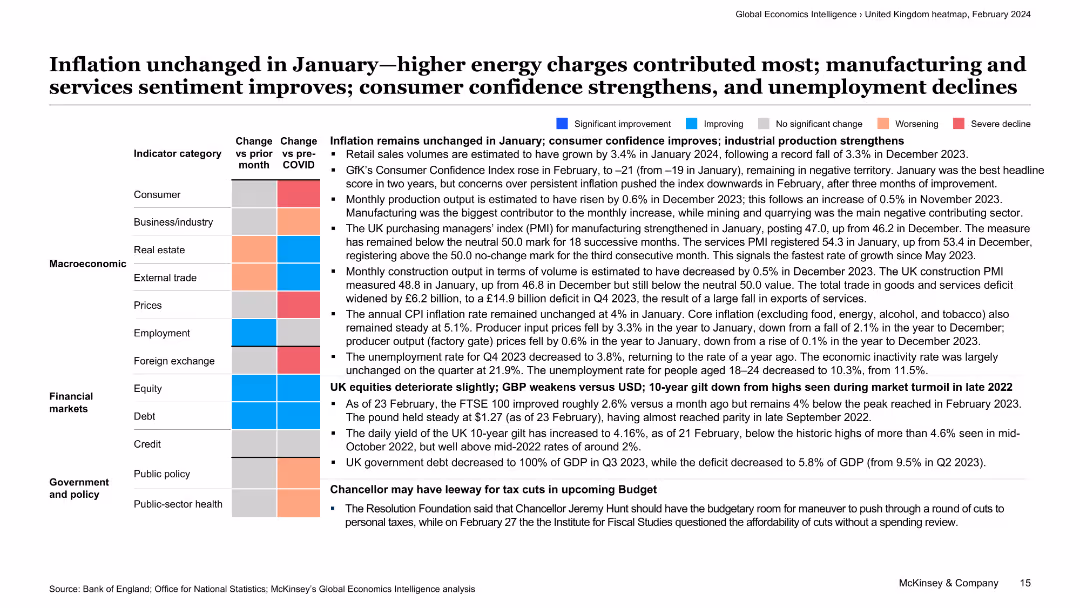
The slide features a detailed text-based content with a categorized list of economic indicators and their respective changes. Each category is color-coded to signify different levels of improvement or decline.
Market Analysis and Trends
Financial Services
This slide discusses the inflation status in January, highlighting that higher energy charges were a major factor. It provides insights into various economic indicators, including consumer confidence, industrial production, and unemployment rates.
inflation, energy charges, economic indicators, consumer confidence, unemployment
false
Market Analysis and Trends
Financial Services
Table
McKinsey
Add to my slides
Remove from favorites
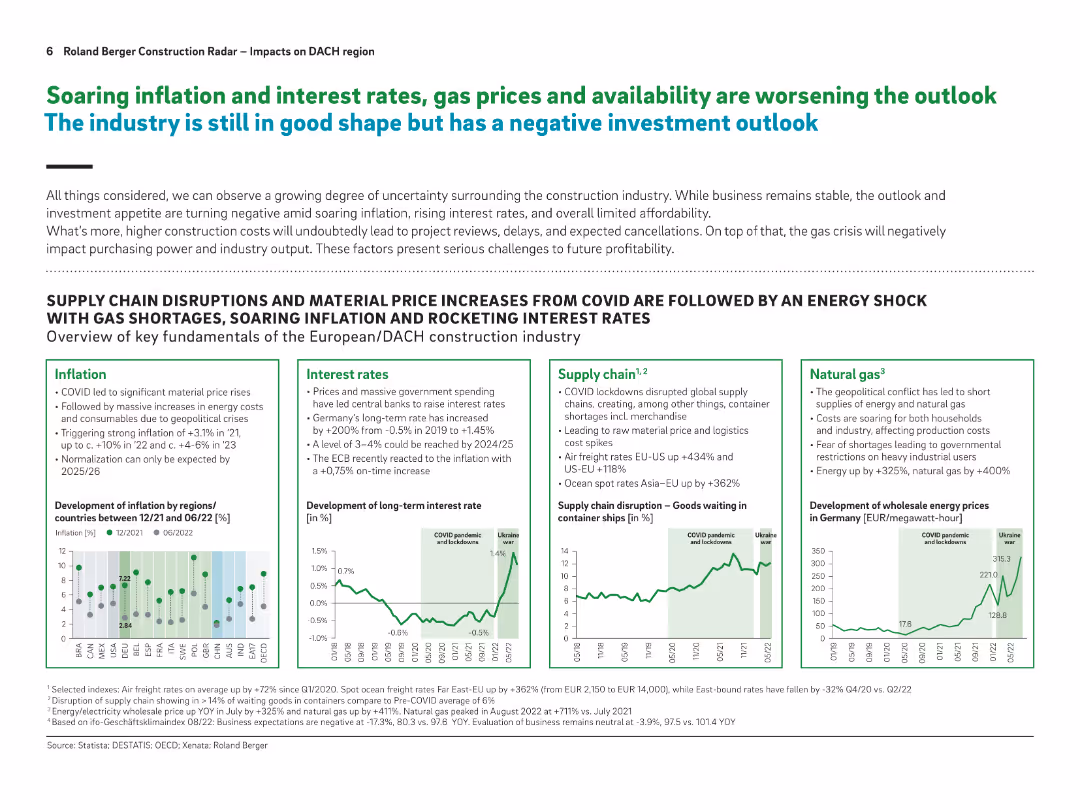
Multi-panel layout with four boxes (Inflation, Interest Rates, Supply Chain, Natural Gas) and relevant line/bar charts; headline in bold green/blue
Risk Assessment and Management
Real Estate & Construction
This slide outlines macroeconomic factors negatively affecting construction: inflation, interest rates, energy supply issues, and supply chain disruptions. It uses data from 2021–2022 to visualize recent shocks and their impact on the industry.
inflation, energy crisis, interest rates, supply chain, construction outlook, Europe, DACH
false
Risk Assessment and Management
Real Estate & Construction
Multiple Chart
Roland Berger
Add to my slides
Remove from favorites
The slide presents a column chart showing Europe HICP y/y inflation (2023-24F) for various countries. The data is displayed clearly, highlighting differences in inflation rates across EU Member States with supporting textual explanations.
Market Analysis and Trends
Financial Services
This slide forecasts diminishing cross-country inflation differentials in the EU for 2024, with most member states seeing inflation in the 1%-3% range. It provides a detailed comparison of inflation rates, discussing the factors contributing to these trends.
inflation, EU, HICP, cross-country, forecast
false
Market Analysis and Trends
Financial Services
Mixed Chart
EY
Add to my slides
Remove from favorites
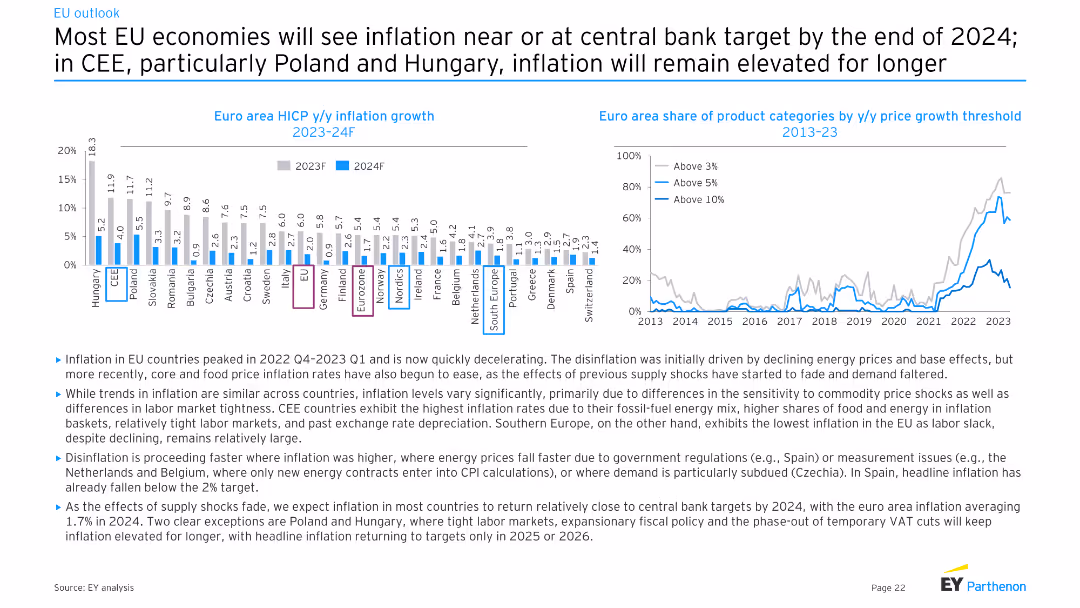
Column chart showing Euro area HICP y/y inflation growth for 2023-24F and a line chart showing Euro area share of product categories by y/y price growth threshold from 2013-23. Moderate complexity, suitable for audiences with some prior knowledge of the topic.
Market Analysis and Trends
Financial Services
This slide analyzes the inflation trends in EU countries, highlighting the differences in inflation rates across countries and projecting future trends. It discusses disinflation processes, the impact of energy prices, and forecasts inflation returning to central bank targets by 2024.
Inflation, EU, HICP, disinflation, energy
false
Market Analysis and Trends
Financial Services
Multiple Chart
EY
Add to my slides
Remove from favorites
Line chart tracking 5Y, 7Y, and 10Y breakeven inflation rates vs. post-pandemic averages.
Market Analysis and Trends
Financial Services
This slide discusses the upward trend in inflation expectations as measured by breakeven rates. It shows that 5Y, 7Y, and 10Y breakevens have all moved above post-pandemic averages, indicating market concerns over longer-term inflationary pressures.
inflation expectations, breakeven rates, macroeconomic trends, monetary policy, inflation trend, fixed income
false
Market Analysis and Trends
Financial Services
Single Chart
Morgan Stanley
Add to my slides
Remove from favorites
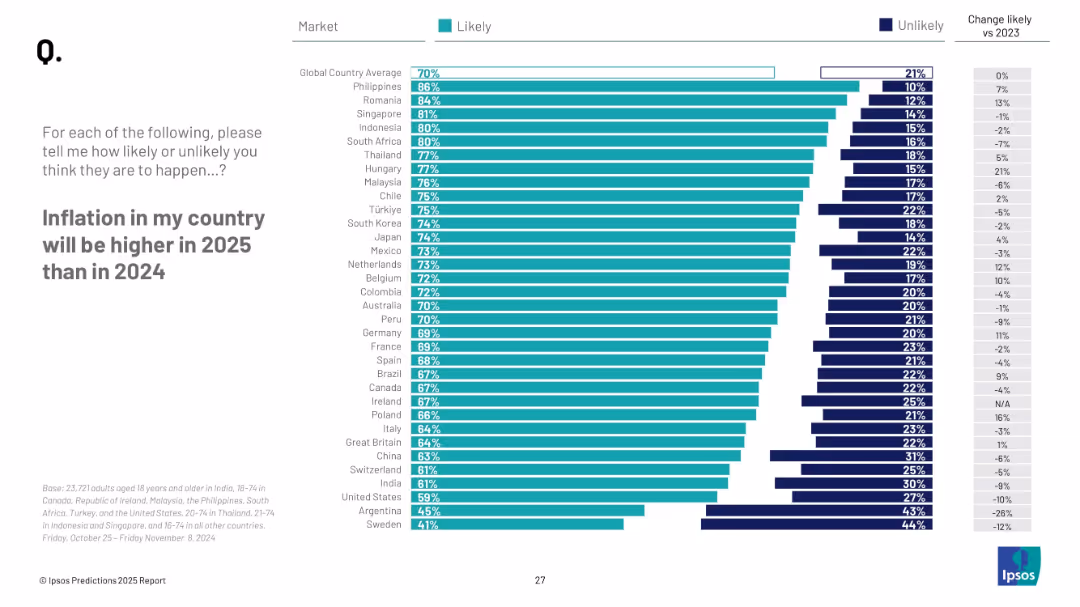
Horizontal bar chart with countries ranked by likelihood of higher inflation in 2025; includes a column on change from 2023.
Market Analysis and Trends
Financial Services
This slide visualizes consumer expectations about inflation in their own countries for 2025. It contrasts likelihood across markets and includes year-over-year trend shifts.
inflation expectations, economic perception, country trends, Ipsos, 2025, cost of living, price increases
false
Market Analysis and Trends
Financial Services
Mixed Chart
IPSOS
Add to my slides
Remove from favorites
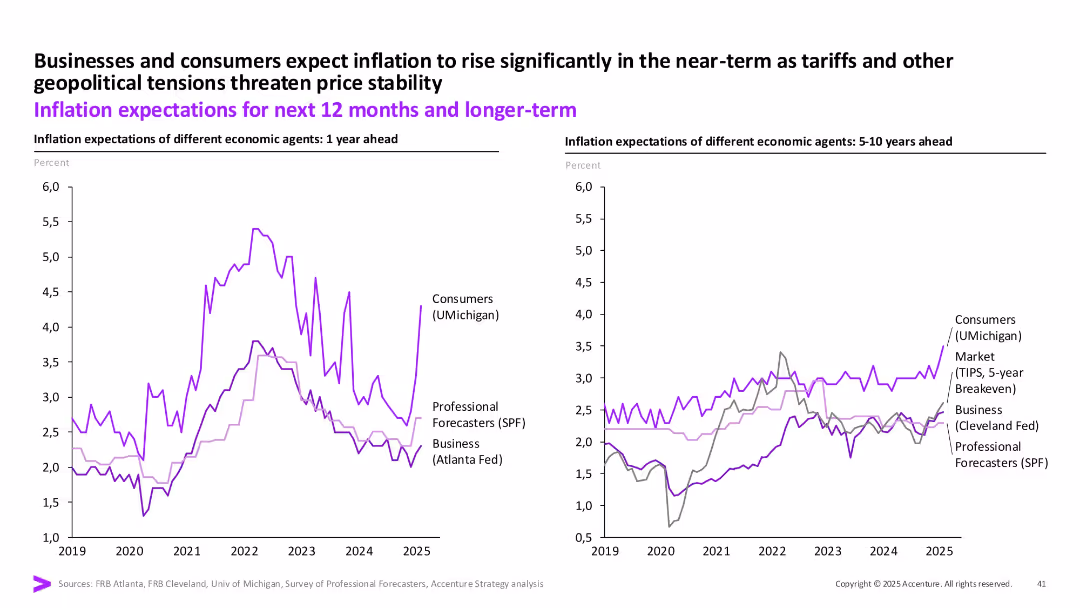
Two line charts comparing 1-year and 5–10-year inflation expectations from consumers, businesses, and forecasters from 2019 to 2025.
Risk Assessment and Management
Financial Services
This slide outlines inflation expectations across different time horizons and agent types. Near-term expectations rise due to geopolitical pressures, while long-term forecasts show more stability across groups.
Inflation Expectations, Forecasting, Risk, Short-term vs Long-term, Consumers, Businesses, 2025
false
Risk Assessment and Management
Financial Services
Multiple Chart
Accenture
Add to my slides
Remove from favorites
The slide has a dual-axis line chart showing the University of Michigan survey inflation expectations for one-year ahead (in blue) and five to ten years ahead (in orange) from 2012 to 2022. The chart exhibits upward trends, especially in the one-year ahead predictions.
Market Analysis and Trends
Financial Services
This slide depicts the short-term and medium-term inflation expectations based on survey data, useful for discussing consumer sentiment, economic outlook, and monetary policy considerations. It highlights the importance of inflation expectations in economic forecasting and strategy formulation.
Inflation Expectations, Survey Data, Economic Forecasting, Short-term, Medium-term, Consumer Sentiment, Michigan Survey
false
Market Analysis and Trends
Financial Services
Single Chart
JP Morgan
Add to my slides
Remove from favorites
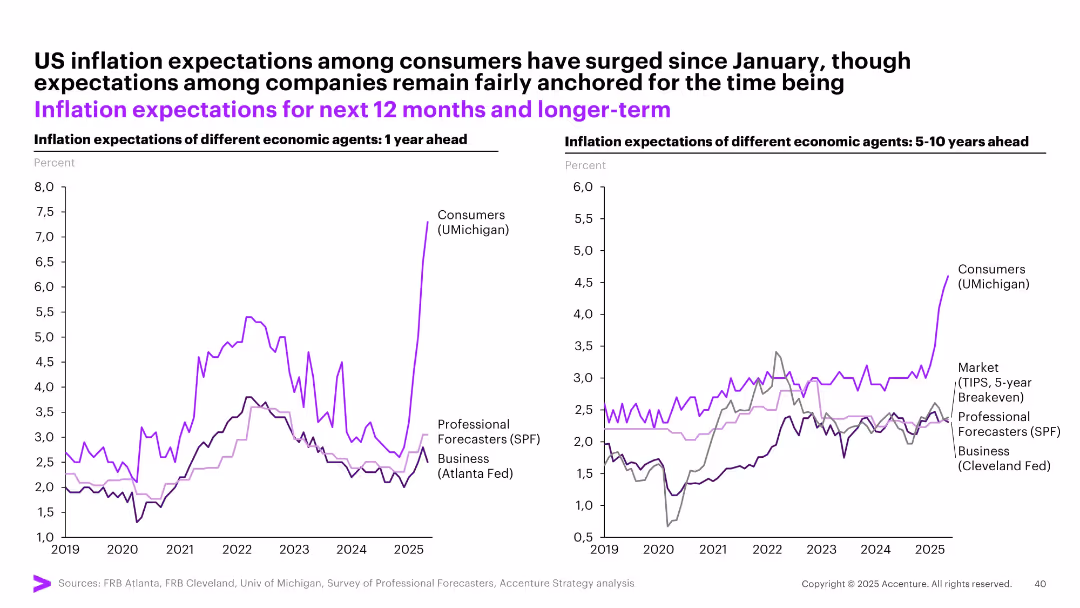
Dual line graphs comparing inflation expectations from various economic agents (consumers, businesses, forecasters) for the US, short and long term.
Market Analysis and Trends
Financial Services
The slide contrasts short- and long-term inflation expectations among US consumers, businesses, and forecasters. Recent consumer expectations have surged sharply, diverging from more anchored business and market expectations.
inflation expectations, US, consumers, long-term, short-term, forecasting, divergence, sentiment, price outlook
false
Market Analysis and Trends
Financial Services
Multiple Chart
Accenture
Add to my slides
Remove from favorites
Presents break-even inflation rates over time through a dual-line graph, accompanied by a clear, concise analysis.
Investment Analysis
Financial Services
Evaluates long-term investor expectations of inflation, likely used in financial services to inform investment strategies.
inflation expectations, US Treasury yields, investment analysis, economic forecast, inflationary pressures, market trends, financial planning
false
Investment Analysis
Financial Services
Single Chart
McKinsey
Add to my slides
Remove from favorites
Bar graphs depicting investors' ranking of macroeconomic risks with annotations of changes since the last survey.
Risk Assessment and Management
Financial Services
Graphically represents investors' concerns, with inflation and Federal Reserve policy topping the list.
inflation, Federal Reserve, risks, macroeconomic, survey, investors
false
Risk Assessment and Management
Financial Services
Single Chart
BCG
Add to my slides
Remove from favorites
This slide contains column charts showing the drivers of recent CPI inflation in the US, UK, and Euro area from January 2021 to February 2023. The charts display contributions from major goods and services categories like energy, food, and housing. Commentary provides additional insights.
Market Analysis and Trends
Consumer Goods
The slide examines inflation drivers, focusing on food price pressures in the UK, and compares them with trends in the US and Euro area. It highlights contributions from various goods and services categories to overall inflation, noting the persistent high core inflation in these regions.
inflation, food prices, US, UK, Euro area, CPI, trends
false
Market Analysis and Trends
Consumer Goods
Multiple Chart
Accenture
Add to my slides
Remove from favorites
The slide contains two line charts. The left chart shows the headline consumer price inflation for developed markets, while the right chart does the same for emerging markets. Both charts forecast year-over-year changes.
Market Analysis and Trends
Financial Services
The slide forecasts headline consumer price inflation for both developed and emerging markets, providing future inflation trends. It is useful for financial planning and assessing economic stability.
inflation forecasts, consumer prices, developed markets, emerging markets, economic trends, financial planning, global economy
false
Market Analysis and Trends
Financial Services
Multiple Chart
JP Morgan
Add to my slides
Remove from favorites
Two-column layout with line charts showing US real GDP and percentage change in headline CPI from 2018-2025F.
Risk Assessment and Management
Financial Services
Analyzes the potential risks and opportunities affecting economic growth, considering inflation, monetary policy, and productivity trends.
inflation, GDP, monetary policy, geopolitical tensions, productivity growth
false
Risk Assessment and Management
Financial Services
Multiple Chart
EY
Add to my slides
Remove from favorites
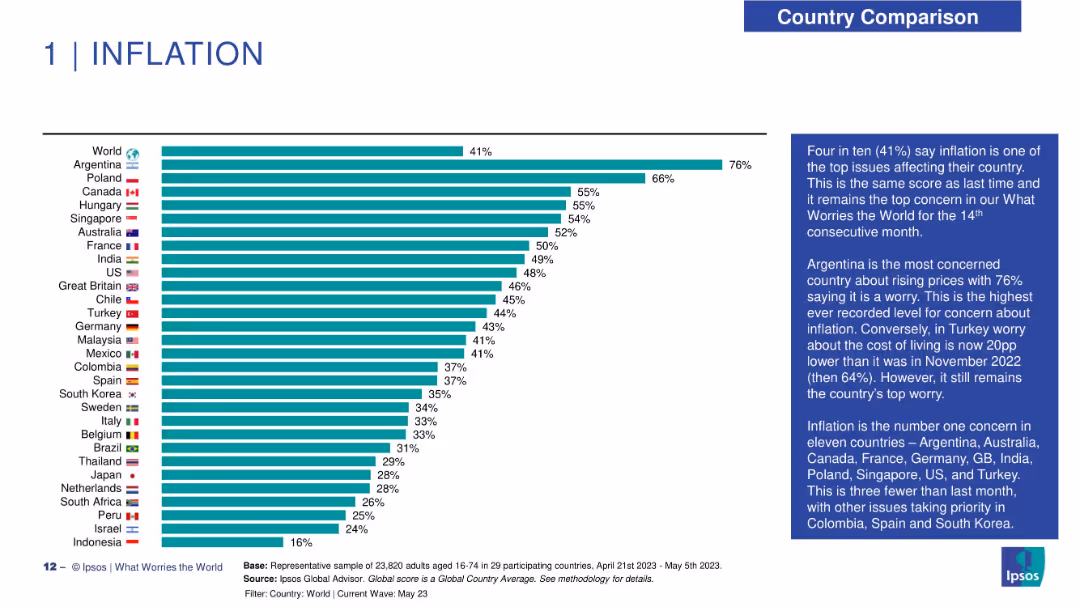
Horizontal bar chart on left displaying percentage of population concerned about inflation across 29 countries. Country flags and names are aligned on the left; percentage bars extend right. Right side includes a text box summarizing insights and trends. Clean layout with blue highlights and simple visual hierarchy.
Market Analysis and Trends
Financial Services
This slide shows survey results on public concern about inflation across various countries. Argentina ranks highest with 76%, followed by Poland and Canada at 66% and 55% respectively. A global average of 41% is reported. The text highlights that inflation has remained the top global worry for 14 months, with notable differences across countries. The slide provides comparative context and tracks concern levels over time.
inflation, global concern, country comparison, survey data, economic trends, Ipsos, financial perception, public sentiment, cost of living, market analysis
false
Market Analysis and Trends
Financial Services
Mixed Chart
IPSOS
Add to my slides
Remove from favorites
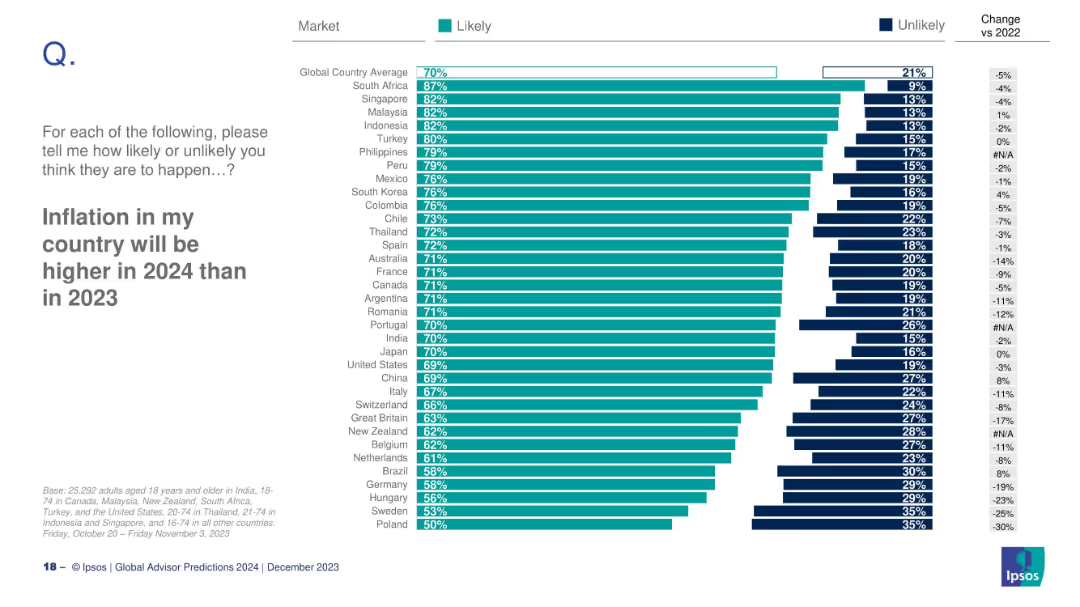
Bar chart comparing countries by percentage of people who think inflation will rise in 2024 vs. 2023
Market Analysis and Trends
Financial Services
This slide presents public opinion across countries on whether inflation is expected to increase in 2024 compared to 2023. The data shows a global average and lists countries from highest to lowest belief in future inflation.
inflation, global perception, 2024 forecast, economic outlook, countries
false
Market Analysis and Trends
Financial Services
Mixed Chart
IPSOS
Add to my slides
Remove from favorites
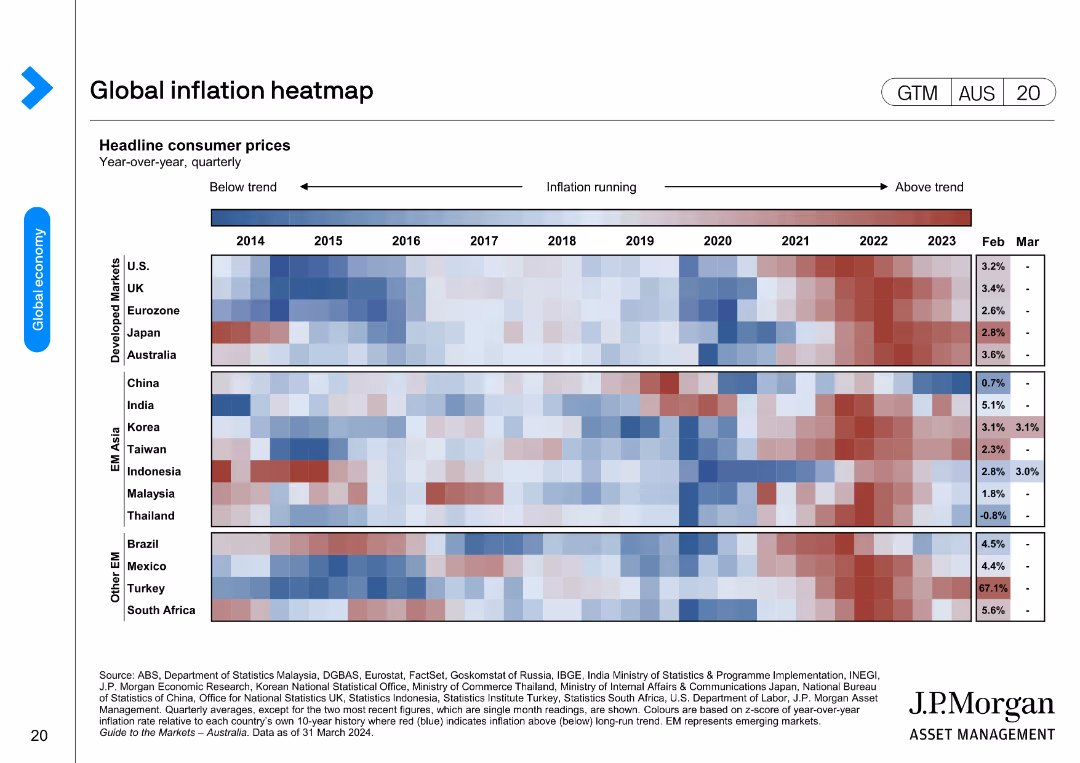
The slide presents a heatmap showing headline consumer prices across various developed and emerging markets over time. Different shades indicate whether inflation is below, at, or above trend.
Market Analysis and Trends
Financial Services
The slide offers an analysis of global inflation trends, comparing headline consumer prices across multiple markets. It helps in understanding inflationary pressures and their implications on the economy.
inflation, global prices, consumer trends, developed markets, emerging markets, economic analysis, price comparison
false
Market Analysis and Trends
Financial Services
Table
JP Morgan
Add to my slides
Remove from favorites
The slide contains three charts. The top left line chart shows inflation and wage growth. The top right line chart shows nominal GDP. The bottom right line chart shows interest rate expectations based on 5y5y swaps.
Market Analysis and Trends
Financial Services
This slide examines Japan's economic indicators, including inflation, wage growth, nominal GDP, and interest rate expectations.
Inflation, Growth, Japan, GDP, Interest Rates
false
Market Analysis and Trends
Financial Services
Multiple Chart
JP Morgan
Add to my slides
Remove from favorites
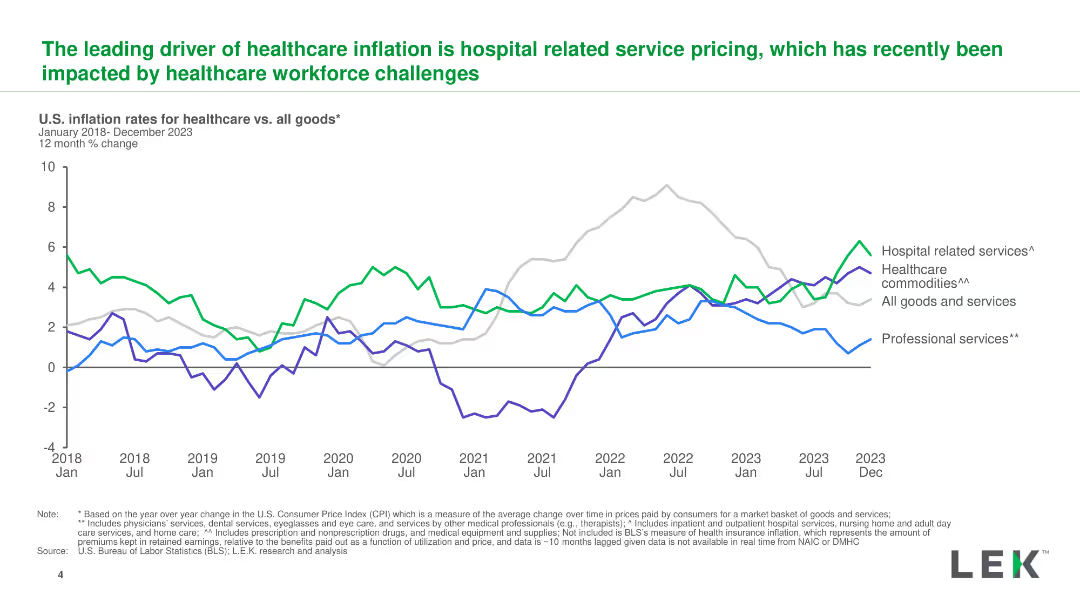
A line chart displaying U.S. inflation rates for healthcare services, commodities, and professional services from 2018 to 2023, with distinct color coding for each category.
Market Analysis and Trends
Healthcare & Pharmaceuticals
The slide explains the main drivers of healthcare inflation, emphasizing the impact of hospital service pricing and workforce challenges on recent trends.
inflation, healthcare, services, pricing, trends
false
Market Analysis and Trends
Healthcare & Pharmaceuticals
Single Chart
LEK
Add to my slides
Remove from favorites
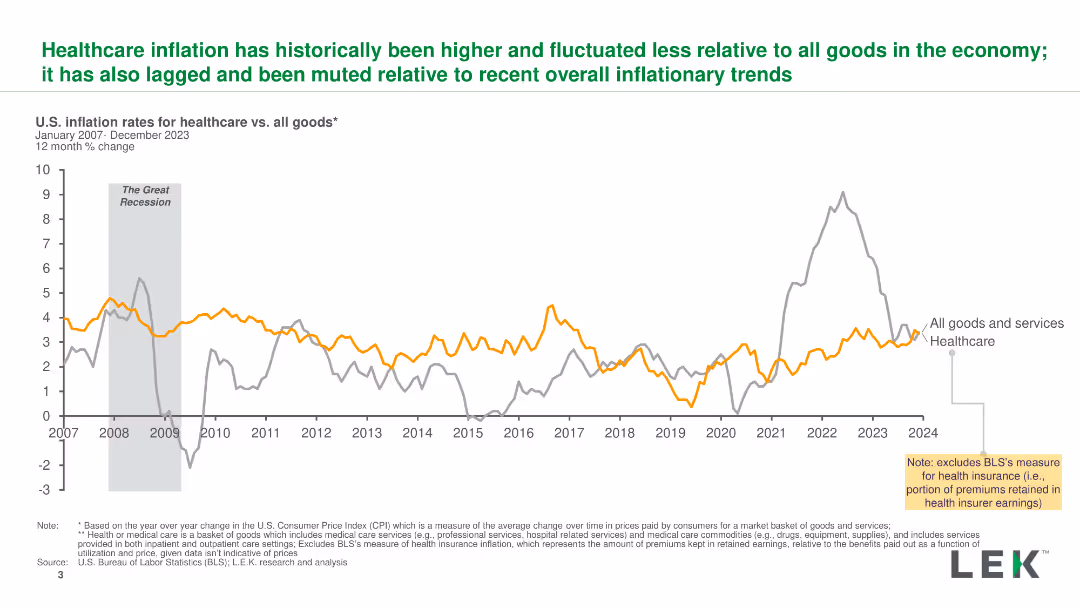
A line chart comparing U.S. inflation rates for healthcare and all goods from 2007 to 2023, highlighting key events and trends with clear lines and labels.
Market Analysis and Trends
Healthcare & Pharmaceuticals
The slide illustrates the historical inflation rates for healthcare versus all goods, showing how healthcare inflation has been higher and more stable over time.
inflation, healthcare, trends, comparison, U.S.
false
Market Analysis and Trends
Healthcare & Pharmaceuticals
Single Chart
LEK
Add to my slides
Remove from favorites
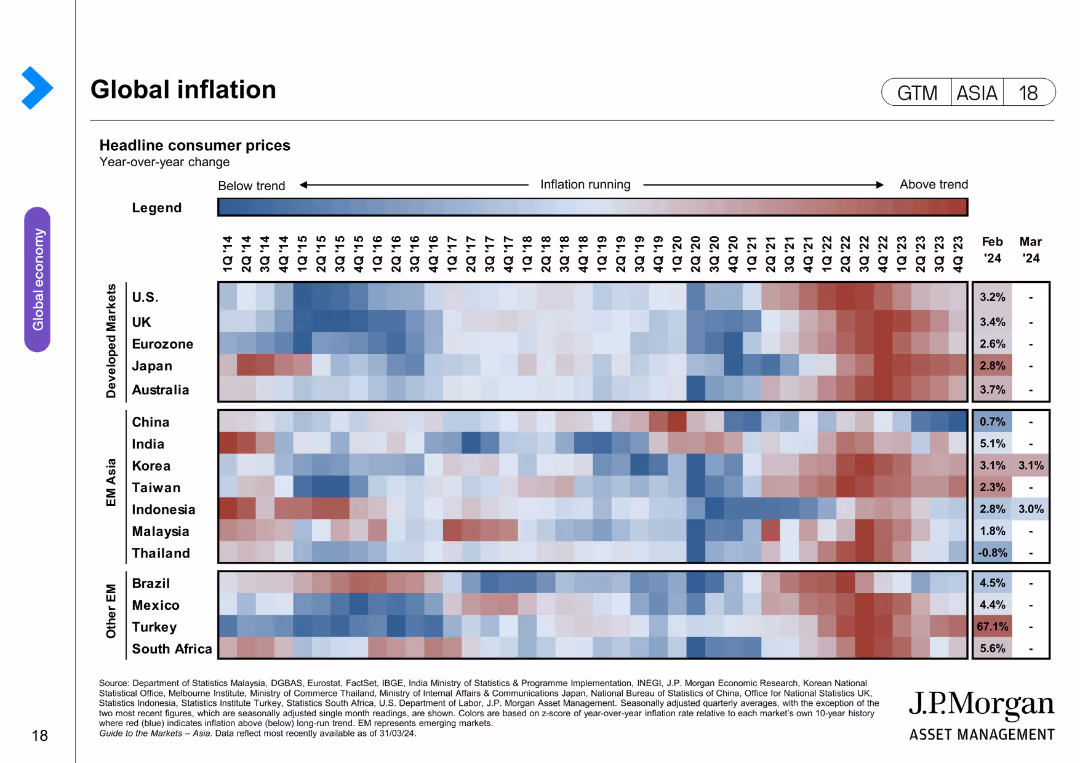
The slide features a heatmap showing headline consumer prices (CPI) year-over-year by quarter for multiple countries (U.S., Eurozone, Japan, China, India, Korea, Brazil, etc.) from 2014 to 2023. Colors indicate inflation running below or above trend.
Market Analysis and Trends
Financial Services
This slide visualizes inflation trends across various countries over time, highlighting periods of high and low inflation. It is useful for comparative analysis of inflationary pressures globally.
Inflation, Heatmap, Consumer Prices, Global, CPI
false
Market Analysis and Trends
Financial Services
Table
JP Morgan
Add to my slides
Remove from favorites
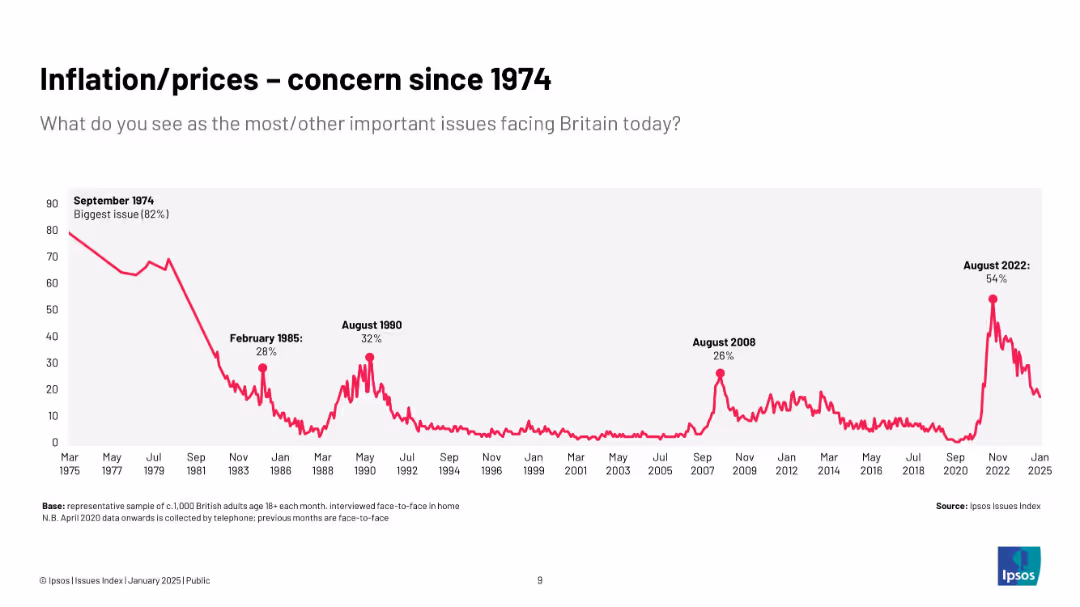
Extended timeline chart (1974–2025) of inflation concerns; major peaks and drops annotated
Market Analysis and Trends
Government & Public Sector
This slide provides a historical view of inflation concerns from 1974 to 2025. Major events include record-high concern in 1974 and resurgence during 2022. It contextualizes current sentiment historically.
inflation, history, UK, concern, Ipsos, economy, prices, public opinion, long-term trends
false
Market Analysis and Trends
Government & Public Sector
Single Chart
IPSOS
Add to my slides
Remove from favorites
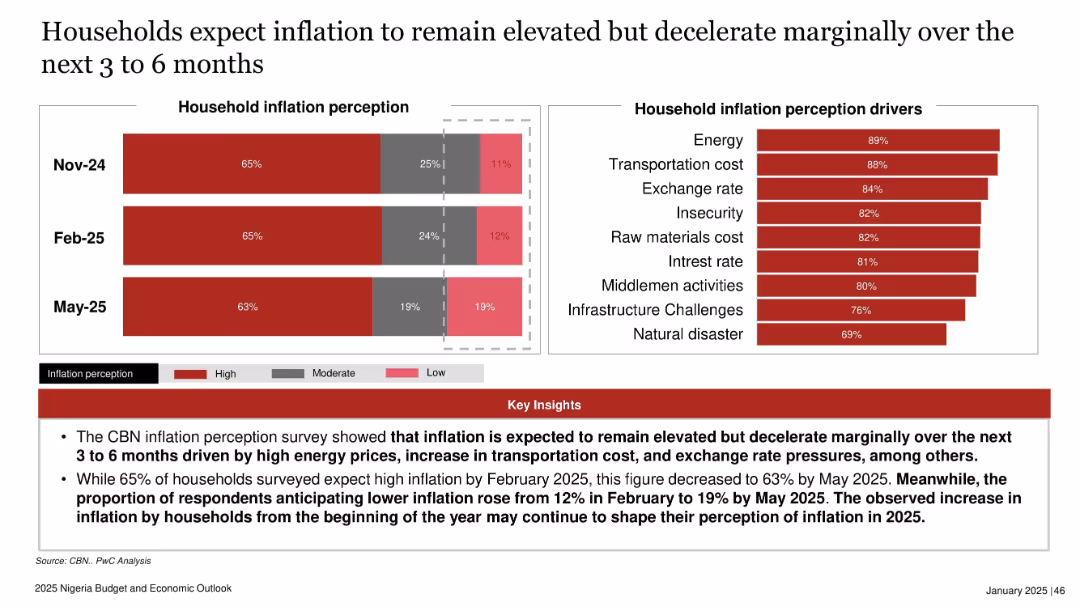
Split layout with a bar graph showing inflation perceptions by month on the left and a drivers bar chart on the right; red theme with bold key insights box at the bottom.
Market Analysis and Trends
Financial Services
This slide summarizes households' inflation expectations, showing a slight reduction in anticipated high inflation from Feb to May 2025. Key inflation drivers include energy, transportation, and exchange rates. The data reflects continued concerns despite marginal improvements.
inflation, household perception, Nigeria, energy costs, exchange rate, economic sentiment, 2025 trend, cost of living
false
Market Analysis and Trends
Financial Services
Multiple Chart
PwC/Strategy&
Add to my slides
Remove from favorites
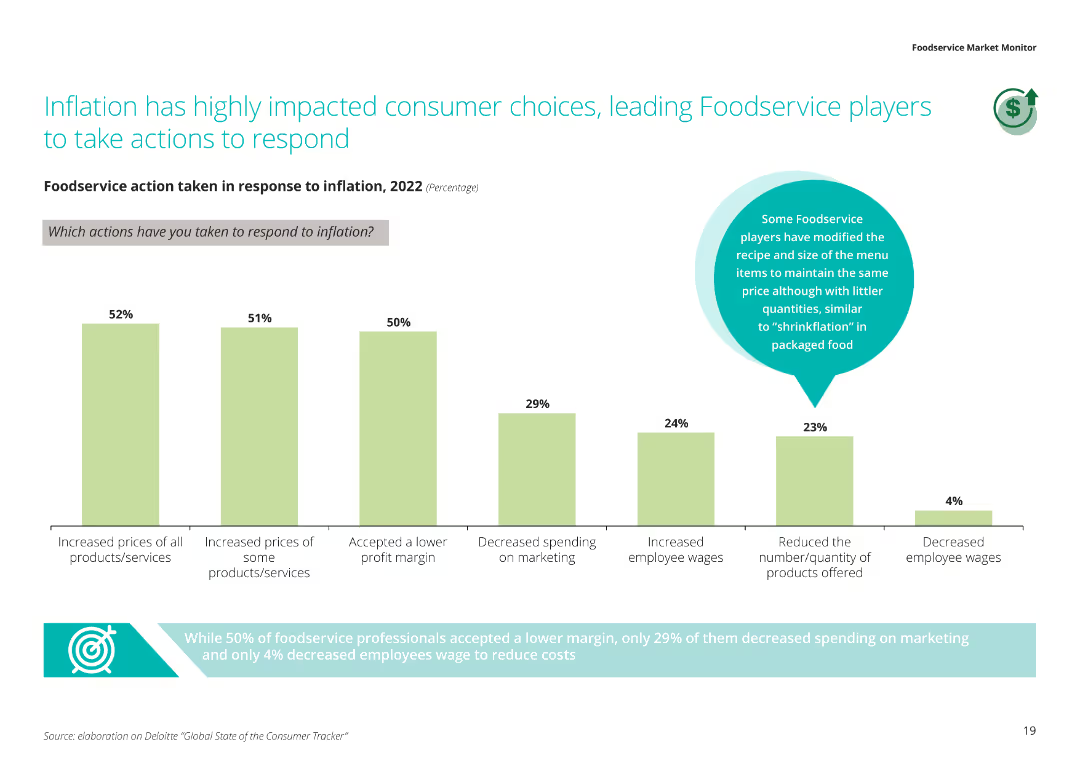
The slide shows a column chart detailing the actions taken by foodservice providers in response to inflation, including price increases, lower profit margins, and changes in marketing and wages.
Market Analysis and Trends
Hospitality & Tourism
This slide analyzes the impact of inflation on consumer choices and the subsequent actions taken by foodservice providers, such as increasing prices and accepting lower profit margins.
Inflation impact, consumer choices, foodservice actions, price increases, lower profit margins
false
Market Analysis and Trends
Hospitality & Tourism
Single Chart
Deloitte
Add to my slides
Remove from favorites
This slide features a line chart depicting the Global economic policy uncertainty index from 1997 to 2022, and a column chart showing year-over-year percent change in real GDP from 2019 to 2024 for various regions and countries. It uses a blue and white color scheme with clear labels and legends.
Market Analysis and Trends
Financial Services
The slide analyzes persistent inflation and elevated interest rates, showcasing global economic policy uncertainty and projected real GDP changes for different regions and countries, suggesting these as continued characteristics of the economic slowdown.
inflation, interest rates, economic slowdown, GDP, policy uncertainty
false
Market Analysis and Trends
Financial Services
Multiple Chart
EY
Add to my slides
Remove from favorites
Two line charts showing inflation and interest rate expectations by country, and a bar chart of interest rate environments.
Market Analysis and Trends
Financial Services
Explores inflation and interest rate expectations in different countries, suggesting optimism in international investing.
Inflation, interest rates, international investing, expectations, analysis, optimism, countries, trends
false
Market Analysis and Trends
Financial Services
Multiple Chart
JP Morgan
Add to my slides
Remove from favorites
Bar and line graphs showing investor inflation expectations for the coming years.
Investment Analysis
Financial Services
Details investor expectations on inflation, indicating a prolonged period of elevated levels through 2023.
inflation, investor expectations, economy, stock market, survey, analysis
false
Investment Analysis
Financial Services
Multiple Chart
BCG
Add to my slides
Remove from favorites
The slide features two donut charts comparing 2023 and 2022 responses on inflation knowledge, with data annotations.
Market Analysis and Trends
Financial Services
It shows the percentage of Canadians who correctly answered a question about inflation, comparing results from 2022 to 2023.
Inflation, Knowledge, Canadians, Percentage, 2023, 2022, Chart, Financial, Trends
false
Market Analysis and Trends
Financial Services
Multiple Chart
IPSOS
Add to my slides
Remove from favorites
The slide features a donut chart showing the responses to a question about inflation knowledge, with a breakdown of correct, incorrect, and unsure answers. The layout is moderately complex.
Performance Metrics and KPIs
Financial Services
This slide measures Canadians' understanding of inflation, revealing that 64% answered correctly about the impact of inflation on savings. It aims to assess public knowledge about inflation.
inflation, knowledge, savings, Canadians, understanding
false
Performance Metrics and KPIs
Financial Services
Single Chart
IPSOS
Add to my slides
Remove from favorites
Three line charts display LatAm y/y CPI, interest rate, and y/y wage growth from 2015-2025F for Brazil, Mexico, and Chile. Text provides detailed explanations.
Market Analysis and Trends
Financial Services
Focuses on inflation trends in Latin America, the impact of monetary policies, and forecasts for future economic conditions.
Inflation, Latin America, CPI, Interest Rate, Wage Growth
false
Market Analysis and Trends
Financial Services
Multiple Chart
EY
Add to my slides
Remove from favorites
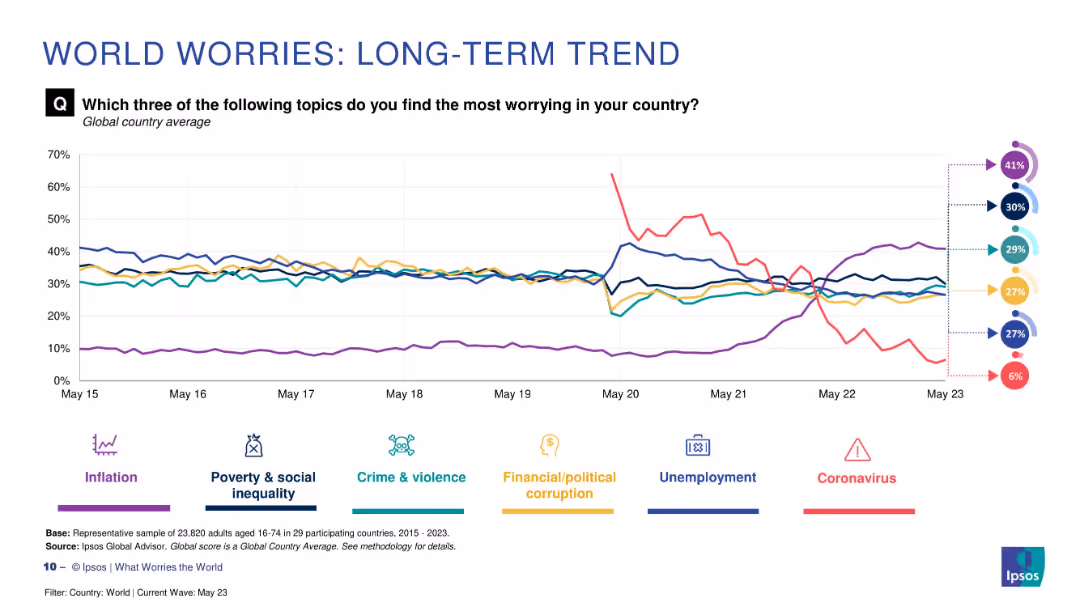
Line chart showing trends for six major global concerns from 2015 to 2023
Market Analysis and Trends
Professional Services
This slide displays long-term worry trends on six issues. Inflation rises sharply post-2020, while concern over coronavirus plummets. Crime, unemployment, and inequality have fluctuated moderately. The data reflects evolving public priorities over time in response to global events and crises.
inflation, long-term, pandemic, crime, public concern
false
Market Analysis and Trends
Professional Services
Multiple Chart
IPSOS
Add to my slides
Remove from favorites
The slide lists seven strategies for managing inflation with icons and brief descriptions for each rule. The background is segmented into 'Fight,' 'Manage,' and 'Leverage.'
Operational Efficiency
Consumer Goods
It provides seven strategies for tackling inflation, emphasizing competitive sourcing, supply availability, commodity price risk management, and supply chain optimization.
Inflation management, competitive sourcing, supply availability, price risk, supply chain, strategies, cost structure
false
Operational Efficiency
Consumer Goods
Multiple Chart
Kearney
Add to my slides
Remove from favorites
The slide lists seven strategies for managing inflation with icons and brief descriptions for each rule. The background is segmented into 'Fight,' 'Manage,' and 'Leverage.'
Operational Efficiency
Consumer Goods
It provides seven strategies for tackling inflation, emphasizing competitive sourcing, supply availability, commodity price risk management, and supply chain optimization.
Inflation management, competitive sourcing, supply availability, price risk, supply chain, strategies, cost structure
false
Operational Efficiency
Consumer Goods
Table
Kearney
Add to my slides
Remove from favorites
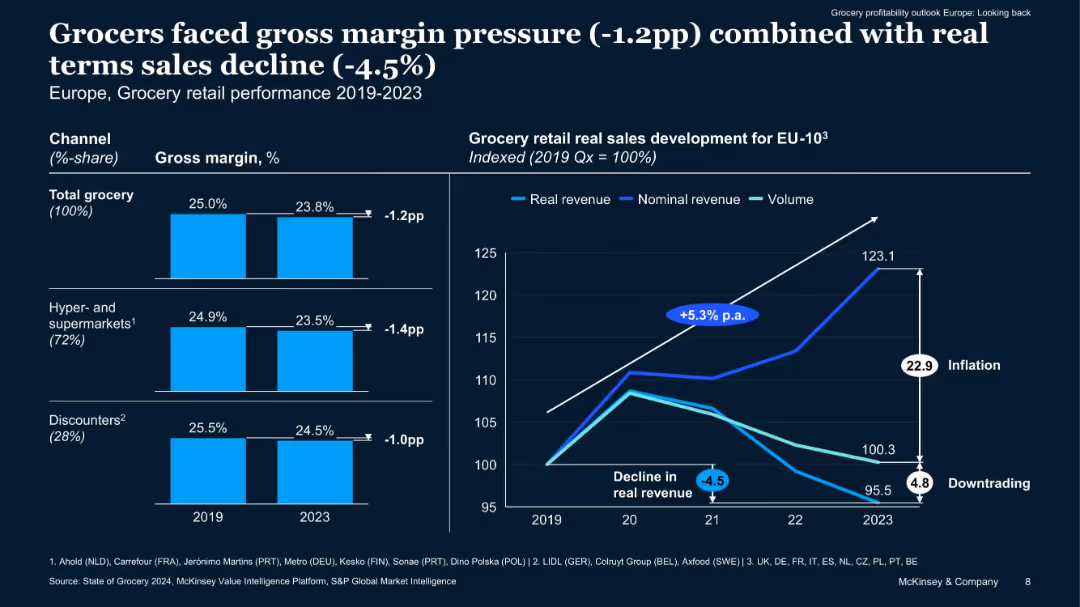
Combination chart with left-side bar graphs showing margin declines by segment and right-side line chart showing sales development indexed to 2019. Dual-axis highlighting inflation and volume trends.
Performance Metrics and KPIs
Retail & E-commerce
Analyzes grocery sector performance from 2019–2023, showing declining real sales (-4.5%) and margin pressure due to inflation. Differentiates performance between hypermarkets and discounters, and outlines the impacts of cost pass-through and consumer behavior shifts.
inflation, margin pressure, sales trends, COVID, grocery sector
false
Performance Metrics and KPIs
Retail & E-commerce
Multiple Chart
McKinsey
Add to my slides
Remove from favorites
The slide is organized into three main columns, each representing how companies within different sectors are responding to inflation—either by reducing, increasing, or maintaining marketing spend. The use of contrasting colors facilitates easy comparison.
Market Analysis and Trends
Professional Services
This slide categorizes how different industry sectors are reacting to inflation in terms of their marketing spend. It provides a nuanced view of economic strategies, highlighting which sectors are more resilient or vulnerable to market changes. This information is crucial for cross-sector analysis and strategic adjustments.
Inflation, Marketing Spend, Industry Comparison, Economic Strategy, Resilience
false
Market Analysis and Trends
Professional Services
Table
Deloitte
Add to my slides
Remove from favorites
This slide features a pie chart showing the impact of inflation on marketing spending across three categories: no impact, increasing, and decreasing levels. The chart uses color differentiation to highlight these categories clearly.
Market Analysis and Trends
Professional Services
The slide explores the impact of inflation on marketing budgets, detailing how different sectors are either cutting back or increasing their spend in response to economic pressures. This can aid in strategic planning and budget allocation during inflationary periods.
Inflation, Marketing Spending, Economic Impact, Budget Planning, Strategy
false
Market Analysis and Trends
Professional Services
Single Chart
Deloitte
Add to my slides
Remove from favorites
This slide contains a table showing the percentage of companies reporting various impacts of inflation on their marketing activities, such as changes in pricing and value propositions. The visual clarity and spacing between bars make the data easily digestible.
Market Analysis and Trends
Professional Services
The slide details the effects of inflation on marketing strategies, emphasizing how companies are adjusting their pricing and value propositions without affecting employment levels. This highlights the strategic responses to maintain market competitiveness and operational stability during inflationary periods.
Inflation, Marketing Strategy, Pricing, Value Proposition, Employment
false
Market Analysis and Trends
Professional Services
Table
Deloitte
Add to my slides
Remove from favorites
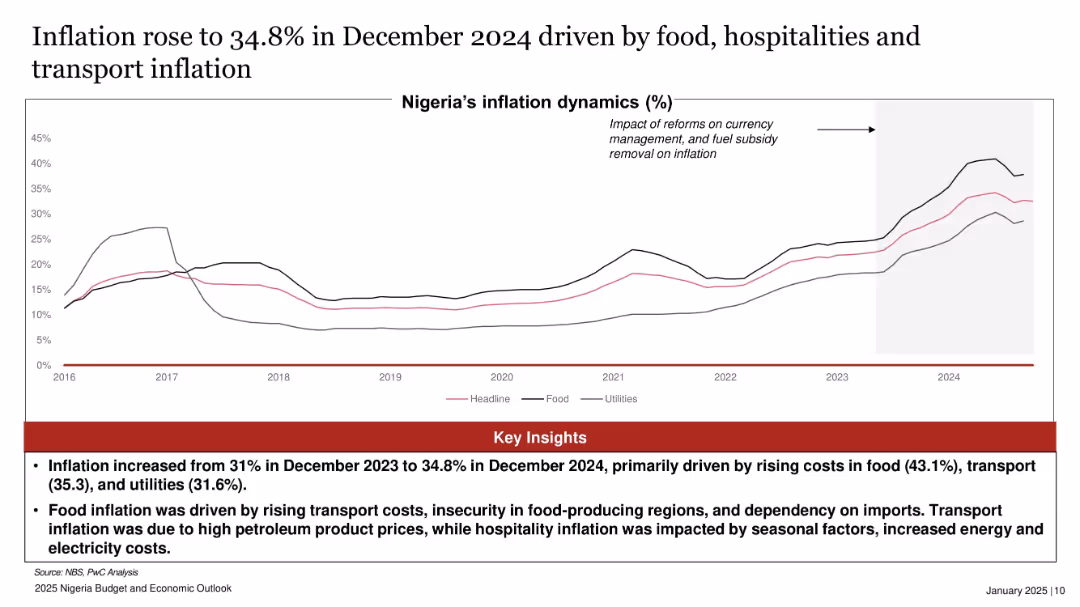
Line chart with three trend lines showing headline, food, and utilities inflation from 2016 to 2024.
Risk Assessment and Management
Government & Public Sector
The slide details inflation trends in Nigeria, which rose to 34.8% in December 2024. It attributes the spike to rising costs in food (43.1%), transport (35.3%), and utilities (31.6%), highlighting the impact of transport costs and fuel subsidies on price dynamics.
inflation, Nigeria, food prices, transport, utilities, cost drivers, headline inflation
false
Risk Assessment and Management
Government & Public Sector
Mixed Chart
PwC/Strategy&
Add to my slides
Remove from favorites
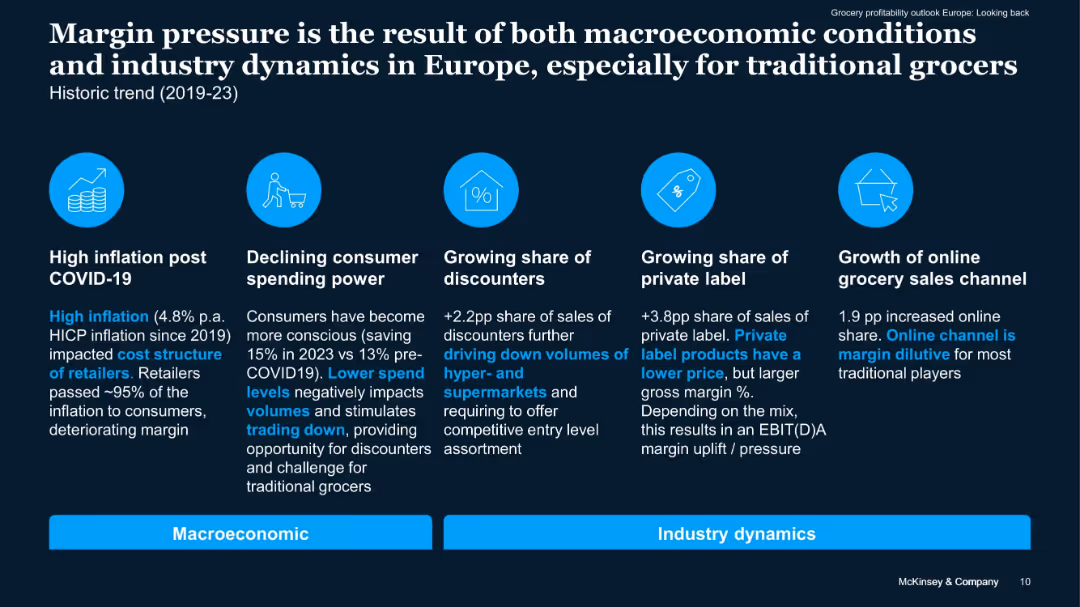
Horizontal five-icon layout with columns for each factor: inflation, spending power, discounters, private label, and online channel. Simple visuals support a text-heavy, structured breakdown.
Market Analysis and Trends
Retail & E-commerce
Summarizes drivers of margin pressure in European grocery: high inflation, lower consumer spending, rise in discounters, private labels, and online channels. Explains how each factor contributes to lower profitability and volume pressure.
inflation, online sales, private label, discounters, spending power
false
Market Analysis and Trends
Retail & E-commerce
Pillar
McKinsey
Add to my slides
Remove from favorites
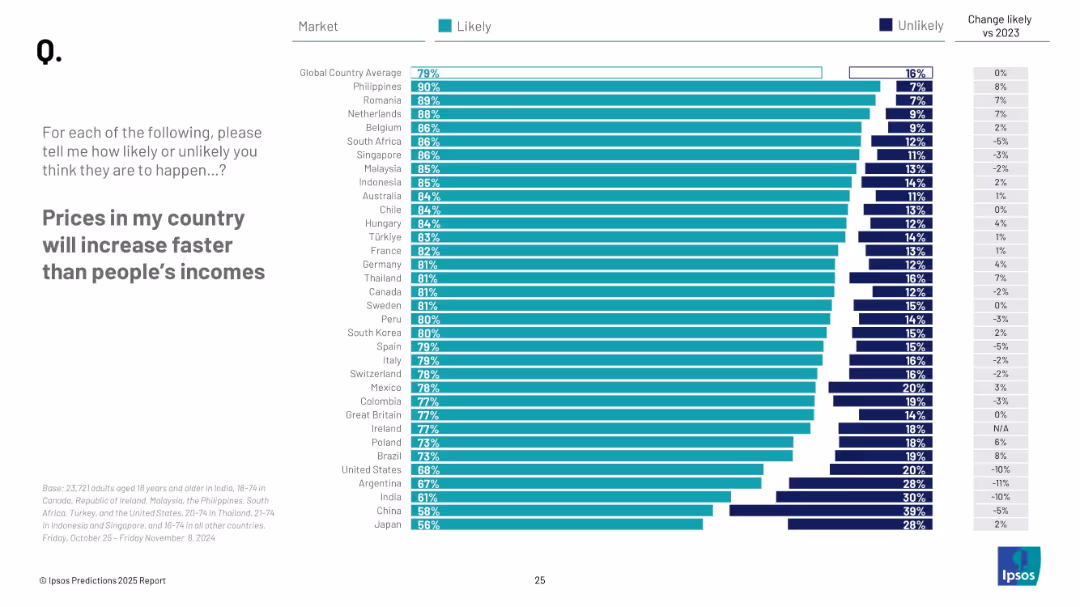
Horizontal bar chart showing perceived likelihood of rising prices vs income across countries; sorted by likelihood; includes year-over-year change.
Market Analysis and Trends
Financial Services
Survey respondents gave their views on whether prices would outpace income growth in 2025. The slide presents likelihood across markets and changes from 2023 sentiment.
inflation perception, price growth, cost of living, income disparity, global sentiment, Ipsos, 2025
false
Market Analysis and Trends
Financial Services
Mixed Chart
IPSOS
Add to my slides
Remove from favorites
This slide features multiple line graphs comparing global and regional trends in manufacturing PMI and input price inflation. The graphs highlight recent trends and the implications of easing inflation on economic policies.
Financial Performance
Financial Services
Provides a detailed analysis of inflationary trends affecting global markets, with a focus on the cooling of supply chain pressures and the slower pace of input cost increases. This slide is crucial for understanding the economic outlook and potential financial risks heading into 2022.
inflation, PMI, economic outlook, supply chain, financial risk
false
Financial Performance
Financial Services
Multiple Chart
Deloitte
Add to my slides
Remove from favorites
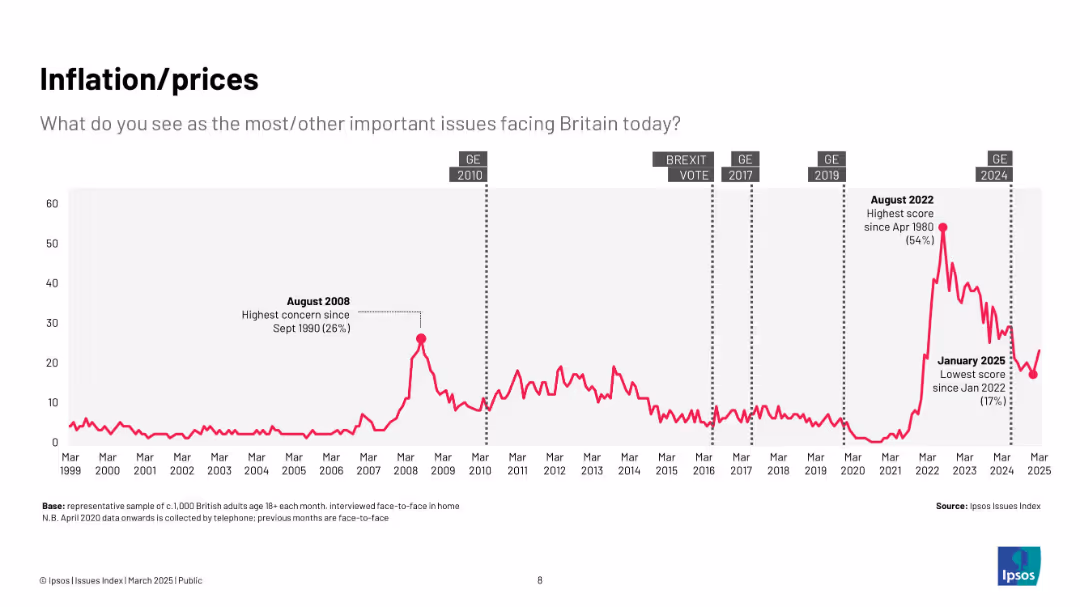
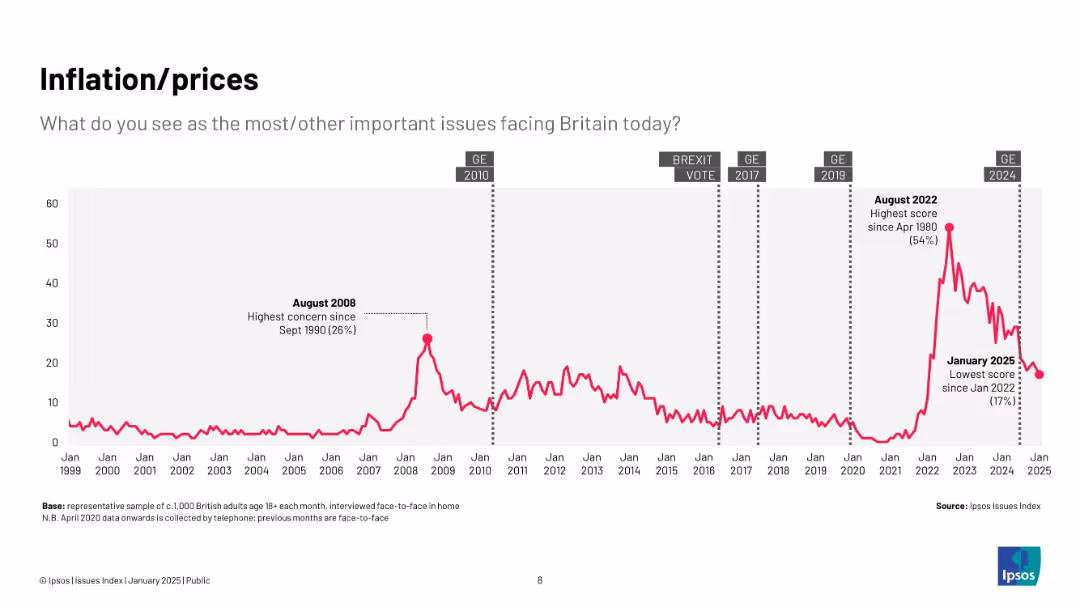
Pink line chart (1999–2025) with peak in 2022 and sharp drop by 2025; context points include financial crises and recent inflation spikes.
Market Analysis and Trends
Government & Public Sector
Highlights the rising and falling concern over inflation and prices, with major spikes during economic shocks such as 2008 and the post-COVID inflationary period.
inflation, prices, cost of living, Ipsos, economy, concern, UK, trends
false
Market Analysis and Trends
Government & Public Sector
Single Chart
IPSOS
Add to my slides
Remove from favorites
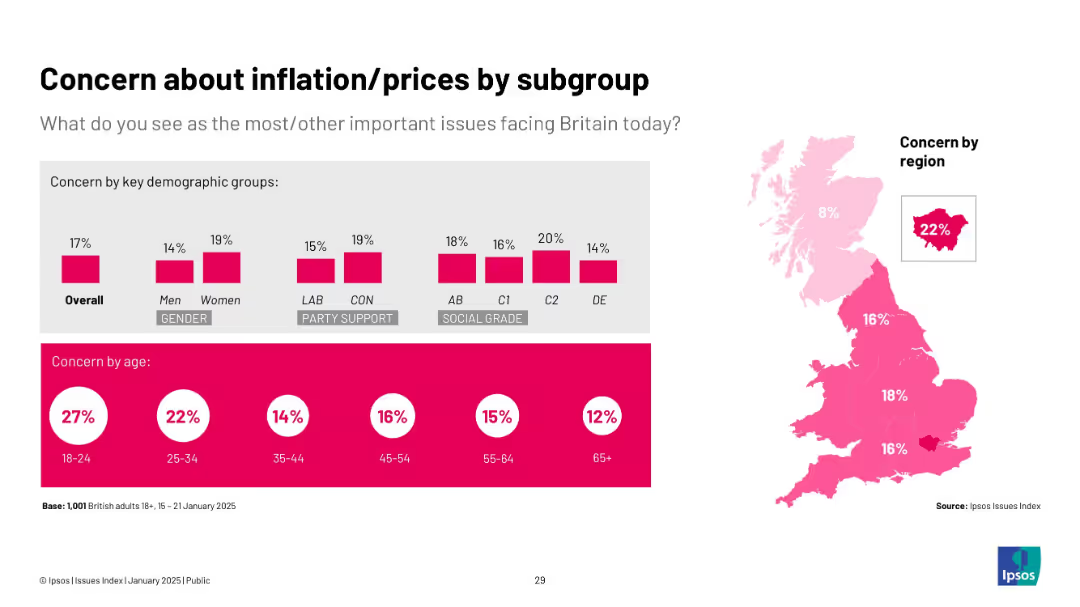
Mixed visuals: bar charts by gender, party, social grade, age + regional heat map.
Market Analysis and Trends
Financial Services
This slide examines public concern over inflation and pricing. Concern is strongest among women, Conservatives, and mid-age groups. London shows the highest regional concern. The map and bars break down worry by demographics.
inflation, prices, region, demographics, Ipsos, cost of living
false
Market Analysis and Trends
Financial Services
Multiple Chart
IPSOS
Add to my slides
Remove from favorites
Longitudinal chart tracking inflation-related concerns from 1999–2025 with key peaks noted
Market Analysis and Trends
Government & Public Sector
The slide presents concern levels over time for inflation/prices, noting spikes during 2008 and 2022 economic shocks. January 2025 marks the lowest concern since early 2022.
inflation, prices, UK, Ipsos, economic concern, timeline, cost of living, public sentiment, chart
false
Market Analysis and Trends
Government & Public Sector
Single Chart
IPSOS
Add to my slides
Remove from favorites
Previous
Next
You don't have any favorites yet.
Please wait loading your favorites slides...
Create a FREE account to continue browsing
Receive Instant Access to 1,000+ slides from companies like McKinsey, Google, and Goldman Sachs
First Name
Last Name
Email
Password
I agree to all
Terms & Privacy Policy
Thank you! Your submission has been received!
Oops! Something went wrong while submitting the form.
Have an account?
Sign in
Upgrade to PRO to Save slides
Advanced Search and Filters
Access to 15,000+ slides
Access to Category Pages
Save/Bookmark Slides
PowerPoint Template Library
Pick a Plan
MONTHLY
$12/month
Billed every month, Cancel anytime.
YEARLY
$9/year
Billed $108 annually, Cancel anytime.
Checkout for $12/month
Checkout for $108/yr
Secured by Stripe | AES-256 bit encryption


![Compared to all the other problems facing [country], would you say that inequality is…?](https://cdn.prod.website-files.com/654e70fb59937215cac87b19/6899c83041a13c55f854e4d2_7Iu6C-kBzPzpWqWgFQ_aF6tSLRgb38x6NhQZXZw_81M.avif)