My Account
My Slides
Search by Category
Companies
Slide Type
Use Case
Industry
Pricing
Templates
View All Templates
Download Template Slides
✦ AI
AI Prompt Library
AI Search
Feedback
Login
Logout
Get Started
Browse all Slides
Browse all Slides
Create a FREE Account
Instant access to 1,000+ real slides from top companies like McKinsey, BCG, Goldman Sachs, Google and many more!
First Name
Last Name
Email
Password
I agree to all
Terms & Privacy Policy
Thank you! Your submission has been received!
Oops! Something went wrong while submitting the form.
Have an account?
Sign in
Saved Slides
Total No. of slides saved
0
↻ Refresh
✖ Clear all
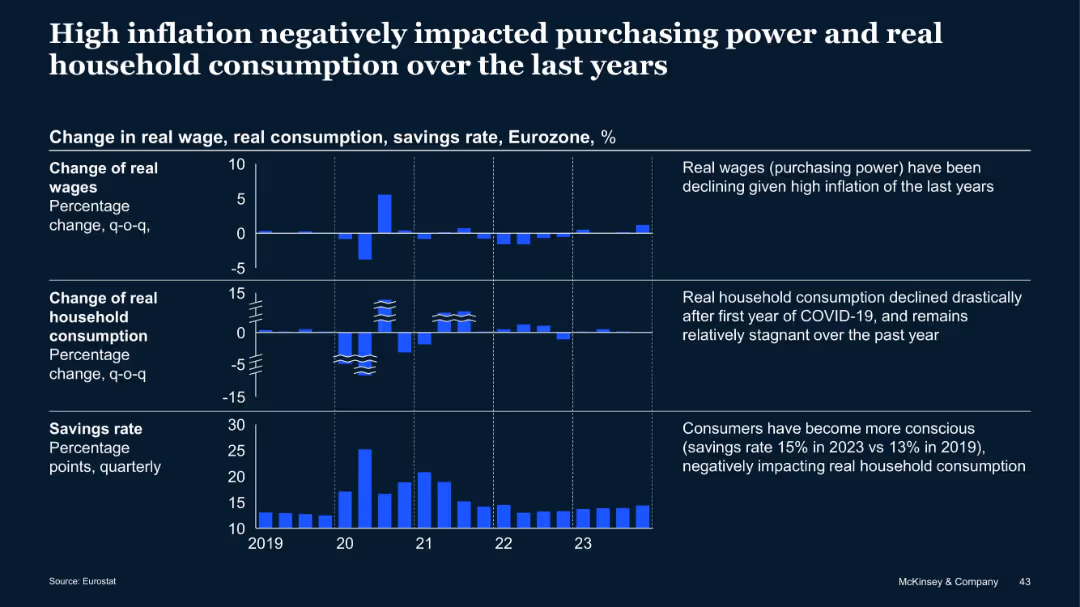
The slide features three charts: a line chart showing annualized CPI growth rates, a column chart depicting real year-over-year wage growth, and a column chart comparing policy interest rates. It uses a consistent blue and white color scheme with clear labels and legends.
Market Analysis and Trends
Financial Services
The slide examines inflation's impact on prices, wages, and monetary policy, highlighting volatile prices, real wage erosion, and global central bank policy tightening as key challenges and opportunities for businesses.
inflation, prices, wages, monetary policy, CPI growth
false
Market Analysis and Trends
Financial Services
Multiple Chart
EY
Add to my slides
Remove from favorites
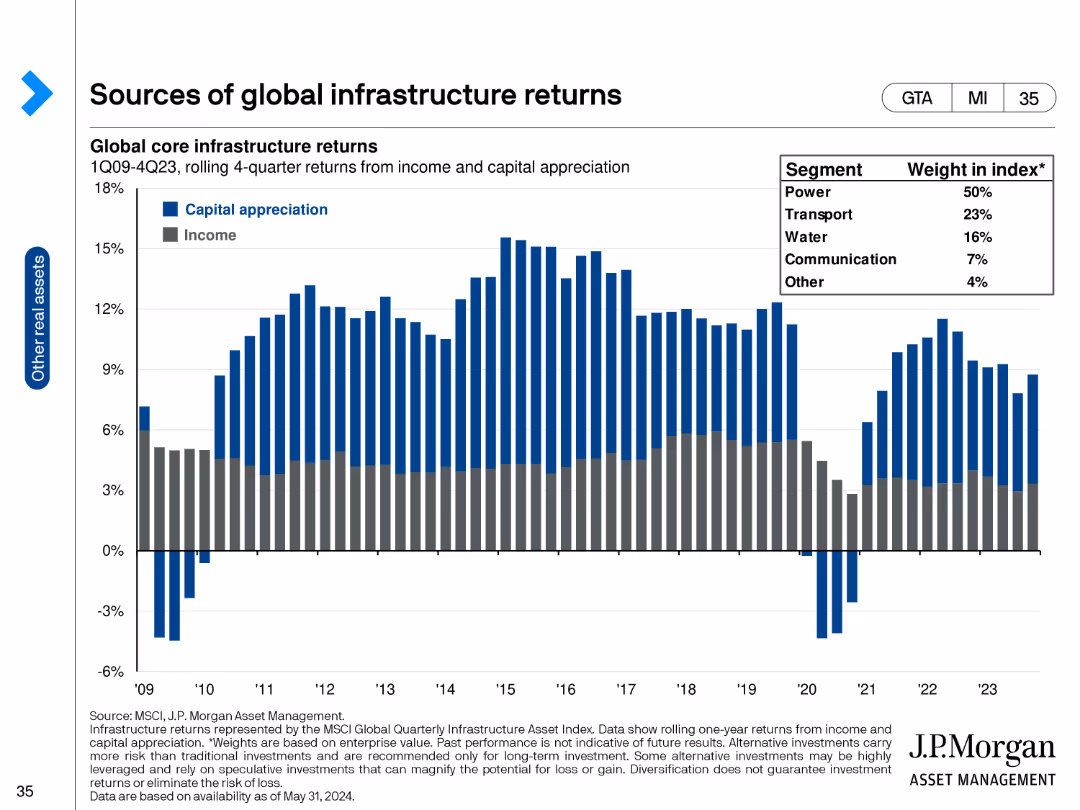
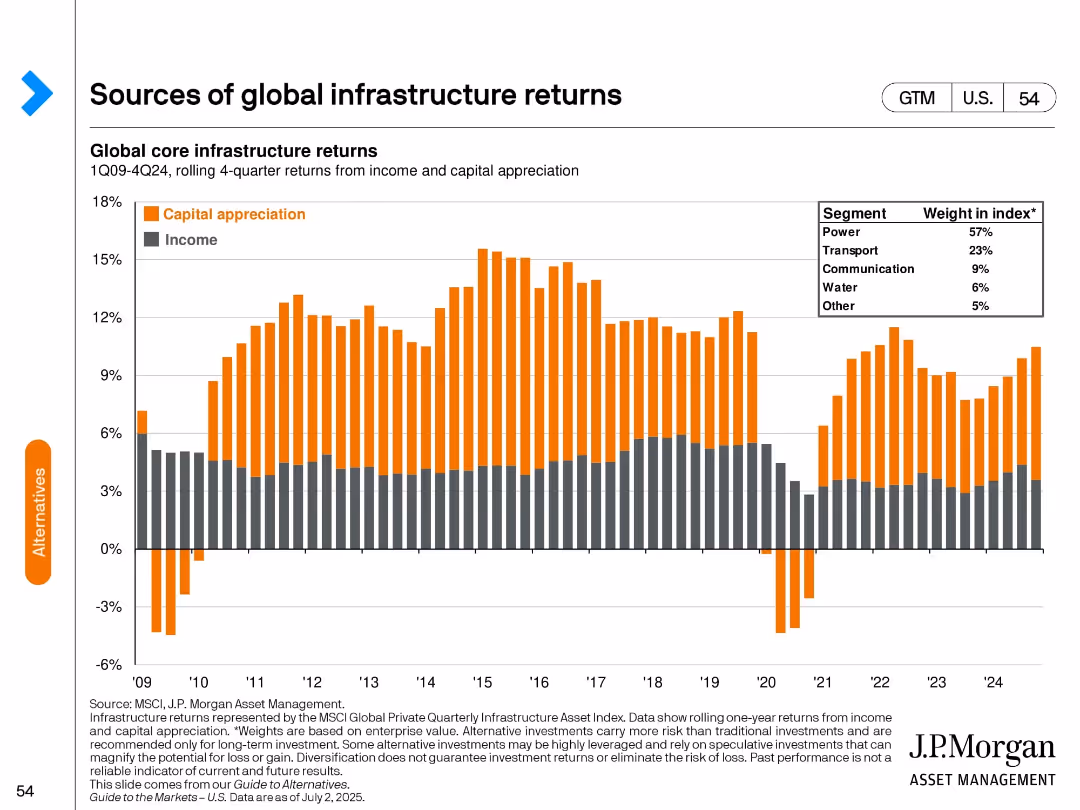
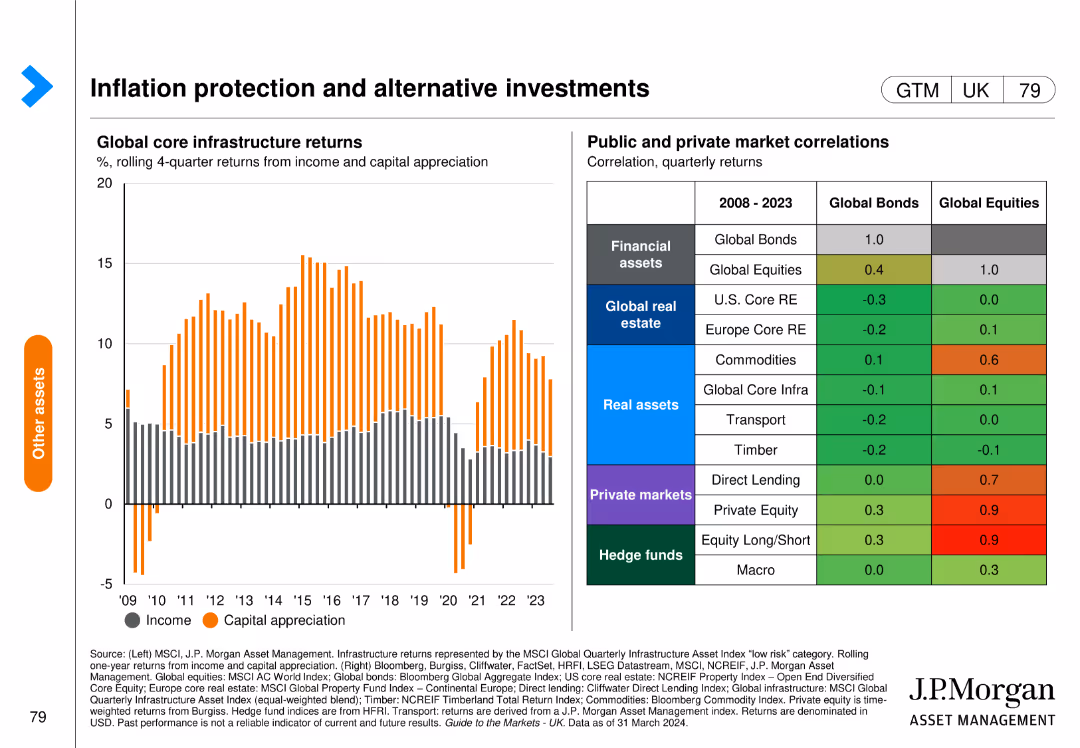
Features a column chart on the left showing global core infrastructure returns from income and capital appreciation, and a table on the right detailing public and private market correlations.
Investment Analysis
Financial Services
This slide highlights the role of alternative investments in inflation protection, analyzing returns from global core infrastructure and examining correlations with public and private markets.
inflation protection, alternative investments, infrastructure returns, market correlations, global
false
Investment Analysis
Financial Services
Mixed Chart
JP Morgan
Add to my slides
Remove from favorites
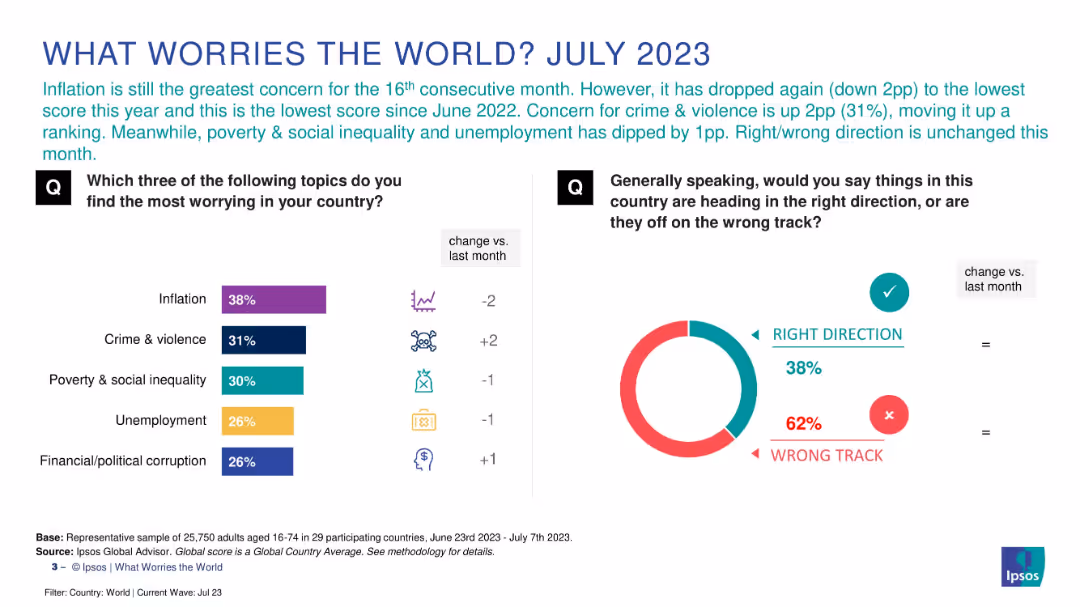
Split slide with left-side bar chart showing top concerns, and right-side donut chart showing global sentiment (right/wrong direction). Color-coded with icons.
Market Analysis and Trends
Professional Services
The slide presents global concerns as of July 2023, led by inflation, crime, and inequality. It also shows that 62% of people believe their country is on the wrong track, revealing widespread pessimism in public outlook.
inflation, public concerns, right direction, wrong track, crime, global sentiment, Ipsos, July 2023
false
Market Analysis and Trends
Professional Services
Multiple Chart
IPSOS
Add to my slides
Remove from favorites
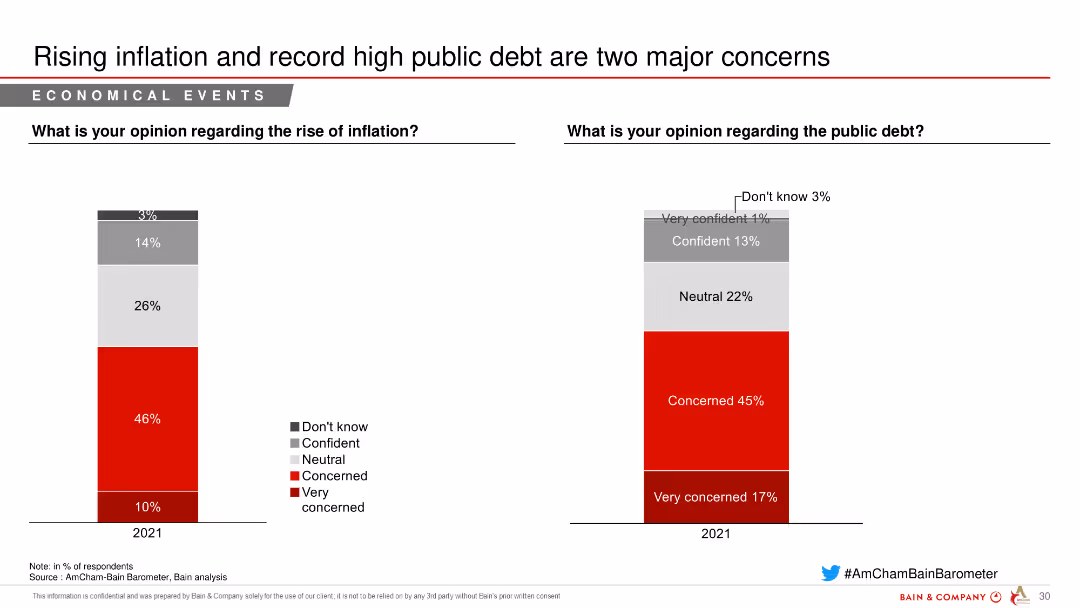
This slide includes column charts showing opinions on inflation and public debt, indicating levels of concern and confidence among respondents.
Risk Assessment and Management
Financial Services
The slide examines concerns about rising inflation and public debt, presenting respondents' opinions on these economic issues and highlighting the levels of concern and confidence.
inflation, public debt, concerns, confidence, economic issues, financial services, risk assessment
false
Risk Assessment and Management
Financial Services
Multiple Chart
Bain
Add to my slides
Remove from favorites
Features line graphs showing inflation trends with detailed textual analysis on the side, using a contrasting color scheme to highlight key data.
Financial Performance
Financial Services
Discusses inflation trends and their implications, likely for use in financial services or market analysis presentations.
inflation rates, developed economies, emerging markets, producer prices, economic analysis, market trends, financial strategy
false
Financial Performance
Financial Services
Mixed Chart
McKinsey
Add to my slides
Remove from favorites
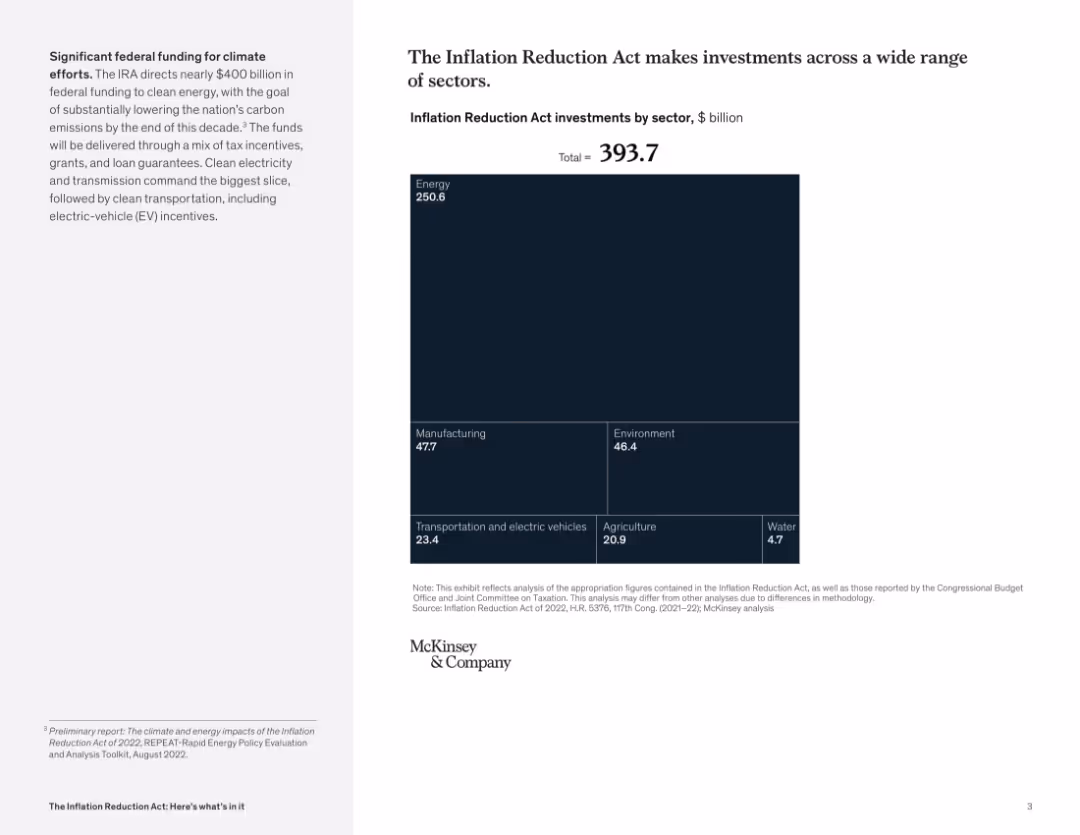
Right-aligned slide with a large square treemap chart showing $393.7B in IRA investments by sector; small text explanation on the left panel. Dark blue color scheme.
Strategic Planning
Government & Public Sector
The slide illustrates the allocation of nearly $400B from the Inflation Reduction Act across multiple sectors, with the majority directed toward energy, manufacturing, environment, and transportation. It visually emphasizes the energy sector as the largest recipient.
Inflation Reduction Act, funding, sectors, energy, manufacturing, environment, EV, investment, climate
false
Strategic Planning
Government & Public Sector
Mixed Chart
McKinsey
Add to my slides
Remove from favorites
The slide has two line charts, one showing core inflation rates and the other displaying shipping costs and global PMI supplier delivery times. The visualizations use different colors to distinguish between the US, Eurozone, and UK data.
Market Analysis and Trends
Financial Services
This slide highlights core inflation trends and their impact on shipping costs and supplier delivery times, providing insights into global inflationary pressures and supply chain challenges.
Inflation, shipping costs, supplier delivery, core inflation, global economy
false
Market Analysis and Trends
Financial Services
Multiple Chart
JP Morgan
Add to my slides
Remove from favorites
The slide features three separate text boxes with icons, titled '1. Revenue growth management', '2. Assortment, innovation and design to value', and '3. Cost-based assessment'. Each section has bullet points below. On the right, there's an overlay of faint graphic elements.
Strategic Planning
Financial Services
Discusses strategic responses to inflation, offering three key strategies for businesses to manage revenue, redefine value propositions, and assess costs. These strategies are presented as practical measures to build resilience and prepare for future economic conditions. The slide provides a concise guide for businesses to proactively address inflation through revenue growth management, value proposition redesign, and cost-based assessments, focusing on areas like procurement, labor force, supply chain reinvention, and building resilience.
Inflation, Strategy, Revenue, Cost, Value, Resilience
false
Strategic Planning
Financial Services
Header Horizontal
Bain
Add to my slides
Remove from favorites
The slide displays a dual-axis line chart of US and Euro area 5yr/5yr inflation swaps from 2005 to 2021. The US is depicted in blue and the Euro area in orange, with both lines fluctuating over time and providing a comparative view of market expectations for inflation.
Investment Analysis
Financial Services
The slide examines market perceptions of inflation through the lens of US and Euro area inflation swaps, suggesting a view of recent increases as mainly transitory. It could be used to inform discussions on investment risk, market sentiment, and long-term economic projections.
Inflation Swaps, Market Sentiment, US, Euro Area, Investment Risk, Economic Projections, Transitory Inflation
false
Investment Analysis
Financial Services
Single Chart
JP Morgan
Add to my slides
Remove from favorites
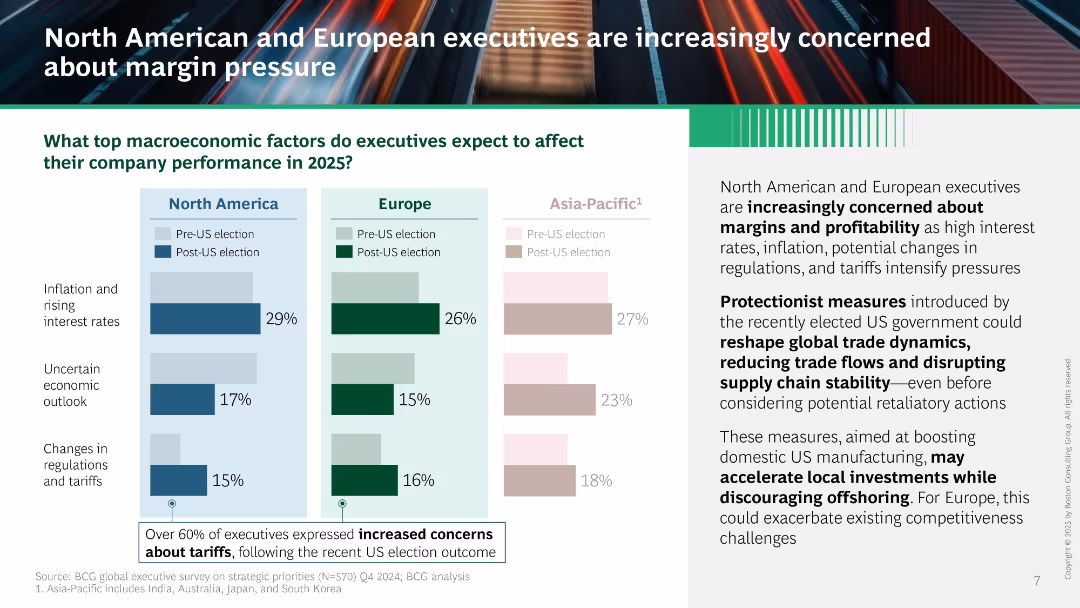
Three-region comparison bar chart with a side panel text explanation. Bars represent executive expectations on inflation, economic uncertainty, and tariffs. Green, blue, and pink tones differentiate regions and election timelines.
Market Analysis and Trends
Professional Services
The slide highlights macroeconomic concerns (inflation, interest rates, economic uncertainty, and regulatory changes) among executives in North America, Europe, and Asia-Pacific. It emphasizes growing margin pressure post-US election, especially due to protectionist policies.
inflation, tariffs, interest rates, US election, trade, margin pressure, executives, economic outlook, regulations
false
Market Analysis and Trends
Professional Services
Mixed Chart
BCG
Add to my slides
Remove from favorites
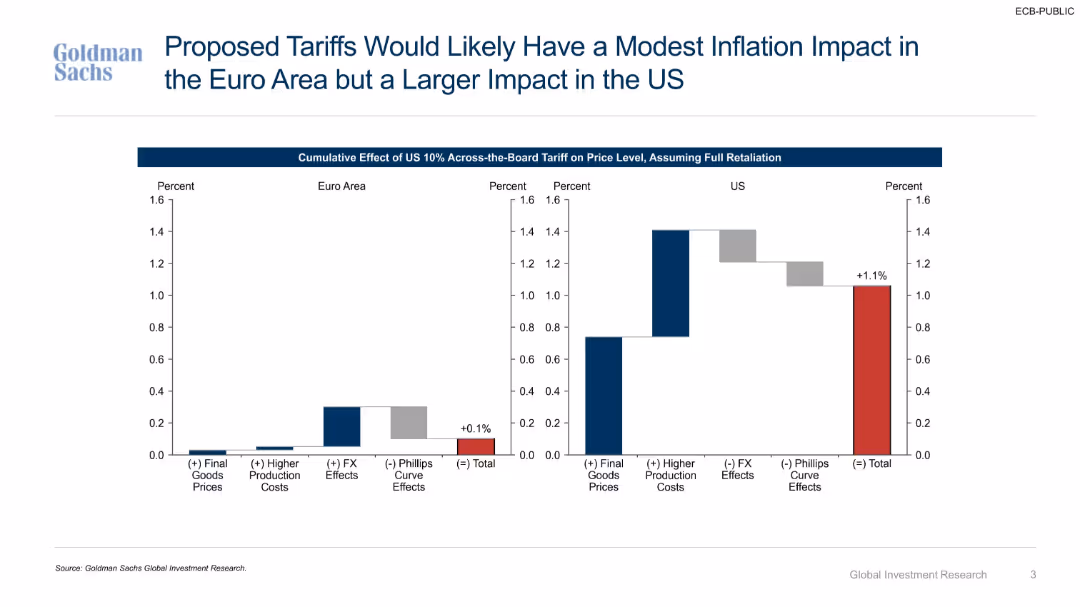
Bar charts comparing inflationary effects of tariffs across economic channels (goods prices, FX, production costs).
Market Analysis and Trends
Government & Public Sector
Evaluates cumulative inflation impacts of a 10% U.S. across-the-board tariff under full retaliation. Projects larger price increases in the U.S. due to higher production costs and weaker FX offsets.
inflation, tariffs, price effects, Euro Area, U.S., retaliation, production costs, final goods, exchange rate
false
Market Analysis and Trends
Government & Public Sector
Multiple Chart
Goldman Sachs
Add to my slides
Remove from favorites
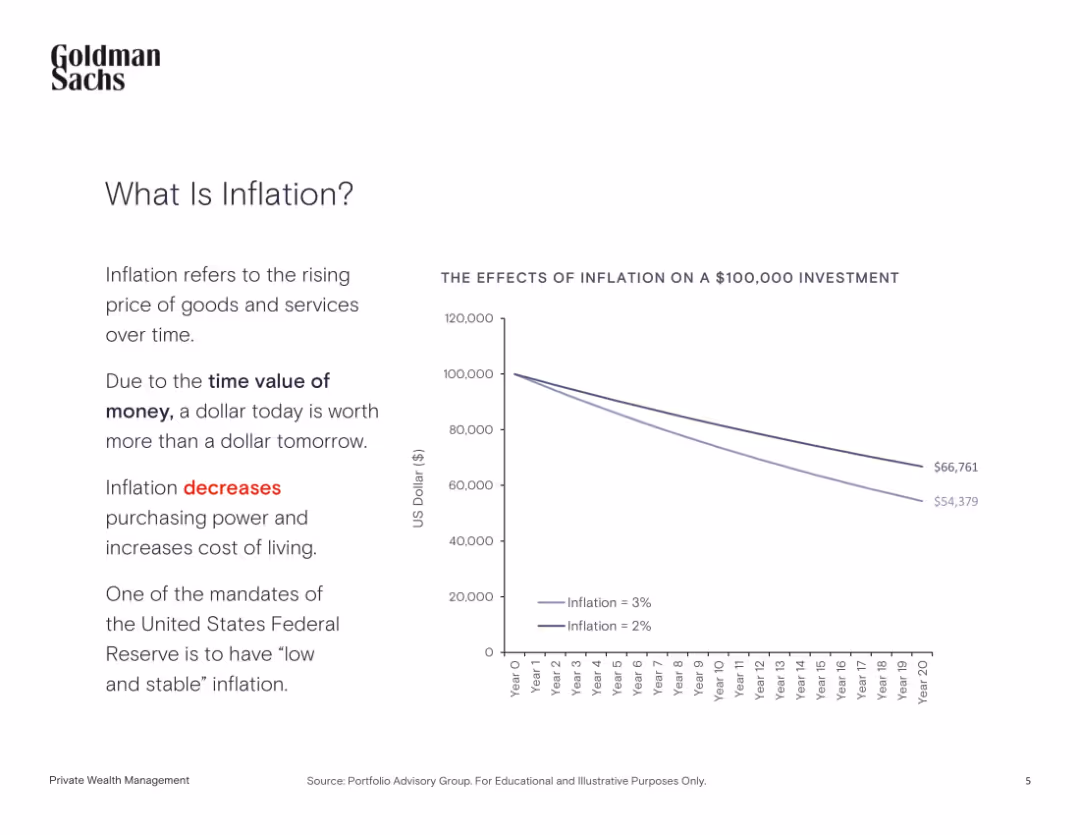
Simple left-text, right-line-chart layout; minimalistic design
Strategic Planning
Financial Services
This educational slide explains inflation, its impact on purchasing power, and how it affects investment value over time, using a chart comparing inflation scenarios.
Inflation, Time Value, Investment, Purchasing Power, Cost of Living
false
Strategic Planning
Financial Services
Mixed Chart
Goldman Sachs
Add to my slides
Remove from favorites
Two-column layout with line charts depicting US Treasury note yields and Goldman Sachs Financial Conditions Index from 2019-2024 and 2006-2024.
Financial Performance
Financial Services
Discusses the impact of inflation data and labor market gains on Treasury yields and expectations of rate cuts.
inflation, Treasury yields, labor market, financial conditions, Goldman Sachs
false
Financial Performance
Financial Services
Multiple Chart
EY
Add to my slides
Remove from favorites
Two column charts showing UK headline inflation breakdown and UK goods and services inflation from Jan '21 to Jan '24 and 1989 to 2024 respectively. Different colors represent core services, core goods, food, alcohol, tobacco, etc.
Market Analysis and Trends
Financial Services
This slide provides a detailed analysis of UK inflation trends, showing the breakdown of headline inflation by various components and comparing goods and services inflation over time. Used for inflation trend analysis and forecasting.
Inflation, UK, headline, goods, services, trends
false
Market Analysis and Trends
Financial Services
Multiple Chart
JP Morgan
Add to my slides
Remove from favorites
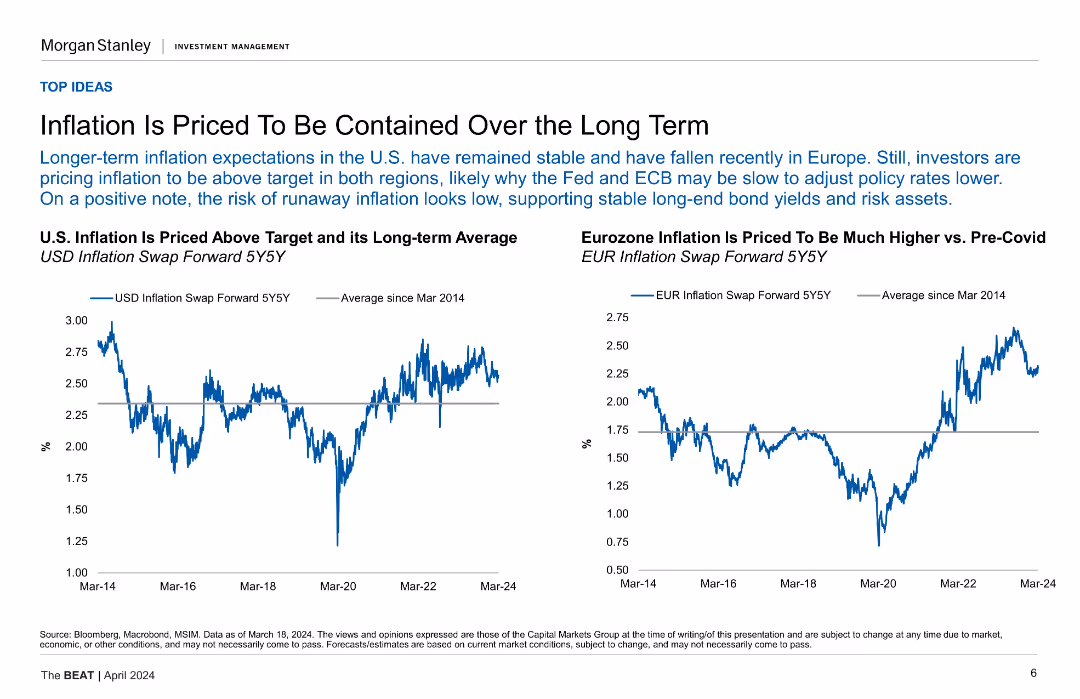
Two line charts comparing U.S. and Eurozone inflation against their long-term averages.
Market Analysis and Trends
Financial Services
This slide analyzes the long-term expectations for inflation in the U.S. and Eurozone, suggesting that inflation will remain stable and above target in both regions.
Inflation, U.S., Eurozone, Long-Term, Comparison, Containment
false
Market Analysis and Trends
Financial Services
Multiple Chart
Morgan Stanley
Add to my slides
Remove from favorites
A column chart on the slide breaks down US headline inflation into components over time. Colored segments represent different inflation contributors with a trend line over the bars.
Financial Performance
Financial Services
This slide's column chart dissects US headline inflation by its various components, likely utilized in financial discussions to address inflationary pressures and their sources. It aids in comprehending the inflation trends and preparing for future fiscal or investment decisions.
Inflation, US, Headline, Components, Finance, Trends, Analysis, 2023
false
Financial Performance
Financial Services
Single Chart
JP Morgan
Add to my slides
Remove from favorites
Three-tiered bar chart showing real wage, consumption, and savings trends in Eurozone from 2019–2023
Market Analysis and Trends
Financial Services
This slide demonstrates the impact of inflation on real wages, household consumption, and savings in the Eurozone. Wages declined, consumption dropped post-COVID, and savings rates increased, indicating cautious consumer behavior.
Inflation, Wages, Consumption, Savings, Eurozone, Consumer Trends
false
Market Analysis and Trends
Financial Services
Mixed Chart
McKinsey
Add to my slides
Remove from favorites
Slide with an area chart showing current and projected influencer marketing budget allocations, with industry breakdown.
Market Analysis and Trends
Professional Services
Analyzes influencer marketing budget trends and projections, important for competitive strategy in consumer goods and media.
influencer marketing, budget, trend, projection, consumer goods, media, strategy, analysis, competitive, allocation
false
Market Analysis and Trends
Professional Services
Mixed Chart
Deloitte
Add to my slides
Remove from favorites
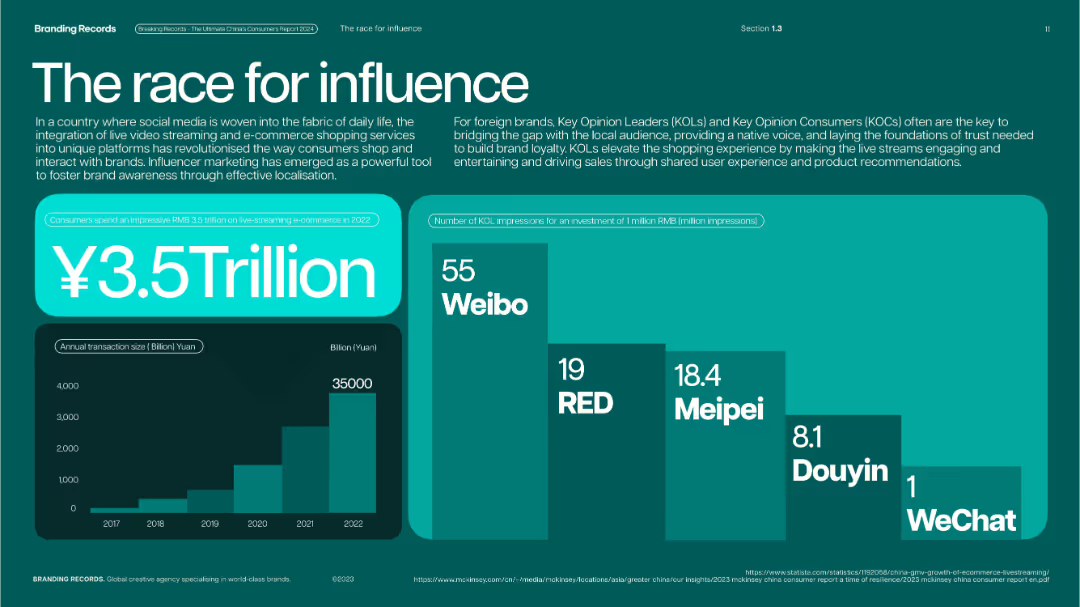
Teal-green layout with bar and stacked charts; large figure in center with visual emphasis.
Strategic Planning
Media & Entertainment
Illustrates the rise of influencer marketing and live-streaming commerce in China, with ¥3.5 trillion spent in 2022. Charts include annual transaction volume growth and KOL impressions by platform.
influencer marketing, KOLs, live-streaming, Weibo, RED, Meipei, Douyin, social commerce
false
Strategic Planning
Media & Entertainment
Multiple Chart
McKinsey
Add to my slides
Remove from favorites
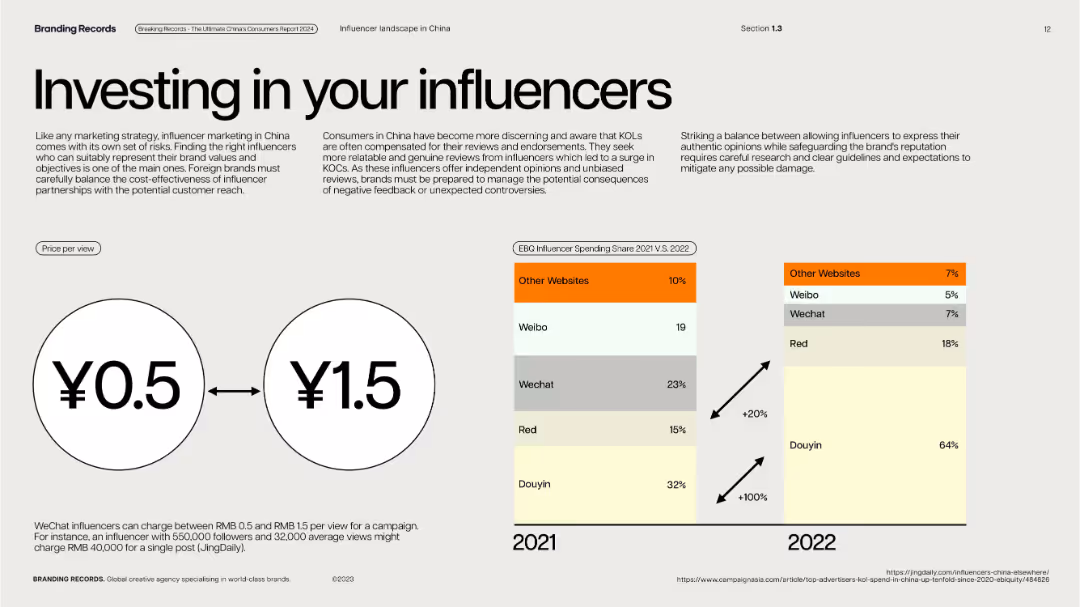
Light beige background with infographic layout; price diagram and side-by-side stacked bar charts.
Risk Assessment and Management
Media & Entertainment
Compares influencer spending share across platforms from 2021 to 2022. Emphasizes influencer pricing (¥0.5–¥1.5/view), risks of endorsements, and rising prominence of platforms like Douyin and RED.
influencer pricing, campaign ROI, WeChat, Douyin, KOC, endorsements, cost strategy
false
Risk Assessment and Management
Media & Entertainment
Mixed Chart
McKinsey
Add to my slides
Remove from favorites
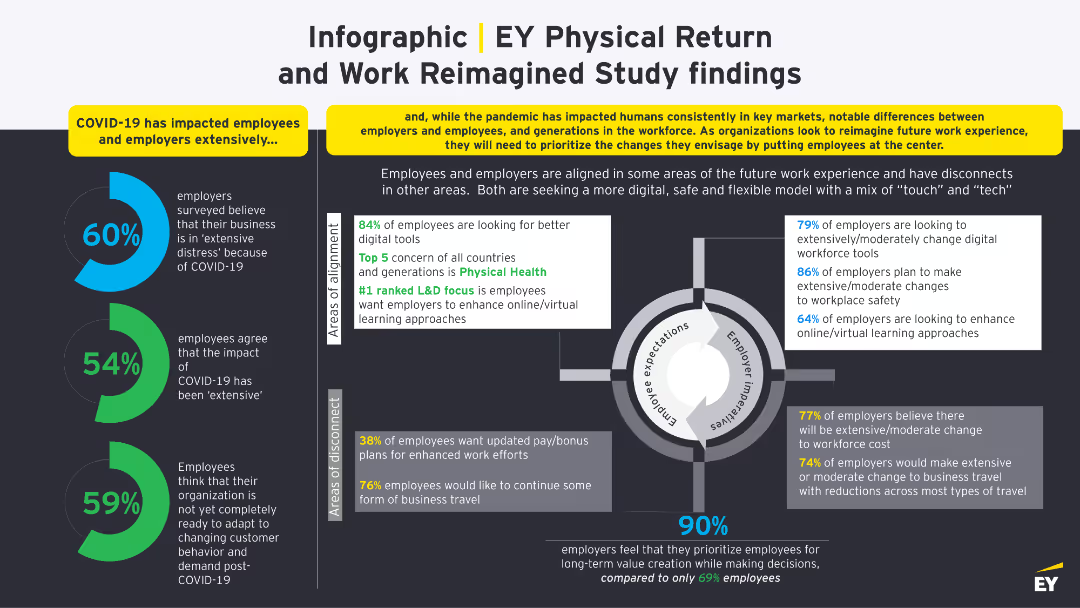
The slide includes various statistics and data points presented in column charts and text boxes, illustrating the impact of COVID-19 on employers and employees.
Market Analysis and Trends
Professional Services
The slide presents findings from a study on the physical return to work, showing statistics on employer and employee sentiments and the alignment/disconnect between their expectations.
infographic, COVID-19, employees, employers, impact
false
Market Analysis and Trends
Professional Services
Mixed Chart
EY
Add to my slides
Remove from favorites
A comprehensive infographic detailing survey results on cyber-attacks, incident response, vulnerability management, and external engagement activities in the UK.
Risk Assessment and Management
Technology & Software
The slide provides an overview of the findings from the 2022 Cyber Security Breaches Survey, focusing on attack types, responses, and management.
infographic, cyber-attacks, survey, incident response, vulnerability, UK
false
Risk Assessment and Management
Technology & Software
Mixed Chart
IPSOS
Add to my slides
Remove from favorites
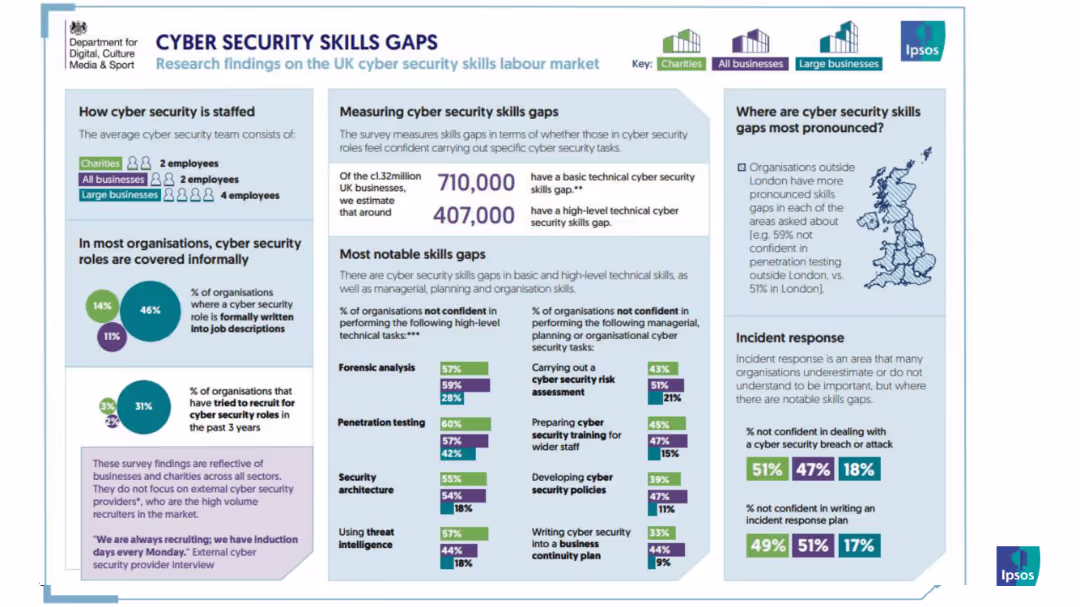
A detailed infographic presenting data on cybersecurity skill gaps, staffing, notable gaps, and confidence levels in various skills among UK organizations.
Human Resources and Talent Management
Technology & Software
The slide explores the gaps in cybersecurity skills within UK organizations, including staff levels and areas of improvement needed.
infographic, cybersecurity, skills gap, UK, staffing, organizations, talent
false
Human Resources and Talent Management
Technology & Software
Multiple Chart
IPSOS
Add to my slides
Remove from favorites
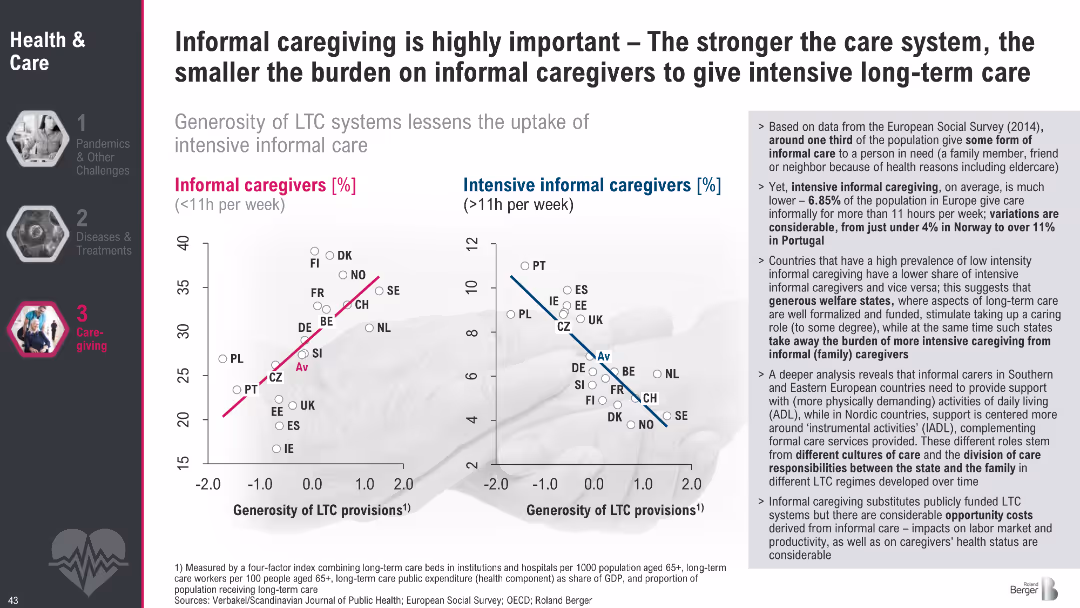
Two scatter plots compare generosity of LTC systems to % of informal vs. intensive caregivers; text box explains data insights and implications.
Strategic Planning
Healthcare & Pharmaceuticals
This slide compares LTC provision generosity to caregiving intensity across countries. It reveals how stronger LTC systems reduce reliance on intensive informal caregiving. Sociocultural factors and national welfare structures are highlighted as key influencers of caregiving dynamics.
informal caregiving, LTC, welfare systems, eldercare, caregiver burden, long-term care, international comparison
false
Strategic Planning
Healthcare & Pharmaceuticals
Multiple Chart
Roland Berger
Add to my slides
Remove from favorites
Slide presents stacked column charts illustrating informal trade sales and store distribution in South Africa.
Industry Overview
Retail & E-commerce
Focuses on the distribution and impact of informal trade in South Africa’s market, showing sales and store percentages.
informal trade, retail, sales distribution, South Africa, FMCG
false
Industry Overview
Retail & E-commerce
Multiple Chart
BCG
Add to my slides
Remove from favorites
The slide includes two vertical bar charts showing where businesses receive information about Greece's attractiveness, along with a donut chart displaying investment intentions.
Market Analysis and Trends
Government & Public Sector
Shows survey results on where businesses get information about Greece and their willingness to invest if certain issues are addressed.
Information sources, investment, Greece, survey results, attractiveness
false
Market Analysis and Trends
Government & Public Sector
Multiple Chart
EY
Add to my slides
Remove from favorites
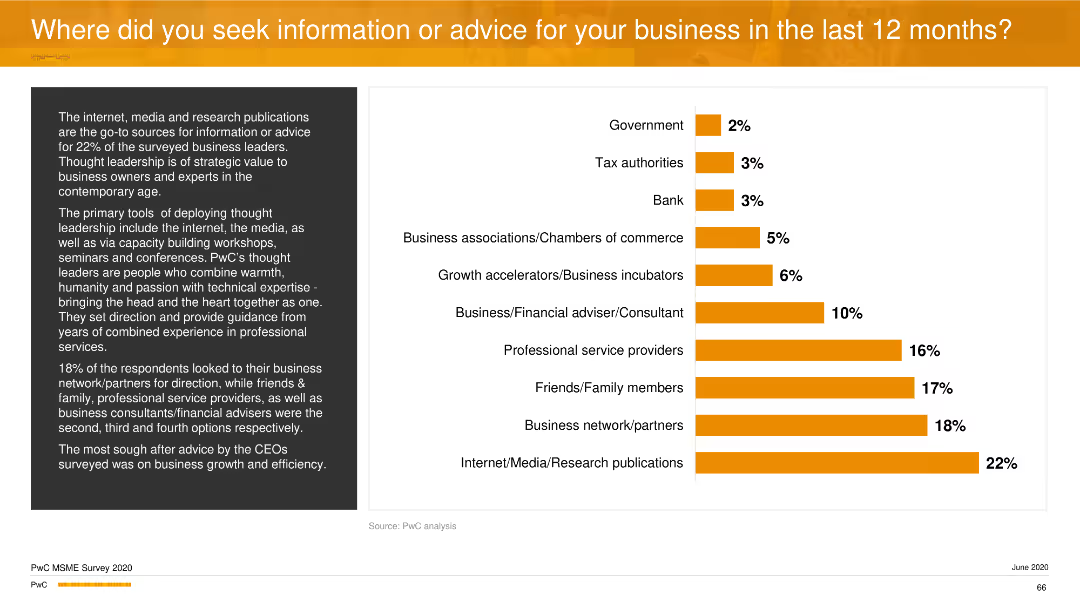
A column chart showing sources of information or advice sought by businesses, with categories like government, tax authorities, banks, and others. Orange bars indicate the percentage for each category.
Strategic Planning
Professional Services
This slide outlines the sources of advice or information that businesses relied on in the past year, with internet/media/research publications being the top sources, followed by business networks and partners.
information sources, strategic planning, advice, professional services, column chart
false
Strategic Planning
Professional Services
Mixed Chart
PwC/Strategy&
Add to my slides
Remove from favorites
The slide presents a process flow diagram showing stages of the information value chain.
Operational Efficiency
Professional Services
The slide explains Ipsos' involvement at all stages of the information value chain, from data collection to insights.
information value chain, data collection, insights, analytics, Ipsos
false
Operational Efficiency
Professional Services
Diagram
IPSOS
Add to my slides
Remove from favorites
Contains a column chart detailing Australian infrastructure work from FY07 to FY25, with actual and projected values. Features clear scenario distinctions and annotations for clarity.
Market Analysis and Trends
Real Estate & Construction
Discusses projections for infrastructure development in Australia, highlighting potential growth scenarios and their drivers, useful for policy making and investment decisions.
infrastructure, Australia, projections, growth scenarios, investment
false
Market Analysis and Trends
Real Estate & Construction
Mixed Chart
Deloitte
Add to my slides
Remove from favorites
This slide is a compilation of tables and icons presenting detailed data on infrastructure projects by sector and agency. It includes budget and project status information.
Market Analysis and Trends
Transportation & Logistics
Analyzes the budgeting and implementation of infrastructure projects across different sectors, highlighting spending and project statuses.
infrastructure, budget, projects, sectors, implementation
false
Market Analysis and Trends
Transportation & Logistics
Table
Deloitte
Add to my slides
Remove from favorites
This slide features a timeline layout with icons and percentage bars. It uses blues and grays to show progress on infrastructure updates and cloud adoption.
Operational Efficiency
Technology & Software
Highlights the ongoing modernization of payment processing platforms and the transition of internal applications to the cloud.
Infrastructure, cloud migration, modernization, processing platforms, timeline, cloud adoption, technology upgrades
false
Operational Efficiency
Technology & Software
Mixed Chart
JP Morgan
Add to my slides
Remove from favorites
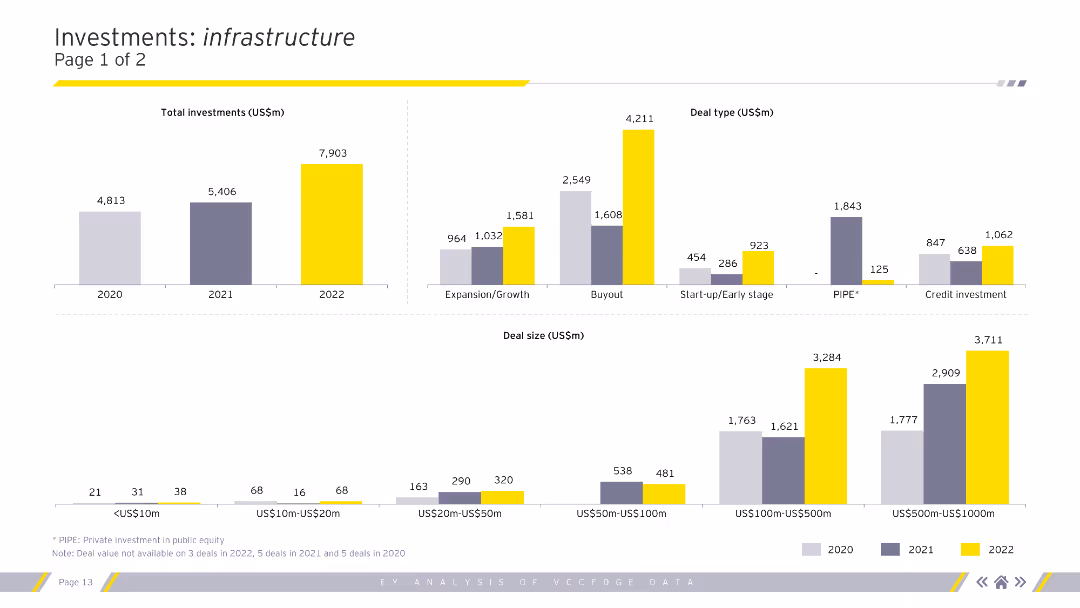
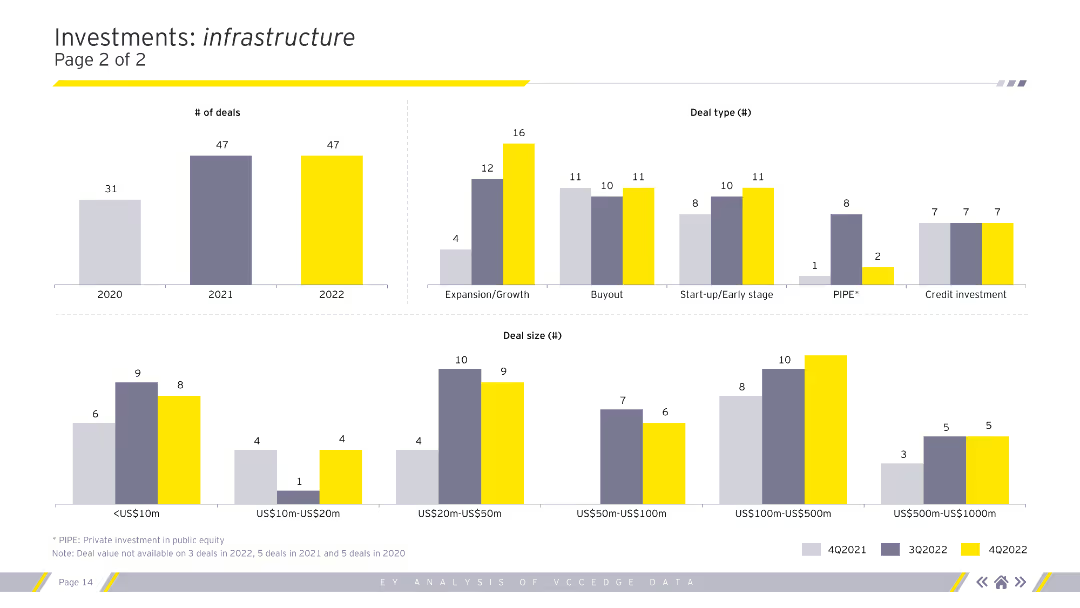
Column charts showing the number of deals, deal types, and deal sizes in the infrastructure sector for 2020-2022.
Market Analysis and Trends
Real Estate & Construction
Continued analysis of investment types, sizes, and segments within the infrastructure sector.
infrastructure, deals, deal types, deal sizes, analysis
false
Market Analysis and Trends
Real Estate & Construction
Multiple Chart
EY
Add to my slides
Remove from favorites
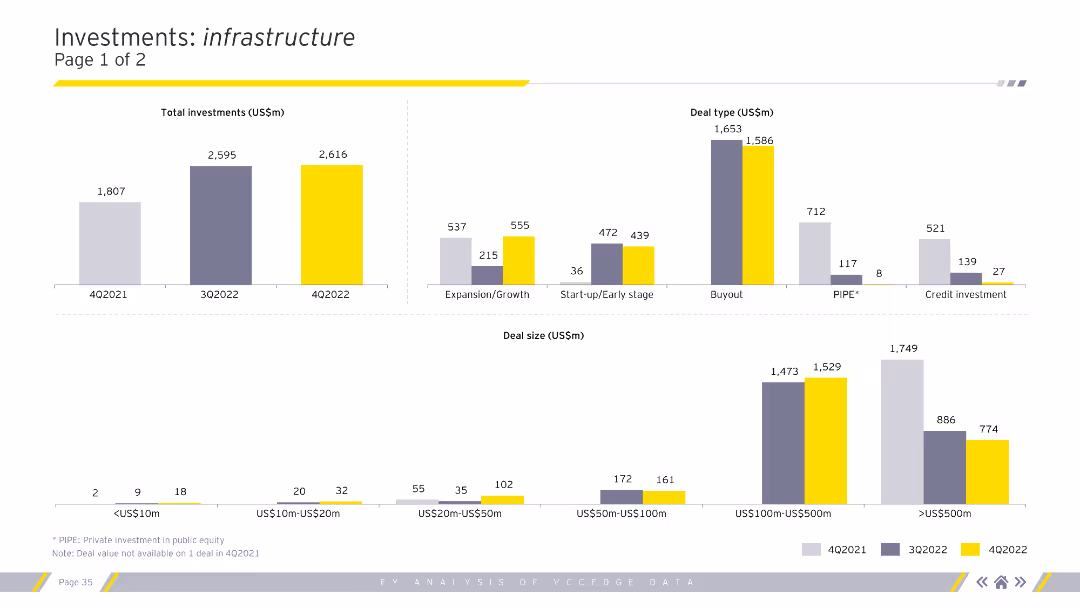
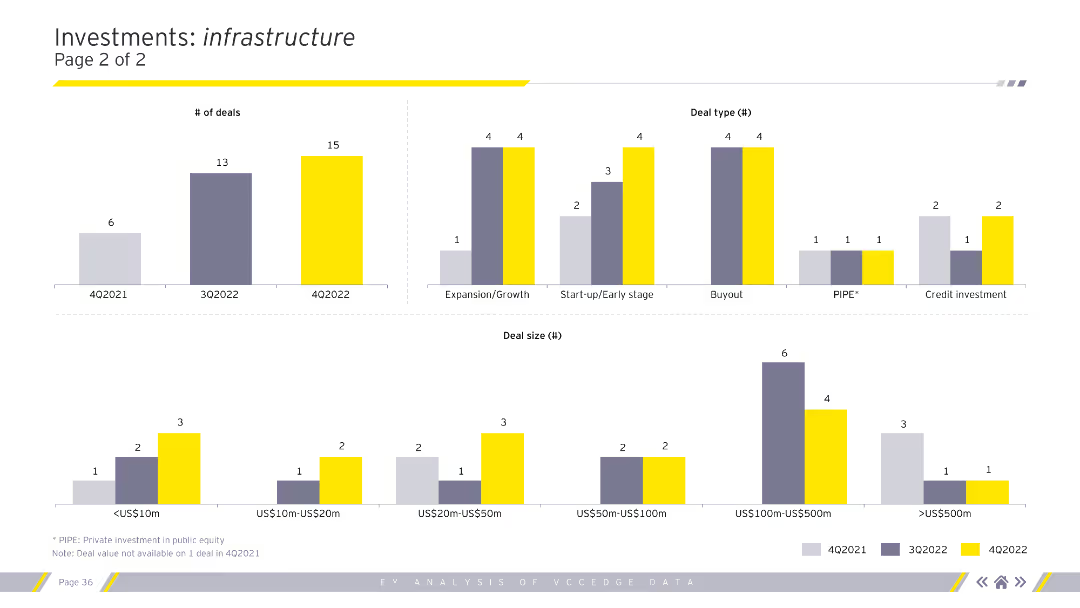
The slide includes column charts illustrating the number of deals, deal types, and deal sizes within the infrastructure sector across various quarters. Each chart is color-coded by quarter.
Market Analysis and Trends
Financial Services
This slide continues the infrastructure investment analysis, highlighting the number of deals and their types and sizes, enhancing the understanding of quarterly investment patterns in infrastructure.
Infrastructure deals, number of deals, deal types
false
Market Analysis and Trends
Financial Services
Multiple Chart
EY
Add to my slides
Remove from favorites
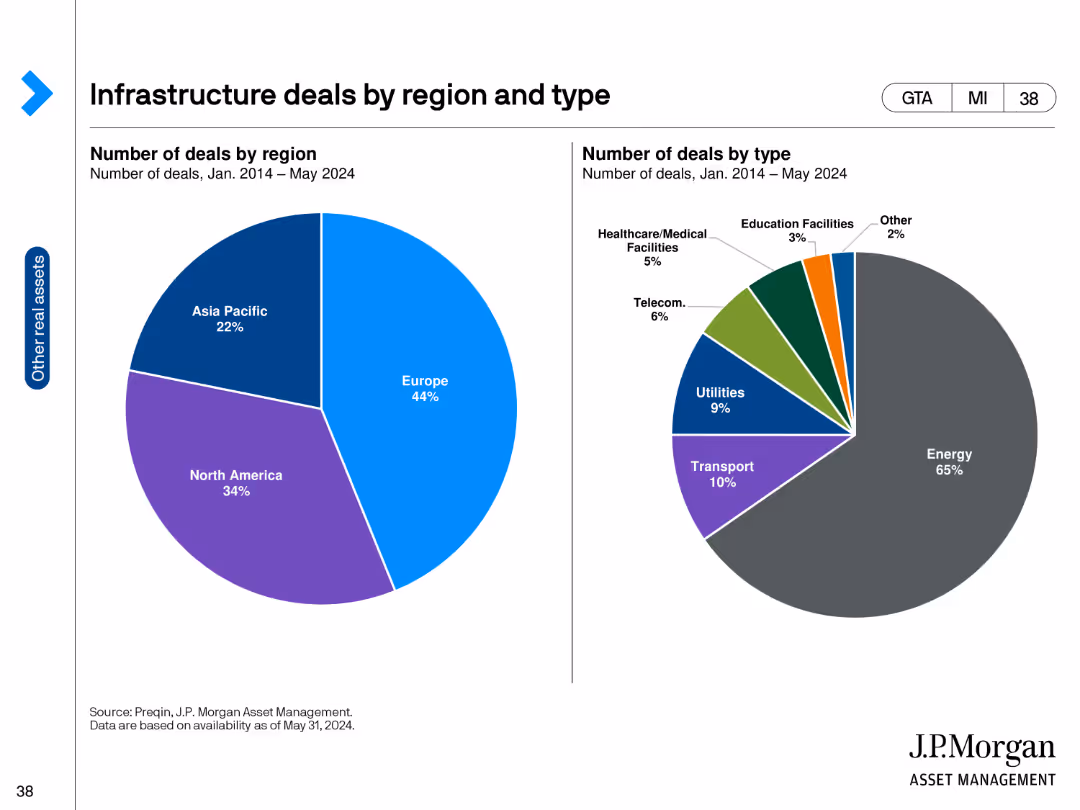
The slide contains two pie charts. The left chart shows infrastructure deals by region, and the right chart shows deals by type from Jan 2014 to May 2024.
Market Analysis and Trends
Real Estate & Construction
It categorizes infrastructure deals by region and type, illustrating the distribution of investments across different sectors and regions.
infrastructure, deals, region, type, market analysis, investments, sectors, North America, Europe, Asia Pacific
false
Market Analysis and Trends
Real Estate & Construction
Multiple Chart
JP Morgan
Add to my slides
Remove from favorites
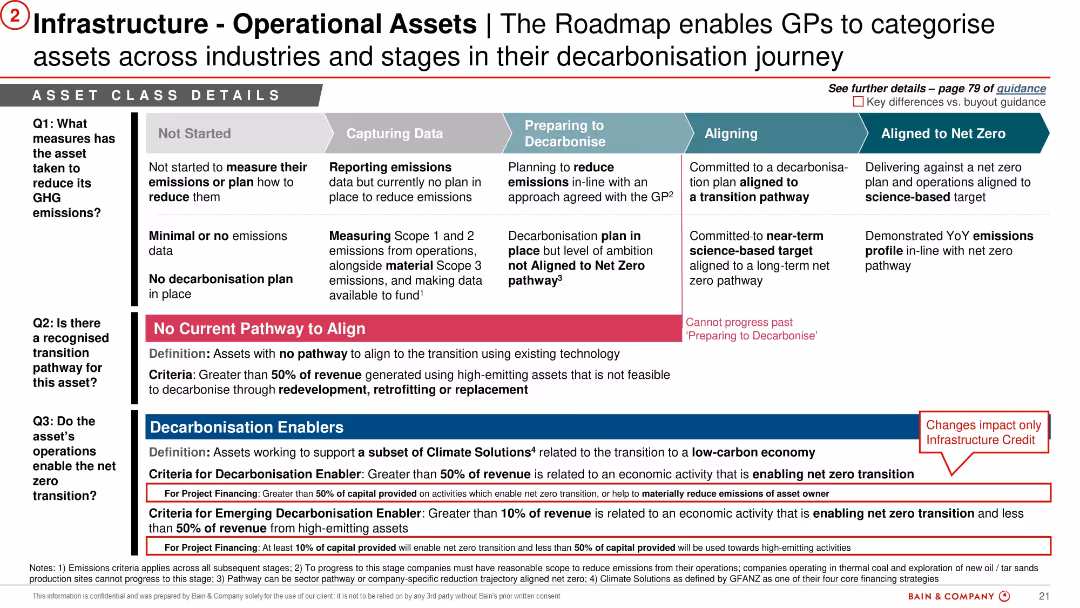
Complex matrix-style slide with color-coded rows and columns. Three main questions structure the content with row-wise answers. Special colored callouts for "No Current Pathway" and "Decarbonisation Enablers".
Strategic Planning
Energy & Utilities
Categorizes infrastructure assets based on their emissions measures, potential for transition, and alignment feasibility. Includes definitions for assets with no alignment pathway and introduces Decarbonisation Enablers for infrastructure credit. Serves as a guidance framework for asset classification.
infrastructure, emissions, GHG, decarbonisation, roadmap, net zero, operational assets, transition
false
Strategic Planning
Energy & Utilities
Linear Flow
Bain
Add to my slides
Remove from favorites
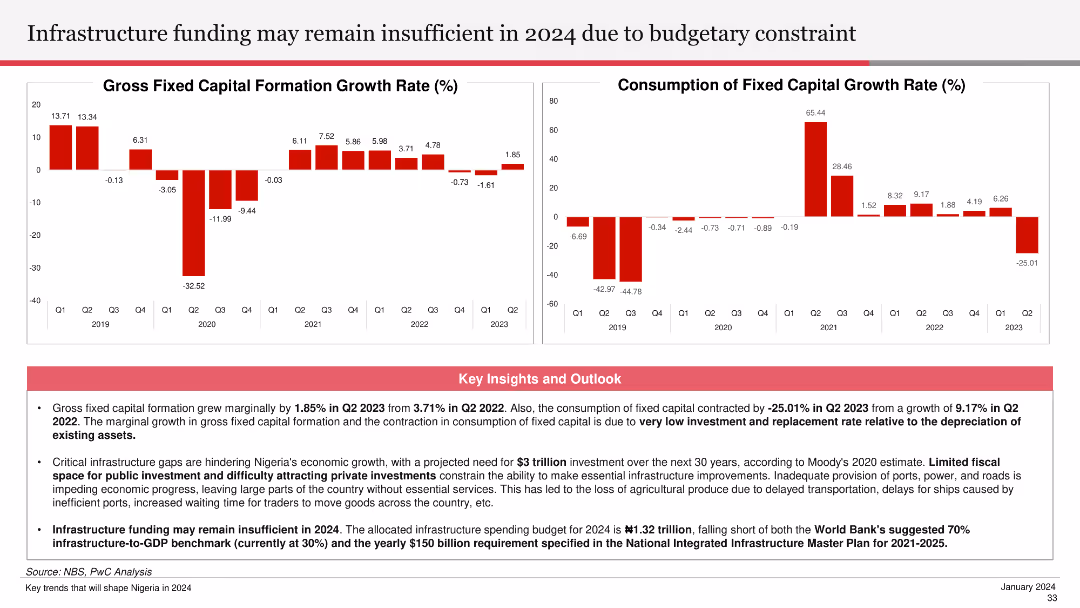
The slide features column charts showing gross fixed capital formation growth rate and consumption of fixed capital growth rate from Q1 2019 to Q2 2023. Key insights and outlooks below the charts discuss the challenges in infrastructure funding.
Financial Performance
Financial Services
The slide discusses the projected insufficiency in infrastructure funding for 2024, analyzing trends in capital formation and consumption of fixed capital. It highlights the need for increased public and private investment to address infrastructure gaps.
infrastructure funding, budget constraint, capital formation, fixed capital, investment
false
Financial Performance
Financial Services
Multiple Chart
PwC/Strategy&
Add to my slides
Remove from favorites
The slide contains two column charts side by side. The left chart displays the length of the road network in kilometers for China and India for the years 2013 and 2022, distinguishing between total roads and freeways. The right chart shows the volume of goods moved through ports in TEU from 2013 to 2022 for both countries.
Market Analysis and Trends
Transportation & Logistics
This slide compares the infrastructure growth in China and India, focusing on road networks and port throughput. It highlights the increase in both total road length and freeway length as well as the volume of goods moved through ports over the years.
infrastructure, growth, China, India, road network, ports, throughput, column chart, transportation, logistics
false
Market Analysis and Trends
Transportation & Logistics
Multiple Chart
JP Morgan
Add to my slides
Remove from favorites
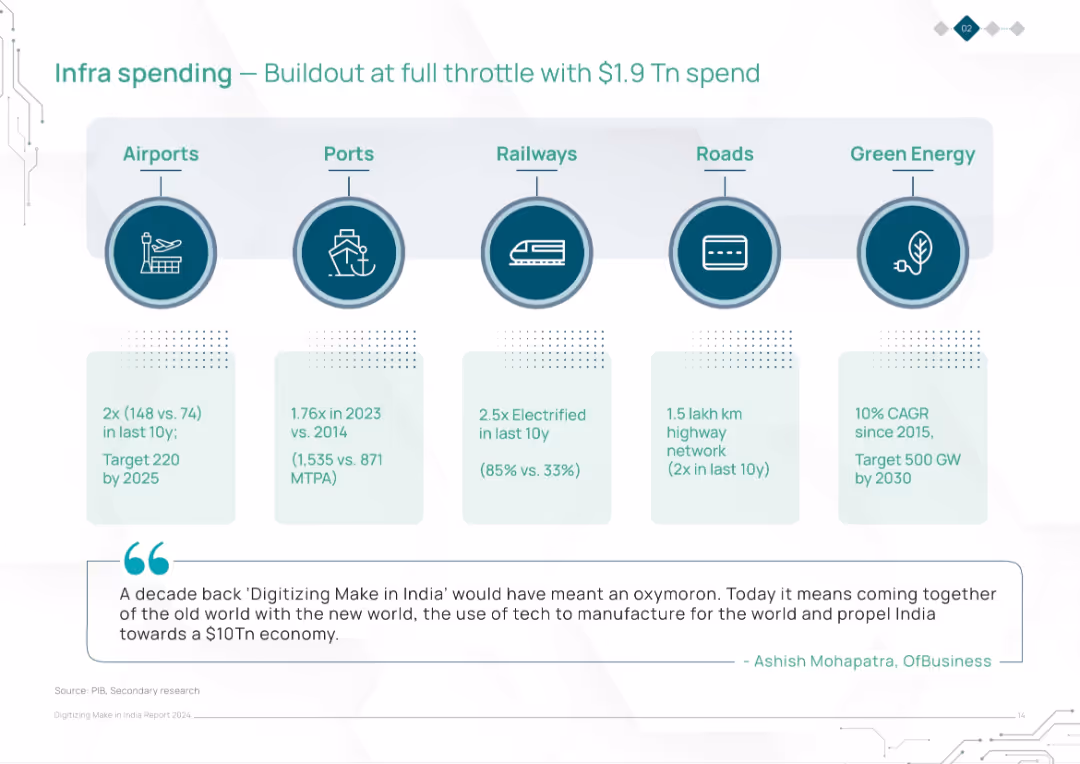
Horizontal layout with five infrastructure categories (Airports, Ports, Railways, Roads, Green Energy) shown with icons and corresponding statistics beneath. Includes a quote at the bottom.
Strategic Planning
Government & Public Sector
The slide highlights India’s significant infrastructure investments totaling $1.9 trillion across key sectors like airports, ports, railways, roads, and green energy, citing impressive growth figures and future targets. It underscores the synergy between technology and infrastructure for economic transformation.
infrastructure, investment, airports, ports, railways, roads, green energy, India, economic growth, development
false
Strategic Planning
Government & Public Sector
Pillar
BCG
Add to my slides
Remove from favorites
Visuals include bar charts detailing investments in built environment and solar/wind energy with corresponding icons and project examples.
Investment Analysis
Environmental Services & Sustainability
Analyzes infrastructure fund investments, emphasizing built environment and renewable energy sectors.
infrastructure, investment, built environment, renewable energy
false
Investment Analysis
Environmental Services & Sustainability
Mixed Chart
Bain
Add to my slides
Remove from favorites
The slide includes two column charts. The left chart shows average annual global infrastructure need by type, and the right chart displays regional investment needs.
Investment Analysis
Real Estate & Construction
It assesses global infrastructure investment needs by type and region from 2016-2040, highlighting major investment areas like roads and rail.
infrastructure, investment, global, needs, roads, rail, telecom, ports, airports, power
false
Investment Analysis
Real Estate & Construction
Multiple Chart
JP Morgan
Add to my slides
Remove from favorites
The slide presents two column charts comparing reasons to invest in the Italian infrastructure sector and constraints faced. Key reasons include filling the infrastructure gap, while constraints involve political and regulatory uncertainty.
Market Analysis and Trends
Real Estate & Construction
This slide compares the benefits and challenges of investing in the Italian infrastructure sector, identifying key reasons like infrastructure needs and constraints such as political and regulatory challenges.
Infrastructure, investment, Italy, pros and cons, regulatory constraints
false
Market Analysis and Trends
Real Estate & Construction
Multiple Chart
EY
Add to my slides
Remove from favorites
The slide includes column charts rating investment performance, opportunities for improvement, and external risks. It shows investor sentiment on organic growth and consolidation, along with risks like economic slowdown and regulatory uncertainty.
Performance Metrics and KPIs
Real Estate & Construction
This slide reviews the performance of Italian infrastructure investments, highlighting opportunities for improvement and identifying significant external risks such as economic slowdown and regulatory uncertainty.
Infrastructure, investment, performance, Italy, risks
false
Performance Metrics and KPIs
Real Estate & Construction
Multiple Chart
EY
Add to my slides
Remove from favorites
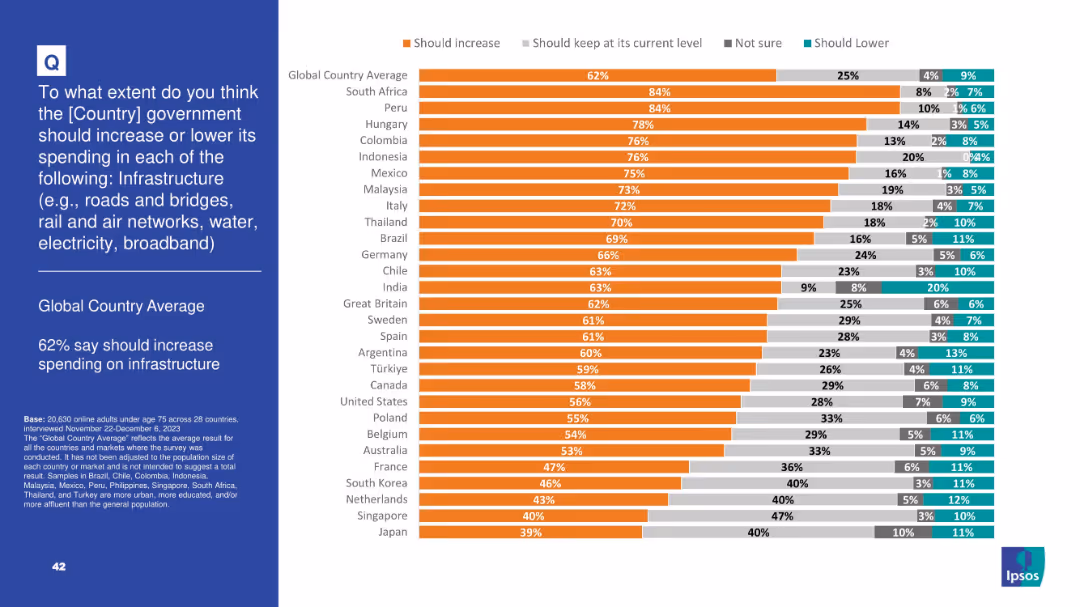
Orange-heavy bar chart indicating public support for increasing infrastructure spending; response categories include keep same, not sure, lower
Strategic Planning
Government & Public Sector
A clear global majority (62%) supports increasing infrastructure spending. South Africa, Peru, and Hungary show highest support. The slide suggests strong public backing for investment in roads, bridges, transport, and broadband.
infrastructure, investment, public services, government spending, broadband, roads, development, Ipsos, public support
false
Strategic Planning
Government & Public Sector
Mixed Chart
IPSOS
Add to my slides
Remove from favorites
Orange-heavy stacked bar chart showing support for increased government infrastructure spending by country.
Strategic Planning
Government & Public Sector
The slide visualizes strong global support (62% average) for increasing infrastructure spending. A ranked list shows where support is highest, with smaller segments for neutral, unsure, or oppositional views.
infrastructure investment, public works, economic growth, government spending, Ipsos survey, 2023 opinion, public support
false
Strategic Planning
Government & Public Sector
Mixed Chart
IPSOS
Add to my slides
Remove from favorites
A line chart showing gross fixed capital formation as a percentage of GDP, and a bar chart showing infrastructure investment needs in USD trillions by region.
Market Analysis and Trends
Financial Services
The slide examines gross fixed capital formation trends over time and outlines the infrastructure investment needs for various regions from 2016 to 2040.
infrastructure investments, capital formation, GDP, investment needs, regions, financial analysis, economic trends, development, financial insights, infrastructure
false
Market Analysis and Trends
Financial Services
Multiple Chart
JP Morgan
Add to my slides
Remove from favorites
The slide contains column charts showing total investments, deal types, and deal sizes specifically for the infrastructure sector across different quarters. Charts are color-coded for clarity.
Market Analysis and Trends
Financial Services
This slide focuses on infrastructure investments, detailing the total amount invested, types of deals, and sizes, providing a comprehensive view of investment trends in this sector.
Infrastructure, investments, deal types, deal sizes
false
Market Analysis and Trends
Financial Services
Multiple Chart
EY
Add to my slides
Remove from favorites
Column charts showing total investments, deal types, and deal sizes in the infrastructure sector for 2020-2022.
Market Analysis and Trends
Real Estate & Construction
Analysis of investment types, sizes, and segments within the infrastructure sector.
infrastructure, investments, deal types, deal sizes, analysis
false
Market Analysis and Trends
Real Estate & Construction
Multiple Chart
EY
Add to my slides
Remove from favorites
This slide features multiple images, icons, and a pie chart. It visually represents different sectors like energy, technology, and real estate through icons. The design is clear and informative with a focus on significant achievements.
Investment Analysis
Financial Services
Highlights financial contributions and key achievements of Macquarie Capital. It serves as an investment summary and a strategic overview of the company’s performance across various sectors, emphasizing their leading position in global infrastructure and energy financing.
Infrastructure, Investments, Energy, Real Estate, Financial Advising
false
Investment Analysis
Financial Services
Mixed Chart
Goldman Sachs
Add to my slides
Remove from favorites
The slide displays multiple graphs: column charts showing expected investment areas and deal completions, and pie charts for planned divestments and competition expectations. It highlights key sectors like energy and transportation for future investments.
Market Analysis and Trends
Real Estate & Construction
This slide forecasts the outlook for the Italian infrastructure sector, including areas of expected investment, anticipated deal completions, and competition trends, focusing on energy and transportation as key investment sectors.
Infrastructure, Italy, investment outlook, energy, transportation
false
Market Analysis and Trends
Real Estate & Construction
Multiple Chart
EY
Add to my slides
Remove from favorites
The slide features a pie chart showing investment in the Italian infrastructure sector and a column chart displaying the average investment ticket size. Another column chart indicates the sectors with the highest investment.
Market Analysis and Trends
Real Estate & Construction
This slide analyzes the investment attractiveness of the Italian infrastructure sector, showing the distribution of investments and highlighting key sectors and average investment sizes. It indicates a strong investment interest in energy and transportation.
Infrastructure, Italy, investment, sector analysis, energy
false
Market Analysis and Trends
Real Estate & Construction
Multiple Chart
EY
Add to my slides
Remove from favorites
This slide utilizes a timeline layout detailing milestones from today through 2040 in the context of hydrogen production, applications, exports, and job creation, overlaid with icons.
Operational Efficiency
Energy & Utilities
Discusses the timeline for developing hydrogen infrastructure and related job creation in Chile, highlighting key actions from preparation through scaling up and expansion.
infrastructure, jobs, hydrogen, timeline
false
Operational Efficiency
Energy & Utilities
Single Chart
McKinsey
Add to my slides
Remove from favorites
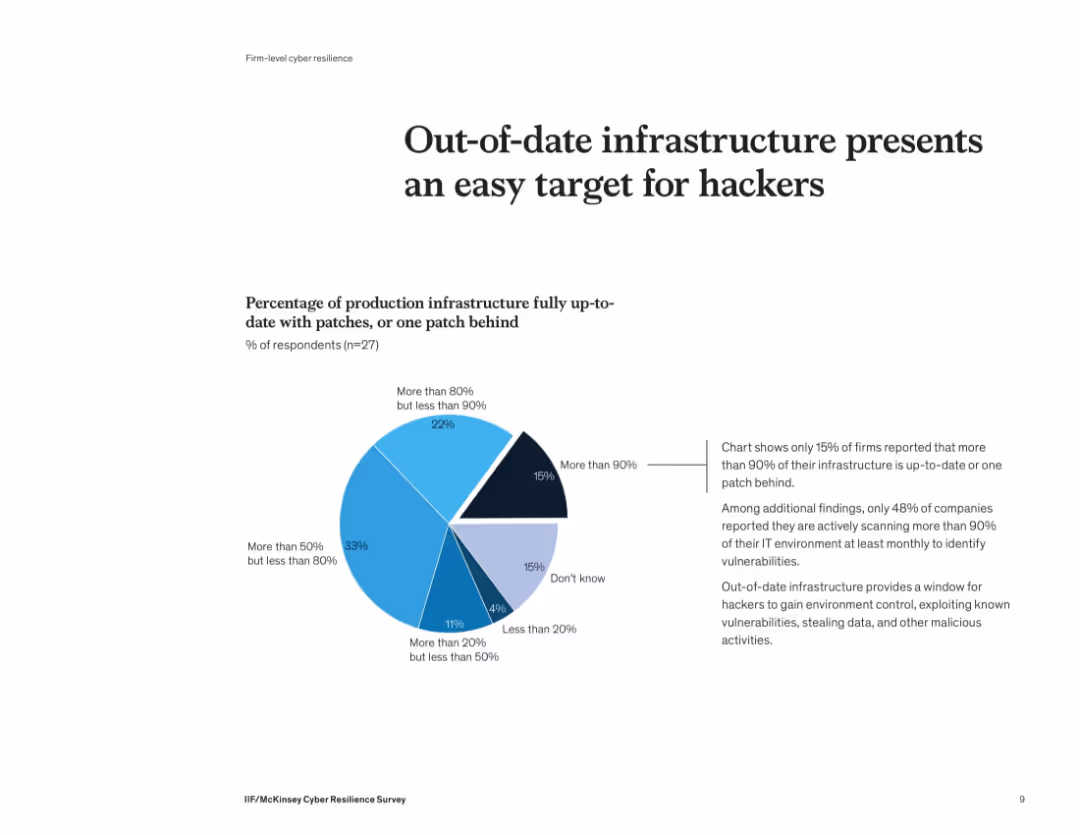
Donut-style pie chart illustrating how updated company infrastructure is. A short paragraph to the right offers insights into the security risks of outdated systems.
Risk Assessment and Management
Financial Services
The slide emphasizes that only 15% of firms keep more than 90% of their infrastructure fully patched. Many fail to scan their systems regularly, leaving vulnerabilities open to exploitation by hackers. Outdated IT infrastructure remains a major cybersecurity risk.
infrastructure, patching, cybersecurity, vulnerabilities, hackers, risk, outdated systems
false
Risk Assessment and Management
Financial Services
Mixed Chart
McKinsey
Add to my slides
Remove from favorites
This slide contains text and multiple icons with a central photo of a surveyor. It highlights infrastructure projects in the Philippines under the "Build, Build, Build" program.
Market Analysis and Trends
Real Estate & Construction
Discusses the Philippines' infrastructure development, including major projects like the Metro Manila Subway and improvements across various regions.
infrastructure, Philippines, development, projects, construction
false
Market Analysis and Trends
Real Estate & Construction
Graphic
Deloitte
Add to my slides
Remove from favorites
No charts; detailed text and images discussing port performance and logistics.
Market Analysis and Trends
Transportation & Logistics
Explores how improvements in infrastructure and port management in South Africa can enhance productivity and attract private investment.
Infrastructure, Ports, Logistics, Private Investment, Productivity
false
Market Analysis and Trends
Transportation & Logistics
Mixed Chart
PwC/Strategy&
Add to my slides
Remove from favorites
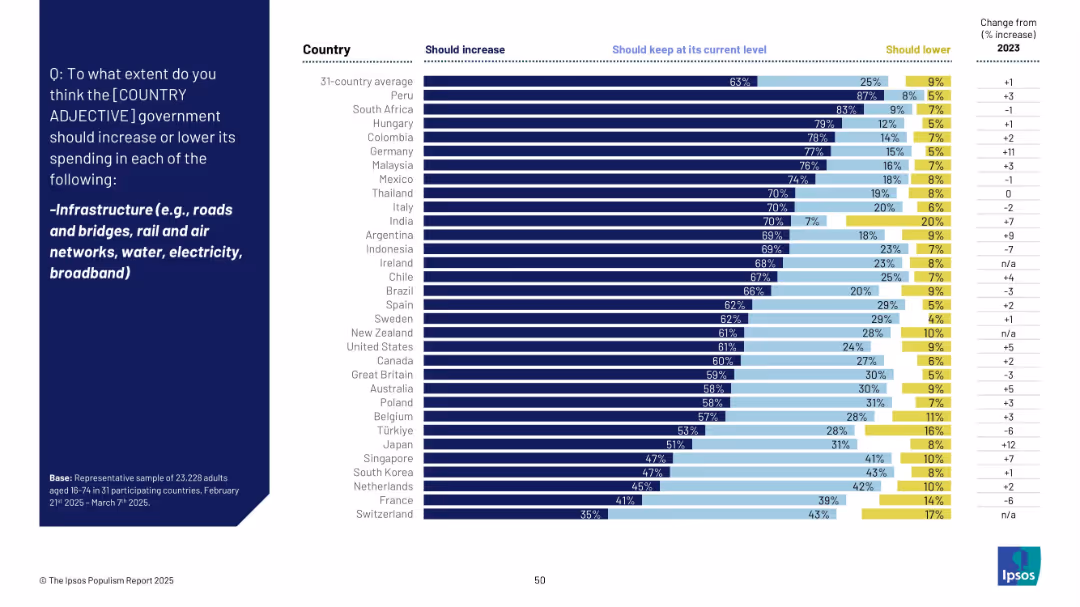
Bar chart displaying three responses: "Should increase", "Should keep at current level", and "Should lower", alongside change from previous year.
Strategic Planning
Government & Public Sector
The slide surveys public opinion on whether governments should increase infrastructure spending. A clear majority globally support increased investment (63% avg), with especially high support in Peru and South Africa. A few countries (e.g., Switzerland) show less enthusiasm for increases.
infrastructure, public investment, roads, broadband, electricity, planning, government, survey
false
Strategic Planning
Government & Public Sector
Mixed Chart
IPSOS
Add to my slides
Remove from favorites
The slide has a column chart showing global core infrastructure returns split between capital appreciation and income from 1Q09 to 4Q23.
Financial Performance
Real Estate & Construction
It provides data on infrastructure returns, segmented by capital appreciation and income, highlighting sector contributions to index weight.
infrastructure, returns, capital appreciation, income, index weight, power, transport, water
false
Financial Performance
Real Estate & Construction
Single Chart
JP Morgan
Add to my slides
Remove from favorites
Stacked bar chart showing rolling 4-quarter returns since 2009, split by income and capital appreciation.
Performance Metrics and KPIs
Energy & Utilities
Tracks the performance of global infrastructure assets by separating return drivers into income and capital appreciation. It also provides segment weightings (e.g., power, transport) to contextualize return sources.
infrastructure returns, income, capital appreciation, utilities, segment weighting, historical returns
false
Performance Metrics and KPIs
Energy & Utilities
Single Chart
JP Morgan
Add to my slides
Remove from favorites
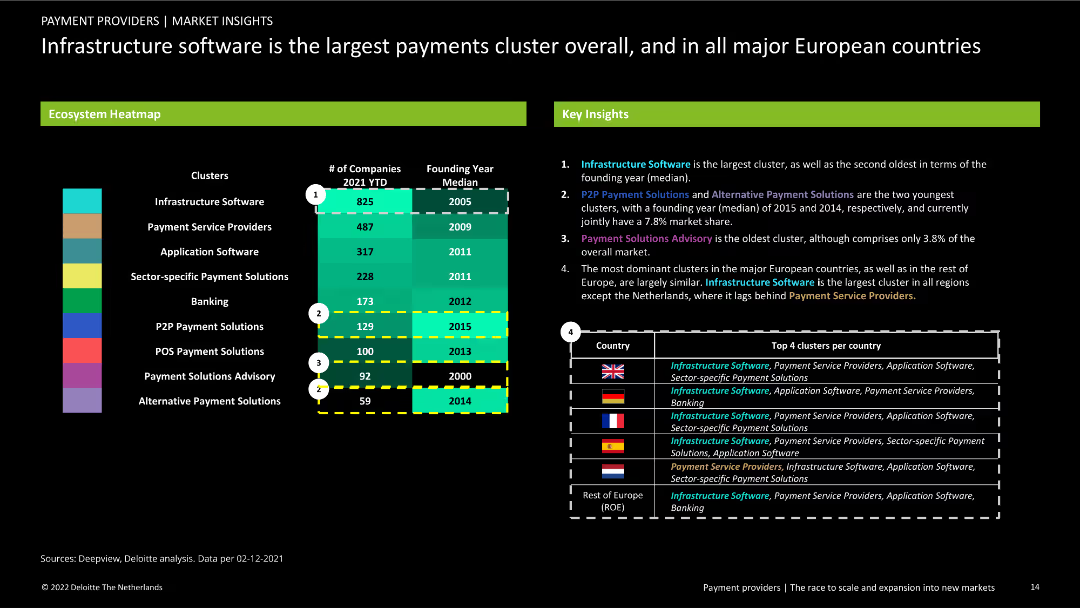
Contains a heatmap showing company clusters, founding years, and number of companies. Includes key insights and a table of top clusters by country on the right.
Market Analysis and Trends
Financial Services
Detailed view of the largest clusters in the European payments ecosystem, highlighting infrastructure software as the most dominant. Provides insights into cluster characteristics and top clusters by country.
infrastructure software, clusters, key insights, payments ecosystem, market analysis, financial services, trends, company numbers, founding years, top clusters
false
Market Analysis and Trends
Financial Services
Header Horizontal
Deloitte
Add to my slides
Remove from favorites
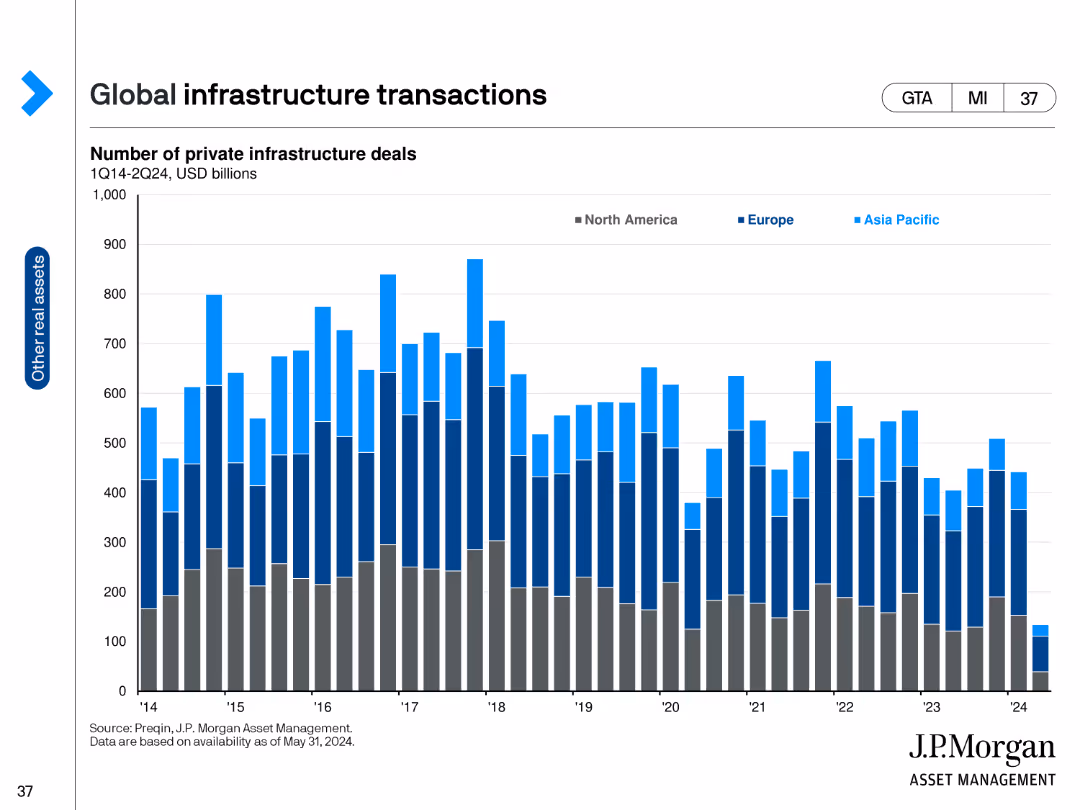
The slide features a column chart showing the number of private infrastructure deals in billions of USD, categorized by region from 1Q14 to 2Q24.
Investment Analysis
Real Estate & Construction
It tracks private infrastructure transactions in North America, Europe, and Asia Pacific, useful for investment trend analysis.
infrastructure, transactions, private deals, investment, North America, Europe, Asia Pacific, trends
false
Investment Analysis
Real Estate & Construction
Single Chart
JP Morgan
Add to my slides
Remove from favorites
Displays a column chart comparing infrastructure work in New Zealand from FY07 to FY25, with actuals until FY12 and future scenarios. It includes a clear title, annotations, and distinct scenario markers.
Market Analysis and Trends
Real Estate & Construction
This slide discusses the expected trends in infrastructure projects in New Zealand, comparing past data with future projections under various economic conditions, essential for strategic planning.
infrastructure, trends, New Zealand, projections, strategic planning
false
Market Analysis and Trends
Real Estate & Construction
Mixed Chart
Deloitte
Add to my slides
Remove from favorites
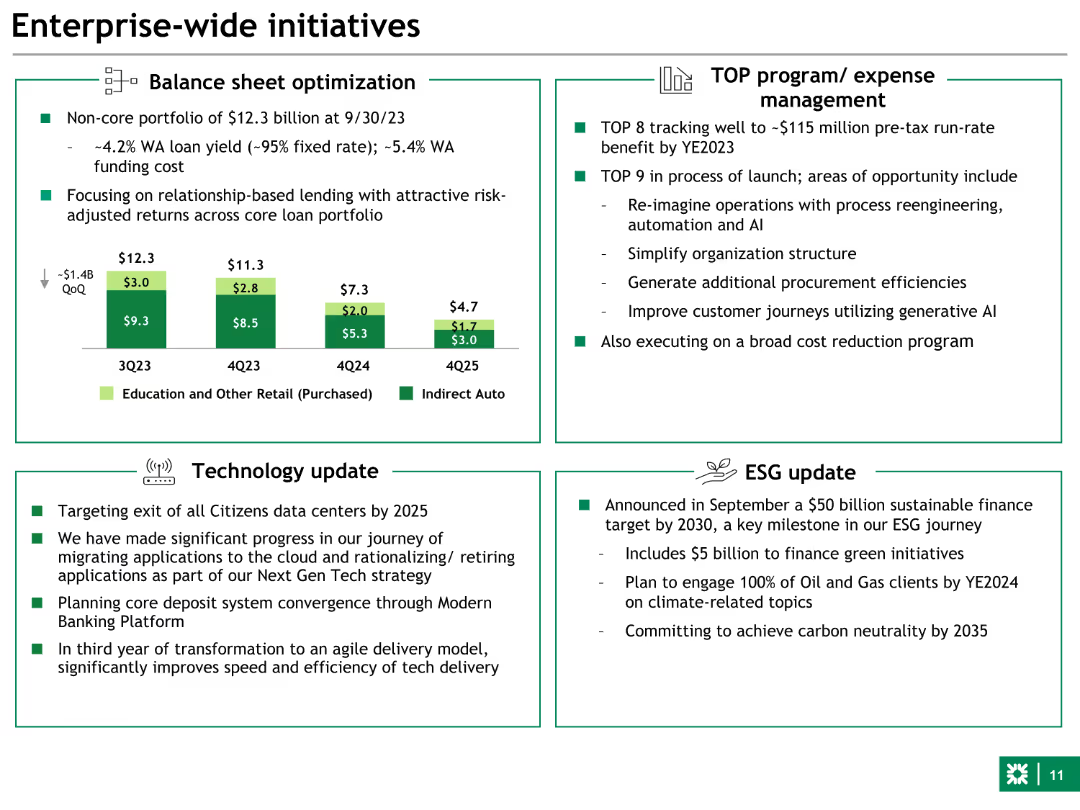
The slide contains a combination of text and a column chart. The layout is divided into four sections: Balance sheet optimization, TOP program/expense management, Technology update, and ESG update.
Strategic Planning
Financial Services
Provides an overview of key initiatives such as balance sheet optimization, expense management programs, technology updates, and ESG targets for the financial year.
Initiatives, balance sheet, ESG, technology, expense management
false
Strategic Planning
Financial Services
Mixed Chart
Goldman Sachs
Add to my slides
Remove from favorites
Bar chart showing the distribution of initiative sizes and their impact across multiple organizations.
Operational Efficiency
Professional Services
Analyzes the impact of different sized initiatives on organizational transformation success.
initiatives, impact, organization, transformation, analysis
false
Operational Efficiency
Professional Services
Single Chart
McKinsey
Add to my slides
Remove from favorites
The slide features a column chart comparing lost time injury frequency rates (LTIFR) in the cement industry between Australia and France over several years. Bullet points discuss injury rate trends.
Risk Assessment and Management
Industrial & Manufacturing
It compares injury rates in the Australian cement industry with those in France, discussing factors contributing to the rates and the implications for safety practices and reporting transparency.
injury rates, cement industry, Australia, France, LTIFR, safety
false
Risk Assessment and Management
Industrial & Manufacturing
Mixed Chart
LEK
Add to my slides
Remove from favorites
This slide is a bold title slide with the statement 'MAKE INNOVATION ACCESSIBLE TO ALL' prominently displayed. The background features a high-contrast image of a robotic dog, signifying cutting-edge technology. The slide employs a dark backdrop with teal highlights and is part of the 2022 ESG report series, indicated in the top left corner. It includes the page number '28' at the bottom right.
Strategic Planning
Technology & Software
This title slide encapsulates the firm's commitment to ensuring that innovation is inclusive and benefits society at large. It serves as an introduction to the firm's initiatives in making technology and innovative practices accessible to all segments of society, highlighting the theme of inclusivity in innovation. The use of a robotic dog image serves as a metaphor for advanced technology and the potential of digital transformation.
innovation, accessibility, technology, inclusion, ESG report
false
Strategic Planning
Technology & Software
Title
Booz Allen Hamilton
Add to my slides
Remove from favorites
Slide shows a dark background with five sets of dual vertical column charts comparing "Leading innovator" vs "Lagging innovator" percentages for five fundamental adoption metrics, labeled from 1 to 5.
Strategic Planning
Professional Services
This slide visually compares the adoption of five fundamental principles between leading and lagging innovators, providing a clear measure of innovation culture within organizations.
innovation, adoption, comparison, culture, principles
false
Strategic Planning
Professional Services
Multiple Chart
McKinsey
Add to my slides
Remove from favorites
A dark background is used with three icons representing different innovation areas accompanied by descriptive text and examples in a list format. The green and white color scheme is consistent with the overall presentation theme, and the layout allows each innovation area to be distinct and easily readable.
Strategic Planning
Technology & Software
The slide details different innovation areas CEOs should focus on, providing descriptions and examples. It's a strategic planning tool, useful for discussions on aligning innovation efforts with company objectives and market positioning. The slide is likely intended to help leaders determine where to allocate resources for innovation and how to shape their company's path forward in the market.
innovation areas, strategic focus, company objectives, market positioning, CEOs
true
Strategic Planning
Technology & Software
Agenda
BCG
Add to my slides
Remove from favorites
The slide displays multiple column charts comparing priorities in innovation between the automotive sector and other industries, utilizing different colors for visual differentiation.
Operational Efficiency
Transportation & Logistics
Analyzing innovation priorities within automotive companies, focusing on areas like product design and operations. It contrasts these priorities with broader industry trends to highlight specific areas of focus.
innovation, automotive, product design, operations, industry comparison
false
Operational Efficiency
Transportation & Logistics
Single Chart
Accenture
Add to my slides
Remove from favorites
Contains images of products with detailed descriptions and two circles highlighting specific technologies. There's a dark background with text overlays. The images are crisp, focusing on technological features of products.
Technology and Digital Transformation
Industrial & Manufacturing
Focuses on Stoneridge's recent technological advancements in automotive components, showcasing the company's innovation in the market. It’s useful for illustrating the practical application of their technology in modern vehicles.
innovation, automotive, technology, launch, performance
false
Technology and Digital Transformation
Industrial & Manufacturing
Table
Deutsche Bank
Add to my slides
Remove from favorites
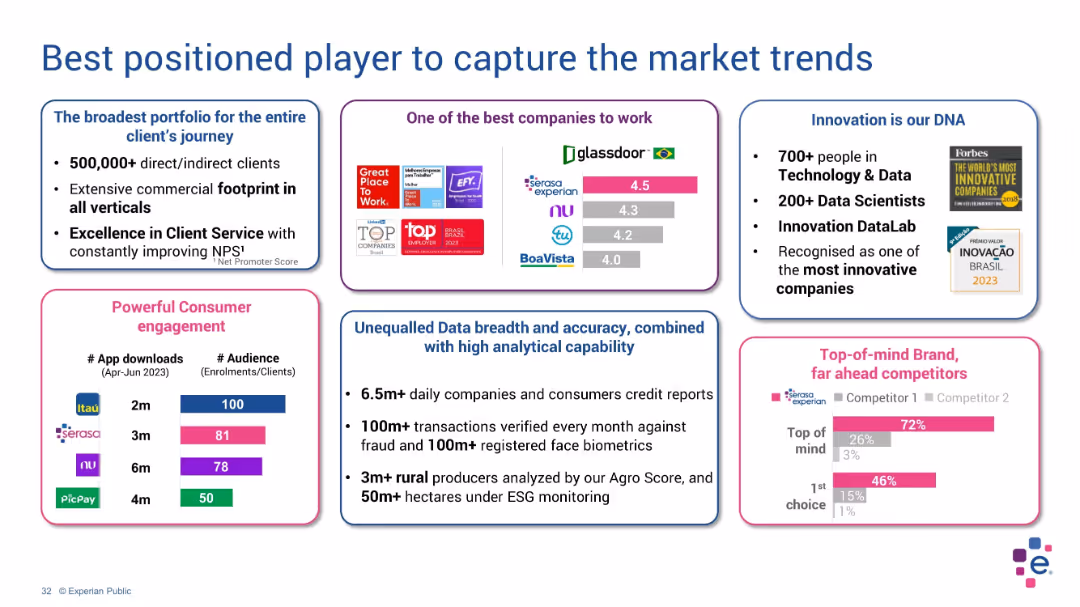
Multi-box layout with awards, stats, and competitive advantages in various color-coded sections
Competitive Landscape
Technology & Software
This slide presents Experian’s competitive strengths: client reach, app engagement, innovation recognition, data depth, and brand leadership. It emphasizes leadership in Brazil, daily verifications, rural analytics, and top-of-mind brand awareness.
innovation, brand leadership, client base, analytics, NPS, engagement
false
Competitive Landscape
Technology & Software
Multiple Chart
Barclays
Add to my slides
Remove from favorites
This slide presents a list of Michelin's innovation capabilities accompanied by corresponding icons, and a graphical representation of their leadership positions across different end-markets. The layout is balanced with text on the left and images on the right. The slide's design incorporates brand colors and includes the Michelin logo at the bottom.
Strategic Planning
Industrial & Manufacturing
It focuses on Michelin's strengths in innovation, manufacturing, simulations, and sustainability. The slide likely serves to showcase the company's innovation strategy and its position in various market segments, aimed at stakeholders or in strategic planning meetings to discuss competitive advantage and long-term growth plans.
innovation, capabilities, Michelin, sustainability, manufacturing, market leadership, strategy, growth, research and development, services
false
Strategic Planning
Industrial & Manufacturing
Header Horizontal
Morgan Stanley
Add to my slides
Remove from favorites
Moderate complexity with bullet points, icons, and text
Technology and Digital Transformation
Environmental Services & Sustainability
This slide showcases examples of companies and technologies that have made a significant impact on sustainable consumption. It is beneficial for discussing successful cases of innovation in sustainability, highlighting how various sectors are integrating green technology.
Innovation, Case Studies, Green Technology, Sustainability, Consumption
false
Technology and Digital Transformation
Environmental Services & Sustainability
Header Vertical
McKinsey
Add to my slides
Remove from favorites
Contains four sections with headers and bullet points, each illustrated with an icon, detailing obstacles in innovation at scale within established companies.
Strategic Planning
Professional Services
This slide discusses key reasons why established companies face difficulties in scaling innovation, such as focusing on short-term goals and a lack of validated ideas.
innovation, challenges, scale, strategy, value proposition, launch, culture, incumbents
false
Strategic Planning
Professional Services
Pillar
McKinsey
Add to my slides
Remove from favorites
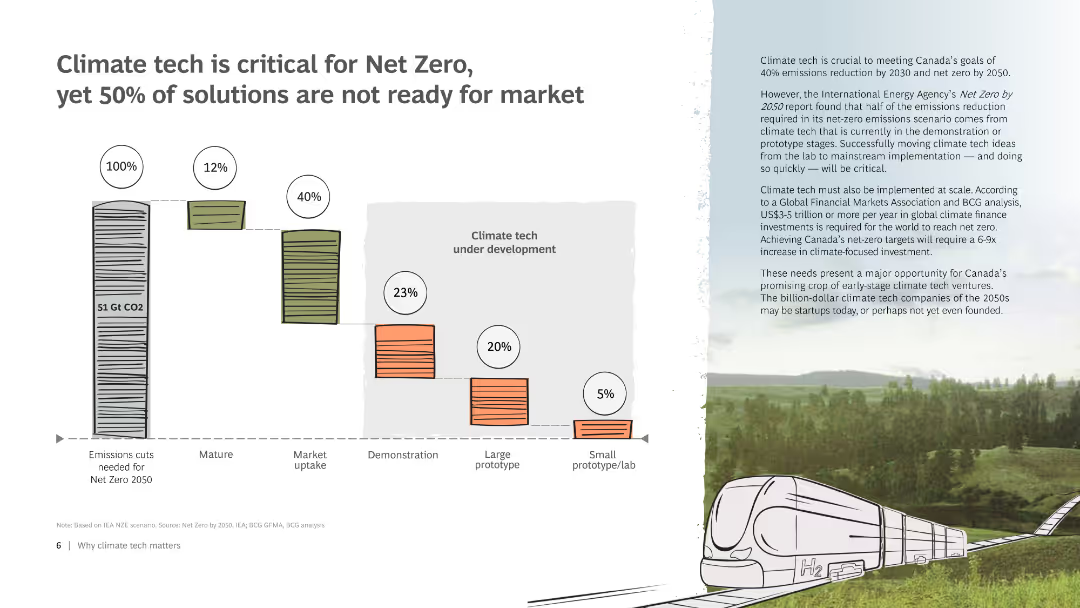
Bar chart comparing development cycles of past and current climate tech solutions. The chart shows the time from prototype to market for different technologies.
Technology and Digital Transformation
Environmental Services & Sustainability
Analyzes innovation cycles for climate tech, comparing historical and current examples to emphasize the need for faster development to meet emissions targets.
Innovation, climate tech, development, cycles, comparison
false
Technology and Digital Transformation
Environmental Services & Sustainability
Mixed Chart
BCG
Add to my slides
Remove from favorites
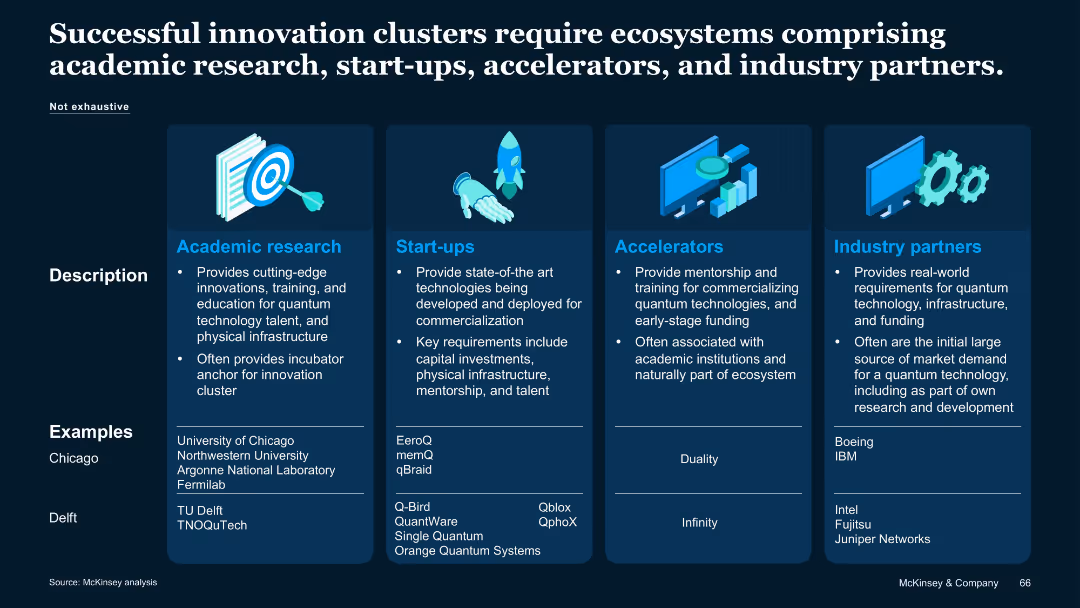
Four-column grid with icons, descriptions, and examples of institutions in Chicago and Delft; consistent color theme per section.
Client Case Studies
Artificial Intelligence
Examines innovation clusters in quantum tech, focusing on ecosystems with research institutions, start-ups, accelerators, and industry partners. Provides real-world examples from Chicago and Delft.
Innovation clusters, ecosystem, research, start-ups, accelerators
false
Client Case Studies
Artificial Intelligence
Table
McKinsey
Add to my slides
Remove from favorites
A simple title slide with the text "The Race for Innovation" over a background image of a winding road through a canyon at twilight.
Industry Overview
Technology & Software
Serves as an introductory slide to a presentation or section focused on innovation, competition, and technological advancements.
Innovation, Competition, Technology, Market Trends, Strategic Planning
false
Industry Overview
Technology & Software
Title
BCG
Add to my slides
Remove from favorites
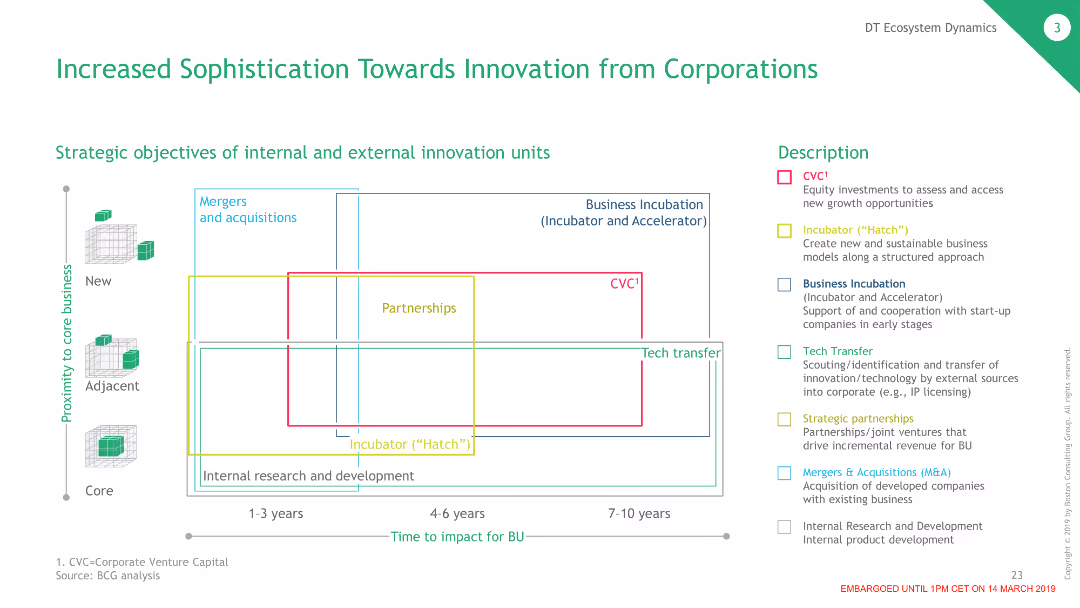
The slide contains a grid chart illustrating the strategic objectives of internal and external innovation units over different time frames and proximity to core business areas.
Strategic Planning
Technology & Software
This slide explains the strategic approaches corporations use for innovation, including mergers, partnerships, and incubators, highlighting their timelines and business impacts.
Innovation, Corporations, Strategy, Partnerships
false
Strategic Planning
Technology & Software
Header Horizontal
BCG
Add to my slides
Remove from favorites
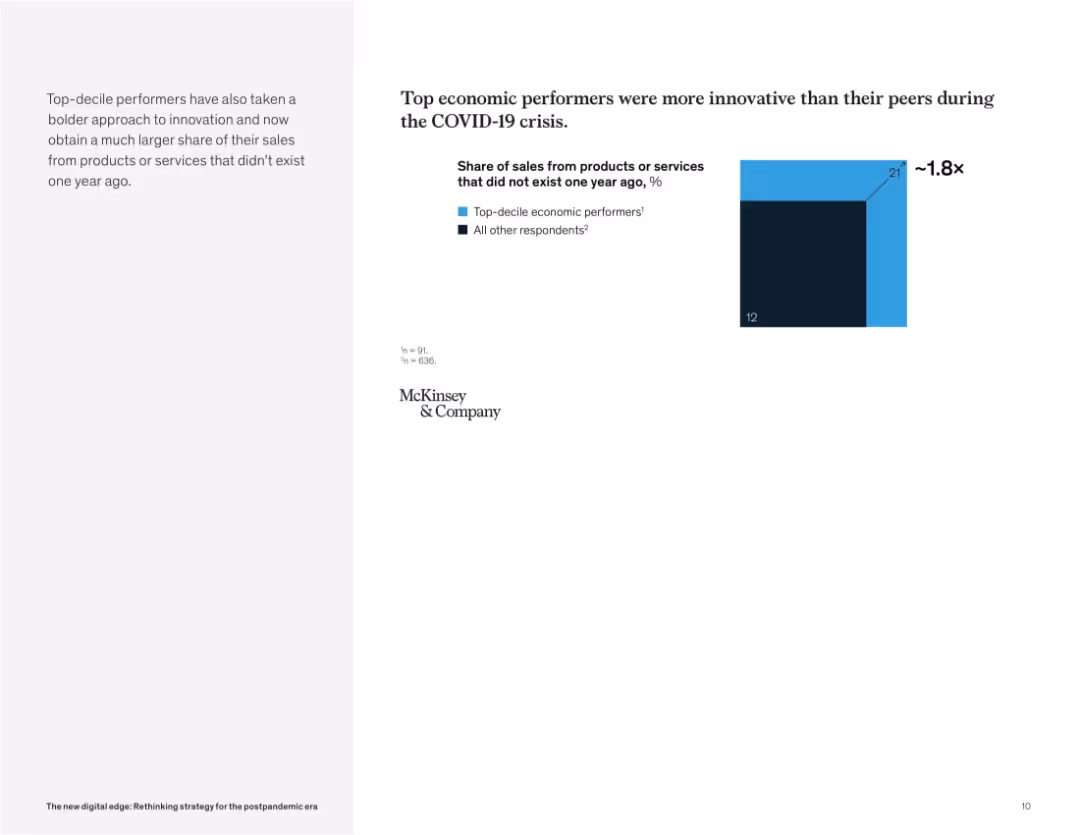
Minimalist layout with a brief paragraph on the left and a bar chart on the right comparing sales of new products/services between groups.
Financial Performance
Technology & Software
The slide shows that top economic performers generated a higher percentage of sales from products or services that did not exist a year prior, nearly 1.8 times that of their peers. This illustrates their stronger emphasis on innovation during the COVID-19 period.
innovation, COVID-19, sales growth, new products, economic performance, crisis response, agility, top performers, business resilience
false
Financial Performance
Technology & Software
Mixed Chart
McKinsey
Add to my slides
Remove from favorites
Displays a line chart illustrating the performance of innovative companies during and post a financial crisis.
Strategic Planning
Technology & Software
Evaluates how innovative companies have historically outperformed during and after crises by leveraging innovation, as shown through TSR data from 2007-2012.
innovation, crises, performance, TSR, financial crisis, historical data
false
Strategic Planning
Technology & Software
Single Chart
BCG
Add to my slides
Remove from favorites
This slide features two pie charts comparing 'fear-more' and 'fear-less' innovation cultures within companies, with percentages and follow-up implications.
Human Resources and Talent Management
Professional Services
Analyzes the prevalence of different innovation cultures within companies and their impact on leadership and innovation success.
innovation, culture, fear-less, fear-more, companies, leadership, success
false
Human Resources and Talent Management
Professional Services
Multiple Chart
McKinsey
Add to my slides
Remove from favorites
A blend of listed principles with a highlighted sidebar, it uses icons for visual emphasis and color coding for distinction between principles.
Human Resources and Talent Management
Technology & Software
It talks about fostering a culture of innovation by rewarding certain behaviors and principles within teams. Relevant for HR and corporate culture initiatives.
Innovation, Culture, Reward, Talent Management, Risk-taking, Ownership, Decision-making, Collaboration, Action Bias
true
Human Resources and Talent Management
Technology & Software
Text Only
BCG
Add to my slides
Remove from favorites
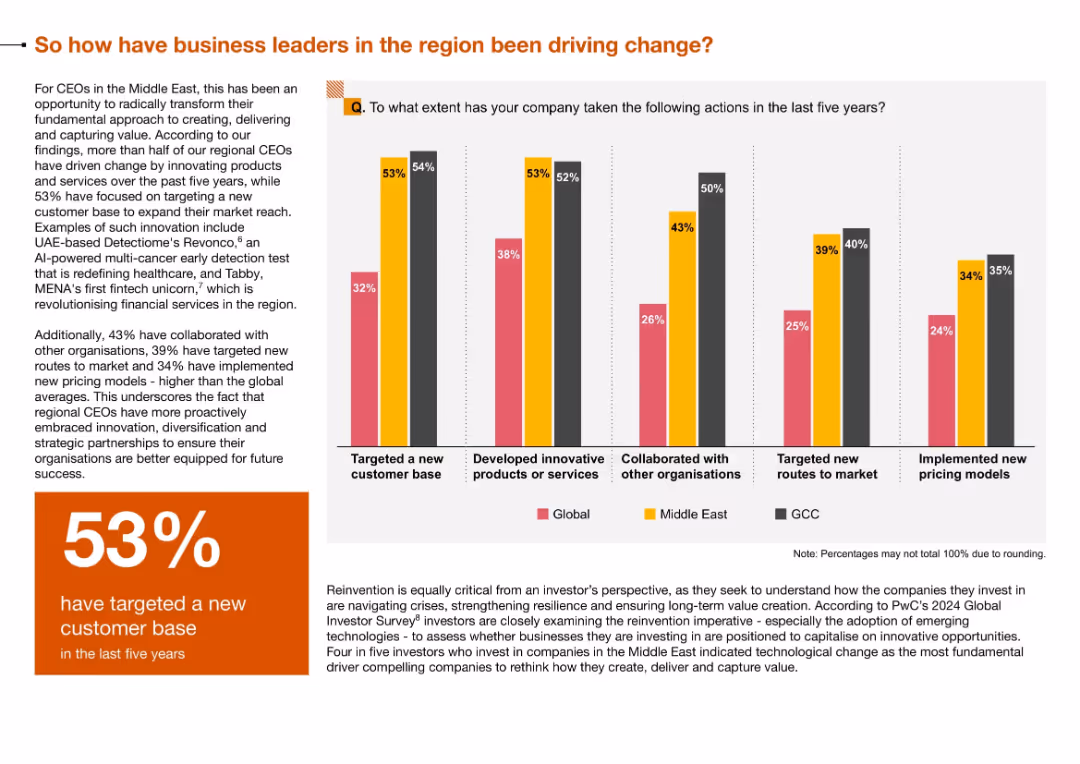
Vertical bar chart showing five innovation-related actions across Global, Middle East, and GCC; left text block and orange stat box highlight 53% customer targeting
Technology and Digital Transformation
Technology & Software
The slide demonstrates proactive innovation strategies by Middle East and GCC CEOs, including targeting new customer bases, product innovation, and partnerships. This underscores a regional shift toward agility and modernization.
Innovation, Customer Base, Strategic Partnerships, Pricing Models, Middle East, GCC, Transformation
false
Technology and Digital Transformation
Technology & Software
Mixed Chart
PwC/Strategy&
Add to my slides
Remove from favorites
The slide is divided into three columns labeled Open, Manage, and Deepen, each with icons and bullet points detailing initiatives like account opening times, transaction speeds, and engagement tools. The column on the right features a puzzle piece graphic to symbolize deepening customer relationships, along with stats highlighting growth in engagement and income from multi-LOB households.
Operational Efficiency
Financial Services
This slide discusses the bank's innovative strategies in customer engagement and efficiency improvements across different stages of the customer lifecycle. It details specific operational advancements and their impact on engagement, such as reduced account opening times and faster transactions.
innovation, customer engagement, operational efficiency, digital banking
false
Operational Efficiency
Financial Services
Table
JP Morgan
Add to my slides
Remove from favorites
Circular diagram representing the innovation cycle, with segments for inception, value creation, adoption & diffusion, and impacts. Text explains the dynamic process of innovation in economic and social contexts.
Technology and Digital Transformation
Technology & Software
The slide presents the innovation cycle, illustrating the stages from inception to wider impacts. It discusses the dynamic nature of innovation, emphasizing the importance of R&D, adoption, and diffusion for achieving significant economic and social benefits.
Innovation Cycle, R&D, Economic Impact
false
Technology and Digital Transformation
Technology & Software
Linear Flow
Roland Berger
Add to my slides
Remove from favorites
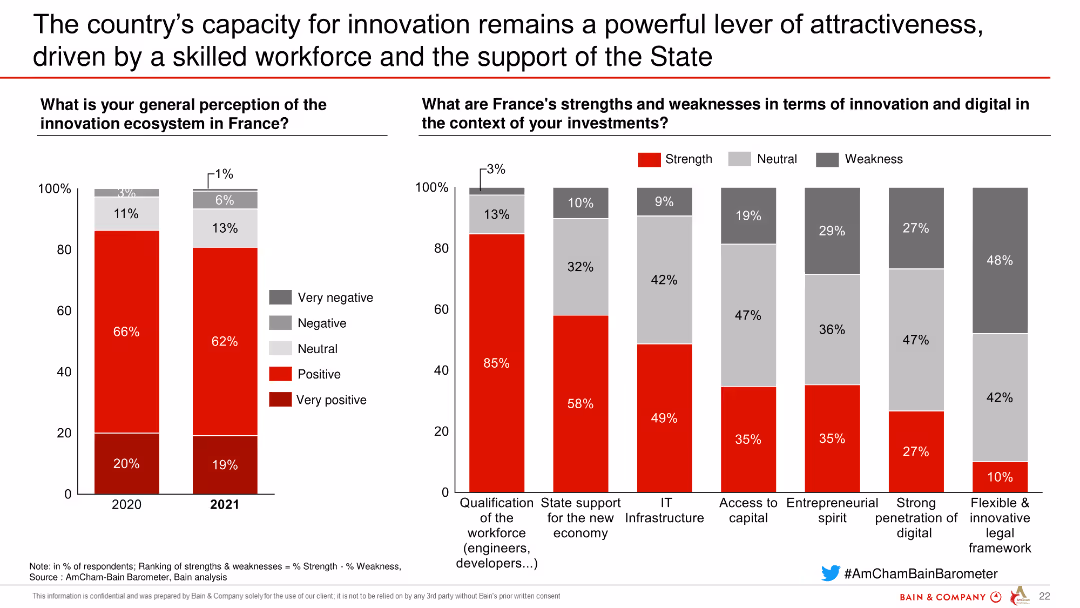
The slide shows multiple column charts assessing the innovation ecosystem in France and the perceptions of its strengths and weaknesses in innovation and digital contexts.
Market Analysis and Trends
Technology & Software
Evaluates France's role as a hub for innovation, supported by government incentives and a skilled workforce. It examines the strengths and weaknesses in digital infrastructure and entrepreneurial spirit.
innovation, digital transformation, France, government support, skilled workforce
false
Market Analysis and Trends
Technology & Software
Multiple Chart
Bain
Add to my slides
Remove from favorites
Shows a scatter plot correlating the number of 'Innovation Essentials' mastered with the economic profit index, highlighting the relationship between the two.
Strategic Planning
Professional Services
Illustrates how companies that adopt a comprehensive approach to mastering innovation practices achieve higher economic profits, emphasizing the importance of evolving innovation strategies.
innovation, economic profit, mastery, companies, strategy, performance
false
Strategic Planning
Professional Services
Single Chart
McKinsey
Add to my slides
Remove from favorites
A Venn diagram overlaid on a faded gray square grid background with additional descriptive text.
Strategic Planning
Financial Services
Showcases the firm's multifaceted approach in the innovation economy with activities like advising, raising capital, and investing.
innovation economy, strategic approach, advising, capital, investing, co-creation, Goldman Sachs
false
Strategic Planning
Financial Services
Framework
Goldman Sachs
Add to my slides
Remove from favorites
This slide has column charts comparing perceptions of the innovation ecosystem in France and analyzing strengths and weaknesses in innovation and digital terms for investments.
Market Analysis and Trends
Technology & Software
The slide evaluates perceptions of the innovation ecosystem in France and highlights strengths and weaknesses in terms of innovation and digital factors affecting investments.
innovation, ecosystem, France, strengths, weaknesses, digital, investments, technology, software
false
Market Analysis and Trends
Technology & Software
Multiple Chart
Bain
Add to my slides
Remove from favorites
This slide is divided into two sections, with the left side detailing the efforts in 'CULTIVATING AN INNOVATION ECOSYSTEM' through collaborations and technology scouting, and the right side featuring a quote with a portrait of a technology officer. It employs a professional design with a white background and teal accents, maintaining the theme of the 2022 ESG report. The page number '29' is visible at the bottom right.
Strategic Planning
Professional Services
The slide discusses strategic partnerships and collaborations with startups and venture capital investments to foster an innovation ecosystem. It stresses the importance of agile, rapid, and efficient development for serving public sector needs. The presence of a highlighted quote from a key executive adds personal insight into the company’s dedication to innovation and the initiatives undertaken to drive technology forward within the firm and for clients.
innovation, ecosystem, technology, partnerships, startups, investments
false
Strategic Planning
Professional Services
Text Only
Booz Allen Hamilton
Add to my slides
Remove from favorites
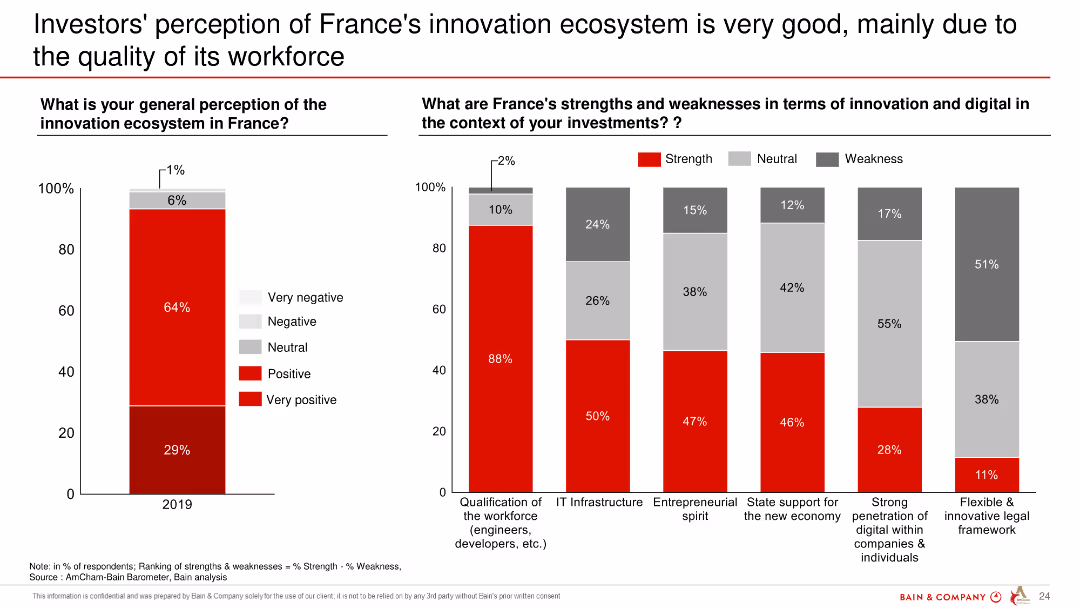
Column chart showing investors' general perception of the innovation ecosystem in France and its strengths and weaknesses in terms of innovation and digital.
Market Analysis and Trends
Professional Services
The slide evaluates investors' positive perception of France's innovation ecosystem, highlighting workforce quality as a key strength.
innovation ecosystem, workforce quality, perception, strengths, weaknesses, France
false
Market Analysis and Trends
Professional Services
Multiple Chart
Bain
Add to my slides
Remove from favorites
This slide features a three-column layout, each with a distinct category—Active to Passive, ESG, Digital Execution—presented with a mix of textual content and numerical data in a blue color scheme.
Financial Performance
Financial Services
It discusses the shift in client services towards passive strategies, ESG and impact investing, and improving digital execution capabilities. It includes AUS data, ETF count, and API connectivity as part of the service features.
Innovation, ESG, Digital, ETF, API
false
Financial Performance
Financial Services
Table
Goldman Sachs
Add to my slides
Remove from favorites
The slide presents icons showing different fears affecting innovators, with comparative intensity levels among average and leading innovators.
Human Resources and Talent Management
Professional Services
Explores common fears among innovators, comparing how these fears vary between average and leading innovators and their impact on innovation efficiency.
innovation, fears, impact, career, outcomes, criticism, comparison
false
Human Resources and Talent Management
Professional Services
Pillar
McKinsey
Add to my slides
Remove from favorites
This slide is divided into four sections with a combination of column charts and bullet points. It utilizes a blue, white, and red color scheme and includes award logos and a circular diagram to represent the different business sectors discussed.
Strategic Planning
Technology & Software
Showcasing strategic business advancements in banking, highlighting key innovations, market leadership, and technology integration across several sectors.
innovation, fintech, market leadership, digital platform, banking, treasury management
false
Strategic Planning
Technology & Software
Table
Goldman Sachs
Add to my slides
Remove from favorites
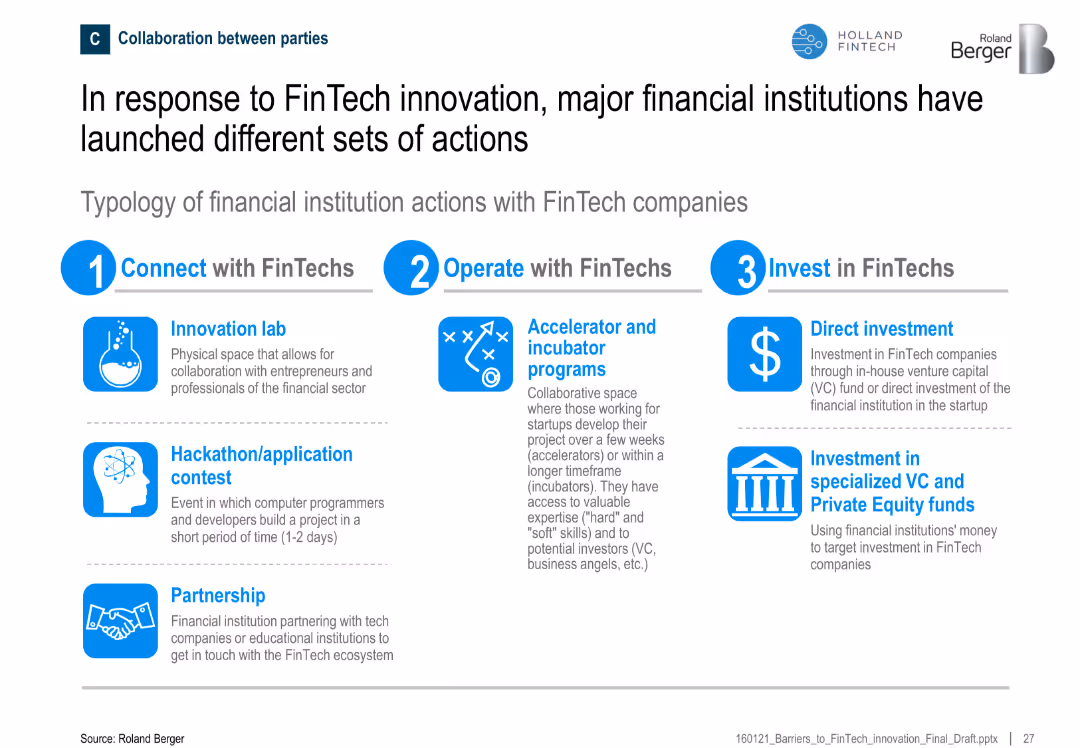
Three-column structure under three themes: Connect, Operate, and Invest; icons and short descriptions used
Strategic Planning
Financial Services
The slide categorizes how financial institutions engage with FinTechs via labs, contests, incubators, and direct investments. It outlines a three-pronged strategy: connection, operation, and investment.
innovation, FinTech, partnerships, investment, labs, incubators, VC
false
Strategic Planning
Financial Services
Linear Flow
Roland Berger
Add to my slides
Remove from favorites
Features a Venn diagram illustrating the intersection of Customer/Member, Technology, and Business Model with labels 'Desirability', 'Feasibility', and 'Viability'. The diagram is central with annotations explaining the importance of each component in innovation.
Strategic Planning
Professional Services
Explores the framework of innovation at the intersection of customer needs, technological capabilities, and viable business models. This conceptual slide is critical for understanding and applying innovation in business strategy, emphasizing the integration of these elements for successful innovation initiatives.
Innovation framework, business strategy, technology integration, customer needs
false
Strategic Planning
Professional Services
Diagram
McKinsey
Add to my slides
Remove from favorites
Scatter plot comparing the Global Innovation Index with GDP per capita PPP for 2019, with emerging markets and advanced countries highlighted. Text discusses the relationship between innovation and prosperity.
Technology and Digital Transformation
Technology & Software
The slide illustrates the correlation between innovation capabilities and economic prosperity, showing how countries with higher Global Innovation Index scores tend to have higher GDP per capita. It highlights the importance of innovation for economic growth and development.
Innovation, GDP, Global Index, Prosperity
false
Technology and Digital Transformation
Technology & Software
Mixed Chart
Roland Berger
Add to my slides
Remove from favorites
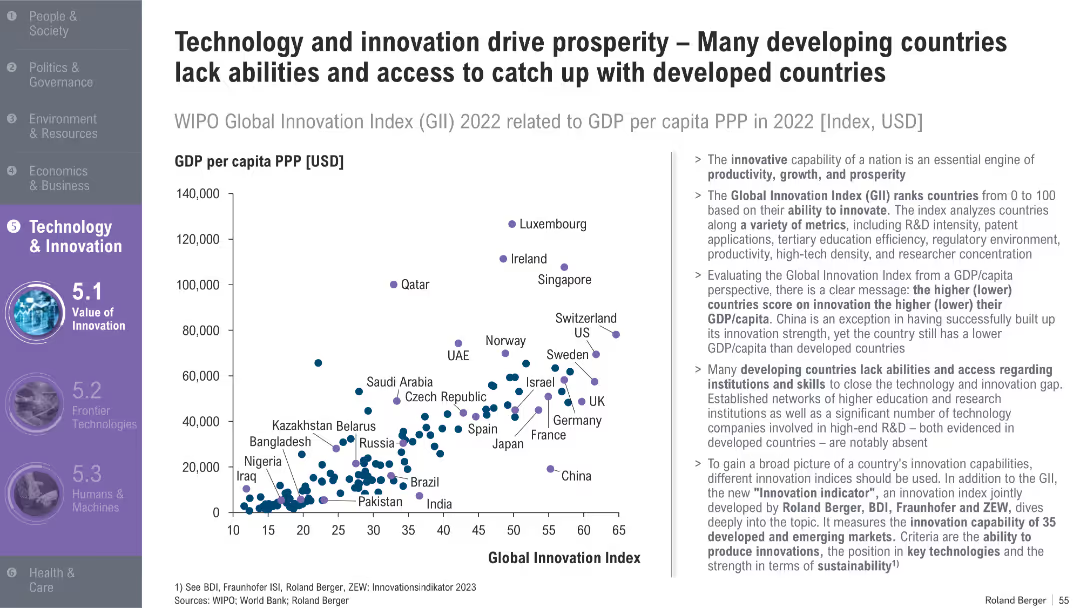
Scatterplot comparing GDP per capita vs. Global Innovation Index; developed and developing countries marked; explanatory text to the right
Market Analysis and Trends
Technology & Software
This slide explores the correlation between innovation and GDP per capita, identifying how many developing countries lag due to limited access to R&D infrastructure and education. It also introduces a new innovation index.
innovation, GDP per capita, R&D, Global Innovation Index, developing countries, productivity, skills, tech access
false
Market Analysis and Trends
Technology & Software
Mixed Chart
Roland Berger
Add to my slides
Remove from favorites
Diagram with strategic business units around a central circle named 'Goldman Sachs' with dashed lines pointing to partner logos.
Investment Analysis
Technology & Software
Explores Goldman Sachs' business segments and strategic partnerships with tech companies like GitLab and Pensando.
innovation, Goldman Sachs, partnerships, business segments, tech companies, GitLab, Pensando
false
Investment Analysis
Technology & Software
Framework
Goldman Sachs
Add to my slides
Remove from favorites
The slide compares a hedged equity fund's performance with benchmarks using multiple column charts and showcases AUM growth in infrastructure with a large arrow.
Financial Performance
Financial Services
This slide focuses on JPMorgan’s innovation in financial products, including a top-performing hedge fund and infrastructure investment, reflected in high annual returns and AUM growth.
innovation, hedge fund, infrastructure, JPMorgan, annual return, AUM growth, investment products
false
Financial Performance
Financial Services
Multiple Chart
JP Morgan
Add to my slides
Remove from favorites
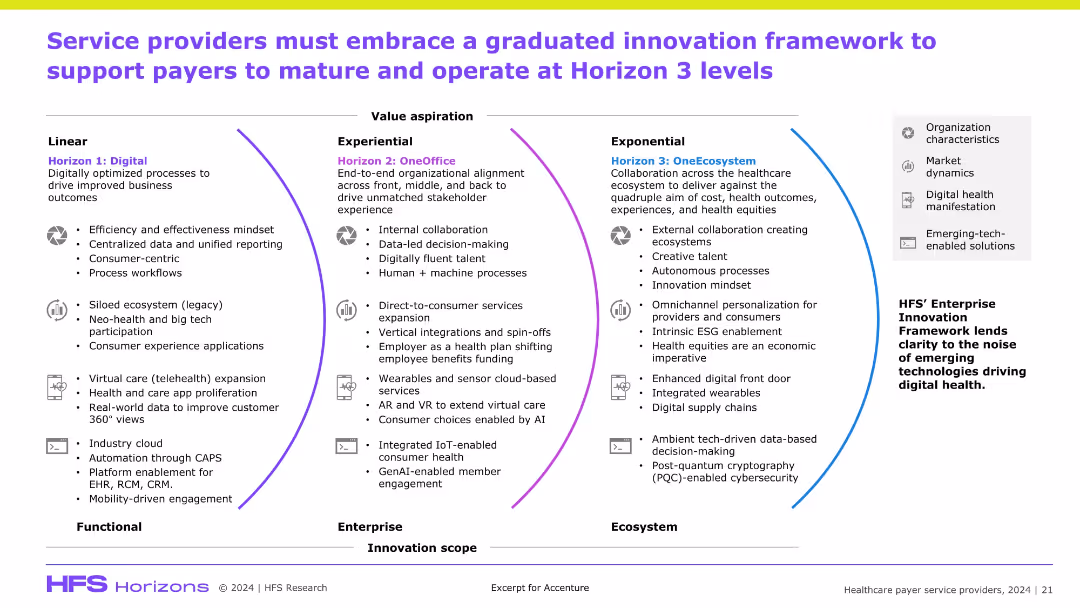
Three-column layout (Linear, Experiential, Exponential) showing progression across innovation scope; use of circular infographics and icons; visually segmented for comparison; light background.
Technology and Digital Transformation
Healthcare & Pharmaceuticals
The slide proposes a framework for service providers to evolve alongside healthcare payers, from digital optimization (Horizon 1) to ecosystem-wide innovation (Horizon 3). Each horizon includes specific technology and organizational features needed to achieve more integrated and patient-centered healthcare outcomes.
innovation, Horizon 3, digital transformation, OneOffice, OneEcosystem, service provider
false
Technology and Digital Transformation
Healthcare & Pharmaceuticals
Framework
Accenture
Add to my slides
Remove from favorites
The slide uses a white background with two large, concentric pie charts contrasting shades of blue and green to depict changes over the years 2020 and 2021. Adjacent to the charts, explanatory text and percentages are provided in a clear, readable font. The layout is simple and focuses the viewer’s attention on the comparative data of the pie charts.
Market Analysis and Trends
Financial Services
The slide highlights the growing importance of innovation and increased budgets for it over the span of one year. It is likely to be used for demonstrating the trend towards innovation in business strategy, showing a substantial percentage increase in companies prioritizing innovation and allocating budgets accordingly. This slide could serve as a tool for convincing stakeholders of the necessity of increased investment in innovation.
innovation importance, budgets, business strategy, trends, year-over-year increase
true
Market Analysis and Trends
Financial Services
Multiple Chart
BCG
Add to my slides
Remove from favorites
Previous
Next
You don't have any favorites yet.
Please wait loading your favorites slides...
Create a FREE account to continue browsing
Receive Instant Access to 1,000+ slides from companies like McKinsey, Google, and Goldman Sachs
First Name
Last Name
Email
Password
I agree to all
Terms & Privacy Policy
Thank you! Your submission has been received!
Oops! Something went wrong while submitting the form.
Have an account?
Sign in
Upgrade to PRO to Save slides
Advanced Search and Filters
Access to 15,000+ slides
Access to Category Pages
Save/Bookmark Slides
PowerPoint Template Library
Pick a Plan
MONTHLY
$12/month
Billed every month, Cancel anytime.
YEARLY
$9/year
Billed $108 annually, Cancel anytime.
Checkout for $12/month
Checkout for $108/yr
Secured by Stripe | AES-256 bit encryption


![To what extent do you think the [Country] government should increase or lower its spending... Infrastructure](https://cdn.prod.website-files.com/654e70fb59937215cac87b19/6899be5e9bda841747800dc7_1WJeqYGVYACsszTnxmjL0EH38lbEXxaimybucWTKLCI.avif)