My Account
My Slides
Search by Category
Companies
Slide Type
Use Case
Industry
Pricing
Templates
View All Templates
Download Template Slides
✦ AI
AI Prompt Library
AI Search
Feedback
Login
Logout
Get Started
Browse all Slides
Browse all Slides
Create a FREE Account
Instant access to 1,000+ real slides from top companies like McKinsey, BCG, Goldman Sachs, Google and many more!
First Name
Last Name
Email
Password
I agree to all
Terms & Privacy Policy
Thank you! Your submission has been received!
Oops! Something went wrong while submitting the form.
Have an account?
Sign in
Saved Slides
Total No. of slides saved
0
↻ Refresh
✖ Clear all
A table listing the Global Innovation Index (GII) rankings of the top 10 innovative countries in 2021, with scores for various pillars like institutions, human capital, infrastructure, etc.
Market Analysis and Trends
Technology & Software
The slide displays the Global Innovation Index rankings for the top 10 countries in 2021, highlighting their strengths in institutions, human capital, infrastructure, market sophistication, business sophistication, and knowledge and technology outputs. It underscores the factors contributing to innovation leadership.
Innovation Index, Rankings, 2021, Top 10
false
Market Analysis and Trends
Technology & Software
Table
Roland Berger
Add to my slides
Remove from favorites
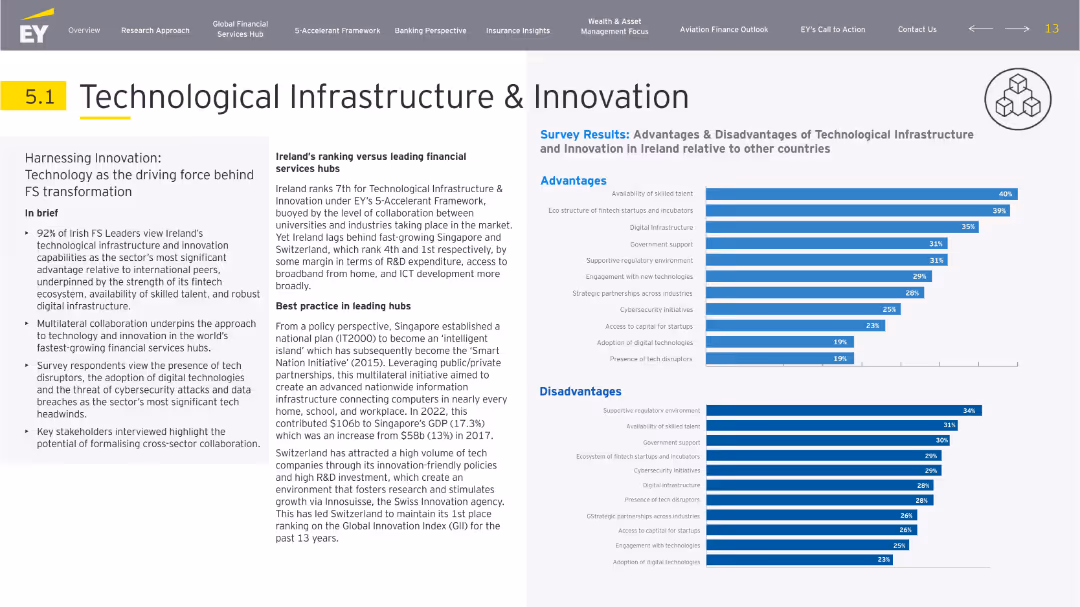
Dual-panel layout with text and survey bars on the left and right. Title is large and top-aligned, with icons and segmented content. Color-coded bar charts indicate advantages and disadvantages.
Technology and Digital Transformation
Technology & Software
The slide explores Ireland's position on technological infrastructure in FS, ranking 7th in EY's framework. It discusses collaboration challenges and compares best practices in Singapore and Switzerland. Survey results show Ireland's strong points in talent and fintech ecosystems, as well as limitations in regulation and tech adoption.
innovation, infrastructure, fintech, cybersecurity, R&D, regulation
false
Technology and Digital Transformation
Technology & Software
Multiple Chart
EY
Add to my slides
Remove from favorites
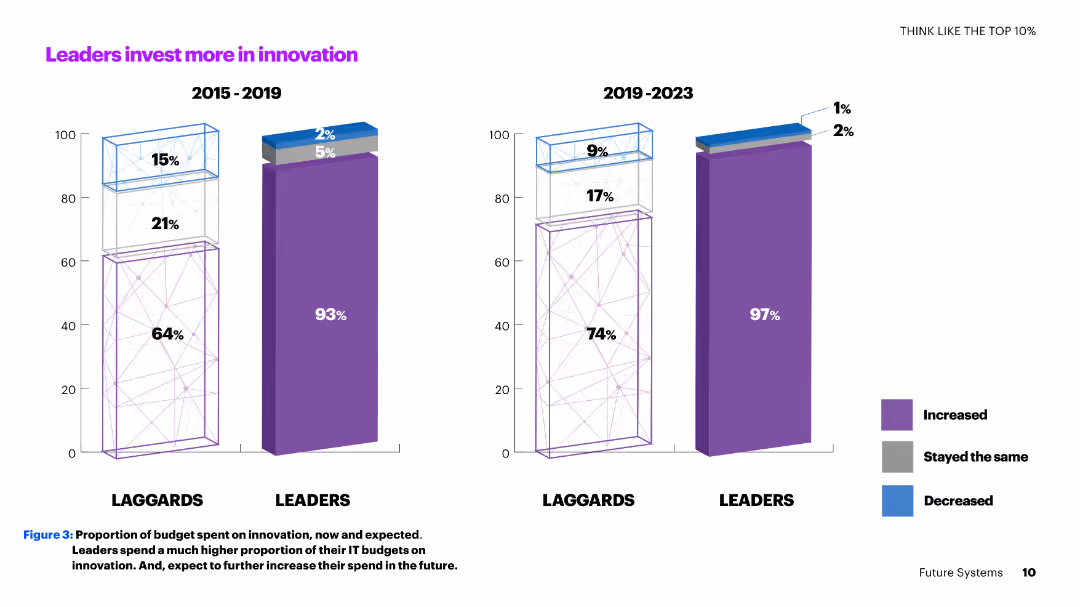
A two-column slide with vertical bar charts comparing the innovation investment percentages of leaders and laggards from 2015-2019 and 2019-2023.
Investment Analysis
Technology & Software
The slide shows how leaders consistently invest more in innovation compared to laggards, with a significant portion of their IT budgets allocated to innovation now and in the future.
innovation, investment, leaders, laggards, IT budgets, comparison, future, percentages, trends, analysis
false
Investment Analysis
Technology & Software
Multiple Chart
Accenture
Add to my slides
Remove from favorites
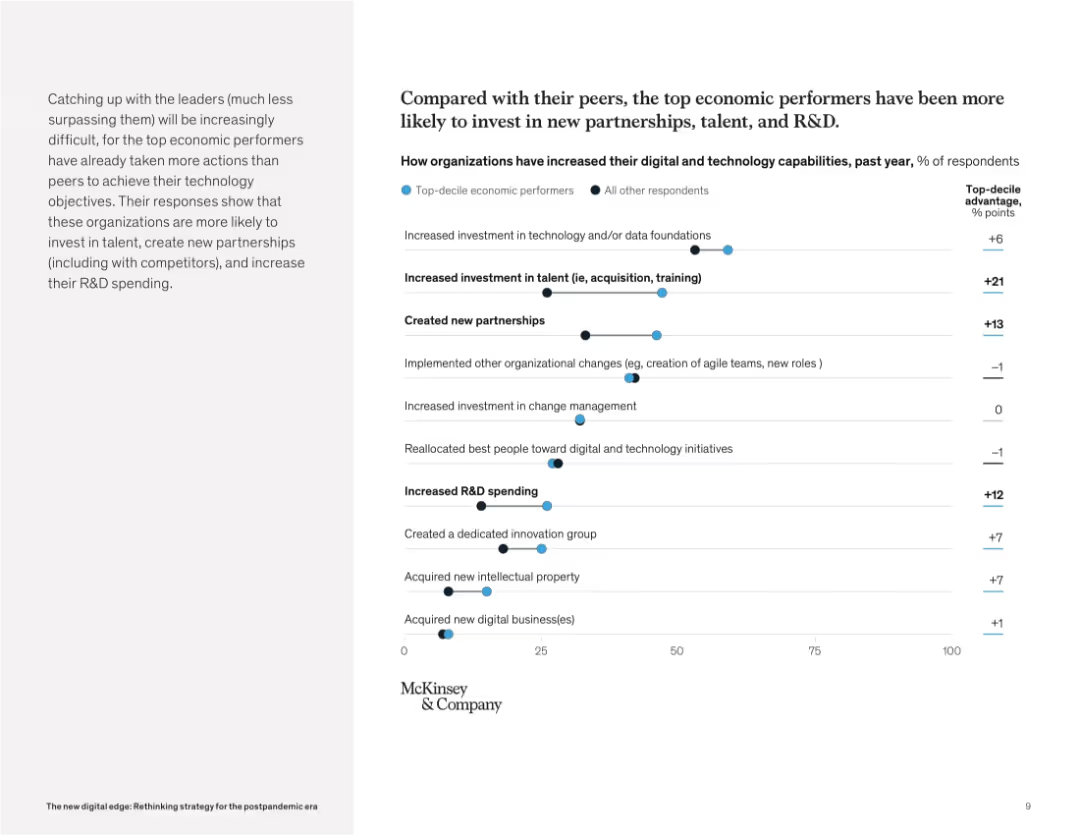
Two-column layout with left-side explanatory paragraph and right-side dot plot showing percentage differences between top performers and others across multiple actions.
Strategic Planning
Technology & Software
This slide highlights the initiatives taken by top economic performers over the past year to strengthen digital and technology capabilities. These include significantly higher investments in talent, partnerships, and R&D, as well as the creation of innovation groups and acquisition of intellectual property.
innovation, investment, talent acquisition, partnerships, R&D, digital capabilities, tech investment, McKinsey, top performers
false
Strategic Planning
Technology & Software
Mixed Chart
McKinsey
Add to my slides
Remove from favorites
Featuring a circular graph with variously sized and colored bubbles, it visualizes data on innovation, interest, investment, and adoption by technology trend.
Technology and Digital Transformation
Professional Services
Continuation of the introduction, this slide provides quantitative data on technology trends using an innovative graph style.
Innovation, Investment, Technology, Trends, Data, Analysis, AI, Energy
false
Technology and Digital Transformation
Professional Services
Single Chart
McKinsey
Add to my slides
Remove from favorites
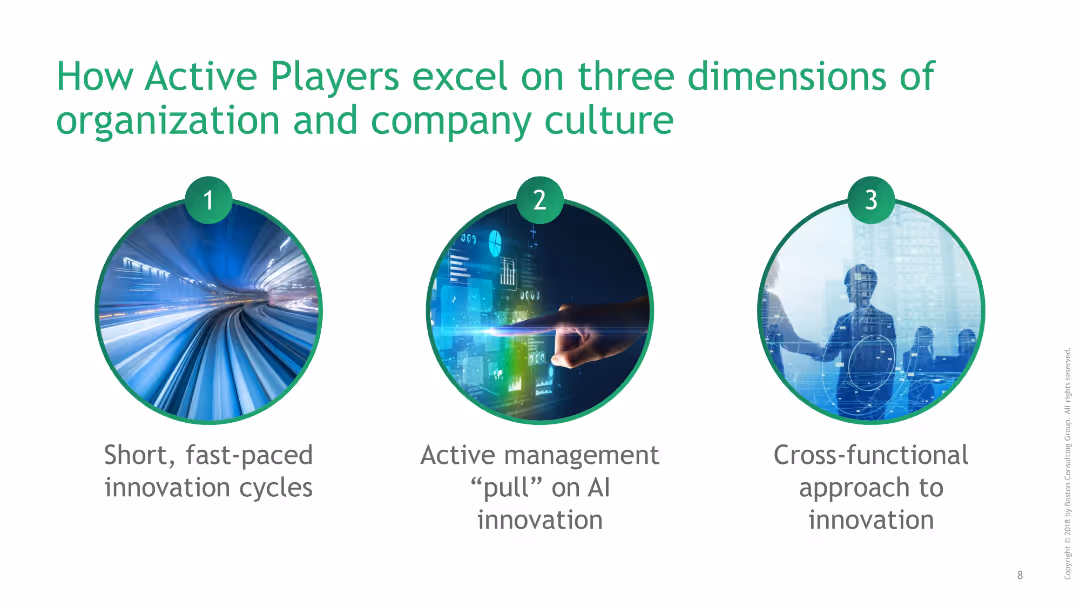
Three circular images illustrating fast-paced innovation cycles, active management, and cross-functional approach to innovation.
Organizational Structure and Change
Professional Services
This slide outlines the three key dimensions of organizational and company culture that active AI players excel in: innovation cycles, management, and cross-functional approach.
innovation, management, cross-functional, organizational culture, active players, company, three dimensions, circular images, text, images
false
Organizational Structure and Change
Professional Services
Pillar
BCG
Add to my slides
Remove from favorites
This slide is a Comparative Slide, showcasing two columns labeled 'DEEP-INNOVATION CAPABILITIES' and 'MICHELIN'S HIGH-TECH MATERIALS ACTIVITIES' with icons and brief points underneath each. There are four points on the left with corresponding icons and three sections on the right detailing different product categories. The slide has a clean, professional design with a balance of text and icons.
Industry Overview
Industrial & Manufacturing
The slide presents Michelin’s strengths in innovation and product offering. On one side, it emphasizes their abilities in research and development, manufacturing, simulations, and sustainable materials. On the other, it showcases their high-tech material activities including sealing technologies, belting solutions, and engineered fabrics and films, highlighting the synergy between these areas.
innovation, manufacturing, materials, synergy, sustainability, technology, engineered fabrics, engineered polymers, high-tech
false
Industry Overview
Industrial & Manufacturing
Header Horizontal
Morgan Stanley
Add to my slides
Remove from favorites
The slide features a central, bold title, multiple icons representing different marketing channels, and a flow diagram below including colored rectangles labeled "Checking", "Cards", "Loans", "Savings", and "Invest/Wealth". Columns represent strategic approaches.
Market Analysis and Trends
Financial Services
Describes Goldman Sachs’ diverse approaches to innovation in financial services, highlighting direct marketing, financial tools, and partnerships. The strategic approach to innovation is depicted through a visual representation of product offerings and methods of engagement.
innovation, marketing, finance, strategy, partnership
false
Market Analysis and Trends
Financial Services
Diagram
Goldman Sachs
Add to my slides
Remove from favorites
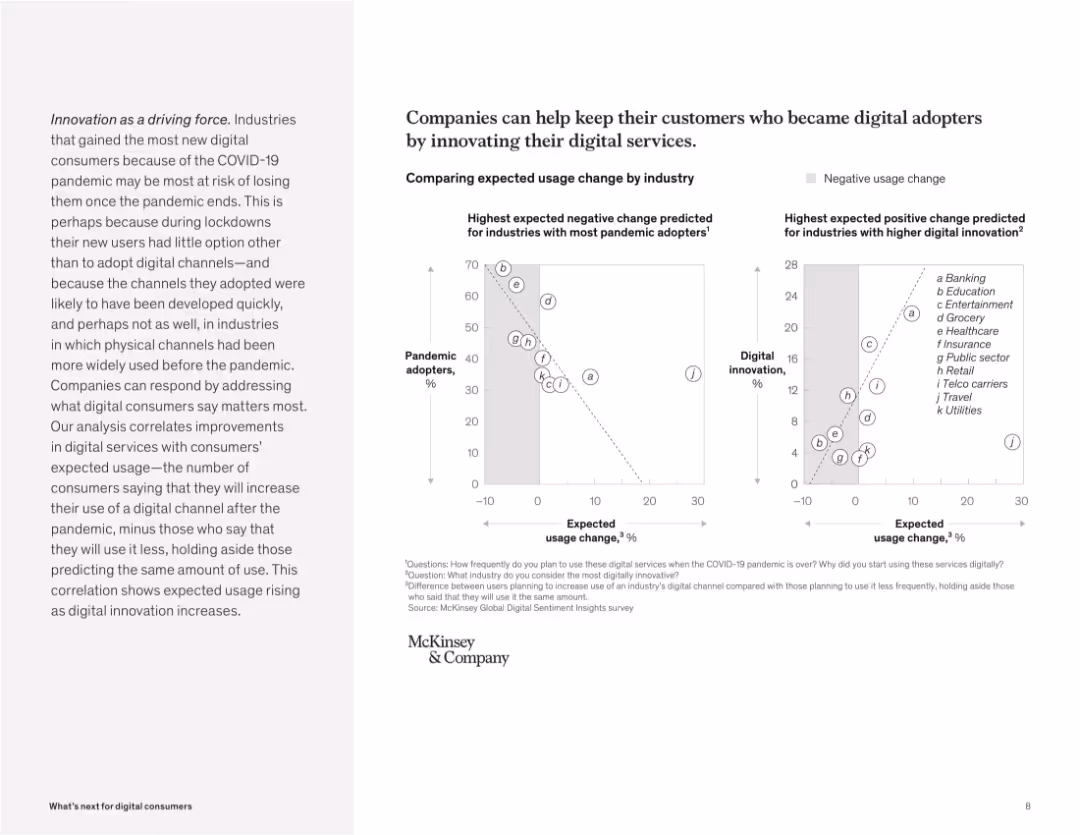
Dual scatter plots comparing pandemic adoption vs. usage change and innovation vs. usage change. Grayscale points labeled by industry.
Strategic Planning
Technology & Software
The slide uses two scatter plots to correlate digital innovation with future digital usage. It shows that industries with high pandemic adoption but low innovation risk losing users, while those with high innovation are expected to see sustained or increased usage.
innovation, pandemic adoption, usage change, digital services, correlation, scatter plot, strategy, industry risk
false
Strategic Planning
Technology & Software
Multiple Chart
McKinsey
Add to my slides
Remove from favorites
This slide presents a matrix layout, comparing different strategic approaches to innovation within companies. It utilizes contrasting colors to differentiate between 'model', 'buy', and 'partner' approaches, and includes both text explanations and simple iconography.
Market Analysis and Trends
Technology & Software
The slide discusses various methods of building capabilities through partnerships and acquisitions, and how companies choose based on their focus on innovation. It's useful for strategic planning and investment decisions.
Innovation, Partnerships, Acquisition, Ecosystems, Venture Capital, Startups, Technology, Strategy, Investment, Engagement
false
Market Analysis and Trends
Technology & Software
Pillar
BCG
Add to my slides
Remove from favorites
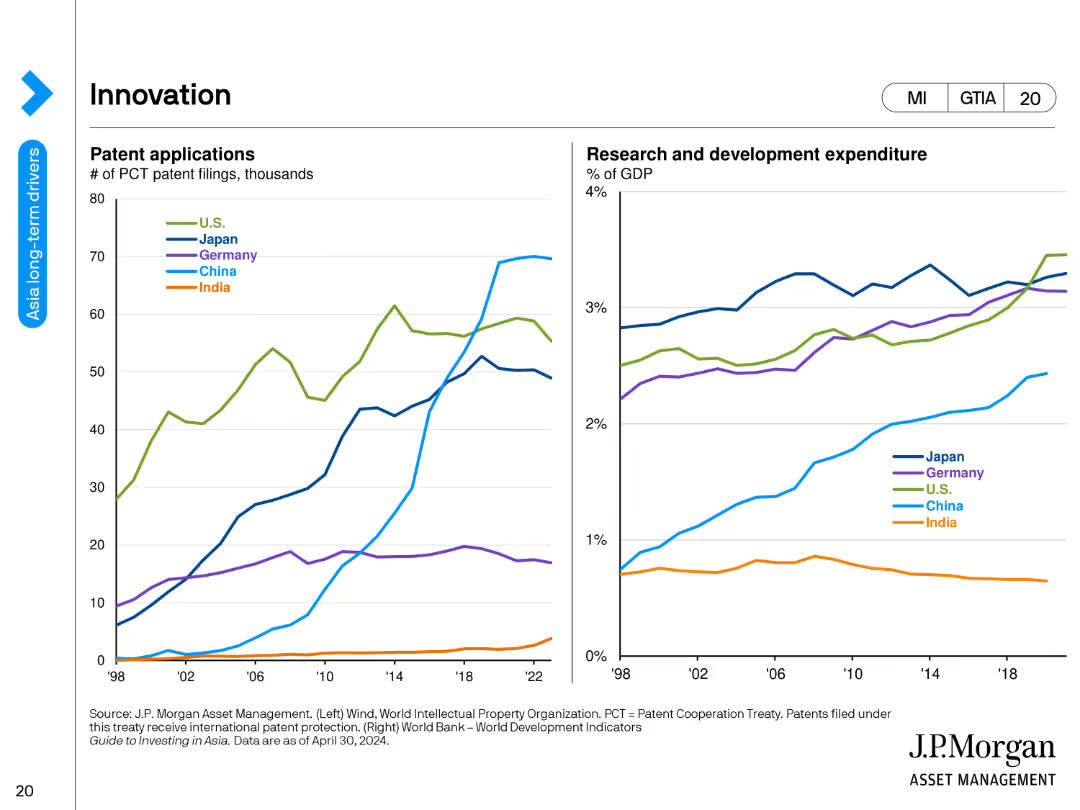
The slide features two line charts. The left chart shows the number of PCT patent filings in thousands for the US, Japan, Germany, China, and India from 1998 to 2023. The right chart presents research and development expenditure as a percentage of GDP for the same countries over the same period.
Market Analysis and Trends
Technology & Software
This slide analyzes innovation trends, illustrating patent applications and R&D expenditures across major countries. It shows the growth in patent filings and investment in research and development, indicating technological advancement and economic focus.
innovation, patents, R&D, US, Japan, Germany, China, India, line chart, technology
false
Market Analysis and Trends
Technology & Software
Multiple Chart
JP Morgan
Add to my slides
Remove from favorites
A side-by-side comparison of the current and vision model for the Interbank Information Network with bullet points, and details about JPM Coin on the right with an image of a coin and network connections.
Technology and Digital Transformation
Financial Services
This slide presents the Interbank Information Network and JPM Coin as innovations in wholesale payments, showing the transition from the current model to the future vision, useful for showcasing technology progress in financial services.
Innovation, Payments, Blockchain, JPM Coin, Efficiency, Network
false
Technology and Digital Transformation
Financial Services
Header Horizontal
JP Morgan
Add to my slides
Remove from favorites
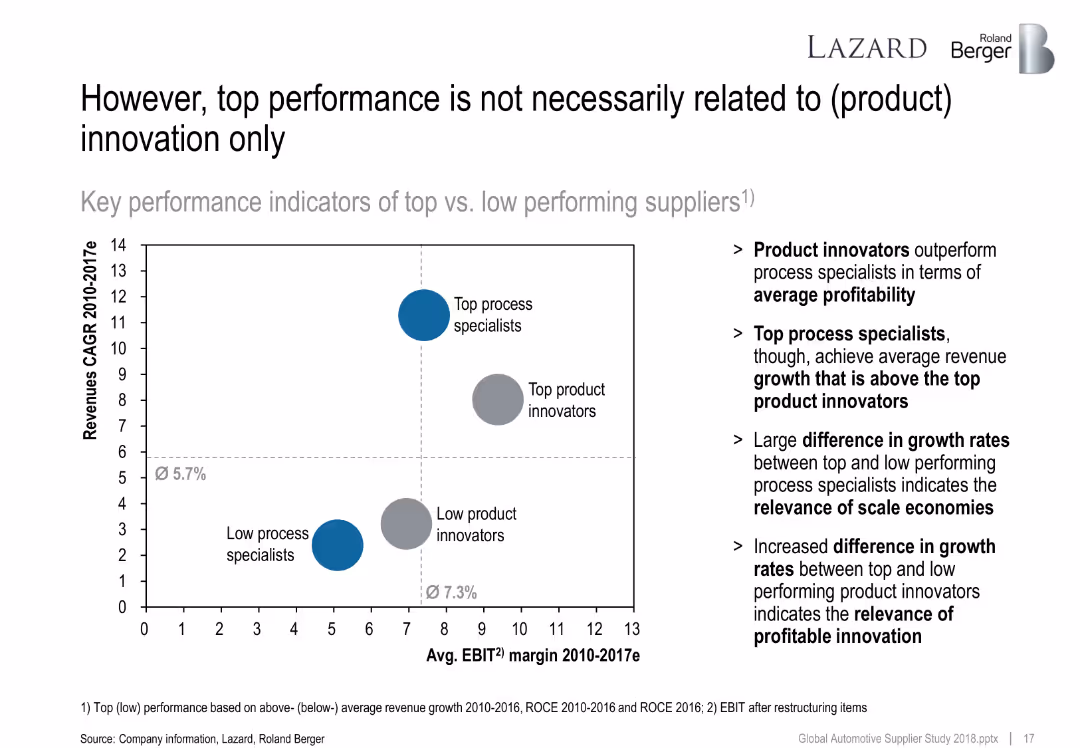
Bubble chart comparing revenue CAGR and EBIT margin of four supplier groups (top/low innovators and process specialists).
Financial Performance
Industrial & Manufacturing
Analyzes whether innovation is the sole driver of performance. Concludes that scale and execution also matter, with top process specialists sometimes outperforming in growth versus top innovators in profitability.
innovation, process specialist, profitability, scale economies, growth drivers
false
Financial Performance
Industrial & Manufacturing
Mixed Chart
Roland Berger
Add to my slides
Remove from favorites
This slide uses a white background and consists of four separate text blocks with large numeric highlights, each representing a key metric about innovative companies. Each block is distinctly bordered and uses a mix of bold green and dark grey fonts. There are no images, but the simplicity of the design clearly focuses on the numerical data presented. The design is straightforward, intending to facilitate quick comprehension of the data points.
Market Analysis and Trends
Financial Services
The slide presents statistical insights into how innovation contributes to company performance, including faster recovery and market valuation. It is useful for analyzing and discussing the financial benefits of innovation and how it can affect company leadership within the industry. Data on how industry leaders are shifting and the emergence of new disrupters provide a narrative of change and opportunity in the business landscape.
innovation, recovery, market valuation, leadership, disrupters, performance, statistics
false
Market Analysis and Trends
Financial Services
Pillar
BCG
Add to my slides
Remove from favorites
Bar charts detailing the creation of new roles over the past year and within the next 12 months, alongside their executive/non-executive levels.
Organizational Structure and Change
Professional Services
This slide analyzes the trend of creating new innovation roles within organizations, highlighting the distribution between executive and non-executive levels.
Innovation roles, organizations, trends, creation, executive, non-executive, structure, analysis, 12 months
false
Organizational Structure and Change
Professional Services
Multiple Chart
EY
Add to my slides
Remove from favorites
A column chart showing incremental sales growth from product innovation over several fiscal years, with a goal marker for FY19. The graph uses shades of blue and green to denote different years, with a simple, clean design.
Product and Service Analysis
Consumer Goods
Outlines Clorox's historical sales growth from innovation, setting a target for future growth. Useful in discussions on product development, innovation strategies, and financial forecasting.
innovation, sales growth, product development, Clorox, financial goals
false
Product and Service Analysis
Consumer Goods
Single Chart
Barclays
Add to my slides
Remove from favorites
Column chart showing likelihood ratios of being in the top 25% spenders on innovation related to network modernization efforts.
Investment Analysis
Telecommunications
Demonstrates the correlation between increased network modernization spending and higher innovation spending ratios among industry peers.
innovation spending, network modernization, industry ranking, competitive advantage, investment impact
false
Investment Analysis
Telecommunications
Mixed Chart
Accenture
Add to my slides
Remove from favorites
This minimalistic slide displays three bullet points highlighting the session's main topics: How we define innovation, Innovation operating model, and Culture of innovation. It uses simple icons and text against a geometric background.
Strategic Planning
Professional Services
Introduces the key focus areas of the presentation on innovation. This slide sets the stage for discussions on defining innovation, exploring an innovation operating model, and fostering a culture of innovation within organizations. Useful for strategic sessions focused on organizational development and innovation management.
Innovation, strategic planning, organizational culture, innovation management
false
Strategic Planning
Professional Services
Agenda
McKinsey
Add to my slides
Remove from favorites
Quadrant diagram categorizing 'Build', 'Buy', 'Invest', and 'Partner' strategies with a caption below.
Strategic Planning
Technology & Software
Discusses strategic approaches to fostering innovation, including building, buying, investing in, or partnering with other entities.
innovation, strategies, build, buy, invest, partner, business mix, dynamic approach
false
Strategic Planning
Technology & Software
Diagram
Goldman Sachs
Add to my slides
Remove from favorites
Three circular graphs with icons representing different aspects of strategic innovation.
Strategic Planning
Financial Services
Demonstrates the company's strategic pillars: position in the innovation economy, dynamic approach, and execution strength.
innovation, strategy, dynamic approach, execution strength, strategic pillars, innovation economy
false
Strategic Planning
Financial Services
Pillar
Goldman Sachs
Add to my slides
Remove from favorites
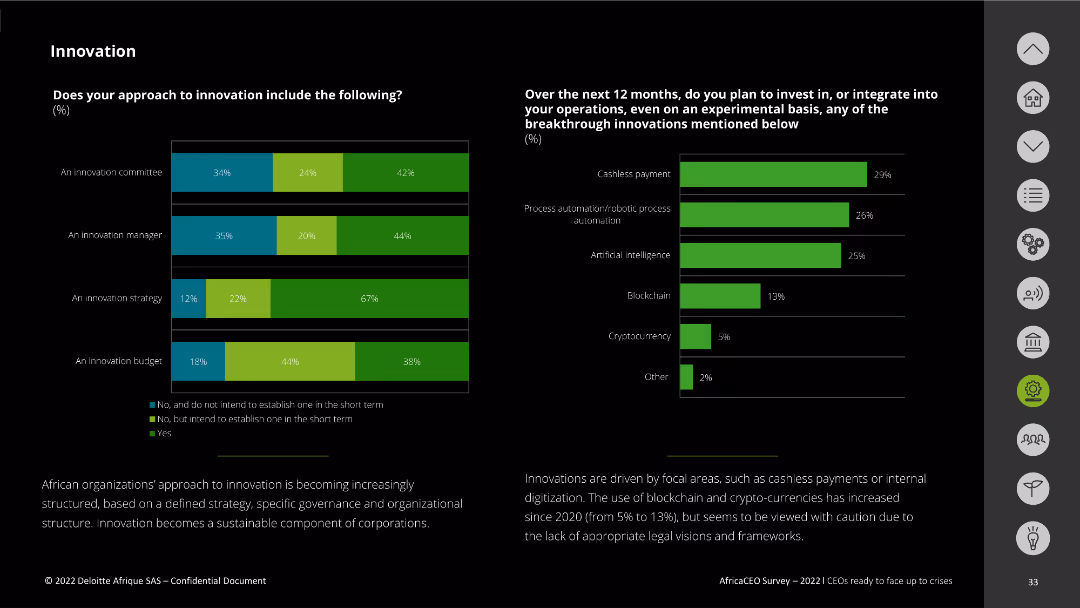
The slide includes two bar charts. The first chart shows the presence of innovation-related roles and strategies within companies. The second chart highlights planned investments in technological innovations over the next 12 months.
Technology and Digital Transformation
Technology & Software
This slide assesses the inclusion of innovation roles and strategies in companies and planned investments in technology such as cashless payments, process automation, AI, blockchain, and cryptocurrency. It highlights the strategic importance of innovation.
innovation, strategy, investment, technology, digital transformation
false
Technology and Digital Transformation
Technology & Software
Multiple Chart
Deloitte
Add to my slides
Remove from favorites
The slide uses a table and bar charts to present data on different innovation levers with activity levels and trends over time.
Sales and Business Development
Technology & Software
Discusses the optimization of innovation processes, highlighting key levers such as innovation strategy, new structures, and non-core innovations.
Innovation, Strategy, Optimization, Trends
false
Sales and Business Development
Technology & Software
Pillar
Roland Berger
Add to my slides
Remove from favorites
Slide divided into two sections with multiple circular graphics and a bar chart in shades of blue showing growth in innovation economy revenue.
Technology and Digital Transformation
Financial Services
Showcases JPMorgan Chase & Co.'s strategy and unique assets designed to serve the venture capital ecosystem, with a focus on innovation and supporting startups.
Innovation, Strategy, Venture Capital, Financial Services, Growth
false
Technology and Digital Transformation
Financial Services
Mixed Chart
JP Morgan
Add to my slides
Remove from favorites
This slide displays a combination of text blocks and data visualizations, including a growth multiplier and key investment areas. It's color-coded to distinguish between different technology focus areas.
Operational Efficiency
Technology & Software
It emphasizes the importance of leveraging technology for innovation, considering both existing and upcoming technological developments. This could aid in technology investment strategies.
Innovation, Technology, Investments, Digital Transformation, Deep Tech, Market Trends, Business Model, Development
false
Operational Efficiency
Technology & Software
Header Vertical
BCG
Add to my slides
Remove from favorites
Circular diagram showing different types of innovation (Offering, Configuration, Experience) and their subtypes. Text describes how innovation combines inventions with market penetration.
Technology and Digital Transformation
Technology & Software
The slide categorizes different types of innovation, including product offering, configuration, and customer experience innovations. It emphasizes the importance of combining technological breakthroughs with successful market penetration to drive economic growth and competitive advantage.
Innovation, Technology, Market Penetration
false
Technology and Digital Transformation
Technology & Software
Diagram
Roland Berger
Add to my slides
Remove from favorites
The slide is divided into two columns with a dark background and a green bar on the left side for the section title "Summary." The right column contains text in white and green, highlighting various points under the headers "The Race for Innovation" and "Innovation options." The design is clean, and there is an effective use of bold text and bullet points to organize information hierarchically, making it easy to scan and digest.
Strategic Planning
Technology & Software
This summary slide synthesizes the innovation trends and options companies are pursuing. It is used to encapsulate the core messages of the presentation, focusing on companies' abilities to adapt and innovate in response to COVID-19, the decline of incumbent advantages, and strategic innovation directions. The slide provides a quick overview and is likely intended to precede a more in-depth discussion on these topics.
innovation trends, options, COVID-19 adaptation, incumbent decline, strategic focus
false
Strategic Planning
Technology & Software
Agenda
BCG
Add to my slides
Remove from favorites
The slide displays column charts detailing the preferences for in-person interactions at car dealerships for purchasing cars, segmented by age groups across various countries (US, UK, Germany, France, Italy, China, Japan).
Market Analysis and Trends
Transportation & Logistics
Explores demographic differences in preferences for in-person interactions at car dealerships during vehicle purchases, providing insights into consumer behavior across age groups.
in-person, dealerships, bar chart, demographic analysis, car purchases, international
false
Market Analysis and Trends
Transportation & Logistics
Multiple Chart
McKinsey
Add to my slides
Remove from favorites
The slide includes text boxes and icons describing the primary end markets and demand drivers for in-plant services, focusing on refinery, petrochemical, automotive, and power generation.
Market Analysis and Trends
Industrial & Manufacturing
It discusses the near-term challenges and long-term outlook for in-plant services, particularly in refinery, petrochemical, and automotive sectors.
In-plant, services, refinery, petrochemical, automotive, challenges, long-term, near-term, markets
false
Market Analysis and Trends
Industrial & Manufacturing
Table
LEK
Add to my slides
Remove from favorites
Horizontal bar chart split by industry and color-coded to show input cost components (labor, energy, materials, purchased services) for Dec '23 and Dec '24.
Operational Efficiency
Industrial & Manufacturing
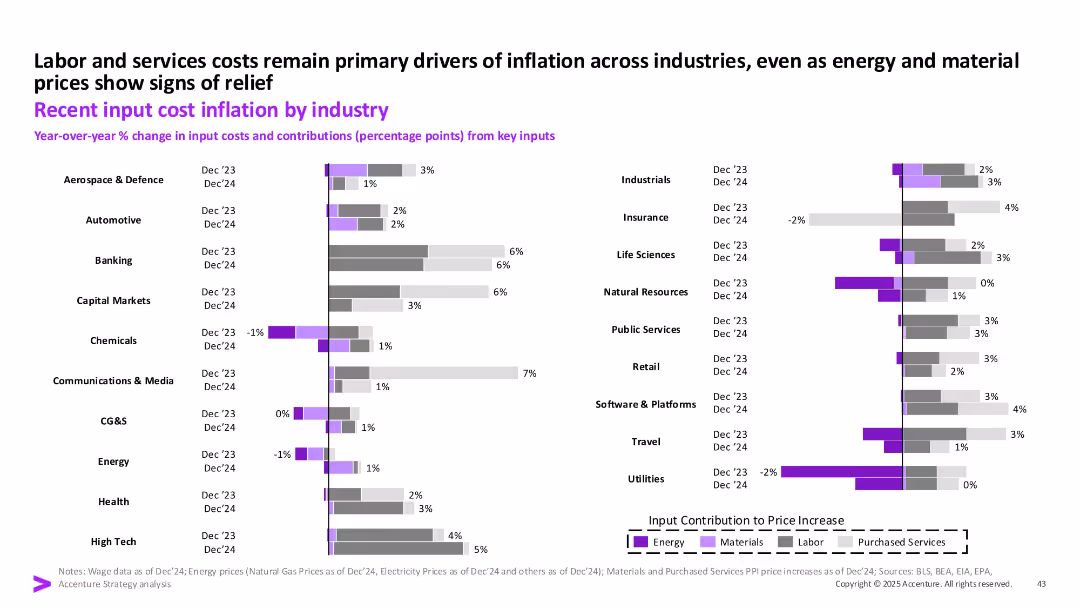
This slide shows year-over-year input cost inflation across multiple industries, indicating labor and services costs as the primary inflation drivers. Energy and materials show mixed trends. Retail, Banking, and Communications show notable increases in purchased services and labor cost components.
input cost, labor, energy, inflation, industry, materials, purchased services, 2024
false
Operational Efficiency
Industrial & Manufacturing
Single Chart
Accenture
Add to my slides
Remove from favorites
Three forecast triangle graphs on the left (raw materials, subsystems, labor), supported by text; right image shows metal cutting machine with sparks.
Pricing Strategies
Industrial & Manufacturing
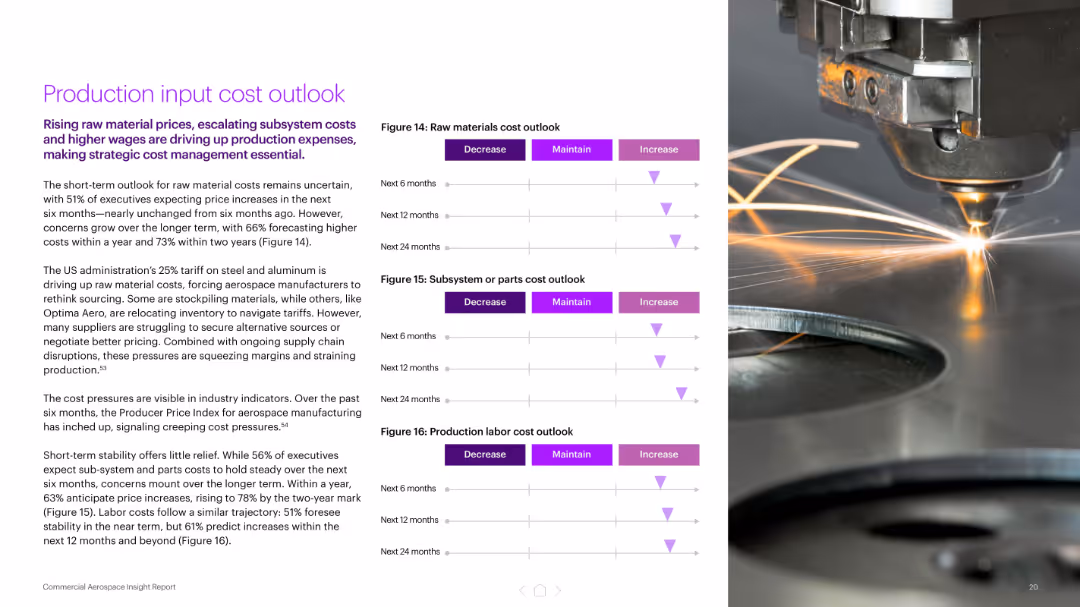
Covers escalating costs for raw materials, subsystems, and labor due to tariffs, supply shortages, and inflation. Emphasizes the need for cost management amid rising production expenses.
input cost, raw materials, aerospace pricing, production cost, tariffs, labor costs, subsystems, inflation
false
Pricing Strategies
Industrial & Manufacturing
Mixed Chart
Accenture
Add to my slides
Remove from favorites
This slide shows a column chart comparing year-over-year changes in input costs and contributions from key inputs like energy, materials, labor, and purchased services across different industries. Industries include aerospace & defense, automotive, and banking among others. Commentary provides context.
Operational Efficiency
Energy & Utilities
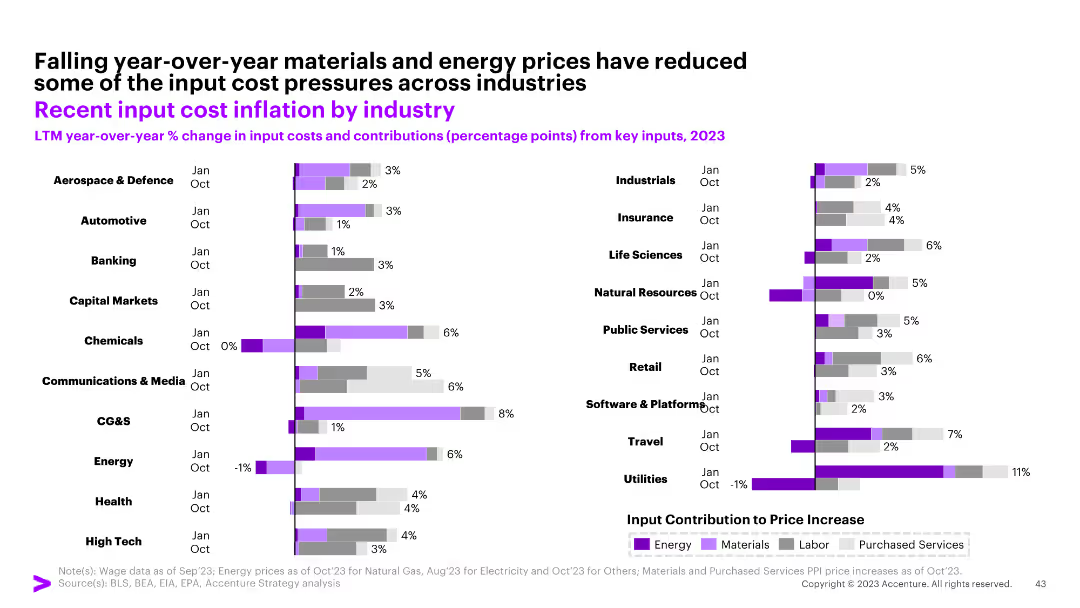
The slide analyzes input cost inflation across various industries, highlighting the significant impact of energy and commodity prices. It shows the contribution of different inputs to overall cost increases and compares trends across sectors like aerospace, automotive, and banking.
input costs, inflation, energy, commodities, industries, trends
false
Operational Efficiency
Energy & Utilities
Multiple Chart
Accenture
Add to my slides
Remove from favorites
The slide includes a bar chart showing year-over-year changes in input costs and contributions from key inputs for various industries, with a legend explaining the colors.
Financial Performance
Industrial & Manufacturing
The slide details the input cost inflation by industry, highlighting the contributions of energy, materials, and labor to overall cost changes.
input costs, inflation, industry, energy, materials
false
Financial Performance
Industrial & Manufacturing
Multiple Chart
Accenture
Add to my slides
Remove from favorites
Horizontal bar chart segmented by industry and key cost drivers (Energy, Materials, Labor, Services); two bars per industry (Mar ‘24/’25)
Operational Efficiency
Industrial & Manufacturing
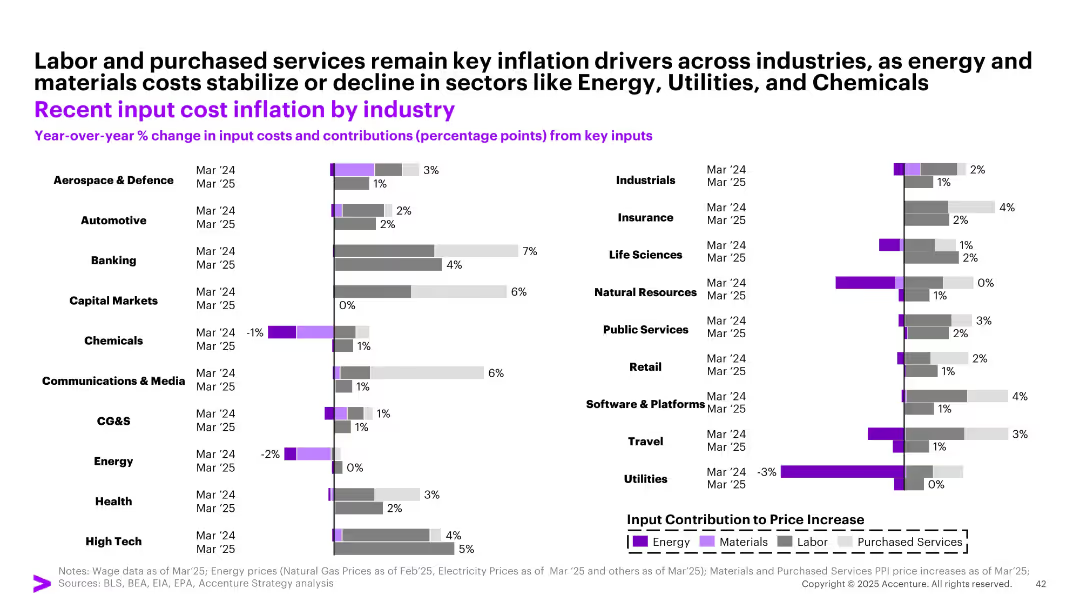
The slide details year-over-year changes in input costs for different industries as of March 2024 and March 2025. Key inflation drivers such as labor and purchased services remain dominant, while energy and materials costs have declined in sectors like Utilities, Chemicals, and Energy.
input costs, inflation, labor, services, industries, 2025, chemicals, utilities, manufacturing
false
Operational Efficiency
Industrial & Manufacturing
Single Chart
Accenture
Add to my slides
Remove from favorites
Slide with headers and structured bullet points on one side and a flow diagram on the other, with a red and black design theme.
Financial Performance
Industrial & Manufacturing
Describes the Input-Output modeling used to assess the Tempest program's economic contribution to the UK supply chain.
Input-Output analysis, supply chain, GVA, employment, Tempest, economic contribution, UK
false
Financial Performance
Industrial & Manufacturing
Diagram
PwC/Strategy&
Add to my slides
Remove from favorites
The slide features a prominent table showing the relationship between different economic sectors and a header explaining the table's purpose.
Financial Performance
Industrial & Manufacturing
Illustrates how an Input-Output table can be used to understand sector requirements for producing output in an economy.
Input-Output table, economic sectors, agriculture, manufacturing, financial services, output, data analysis
false
Financial Performance
Industrial & Manufacturing
Table
PwC/Strategy&
Add to my slides
Remove from favorites
Tabulated data providing insights into the input provider market with graphs indicating market size, growth, and segmentation.
Investment Analysis
Agriculture & Food Production
Focuses on input provider markets in agriculture, analyzing market sizes, growth, and key issues for fertilizers, seeds, chemicals, and equipment.
input provider market, agriculture, fertilizers, seeds, chemicals, equipment, market analysis
false
Investment Analysis
Agriculture & Food Production
Table
EY
Add to my slides
Remove from favorites
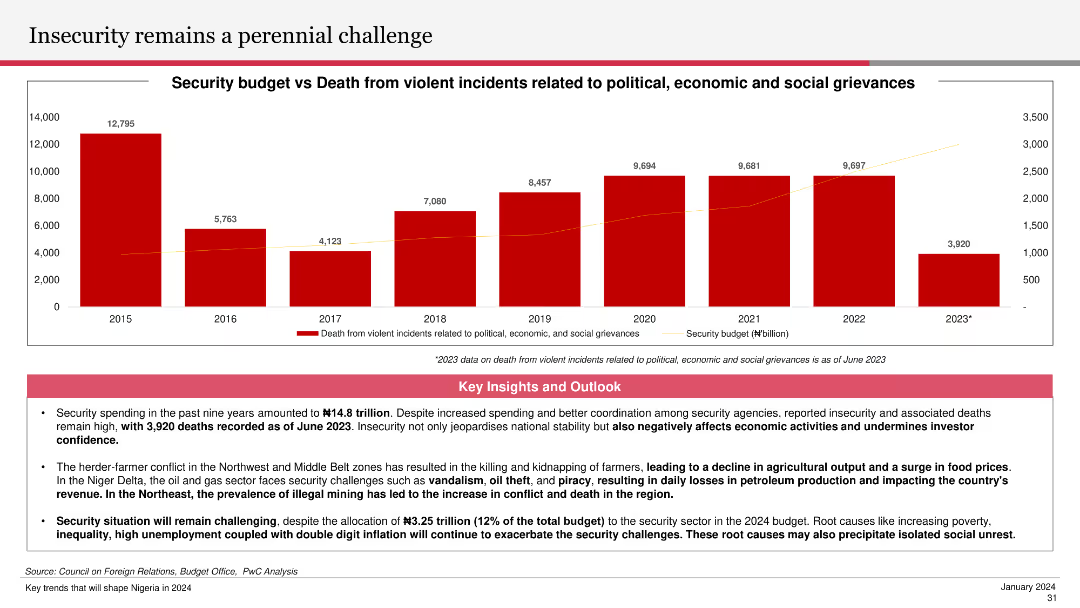
The slide features a column chart showing the security budget versus deaths from violent incidents from 2015 to 2023. Key insights and outlooks below the chart discuss the impact of insecurity on economic activities and investor confidence.
Risk Assessment and Management
Government & Public Sector
The slide highlights the ongoing security challenges and their economic implications, detailing the trend in security budgets and related deaths. It emphasizes the importance of addressing security issues to improve investor confidence and economic stability.
insecurity, security budget, violent incidents, economic impact, investor confidence
false
Risk Assessment and Management
Government & Public Sector
Mixed Chart
PwC/Strategy&
Add to my slides
Remove from favorites
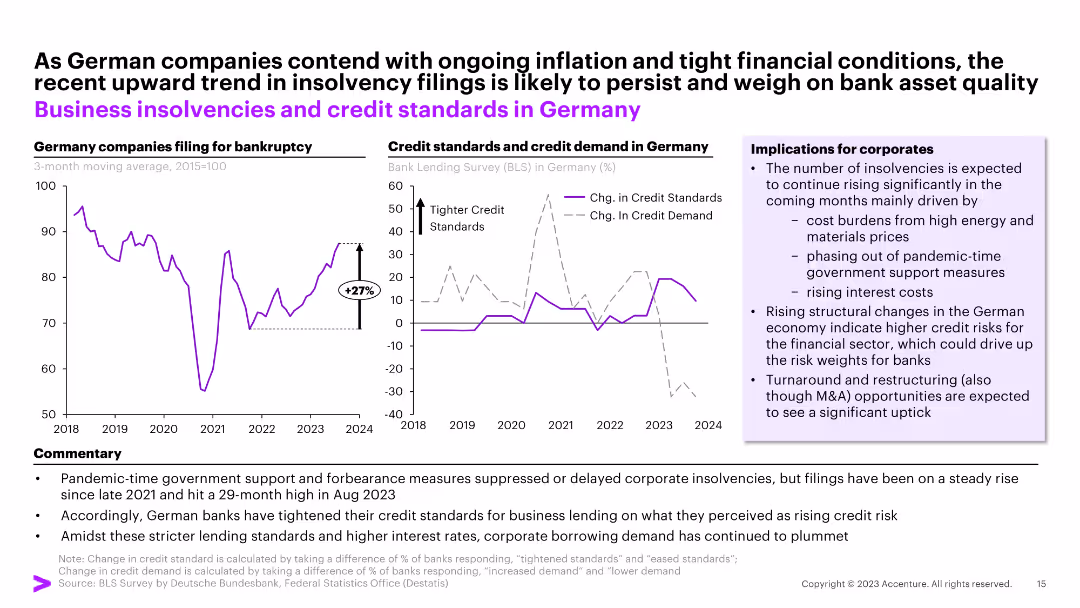
The slide includes a line chart showing the trend in German company bankruptcies and a column chart on credit standards and demand. Commentary and implications for corporates are provided.
Risk Assessment and Management
Financial Services
The slide analyzes the rise in business insolvencies and tightening credit standards in Germany. It discusses the implications for corporate borrowing and financial stability.
insolvencies, credit standards, Germany, financial stability, corporate risk
false
Risk Assessment and Management
Financial Services
Multiple Chart
Accenture
Add to my slides
Remove from favorites
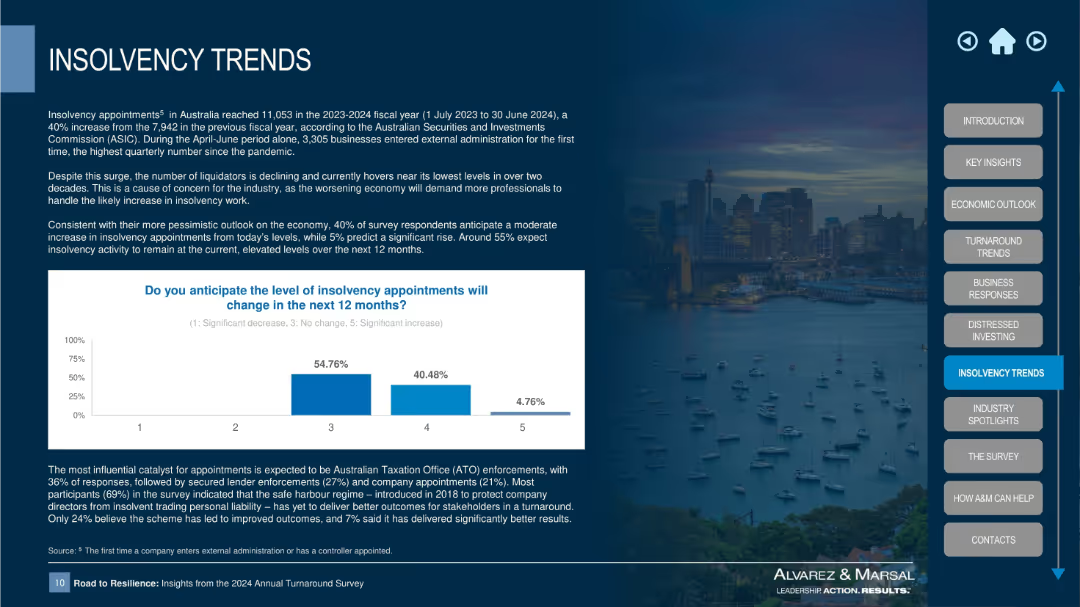
Clean layout with bar chart centered on bottom half, supporting text on top-left, background image of cityscape and sidebar navigation
Risk Assessment and Management
Financial Services
This slide presents insolvency trends in Australia, showing a significant rise in appointments in FY2023–24. It includes survey results about expected changes and insights into the causes, such as ATO enforcements and lack of liquidators. It also discusses the impact of the safe harbour regime.
insolvency, appointments, ATO enforcement, safe harbour, survey, liquidation, financial distress, regulatory impact, economic outlook
false
Risk Assessment and Management
Financial Services
Mixed Chart
Alvarez & Marsal
Add to my slides
Remove from favorites
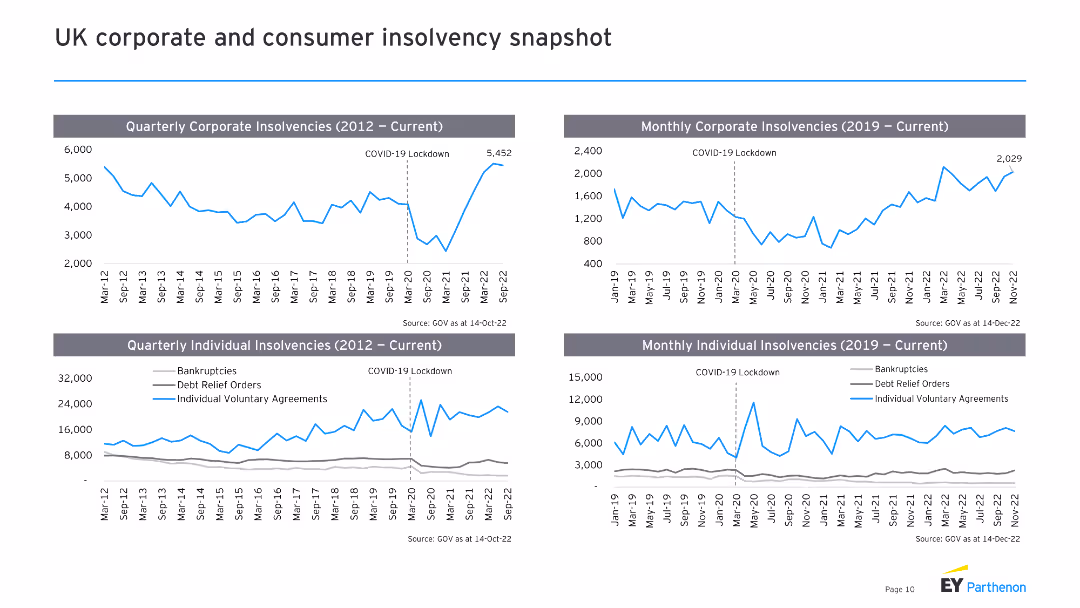
The slide includes four line charts, showing quarterly and monthly corporate and individual insolvencies in the UK over different time periods.
Market Analysis and Trends
Financial Services
This slide examines insolvency trends in the UK, comparing corporate and individual insolvencies, useful for assessing economic health and risk factors.
insolvency, corporate, individual, UK, trends
false
Market Analysis and Trends
Financial Services
Multiple Chart
EY
Add to my slides
Remove from favorites
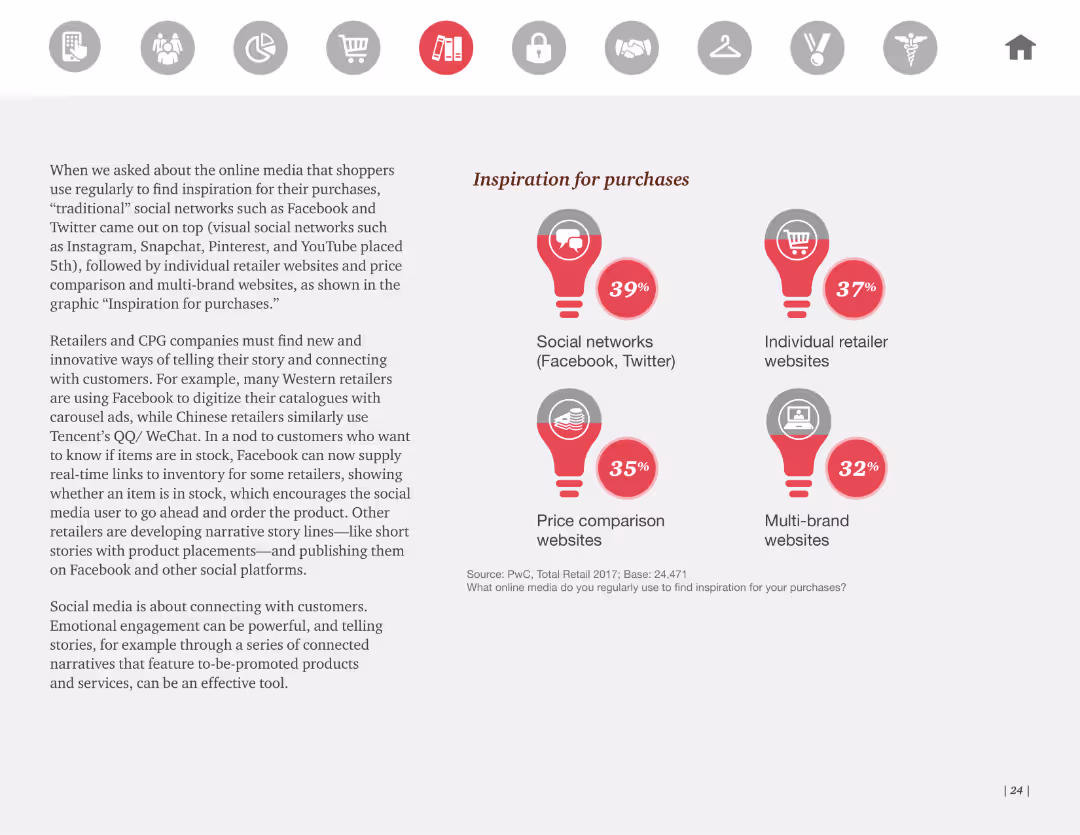
Text with pie charts illustrating sources of inspiration for purchases, such as social networks, retailer websites, price comparison sites, and multi-brand websites.
Customer and Market Segmentation
Retail & E-commerce
The slide analyzes where consumers find inspiration for purchases, highlighting the role of social networks and retailer websites. Useful for customer and market segmentation strategies.
inspiration, purchases, social networks, websites
false
Customer and Market Segmentation
Retail & E-commerce
Mixed Chart
PwC/Strategy&
Add to my slides
Remove from favorites
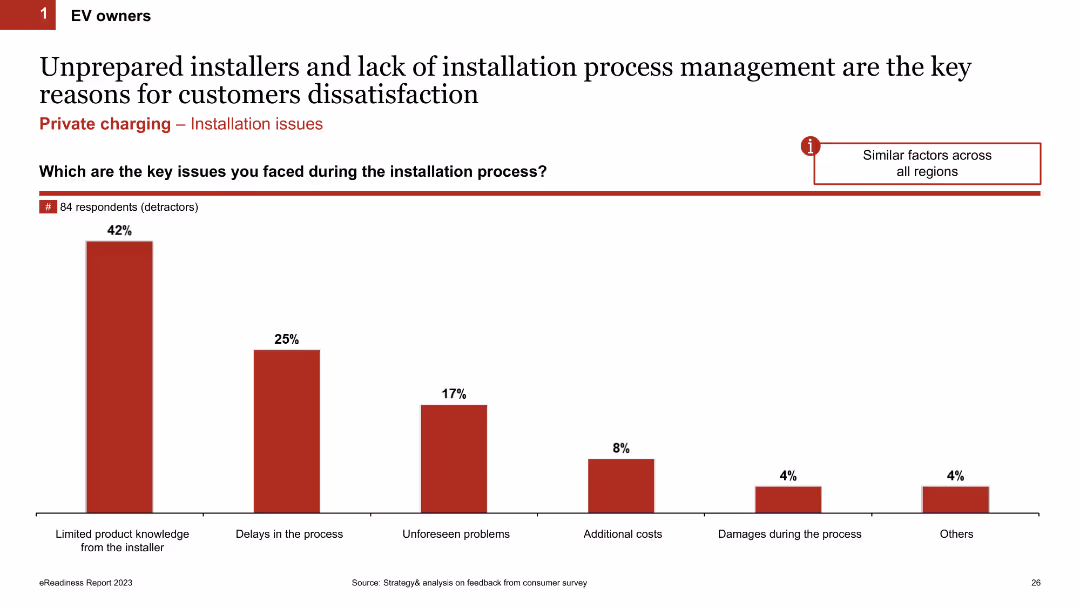
Column chart displaying key issues faced during the installation process. Factors include limited product knowledge, delays, unforeseen problems, additional costs, and damages. The slide uses red bars and percentages to present data.
Operational Efficiency
Transportation & Logistics
This slide identifies the main issues EV owners face during the charging installation process, highlighting problems like unprepared installers, delays, unforeseen issues, and additional costs.
installation issues, customer dissatisfaction, process management, EV owners, charging installation
false
Operational Efficiency
Transportation & Logistics
Single Chart
PwC/Strategy&
Add to my slides
Remove from favorites
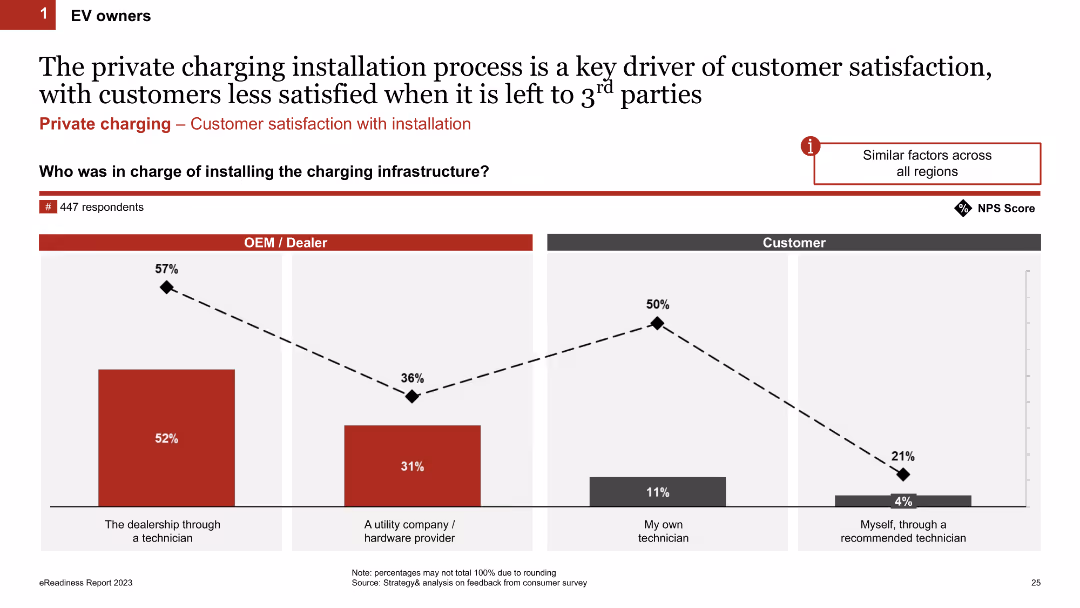
Column chart comparing satisfaction levels based on who installed the charging infrastructure (OEM/Dealer, Utility company, own technician, or self-installation). The chart uses percentages and a Net Promoter Score (NPS) line graph to show satisfaction.
Customer and Market Segmentation
Transportation & Logistics
This slide compares customer satisfaction levels with the charging installation process, showing higher satisfaction when the customer installs it themselves or through a recommended technician compared to other methods.
installation process, customer satisfaction, charging infrastructure, NPS, EV owners
false
Customer and Market Segmentation
Transportation & Logistics
Single Chart
PwC/Strategy&
Add to my slides
Remove from favorites
The slide shows smartphone images depicting payment plans, alongside a list and checkmarks. The design is straightforward with visual examples for context.
Operational Efficiency
Financial Services
Explains new strategies for installment lending and capabilities, shown with actual interface examples. Appropriate for operational strategy updates or tech feature introductions.
installment lending, digital solutions, operational strategy, payment plans
false
Operational Efficiency
Financial Services
Graphic
JP Morgan
Add to my slides
Remove from favorites
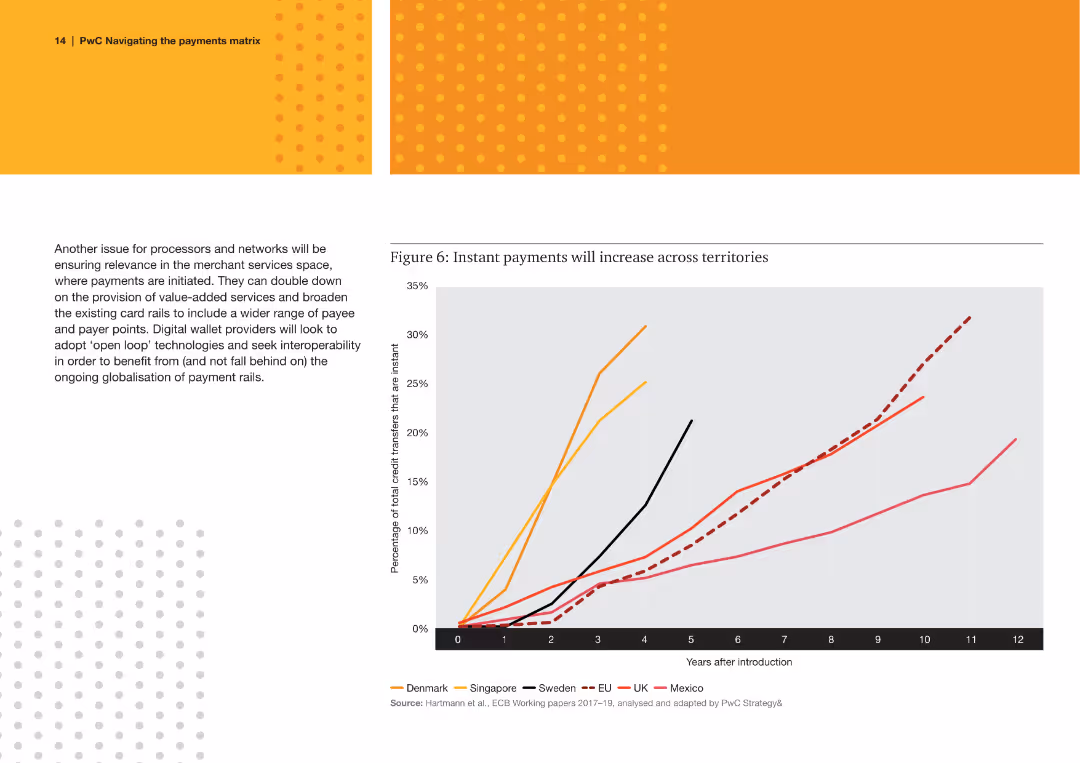
A line chart showing the increase in the percentage of total credit transfers that are instant across several countries over time.
Technology and Digital Transformation
Financial Services
The slide discusses the growth of instant payment systems in different countries, emphasizing the trend towards faster payment methods.
instant payments, credit transfers, countries, growth, trend, faster payments, systems
false
Technology and Digital Transformation
Financial Services
Mixed Chart
PwC/Strategy&
Add to my slides
Remove from favorites
Horizontal bar chart showing agreement with increased respect for global institutions if democratic nations have more influence.
Strategic Planning
Government & Public Sector
This slide displays public sentiment in 30 countries regarding trust in global institutions. A majority agree that democratic control increases respect, but trust has declined from 2023, especially in the U.S. and Canada.
institutions, democracy, global governance, influence, trust
false
Strategic Planning
Government & Public Sector
Mixed Chart
IPSOS
Add to my slides
Remove from favorites
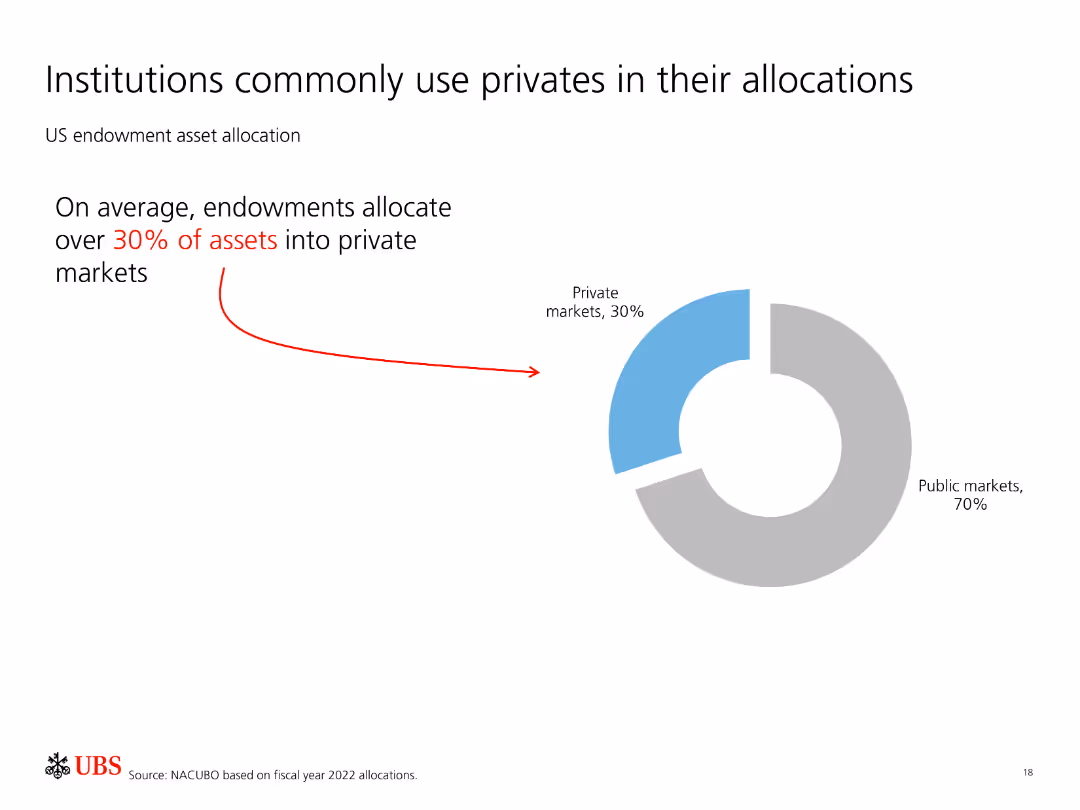
Features a pie chart showing US endowment asset allocation with 30% in private markets and 70% in public markets.
Investment Analysis
Financial Services
Indicates that institutions, particularly endowments, allocate a significant portion of their assets (30%) to private markets, demonstrating confidence in their performance.
Institutions, private markets, asset allocation, endowments, investment strategy
false
Investment Analysis
Financial Services
Mixed Chart
UBS
Add to my slides
Remove from favorites
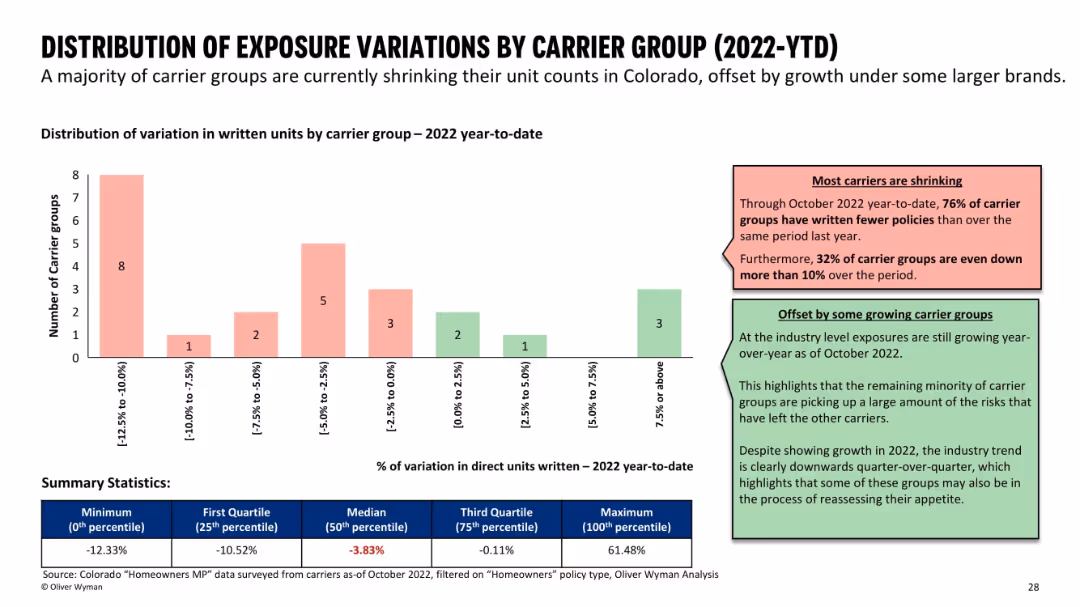
Bar chart grouped by unit variation ranges; supported by color-coded comments and summary stats at the bottom.
Risk Assessment and Management
Financial Services
Analyzes changes in written units by carrier groups in 2022. Most carriers are shrinking, with 76% reducing exposure, while a few are growing. A summary table shows statistics like median and quartile values for unit variation percentages.
insurance carriers, exposure variation, market trends, growth vs shrinkage
false
Risk Assessment and Management
Financial Services
Mixed Chart
Oliver Wyman
Add to my slides
Remove from favorites
Features a process flow diagram illustrating the expected reductions in core insurance competencies and increased data science roles in hybrid teams.
Operational Efficiency
Financial Services
Discusses the medium-term expectations for insurance competencies, focusing on automation, data science roles, and hybrid teams.
Insurance competencies, Hybrid teams, Data science, Automation, Medium-term expectations
false
Operational Efficiency
Financial Services
Pillar
EY
Add to my slides
Remove from favorites
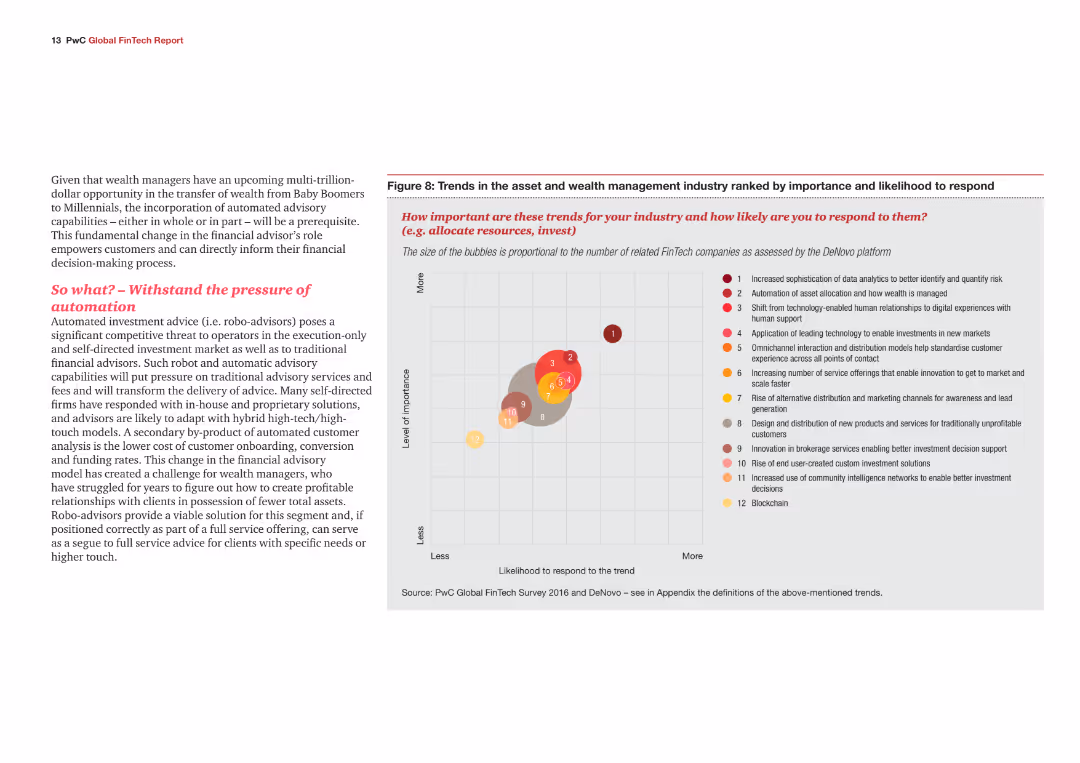
The slide features a bubble chart and text. The bubble chart shows trends ranked by importance and likelihood to respond.
Market Analysis and Trends
Financial Services
The slide highlights key trends in the insurance industry, including self-directed services and usage-based insurance.
Insurance, data analytics, trends, self-directed services, usage-based insurance
false
Market Analysis and Trends
Financial Services
Mixed Chart
PwC/Strategy&
Add to my slides
Remove from favorites
Contains several bar charts and a remarks section. Charts display respondents' age, years worked in the industry by line of business, and detailed remarks about workforce age and tenure.
Market Analysis and Trends
Financial Services
Detailed demographic analysis of insurance industry respondents segmented by line of business, offering insights into the age and tenure of workers in personal, commercial, and specialty lines.
insurance, demographics, business lines, age distribution, tenure, personal lines, commercial lines, specialty lines
false
Market Analysis and Trends
Financial Services
Multiple Chart
Accenture
Add to my slides
Remove from favorites
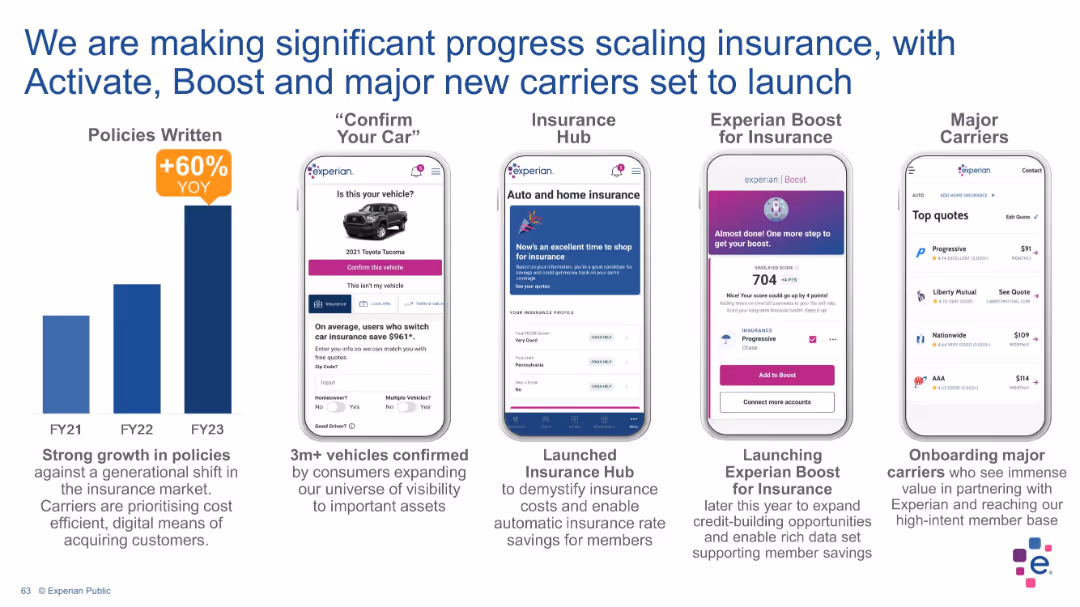
Horizontally aligned panels with bar chart on the left and four mobile screen mockups on the right; includes product feature highlights and YOY growth stat.
Product and Service Analysis
Financial Services
This slide showcases Experian’s insurance-related digital products and highlights a 60% YoY growth in policy volume. Features like “Confirm Your Car,” “Insurance Hub,” “Boost for Insurance,” and carrier onboarding illustrate digital innovation, consumer utility, and market adoption.
insurance, digital innovation, Experian Boost, growth, policy volume, mobile platform, customer acquisition, auto insurance, product launch, financial tech
false
Product and Service Analysis
Financial Services
Mixed Chart
Barclays
Add to my slides
Remove from favorites
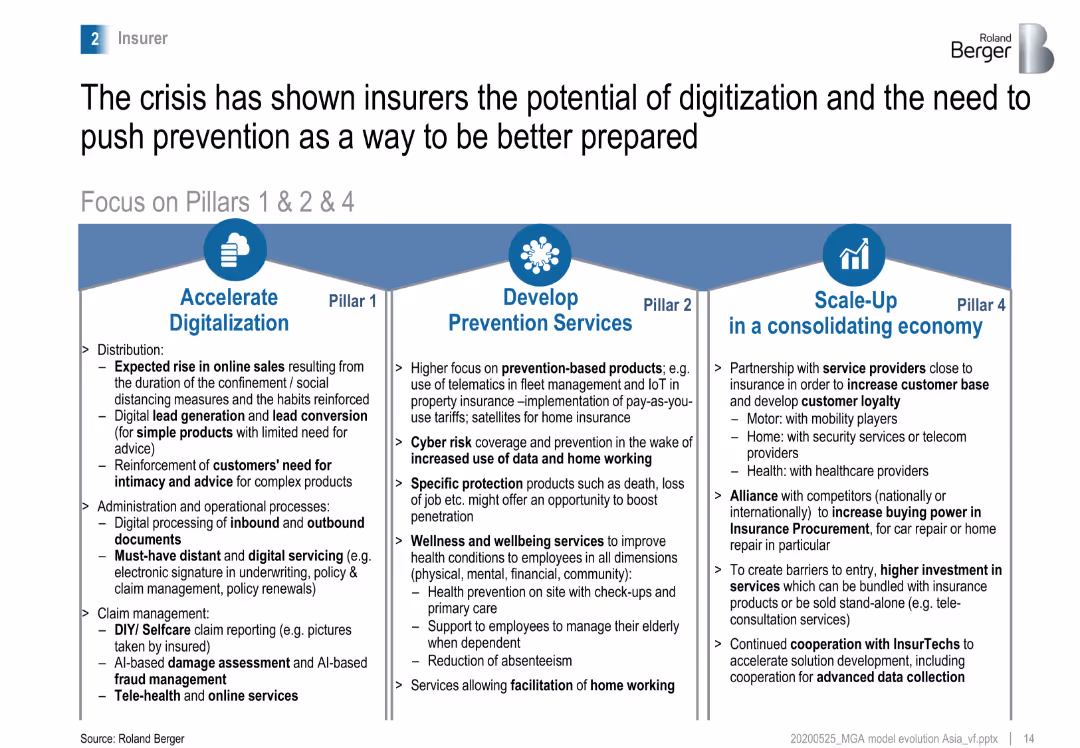
Flowchart focusing on three pillars: Accelerate Digitalization, Develop Prevention Services, and Scale-Up in a consolidating economy, with detailed steps for each pillar.
Strategic Planning
Financial Services
Analyzes how the crisis highlighted the importance of digitalization and prevention for insurers, providing strategies to enhance digital lead generation, cyber risk coverage, and partnerships.
insurance, digitalization, prevention, crisis, strategies
false
Strategic Planning
Financial Services
Pillar
Roland Berger
Add to my slides
Remove from favorites
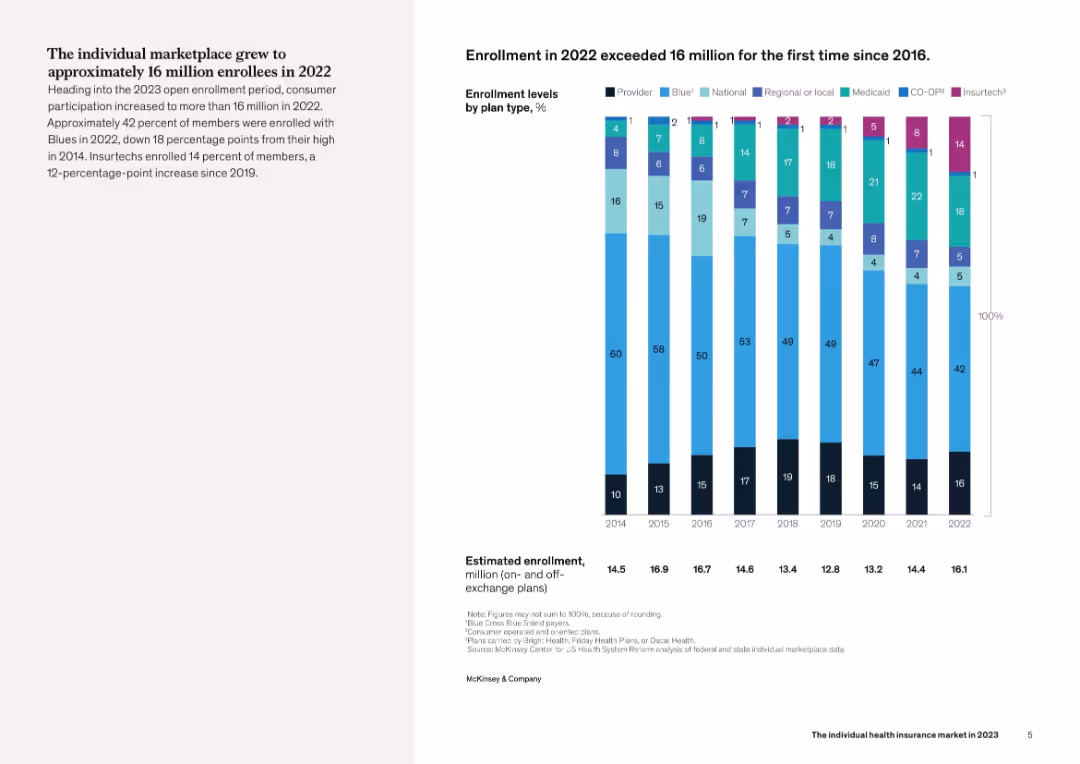
Left side has summary text; right side displays a vertical stacked bar chart showing enrollment levels by plan type from 2014 to 2022. Uses a clean visual with multiple plan types color-coded.
Industry Overview
Healthcare & Pharmaceuticals
This slide analyzes growth in the U.S. individual health insurance marketplace, noting that enrollment exceeded 16 million in 2022 for the first time since 2016. It also highlights changes in market composition, such as the decline in "Blue" plans and increase in Insurtech participation.
insurance, enrollment, health plans, insurtech, Blues, healthcare
false
Industry Overview
Healthcare & Pharmaceuticals
Mixed Chart
McKinsey
Add to my slides
Remove from favorites
Slide features a world map with colored regions depicting the percentage breakdown of Lloyd's business by region.
Market Analysis and Trends
Financial Services
This slide presents a regional breakdown of Lloyd's insurance business, detailing percentages across various global regions with specific focus on reinsurance, property, casualty, and other sectors.
Insurance, Global, Breakdown, Regions, Business
false
Market Analysis and Trends
Financial Services
Graphic
PwC/Strategy&
Add to my slides
Remove from favorites
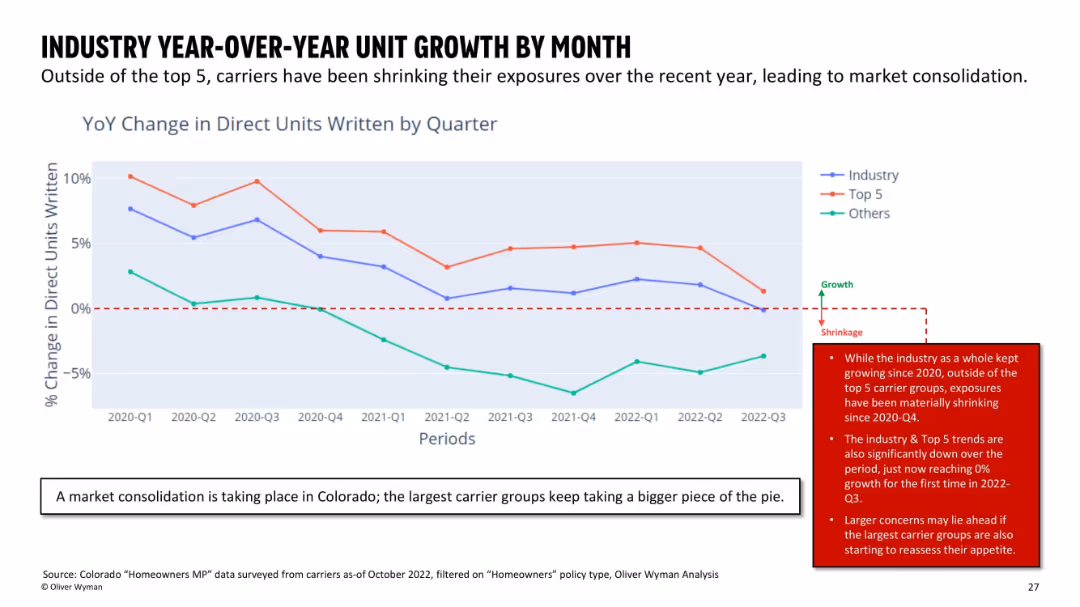
Line graph displaying trends from 2020 to 2022 for "Industry," "Top 5," and "Others" in terms of direct unit growth, with annotations and callouts.
Strategic Planning
Financial Services
Shows market consolidation trends in Colorado’s insurance market. While the top 5 carriers have maintained growth, other carriers have declined in unit growth since late 2020. Highlights inflection point at 2022-Q3 where industry growth hits 0%.
insurance industry, market consolidation, unit growth, Colorado, trendline
false
Strategic Planning
Financial Services
Mixed Chart
Oliver Wyman
Add to my slides
Remove from favorites
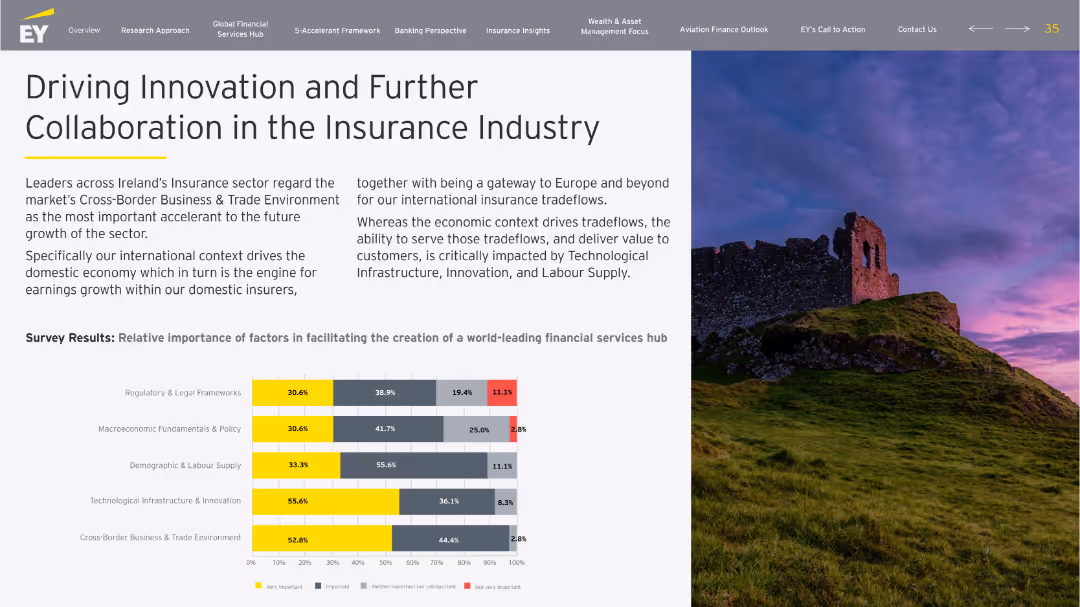
Split-screen with large title and paragraph on left, photo on right. Bottom third includes a horizontal stacked bar chart comparing importance ratings of FS accelerants from insurance industry perspective.
Strategic Planning
Financial Services
Highlights the insurance sector’s emphasis on cross-border trade and innovation. Presents how different factors rank in importance to stakeholders, with tech and trade environment ranking highest. Encourages future innovation and talent collaboration.
insurance, innovation, collaboration, accelerants, trade, talent
false
Strategic Planning
Financial Services
Mixed Chart
EY
Add to my slides
Remove from favorites
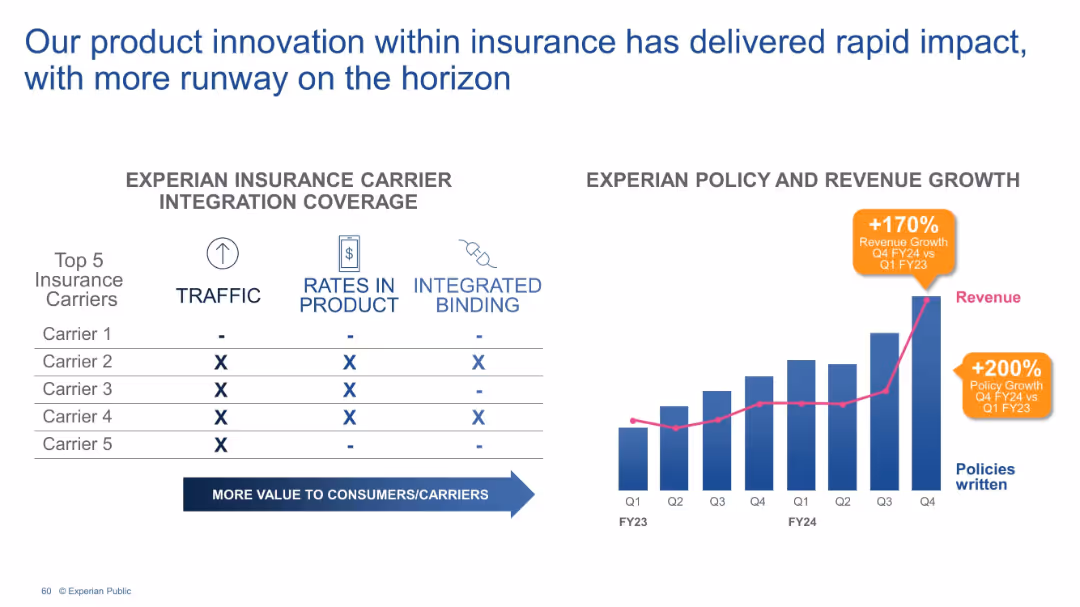
Split layout: Left side shows a table comparing integration across 5 carriers (columns: traffic, rates, binding); right side shows a bar & line chart.
Performance Metrics and KPIs
Financial Services
The slide highlights integration progress with top insurance carriers and correlates it with policy and revenue growth. It reports a 170% increase in revenue and 200% policy growth from Q1 FY23 to Q4 FY24, underscoring product innovation impact.
insurance, integration, carriers, policy growth, revenue, FY24, traffic
false
Performance Metrics and KPIs
Financial Services
Mixed Chart
Barclays
Add to my slides
Remove from favorites
The slide shows a color-coded map of Europe highlighting various insurance companies' presence in multiple countries, accompanied by a list of company names per region.
Market Analysis and Trends
Financial Services
Provides a visual representation of insurance market presence across Europe, identifying key players in various countries to analyze market expansion and strategic positioning.
insurance market, Europe, company distribution, strategic analysis
false
Market Analysis and Trends
Financial Services
Graphic
PwC/Strategy&
Add to my slides
Remove from favorites
The slide presents a blue and white color scheme with multiple charts and a detailed sidebar explaining economic impacts. It features a column chart showing the economic benefits from 2018 to 2020, and flow diagrams outlining benefits for different user groups.
Market Analysis and Trends
Financial Services
This slide analyzes the economic impacts of Copernicus satellite data on the insurance industry regarding natural disasters, highlighting its growing importance in risk assessment and policy pricing.
insurance, natural disasters, economic impacts, satellite data, Copernicus
false
Market Analysis and Trends
Financial Services
Mixed Chart
PwC/Strategy&
Add to my slides
Remove from favorites
Two column charts depict online insurance purchase growth, with color differentiation for types of insurance and growth rate annotations. A segmented header with active tabs, and the overall design is clean with a balance between visuals and text.
Market Analysis and Trends
Financial Services
This slide analyzes the shift from traditional to online channels for purchasing insurance, highlighting growth in the sector and specific areas like general, health, and life insurance, with projections for future trends.
insurance, online, growth, health, life, CAGR
false
Market Analysis and Trends
Financial Services
Mixed Chart
Bain
Add to my slides
Remove from favorites
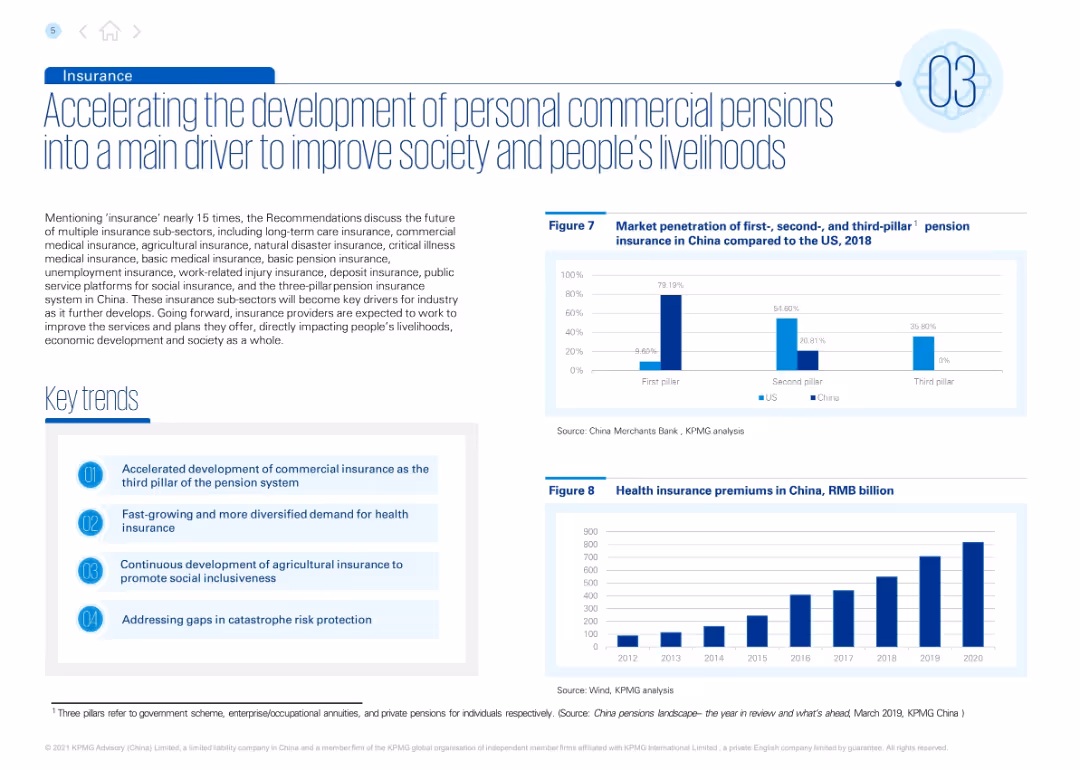
Clean white and blue layout, with two bar charts and a list of four key trends. Highlights insurance sector shifts and comparisons with U.S. pension penetration.
Strategic Planning
Financial Services
Examines the insurance landscape under China’s 14th FYP, especially the development of personal commercial pensions. It compares penetration rates with the U.S. and tracks growth in health insurance premiums.
insurance, pensions, health insurance, China FYP, commercial insurance, retirement, risk protection
false
Strategic Planning
Financial Services
Multiple Chart
KPMG
Add to my slides
Remove from favorites
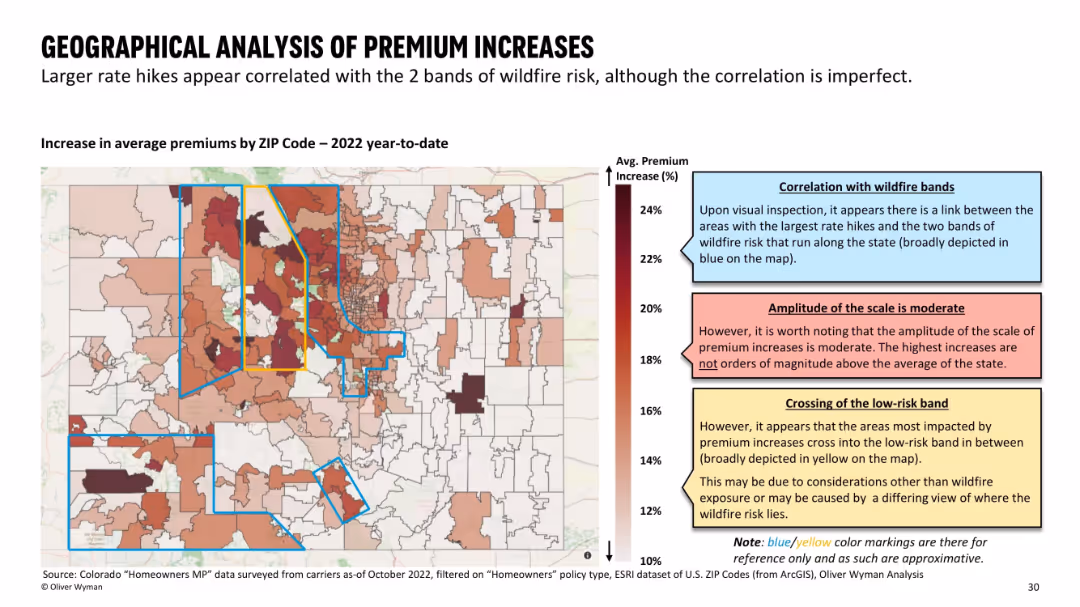
Heatmap showing ZIP code-level premium increases (2022 YTD), overlaid with blue/yellow outlines referencing wildfire risk bands.
Pricing Strategies
Financial Services
Shows regional variations in insurance premium increases and draws a correlation with wildfire risk bands. While high-risk areas tend to see higher increases, the overall magnitude remains moderate. Maps both high-risk and low-risk overlap.
insurance premium, wildfire correlation, ZIP code analysis, Colorado
false
Pricing Strategies
Financial Services
Mixed Chart
Oliver Wyman
Add to my slides
Remove from favorites
A column and a pie chart analyzing consumer interest in purchasing insurance directly from vehicle manufacturers, presented in a clear and direct format.
Strategic Planning
Transportation & Logistics
This slide explores consumer interest in purchasing vehicle insurance directly from manufacturers, indicating potential market shifts and opportunities for OEMs to disrupt traditional insurance models.
Insurance purchasing, OEM strategy, consumer interest, market disruption
false
Strategic Planning
Transportation & Logistics
Multiple Chart
Deloitte
Add to my slides
Remove from favorites
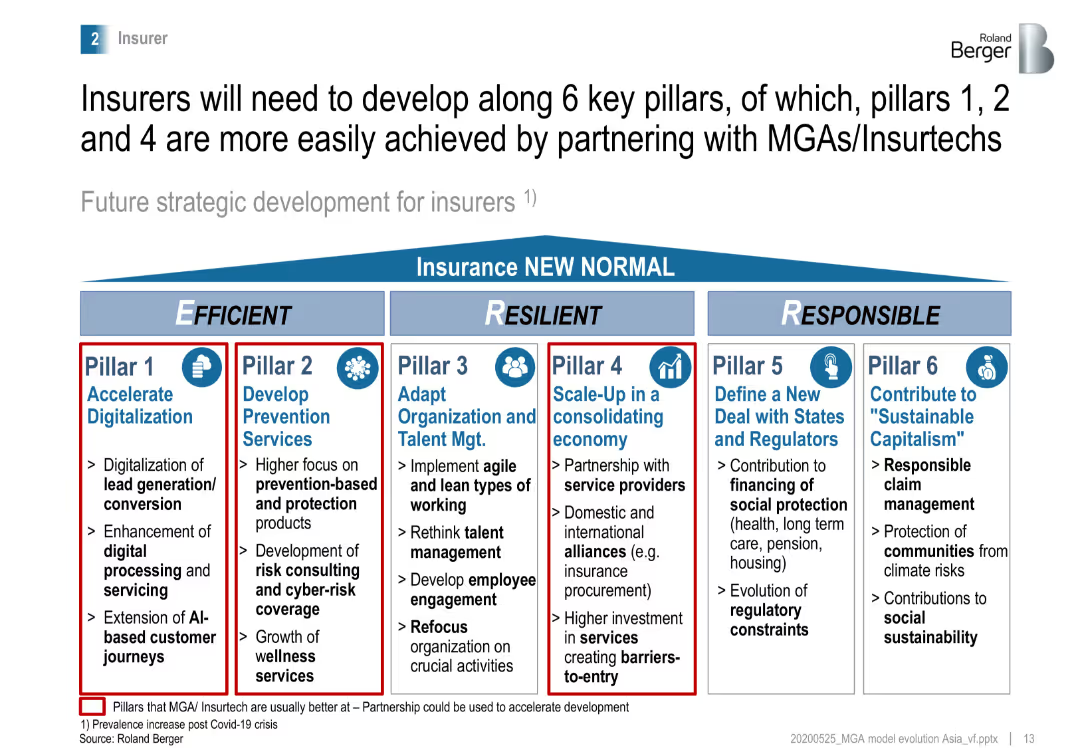
Matrix highlighting six key pillars for insurers: Accelerate Digitalization, Develop Prevention Services, Adapt Organization, Scale-Up, Define a New Deal, and Sustainable Capitalism.
Strategic Planning
Financial Services
Discusses the strategic development for insurers focusing on six key pillars to enhance efficiency, resilience, and responsibility, with an emphasis on digitalization and prevention services.
insurance, strategic planning, digitalization, prevention, resilience
false
Strategic Planning
Financial Services
Pillar
Roland Berger
Add to my slides
Remove from favorites
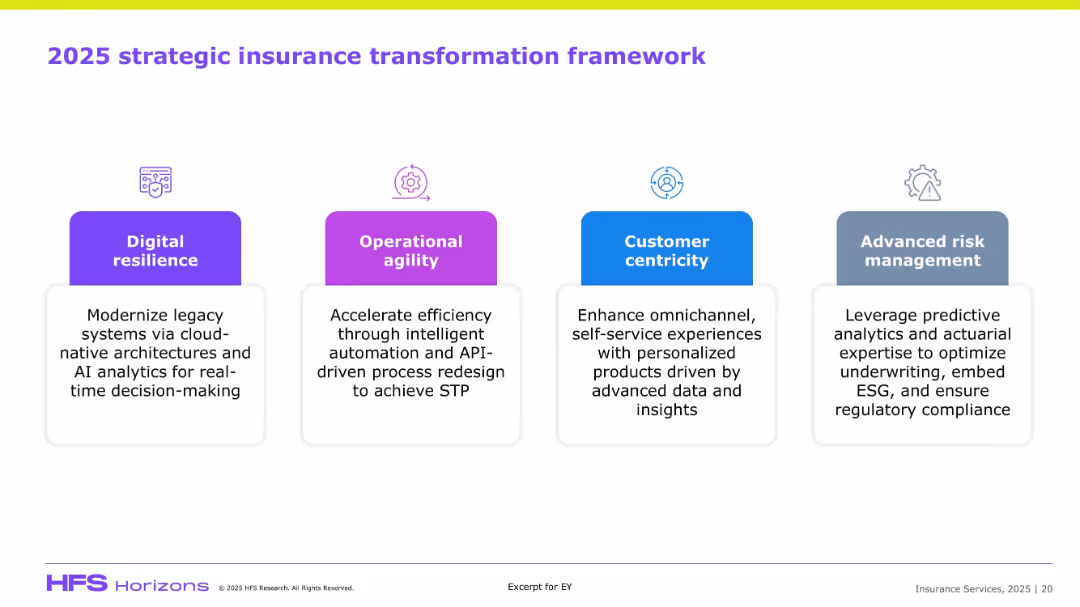
Horizontal flow of four colored blocks with icon headers and brief descriptions; simple, clean, and modern design.
Strategic Planning
Healthcare & Pharmaceuticals
The slide lays out a strategic framework for insurance transformation in 2025, identifying four pillars: digital resilience, operational agility, customer centricity, and advanced risk management. Each area is supported by enabling technologies such as cloud-native architectures, APIs, and predictive analytics, targeting efficiency and regulatory compliance.
Insurance, transformation, digital resilience, AI, automation, underwriting, ESG
false
Strategic Planning
Healthcare & Pharmaceuticals
Pillar
EY
Add to my slides
Remove from favorites
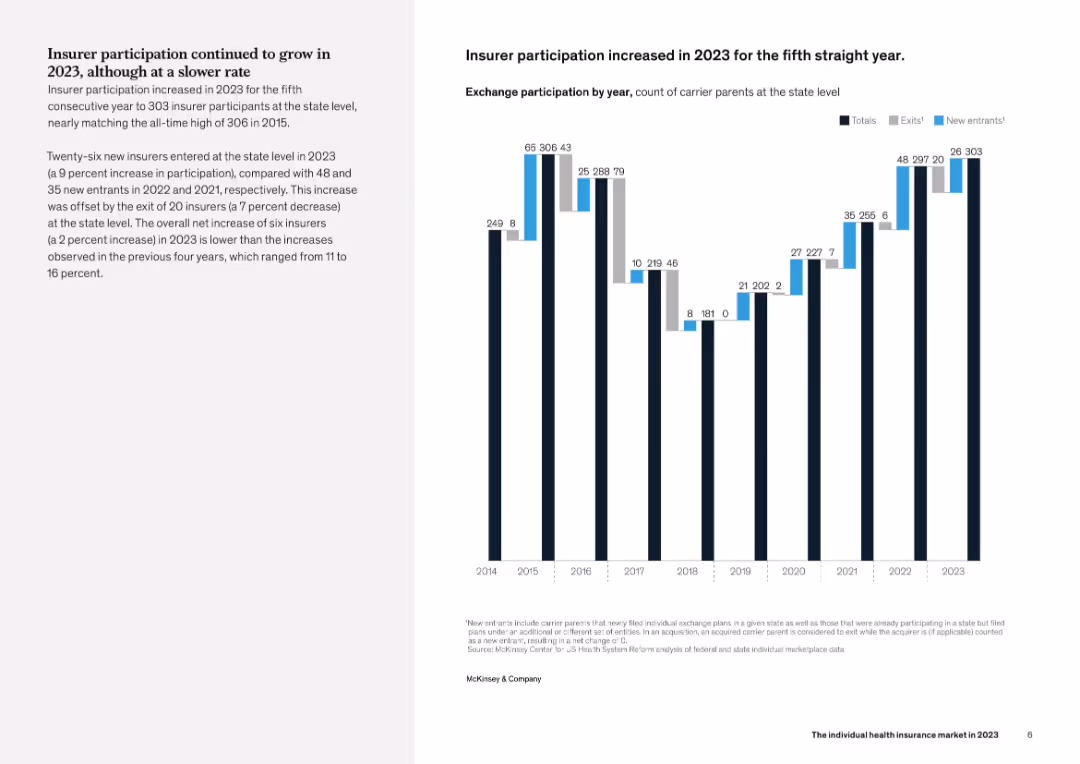
Left-aligned explanatory text with a vertical bar chart on the right showing the number of insurer participants, new entrants, and exits from 2014 to 2023. Visual style is consistent and clean with focus on quantitative trends.
Industry Overview
Healthcare & Pharmaceuticals
This slide details insurer participation trends in the individual health insurance market, showing a net increase in 2023 for the fifth consecutive year. Although the growth rate slowed compared to 2022, new entries still outpaced exits, nearly matching the participation peak seen in 2015.
insurer participation, healthcare, trends, new entrants, exits
false
Industry Overview
Healthcare & Pharmaceuticals
Mixed Chart
McKinsey
Add to my slides
Remove from favorites
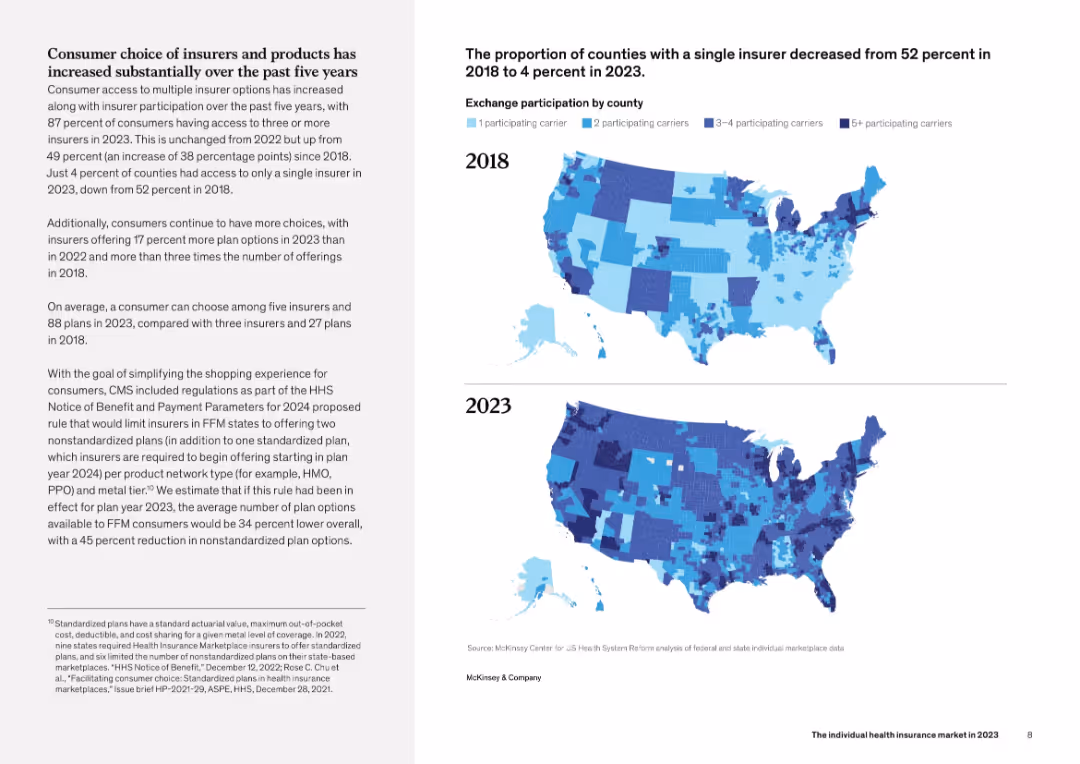
Left side contains detailed narrative text. Right side includes two U.S. maps comparing county-level insurer participation in 2018 vs 2023 using a 4-color gradient. Clear, geography-based visual format.
Strategic Planning
Healthcare & Pharmaceuticals
This slide illustrates the dramatic increase in consumer choice within the health insurance market between 2018 and 2023. The maps show a drop in counties with only one insurer from 52% to 4%, and a rise in counties with three or more insurers. The narrative also discusses regulatory developments and plan design standardization.
insurers, county-level access, coverage, maps, healthcare choice
false
Strategic Planning
Healthcare & Pharmaceuticals
Mixed Chart
McKinsey
Add to my slides
Remove from favorites
Text description with icons and a quote on the side detailing insurgent brand benefits from brand-switching behavior.
Customer and Market Segmentation
Retail & E-commerce
Discusses the benefit insurgent brands gain from brand-switching behavior and the consumer search for value.
insurgent brands, brand-switching, consumer behavior, value, retail
false
Customer and Market Segmentation
Retail & E-commerce
Boxed
Bain
Add to my slides
Remove from favorites
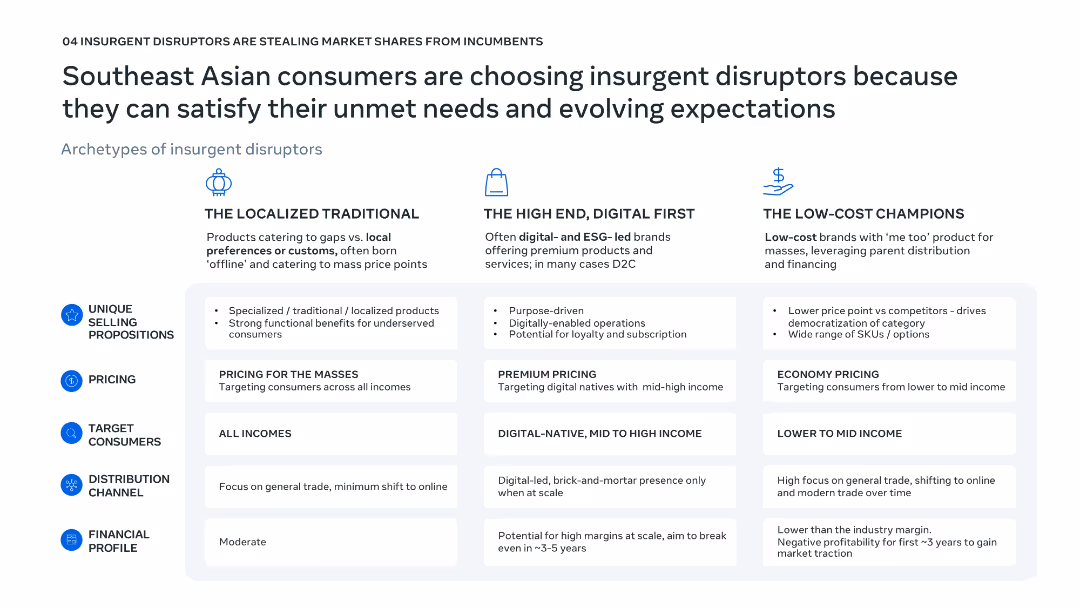
Three-column comparative layout; icons and bold headings distinguish disruptor archetypes; bullet points within shaded boxes for consistent structure.
Competitive Landscape
Consumer Goods
This slide classifies three types of insurgent disruptors in Southeast Asia—Localized Traditional, High-End Digital First, and Low-Cost Champions—by outlining their pricing, consumers, distribution, and financial traits. It demonstrates how these disruptors meet evolving consumer demands unmet by incumbents.
insurgent disruptors, localization, premium pricing, low-cost, Southeast Asia
false
Competitive Landscape
Consumer Goods
Table
Bain
Add to my slides
Remove from favorites
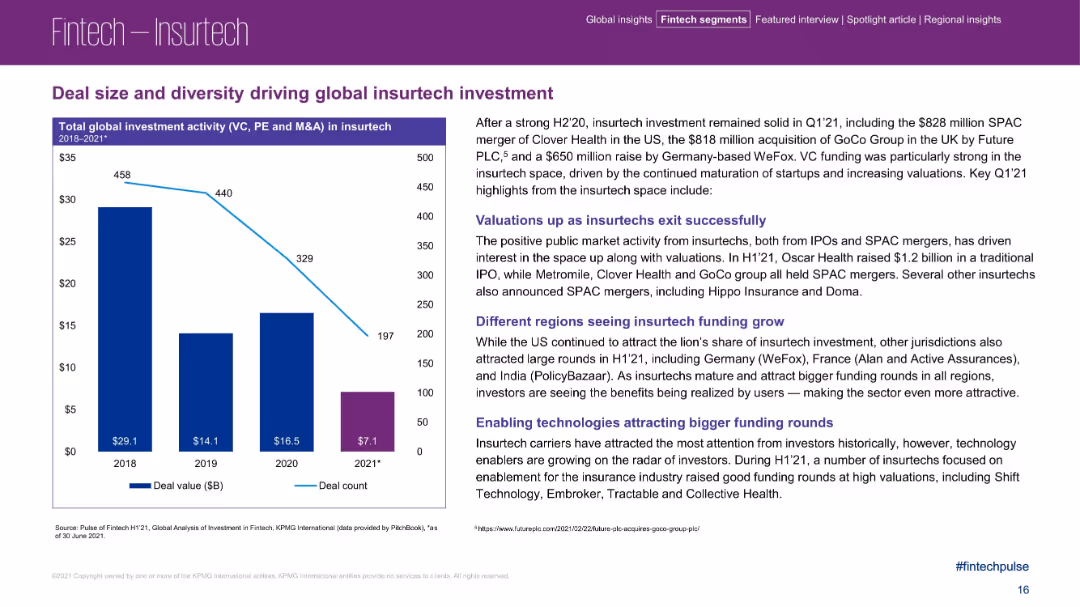
Bar chart on the left with right-aligned explanatory text covering key trends and drivers in insurtech.
Product and Service Analysis
Financial Services
The slide illustrates investment trends in insurtech from 2018 to 2021, highlighting fluctuations in deal count and value. It discusses factors like successful exits, regional funding growth, and enabling technologies that have driven recent investment surges.
insurtech, funding, SPAC, insurance tech, deal diversity, global investment
false
Product and Service Analysis
Financial Services
Mixed Chart
KPMG
Add to my slides
Remove from favorites
The slide showcases an integrated coverage model diagram with sectors like corporates, individuals, asset managers, and asset owners, alongside text boxes for areas of focus.
Operational Efficiency
Financial Services
The slide illustrates Morgan Stanley's integrated firm structure, highlighting key areas of focus such as corporate strategy, institutional capabilities, and public-private market ecosystem.
Integrated Coverage, Firm Structure, Morgan Stanley, Corporates, Individuals, Asset Managers, Areas of Focus, Diagram
false
Operational Efficiency
Financial Services
Diagram
Morgan Stanley
Add to my slides
Remove from favorites
Slide features a diagram illustrating the overlap of Financial, Operational, and Commercial aspects within a common data platform, using a simple, clear design.
Investment Analysis
Professional Services
Describes A&M's integrated diligence process, illustrating how different aspects such as Financial, Operational, and Commercial are combined to guide investment and underwriting processes.
Integrated, Diligence, Financial, Operational, Commercial
false
Investment Analysis
Professional Services
Diagram
Alvarez & Marsal
Add to my slides
Remove from favorites
Contains a circular flow diagram with icons representing different aspects of diligence such as Valuation, Commercial, and Tax. Clear, simple design with labeled segments and a central title.
Investment Analysis
Professional Services
This slide emphasizes the uniqueness of A&M's integrated diligence approach, showing how it combines various elements like Financial Accounting and Tax to create a comprehensive service.
Integrated, Diligence, Financial, Tax, Solution
false
Investment Analysis
Professional Services
Framework
Alvarez & Marsal
Add to my slides
Remove from favorites
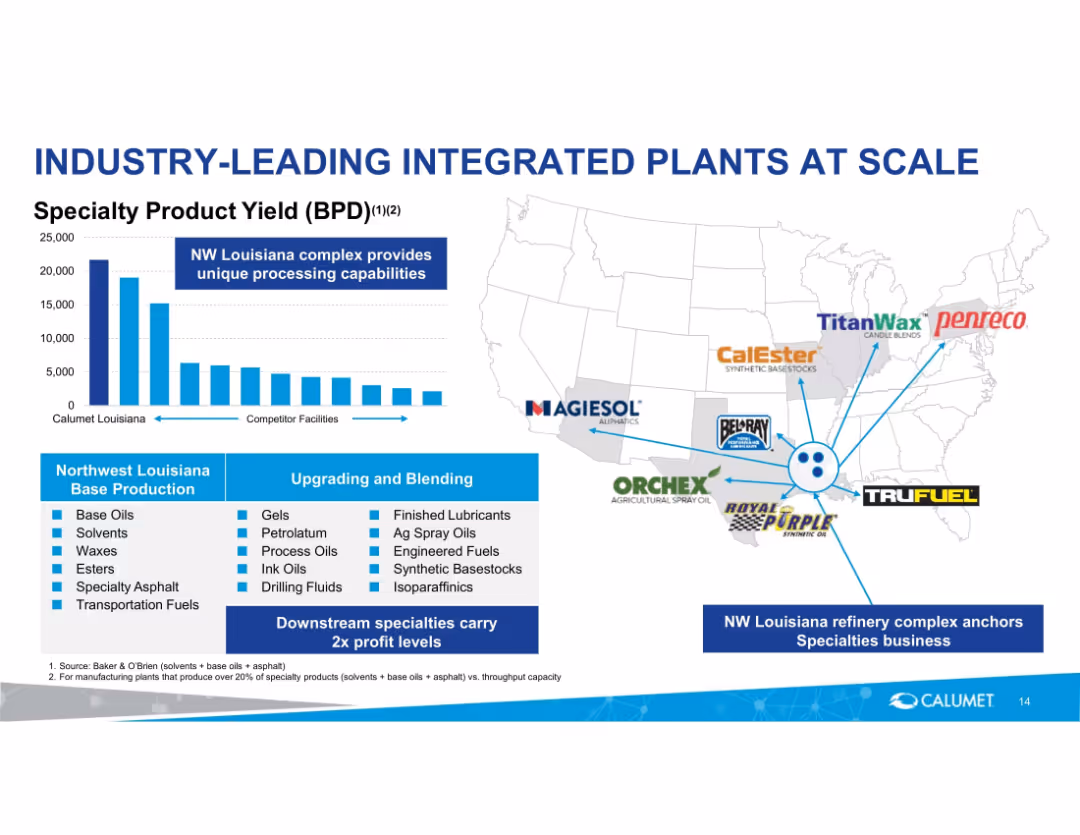
Chart on the left comparing product yield, map on right with brand logos. Bottom section lists products and blending capabilities.
Operational Efficiency
Energy & Utilities
Highlights Calumet’s competitive edge in specialty product yield from NW Louisiana plant. Shows geographic integration with brand logos and details upstream/downstream capabilities, reinforcing scale and specialization.
integrated plants, Calumet, specialty products, processing, Louisiana, operational scale
false
Operational Efficiency
Energy & Utilities
Mixed Chart
Goldman Sachs
Add to my slides
Remove from favorites
This slide outlines an integrated banking platform with product offerings across spending, borrowing, and saving. It includes a flowchart-like design with product names and related icons, with color coding to guide the viewer.
Technology and Digital Transformation
Financial Services
Highlighting the firm's approach to creating an integrated digital banking platform, this slide delineates the array of services provided, underlining the strategy for customer engagement across different financial needs.
integrated platform, digital banking, product offerings, customer engagement
false
Technology and Digital Transformation
Financial Services
Diagram
Goldman Sachs
Add to my slides
Remove from favorites
This slide features a timeline with labeled boxes representing different integrated projects in operation. The timeline includes flags and color-coded boxes for various project details.
Strategic Planning
Energy & Utilities
It showcases a timeline of integrated projects in the oil and gas industry, detailing project names, owners, types, CO₂ storage rates, and rationales for investment, highlighting major milestones.
integrated projects, oil and gas, timeline, CO₂ storage, project names, investment, energy, utilities
false
Strategic Planning
Energy & Utilities
Linear Flow
Kearney
Add to my slides
Remove from favorites
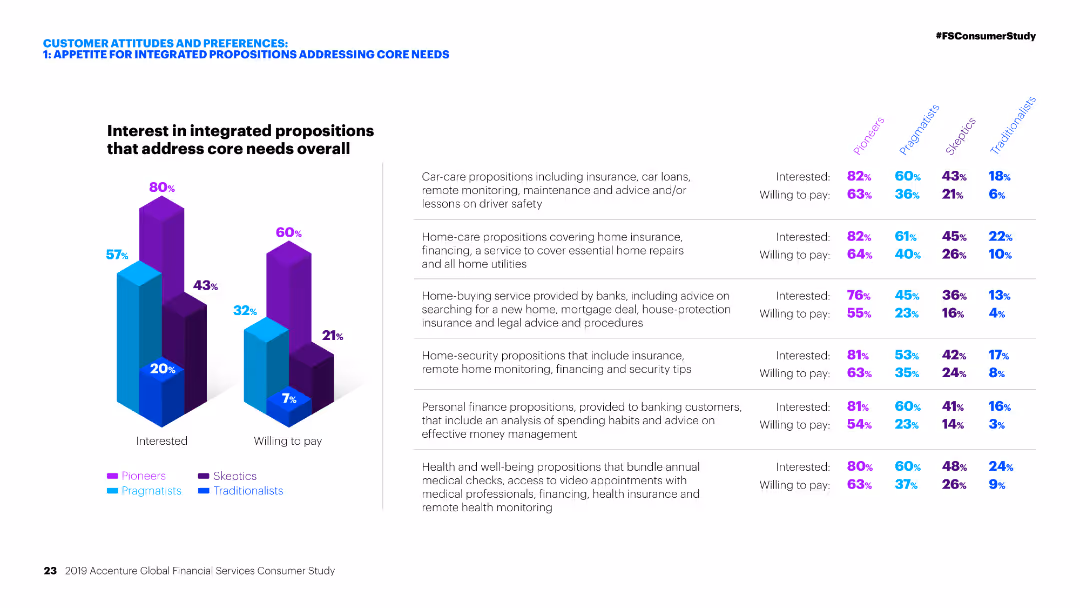
Column charts showing interest and willingness to pay for integrated propositions addressing core needs.
Market Analysis and Trends
Financial Services
Analysis of customer interest in integrated financial propositions, including car-care, home-care, home-buying, home-security, and personal finance.
Integrated propositions, financial services, customer interest, willingness to pay, core needs, market analysis, segmentation, personas, financial products
false
Market Analysis and Trends
Financial Services
Multiple Chart
Accenture
Add to my slides
Remove from favorites
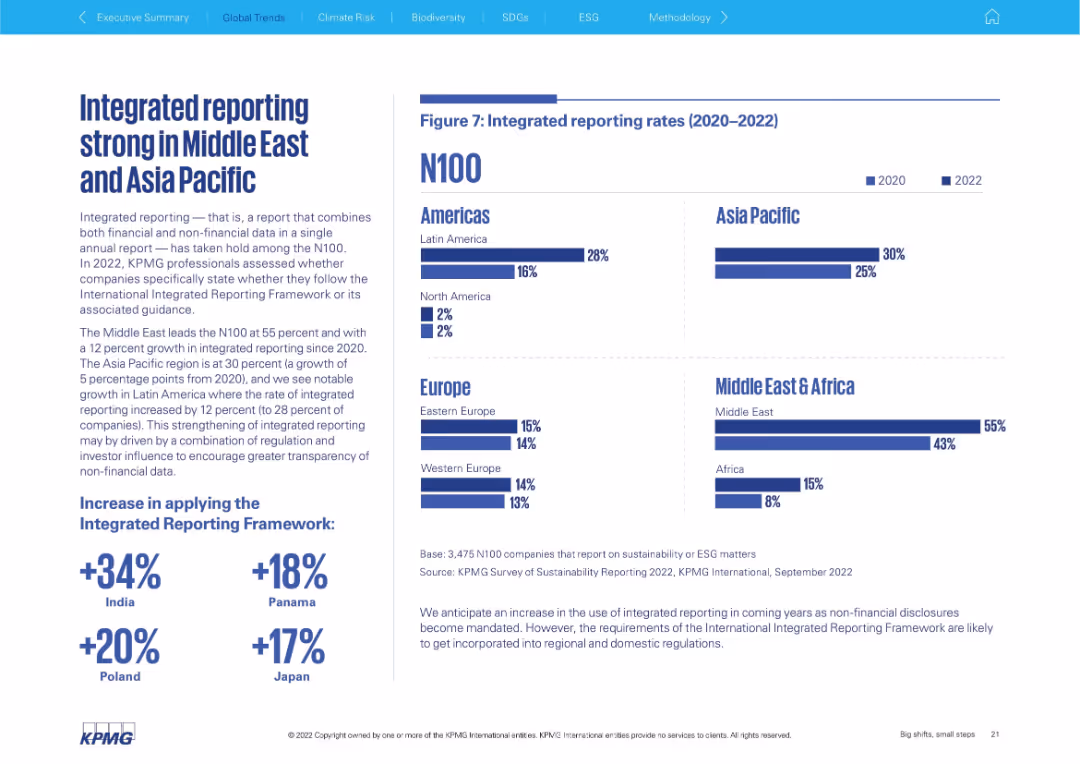
Text block on left explaining integrated reporting; right side has horizontal bar chart by region (2020 vs 2022)
Technology and Digital Transformation
Professional Services
Highlights the rise of integrated reporting (financial + non-financial data) among N100 companies, especially in the Middle East (55%) and Asia Pacific (30%). Bar chart compares 2020 vs 2022 across all regions.
integrated reporting, ESG, non-financial data, Middle East, Asia Pacific, transparency, framework adoption
false
Technology and Digital Transformation
Professional Services
Mixed Chart
KPMG
Add to my slides
Remove from favorites
Utilizes bullet points and connected thought bubbles to outline the integration blueprint process, emphasizing key decision points and framework.
Strategic Planning
Professional Services
Provides a detailed overview of the initial planning required for integration, focusing on key milestones, risks, and governance structure.
integration, blueprint, planning, governance, milestones, risks
false
Strategic Planning
Professional Services
Diagram
Deloitte
Add to my slides
Remove from favorites
The slide presents a structured list divided into two categories with a green split arrow design. Icons next to each point suggest a clear, organized format.
Mergers and Acquisitions
Professional Services
Lists potential integration challenges in mergers and acquisitions, highlighting necessary areas of focus to mitigate risks for successful integration.
integration, challenges, mergers, acquisitions, risks, mitigation, leadership, IT systems
false
Mergers and Acquisitions
Professional Services
Diagram
Deloitte
Add to my slides
Remove from favorites
A slide with two segments; the left side shows a circular diagram with sectors centered around client centricity, and the right side includes a descriptive statement on a black background.
Client Case Studies
Financial Services
This slide visually describes the integrated approach of the organization in serving global clients, emphasizing client centrality.
Integration, Client, Centricity, Global, Financial, Services, Organization, Approach
false
Client Case Studies
Financial Services
Diagram
Goldman Sachs
Add to my slides
Remove from favorites
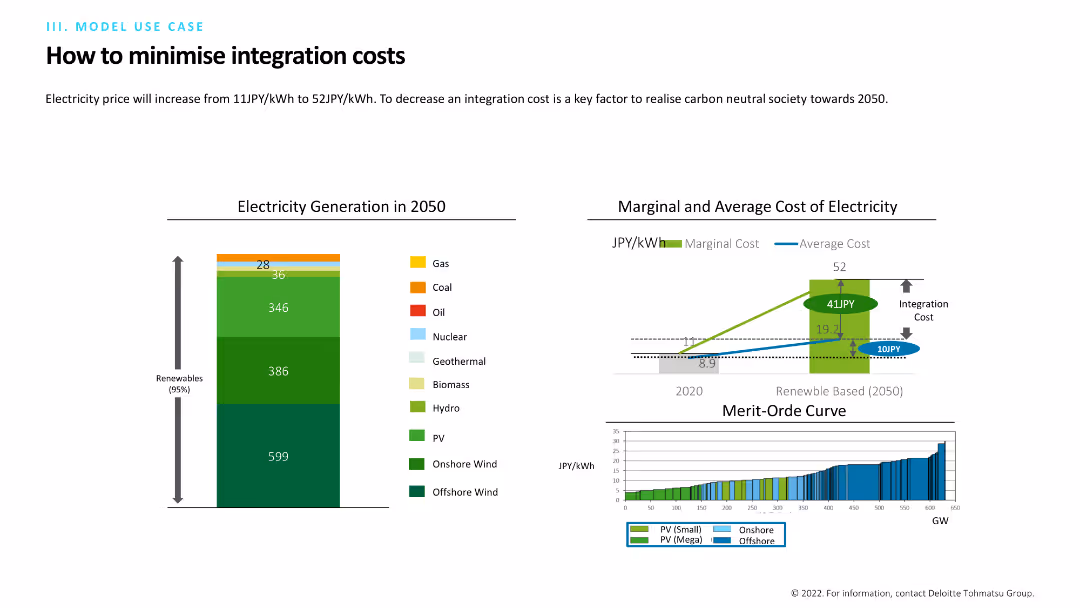
The slide includes a column chart showing electricity generation in 2050 by source (e.g., gas, coal, oil) and a line chart comparing marginal and average costs of electricity. Another chart shows the merit-order curve for renewables.
Operational Efficiency
Energy & Utilities
The slide discusses strategies to minimize integration costs in the energy sector by 2050, focusing on renewable energy and cost efficiency. It includes data on electricity generation and cost projections.
Integration costs, electricity, 2050, renewables, cost efficiency
false
Operational Efficiency
Energy & Utilities
Multiple Chart
Deloitte
Add to my slides
Remove from favorites
Column chart (horizontal) showing the percentage breakdown of integration costs across various functional areas such as HR, IT, and Finance.
Financial Performance
Professional Services
Breaks down the integration costs by function, highlighting the proportion of expenses in HR, IT, and other areas, demonstrating cost distribution.
integration, costs, HR, IT, finance, cost breakdown, functional expenses
false
Financial Performance
Professional Services
Single Chart
Deloitte
Add to my slides
Remove from favorites
A line chart displaying the integration cost as a percentage of cost synergies, with marked percentiles and a clear delineation of the median.
Financial Performance
Professional Services
Analyzes integration costs relative to annual synergies, providing a financial perspective on the cost-effectiveness of integration strategies.
integration, costs, synergies, financial analysis, cost-effectiveness
false
Financial Performance
Professional Services
Single Chart
Deloitte
Add to my slides
Remove from favorites
The slide features a timeline from 1Q 2024 to 4Q 2026 with milestones represented by red diamonds. The timeline is organized into key legal entity transactions, clients, technology, and risk & compliance. Each section includes multiple milestones with horizontal arrows indicating ongoing work and completion dates.
Mergers and Acquisitions
Financial Services
The slide details a timeline for restructuring and integration milestones to be completed by the end of 2026. It includes key legal entity transactions, client migrations, technology integrations, and risk & compliance frameworks. This slide is useful for project management and tracking progress in a merger or acquisition scenario.
integration, milestones, timeline, mergers, restructuring
false
Mergers and Acquisitions
Financial Services
Table
UBS
Add to my slides
Remove from favorites
An image showing a diamond-shaped diagram with four core areas of Goldman Sachs, flanked by a sidebar detailing a partnership with Spotify, illustrating a case study approach.
Strategic Planning
Financial Services
This slide represents the integrated approach of Goldman Sachs, displaying its main operational divisions and highlighting a collaboration with Spotify. It details the multifaceted partnership encompassing investment, advisory, and wealth management, thus exemplifying the strategic relationships and comprehensive services the firm offers to its clients.
Integration, Operational Divisions, Spotify, Case Study, Investment, Advisory, Wealth Management
false
Strategic Planning
Financial Services
Text Only
Goldman Sachs
Add to my slides
Remove from favorites
Organizational chart layout with multiple levels from executive sponsorship down to functional work streams, using a clear, hierarchical structure.
Organizational Structure and Change
Professional Services
Illustrates the organizational structure and roles required to manage an integration program effectively, including key decision-making aspects.
integration, organizational structure, management, program, work streams
false
Organizational Structure and Change
Professional Services
Diagram
Deloitte
Add to my slides
Remove from favorites
Comparison of fragmented setup versus simplified and unified WM division, with icons for key benefits.
Organizational Structure and Change
Financial Services
Illustrates the transition from a fragmented to a unified Wealth Management division, highlighting the benefits of integration.
integration, organizational structure, sustainable growth, unified division, transition
false
Organizational Structure and Change
Financial Services
Framework
Credit Suisse
Add to my slides
Remove from favorites
Includes a comprehensive timeline split into three phases with detailed steps under each phase, highlighted in varying shades of green.
Organizational Structure and Change
Professional Services
Outlines the three primary phases of integration execution: Mobilization, Day 1 Planning, and Integration Value Capture, with substeps for clarity.
integration, phases, mobilization, execution, planning, value capture
false
Organizational Structure and Change
Professional Services
Linear Flow
Deloitte
Add to my slides
Remove from favorites
The slide shows a timeline with achievements for Q3 2023, key priorities for Q4 2023, and milestones for 2024.
Strategic Planning
Financial Services
This slide details the integration planning and execution process, highlighting achievements and future milestones.
integration planning, execution, key priorities, milestones, strategic plan
false
Strategic Planning
Financial Services
Header Horizontal
UBS
Add to my slides
Remove from favorites
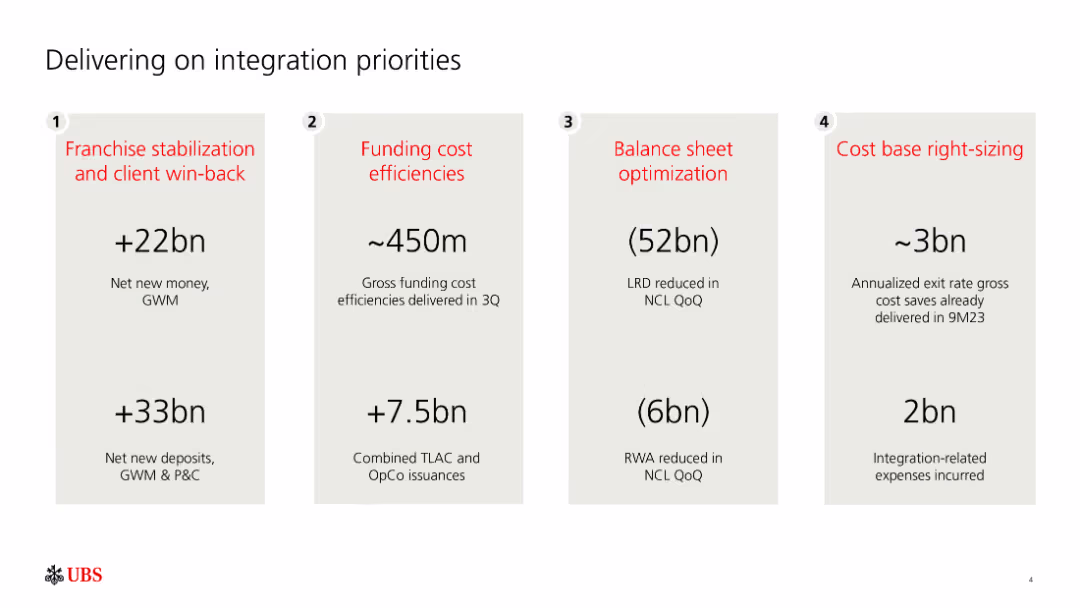
The slide is divided into four sections, each with a heading and key figures related to integration priorities like franchise stabilization, funding efficiencies, and balance sheet optimization.
Strategic Planning
Financial Services
It outlines strategic integration priorities for UBS, presenting key figures and milestones achieved in areas such as client win-back, cost efficiencies, and balance sheet management.
integration, priorities, strategic, franchise, stabilization, funding, efficiencies, balance sheet, UBS
false
Strategic Planning
Financial Services
Linear Flow
UBS
Add to my slides
Remove from favorites
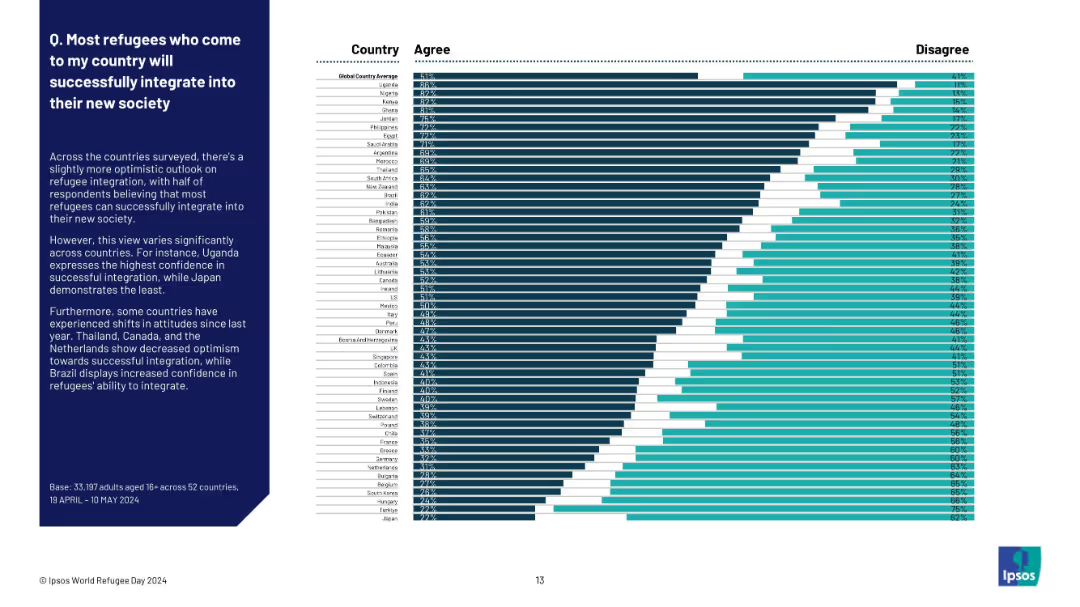
Ranked horizontal bar chart of countries by % agreement. Country names and bars on right; explanatory text on left side of slide.
Human Resources and Talent Management
Government & Public Sector
This slide explores confidence in refugee integration across countries. Uganda shows the highest agreement (63%), while Japan is lowest (27%). The global average is 51%, indicating a slightly optimistic but mixed global perspective. Regional and national variations highlight areas of perceived challenge or success in refugee integration.
integration, refugees, global trust, Ipsos survey, societal acceptance, immigration, cultural adjustment, country ranking, perception
false
Human Resources and Talent Management
Government & Public Sector
Mixed Chart
IPSOS
Add to my slides
Remove from favorites
The slide features a central diagram split into three main sections—people, technology, and space—around a core labeled 'Customer Experience'. Bright colors differentiate the sections, with icons and short descriptors around each segment. It's moderately complex.
Technology and Digital Transformation
Professional Services
This slide emphasizes the importance of an integrated approach to Employee and Customer Experience in organizations, highlighting the elements of people, technology, and space as central to this strategy.
integration, strategy, employee experience, customer experience, organizational development
false
Technology and Digital Transformation
Professional Services
Single Chart
Deloitte
Add to my slides
Remove from favorites
Displays four integration approaches in a quadrant format with icons and brief descriptions, including color distinctions for different strategies.
Mergers and Acquisitions
Professional Services
Explains different M&A integration strategies like Assimilation, Metamorphosis, Transformation, and Retention, emphasizing their application and goals.
integration, strategy, M&A, assimilation, metamorphosis, transformation, retention
false
Mergers and Acquisitions
Professional Services
Diagram
Deloitte
Add to my slides
Remove from favorites
The slide features a complex diagram showing the ecosystem of Bank for Entrepreneurs and a list of capabilities with relevance to Private Banking business.
Strategic Planning
Financial Services
This slide describes the integration into SUB and the additional collaboration opportunities it creates, focusing on the Bank for Entrepreneurs ecosystem.
Integration, SUB, collaboration, ecosystem, Private Banking
false
Strategic Planning
Financial Services
Mixed Chart
Credit Suisse
Add to my slides
Remove from favorites
The slide features a balanced layout with bullet points on the left and a column chart on the right. The column chart displays cost synergies from 2018 to 2022.
Operational Efficiency
Agriculture & Food Production
The slide discusses the rapid progress of organizational and cultural integration within Crop Science, highlighting achievements in cost and sales synergies, and specific targets.
Integration, synergies, cost savings, cultural integration, Crop Science, Bayer, operational excellence, financial targets, column chart
false
Operational Efficiency
Agriculture & Food Production
Mixed Chart
Credit Suisse
Add to my slides
Remove from favorites
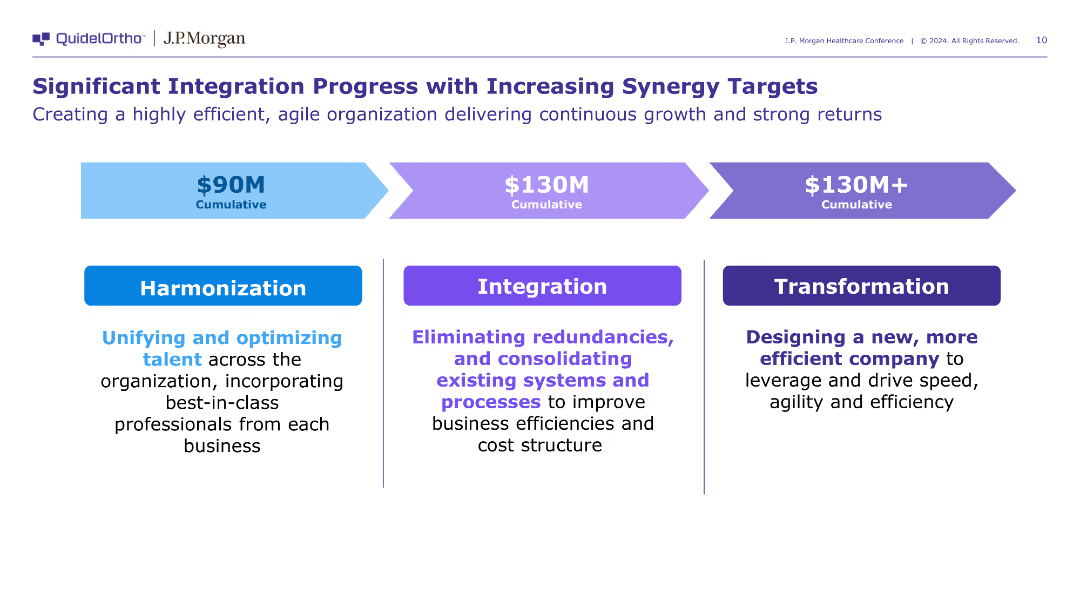
The slide includes three blocks detailing the stages of integration: Harmonization, Integration, and Transformation, each with specific actions and cumulative synergy targets. The design is clear and structured.
Operational Efficiency
Healthcare & Pharmaceuticals
The slide outlines the progress and targets of QuidelOrtho's integration efforts, focusing on harmonizing talent, eliminating redundancies, and transforming the company for better efficiency.
integration, synergy, transformation
false
Operational Efficiency
Healthcare & Pharmaceuticals
Linear Flow
JP Morgan
Add to my slides
Remove from favorites
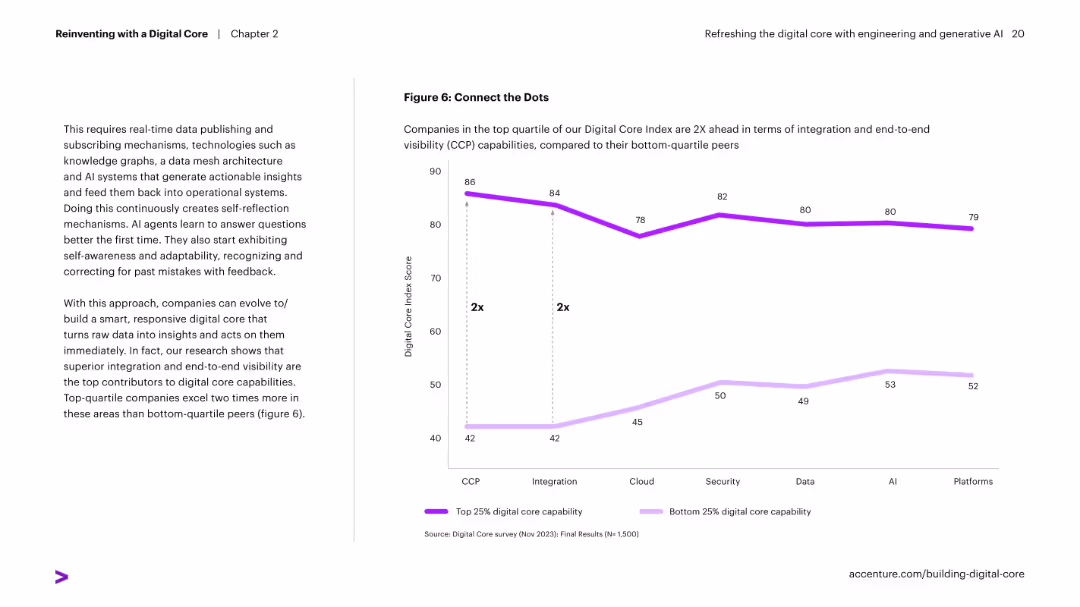
Left column of explanatory text; right column features a line graph comparing Digital Core Index Scores between top and bottom quartiles across categories like CCP, Integration, Cloud, etc.
Performance Metrics and KPIs
Technology & Software
Highlights how top-performing companies lead in digital core capabilities like integration and visibility. The graph shows a 2x difference between top and bottom quartiles across digital components.
integration, visibility, digital score, cloud, AI, data, performance, benchmarking
false
Performance Metrics and KPIs
Technology & Software
Mixed Chart
Accenture
Add to my slides
Remove from favorites
Contains a circular chart related to the Big Data market segmentation. It uses a structured layout with highlighted sections for clarity.
Risk Assessment and Management
Environmental Services & Sustainability
Discusses how intelligence applications benefit from Earth Observation data, emphasizing its importance in sectors like government and defense. Useful for understanding data applications in security and strategic planning.
intelligence, Earth Observation, data applications, government, defense
false
Risk Assessment and Management
Environmental Services & Sustainability
Mixed Chart
PwC/Strategy&
Add to my slides
Remove from favorites
Previous
Next
You don't have any favorites yet.
Please wait loading your favorites slides...
Create a FREE account to continue browsing
Receive Instant Access to 1,000+ slides from companies like McKinsey, Google, and Goldman Sachs
First Name
Last Name
Email
Password
I agree to all
Terms & Privacy Policy
Thank you! Your submission has been received!
Oops! Something went wrong while submitting the form.
Have an account?
Sign in
Upgrade to PRO to Save slides
Advanced Search and Filters
Access to 15,000+ slides
Access to Category Pages
Save/Bookmark Slides
PowerPoint Template Library
Pick a Plan
MONTHLY
$12/month
Billed every month, Cancel anytime.
YEARLY
$9/year
Billed $108 annually, Cancel anytime.
Checkout for $12/month
Checkout for $108/yr
Secured by Stripe | AES-256 bit encryption