My Account
My Slides
Search by Category
Templates
View All Templates
Download Template Slides
Leave Feedback
Login
Logout
Get Started
Browse all Slides
Browse all Slides
Create a FREE Account
Instant access to 1,000+ real slides from top companies like McKinsey, BCG, Goldman Sachs, Google and many more!
First Name
Last Name
Email
Password
I agree to all
Terms & Privacy Policy
Thank you! Your submission has been received!
Oops! Something went wrong while submitting the form.
Have an account?
Sign in
Saved Slides
Pie chart showing percentage of internet-using buyers, with bar graphs for younger and older offline investors.
Investment Analysis
Financial Services
Explores the investment behavior of offline vs. online investors, highlighting the preference for agents and ease of understanding.
Offline Investors, Agents, Simplicity, Financial Information, Online Options, Investment Behavior
Mixed Chart
BCG
Saved
The slide features a column chart showing world bioenergy consumption by sector (energy, transport, industry, buildings) from 2018 to 2040 under a stated policies scenario. It includes detailed data on the growth of bioenergy use in power, heat, car, truck, shipping, aviation, industry, and residential sectors.
Market Analysis and Trends
Energy & Utilities
This slide projects the growth of world bioenergy consumption across various sectors until 2040, with a focus on the significant contributions from the power and transport sectors to the overall increase in bioenergy demand.
world bioenergy consumption, sector, 2018-2040, power, heat, transport, industry, buildings, growth forecast
Single Chart
Kearney
Saved
This slide features two column charts showing market value projections for H2 storage solutions from 2023 to 2030, segmented by application and region.
Market Analysis and Trends
Energy & Utilities
Analyzes the projected growth of the H2 storage market for mobility and infrastructure, with an expected market size of almost EUR 10 billion by 2030.
H2 storage, market size, projections, mobility, infrastructure, application, region, growth, EUR billion
Multiple Chart
Roland Berger
Saved
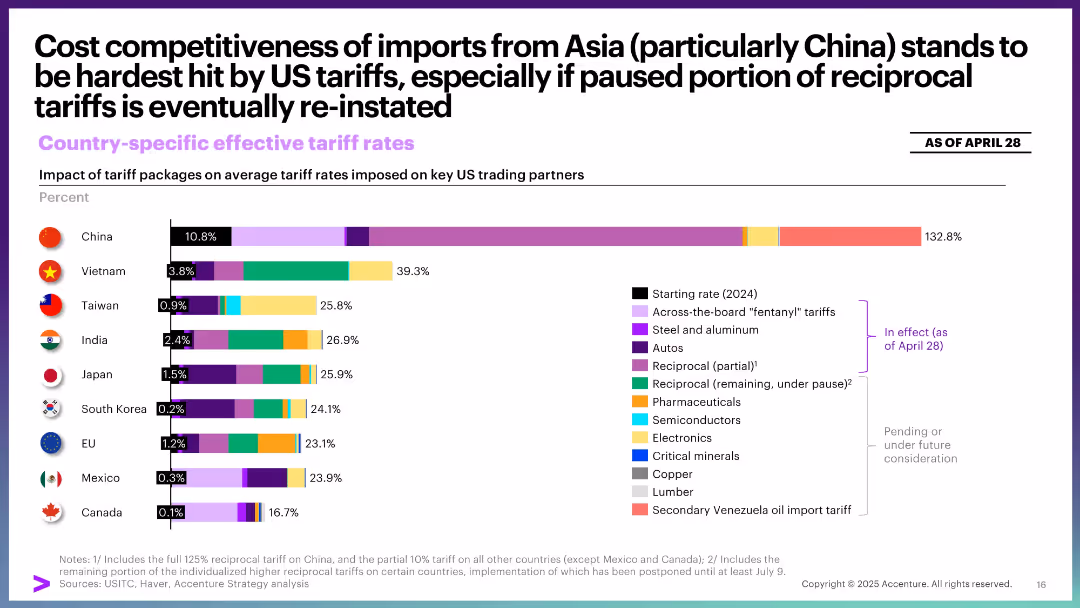
Bar chart with color-coded segments showing total effective tariff rate by country. Categories marked by implementation status.
Pricing Strategies
Industrial & Manufacturing
This slide compares the impact of tariff packages on key US trade partners, especially Asian economies. China faces the most severe rate increases, with potential reinstatement of paused measures likely to intensify effects.
Asia trade, tariffs, pricing, China, competitiveness, imports, implementation, policy impact
Single Chart
Accenture
Saved
Line charts showing US y/y average hourly earnings and inflation, and real consumption expenditures and disposable income trends.
Market Analysis and Trends
Consumer Goods
Shows how growth in real disposable income sustains consumer spending, even as the labor market cools.
disposable income, consumer spending, earnings, inflation, consumption, line chart, US economy, labor market, income trends
Multiple Chart
EY
Saved
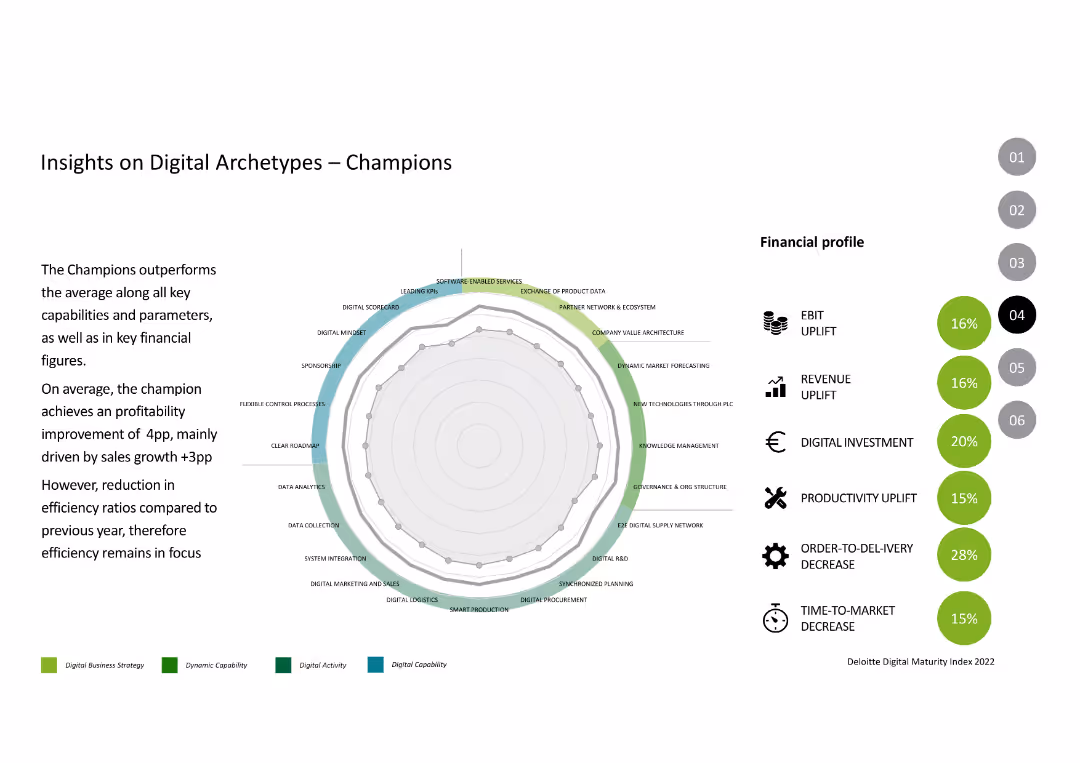
The slide features a radar chart with multiple parameters like digital mindset, market forecasting, and software-enabled services, alongside financial profile metrics like EBIT and revenue uplift.
Competitive Landscape
Industrial & Manufacturing
This slide analyzes the performance of "Champions" in digital transformation, highlighting their strengths in various digital capabilities and financial metrics.
Digital Archetypes, Champions, Performance, Digital Transformation, Financial Metrics
Mixed Chart
Deloitte
Saved
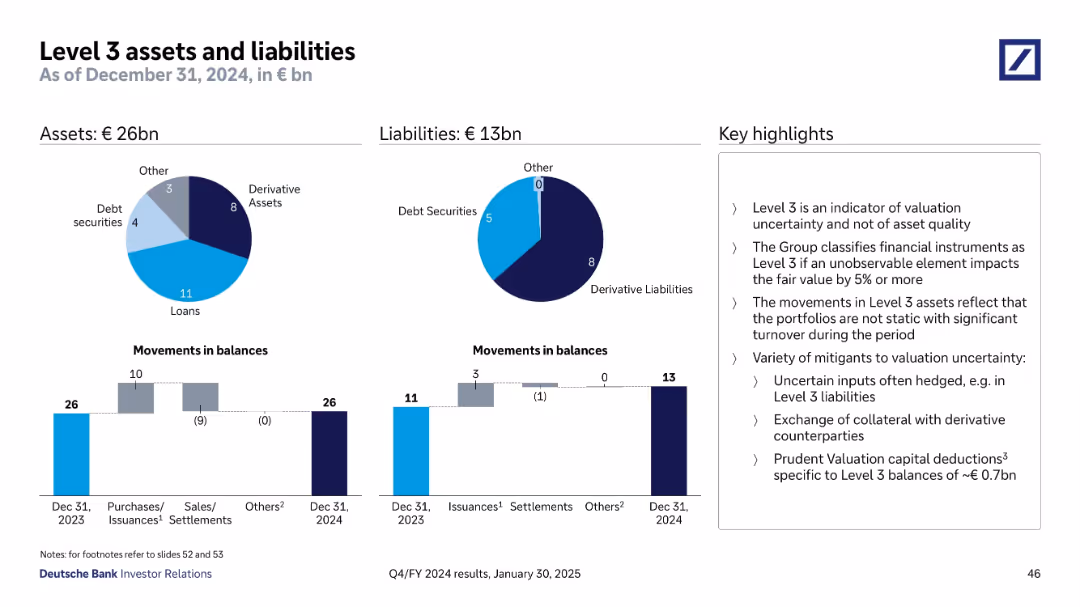
Two pie charts and two bar charts show breakdown and changes in Level 3 assets and liabilities; key messages on valuation risk
Regulatory and Compliance
Financial Services
Level 3 exposures amount to €26bn in assets and €13bn in liabilities. Loans and derivatives form the bulk. Bar charts depict balance changes. Discussion focuses on valuation uncertainty, classification criteria, and risk mitigation strategies such as collateral exchanges and hedging practices.
Level 3, valuation risk, derivatives, regulatory, asset-liability
Multiple Chart
Deutsche Bank
Saved
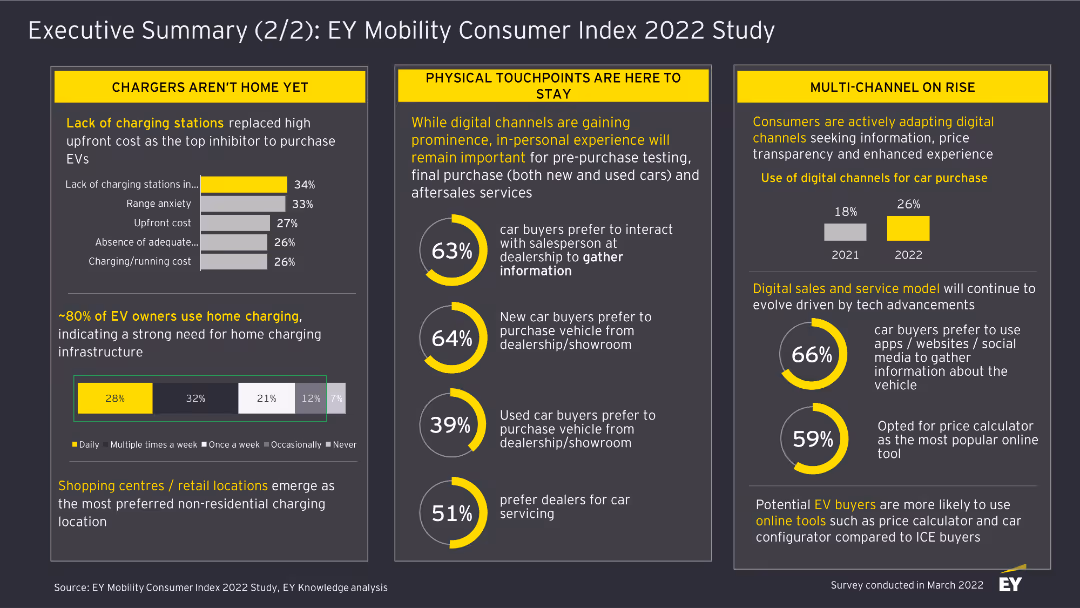
This slide includes column charts and textual highlights. It discusses the challenges in EV adoption, the importance of physical touchpoints, and the rise of digital channels for car purchases.
Market Analysis and Trends
Transportation & Logistics
The slide summarizes findings from the EY Mobility Consumer Index 2022 Study, focusing on barriers to EV adoption, the role of physical touchpoints, and the increasing use of digital channels in car buying.
EV Adoption, Physical Touchpoints, Digital Channels, Car Buying, Transportation, Market Analysis, 2022, Survey, Consumer Trends
Multiple Chart
EY
Saved
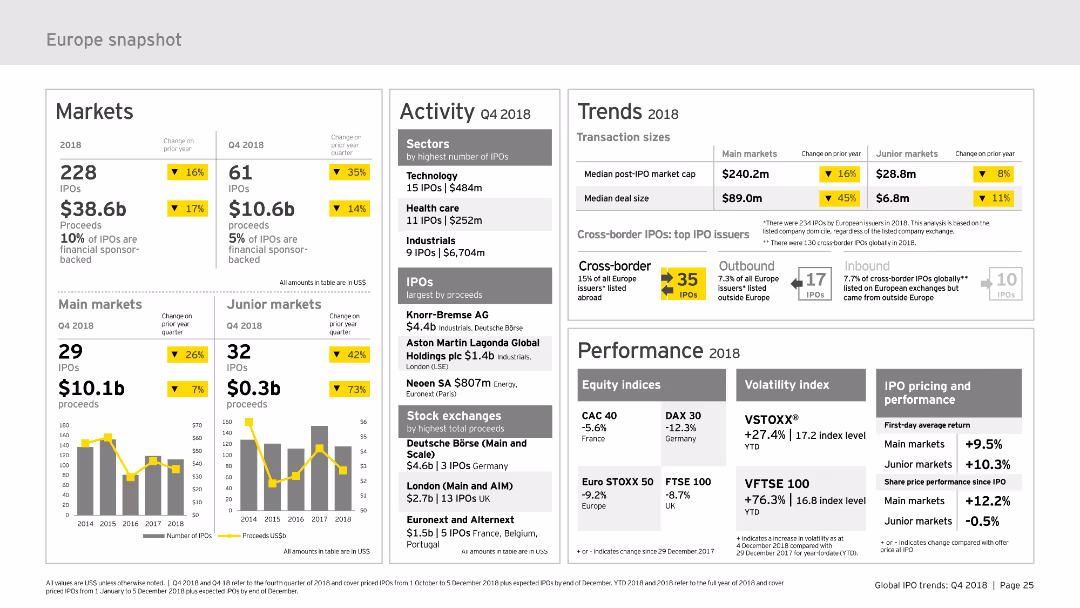
The slide provides a comprehensive snapshot of the European IPO market, divided into sections such as markets, activity, trends, and performance. It uses column charts and data tables to present information clearly. The layout is moderately complex, designed to offer detailed insights into market trends and activities.
Market Analysis and Trends
Financial Services
Offers a detailed overview of the European IPO market for 2018, including market performance, activity data, trends, and key metrics. It is useful for understanding the European market dynamics and making strategic decisions.
Europe, IPO, market snapshot, performance, trends
Multiple Chart
EY
Saved
This slide categorizes various industries into three groups (Healthier, Pressured, Vulnerable) based on TSR performance and net debt/enterprise value. Each category is represented by a bar graph comparing TSR performance from before and during COVID-19, alongside a table listing companies with a probability of default. The slide uses color coding to distinguish between the categories, providing a clear visual differentiation of industry risk levels, making it easier to assess the financial health and risk profiles of sectors.
Risk Assessment and Management
Financial Services
The slide provides a comprehensive risk assessment of different sectors based on TSR performance and debt levels, crucial for financial analysts and investors. It helps in identifying high-risk industries and potential investment opportunities by showing which sectors are stable, pressured, or vulnerable in the current economic climate. This detailed analysis supports strategic investment decisions and risk management strategies, offering insights into sector resilience and vulnerability during economic downturns.
risk assessment, TSR, COVID-19, financial health, industry analysis, investment opportunities, risk management
Table
BCG
Saved
Line chart tracing investor priorities over time with additional explanatory text boxes highlighting changes during and post-COVID-19.
Financial Performance
Financial Services
Examines shifts in investor priorities towards long-term investments and maintaining short-term results, crucial for understanding market trends and investor expectations.
long-term investments, COVID-19, investor priorities, short-term results, market trends
Mixed Chart
BCG
Saved
The slide includes column charts and text blocks. The left side presents desired office investments, and the right side shows remote work investment preferences.
Technology and Digital Transformation
Professional Services
Discusses employee preferences for investments in hybrid work models, highlighting top choices for office and remote work improvements.
hybrid work, investments, office technology, remote work, survey
Multiple Chart
EY
Saved
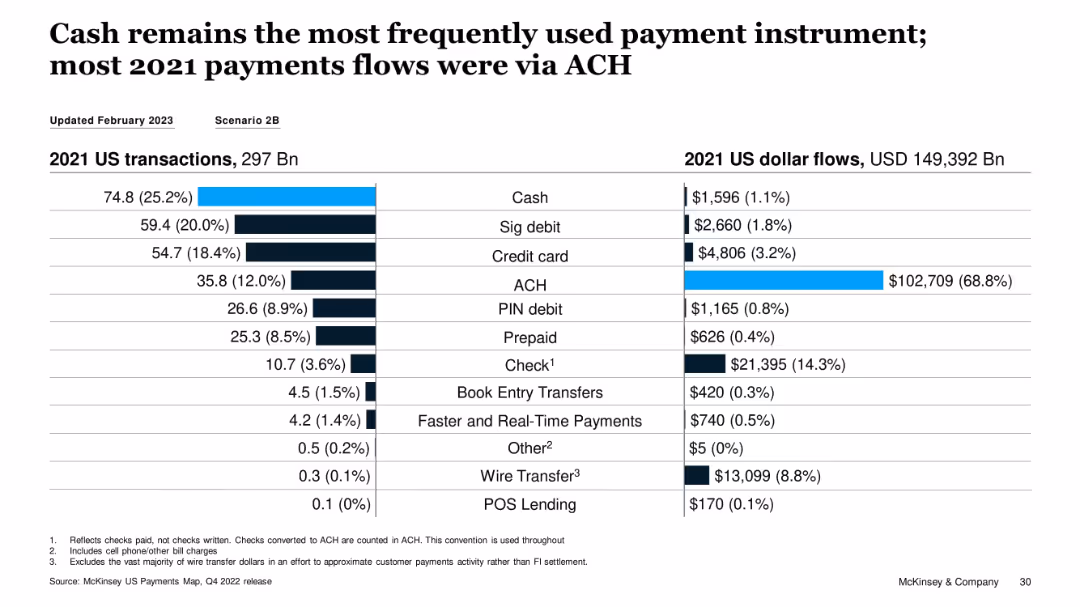
Split bar and table visualization of 2021 transaction volume vs. USD flows by instrument
Performance Metrics and KPIs
Financial Services
The slide highlights that while cash was the most used payment method by volume in 2021, ACH dominated in dollar flows, accounting for 68.8% of total value. This illustrates a divergence between transaction count and transaction value across instruments.
cash usage, ACH, transaction volume, dollar flows, payment instruments, 2021 data
Single Chart
McKinsey
Saved
Visualizes NYC construction permit changes with a column chart and future recovery projections with a dotted line chart, showing both immediate impacts and recovery outlook.
Market Analysis and Trends
Real Estate & Construction
Evaluates the impact of the pandemic on the construction industry, showing immediate declines in activity and projections for recovery, emphasizing the slower than average rebound.
construction, pandemic, NYC, permits, recovery projections, bar chart, line chart
Multiple Chart
BCG
Saved
The slide features a large pie chart with centered text, multiple bullet points, and two high-resolution images. The layout is dense with a blend of text and visuals.
Industry Overview
Industrial & Manufacturing
The slide presents the economic benefits of the Tempest programme, emphasizing the development of critical skills and investment in R&D within the UK. It serves as a detailed informational piece to stakeholders about the programme's broader impacts on the economy.
UK economy, R&D, critical skills, Tempest programme, STEM careers, Catapult networks, high-skilled jobs, technology integrators, innovation culture
Text Only
PwC/Strategy&
Saved
The slide is professionally designed with a clean white background. It has three columns with headers: 'Key questions', 'EY-Parthenon capabilities', 'Representative engagements', and bullet points under each. Text is black with the exception of the slide title in red, and there are no images or graphs.
Industry Overview
Financial Services
This slide showcases EY-Parthenon’s capabilities in assisting investors to evaluate potential distribution investments, highlighting key questions for market analysis, and listing previous engagements that showcase their expertise and experience.
EY-Parthenon, distribution investments, market analysis, due diligence, proprietary research, revenue forecasting, investment trends, sector analysis, HVAC, MRO market
Header Horizontal
EY
Saved
Features multiple icons and brief text descriptions organized in a grid, detailing different aspects of Deloitte's end-to-end support for digitizing finance functions.
Technology and Digital Transformation
Professional Services
Explains Deloitte’s capabilities in assisting organizations to go digital with their finance functions, covering diagnostics, data model design, technology deployment, and change management, highlighted by a visual framework.
Deloitte, digital finance, end-to-end support, technology deployment, change management, finance function, policy design, strategic value
Header Vertical
Deloitte
Saved
Bar chart comparing the levelized cost of energy for various renewable and conventional energy sources. Separate analysis showing the impact of U.S. federal tax subsidies.
Market Analysis and Trends
Energy & Utilities
Compares the cost-effectiveness of renewable energy technologies versus conventional ones, emphasizing the cost benefits under different scenarios including U.S. federal tax subsidies.
levelized cost of energy, renewable energy, conventional energy, cost comparison, tax subsidies, energy analysis
Single Chart
Roland Berger
Saved
Slide with text descriptions and symbolic icons
Market Analysis and Trends
Retail & E-commerce
Discusses key influences on the 2018 holiday season, highlighting the role of Chinese consumers and the impact of economic factors on global retail.
holiday season, retail, Chinese market, economic factors
Header Vertical
Bain
Saved
The slide features text discussing efficiency measures in pharma and a line chart comparing TSR of pharma against other stock markets.
Financial Performance
Healthcare & Pharmaceuticals
This slide highlights how efficiency measures in the pharma industry have driven strong investor returns, with comparative data on stock performance.
efficiency measures, investor returns, TSR, stock markets, pharma industry
Multiple Chart
Roland Berger
Saved
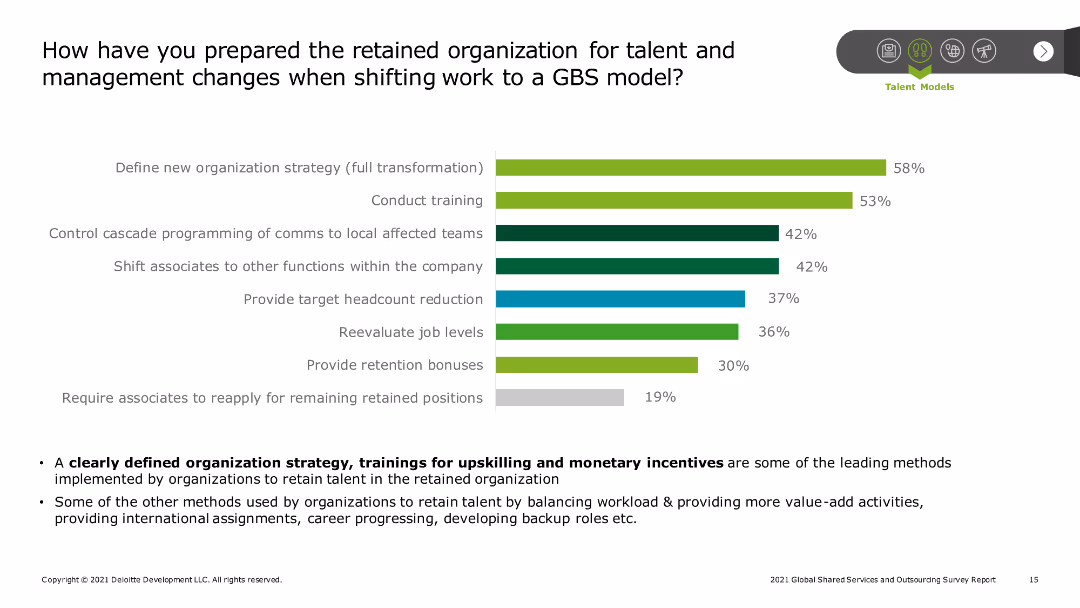
The slide features a column chart showing the preparation methods for retained organizations during a shift to a GBS model. Additional text outlines key strategies and percentages of adoption.
Human Resources and Talent Management
Professional Services
The slide outlines methods organizations use to prepare for talent and management changes when shifting work to a GBS model, including new strategies, training, headcount reduction, and job level reevaluation.
GBS model, talent management, training, strategy, headcount reduction
Mixed Chart
Deloitte
Saved
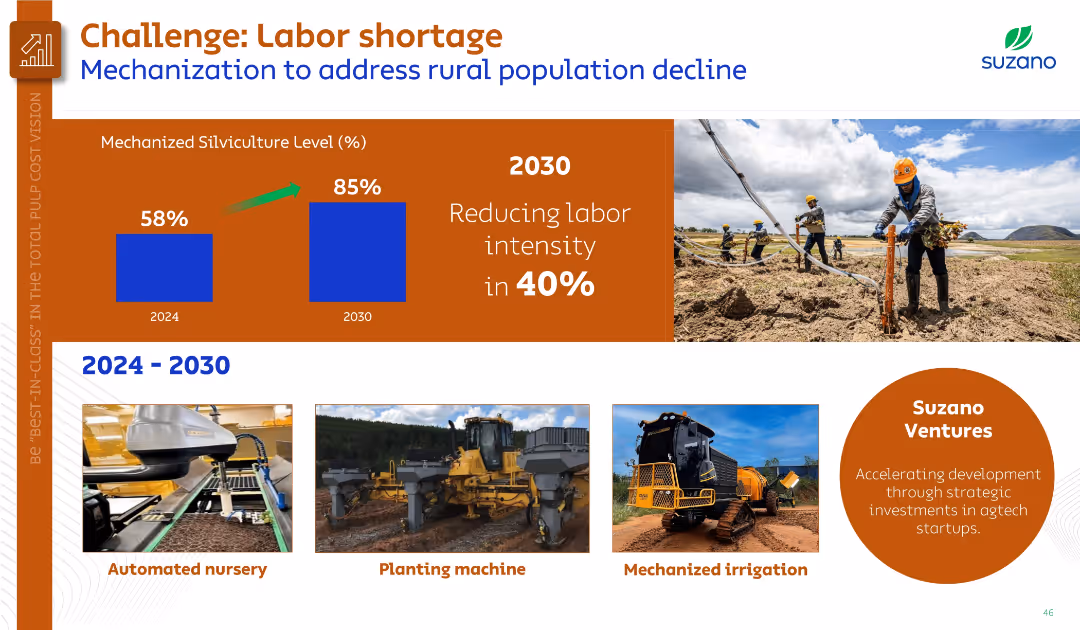
Combination of bar chart (mechanization levels), text, and images of mechanized equipment and planting.
Human Resources and Talent Management
Agriculture & Food Production
Addresses the impact of rural labor shortages on silviculture operations, proposing increased mechanization from 58% to 85% by 2030. Shows equipment like automated nurseries and planting machines along with Suzano Ventures’ agtech focus.
labor shortage, mechanization, silviculture, agtech, Suzano Ventures
Mixed Chart
Goldman Sachs
Saved
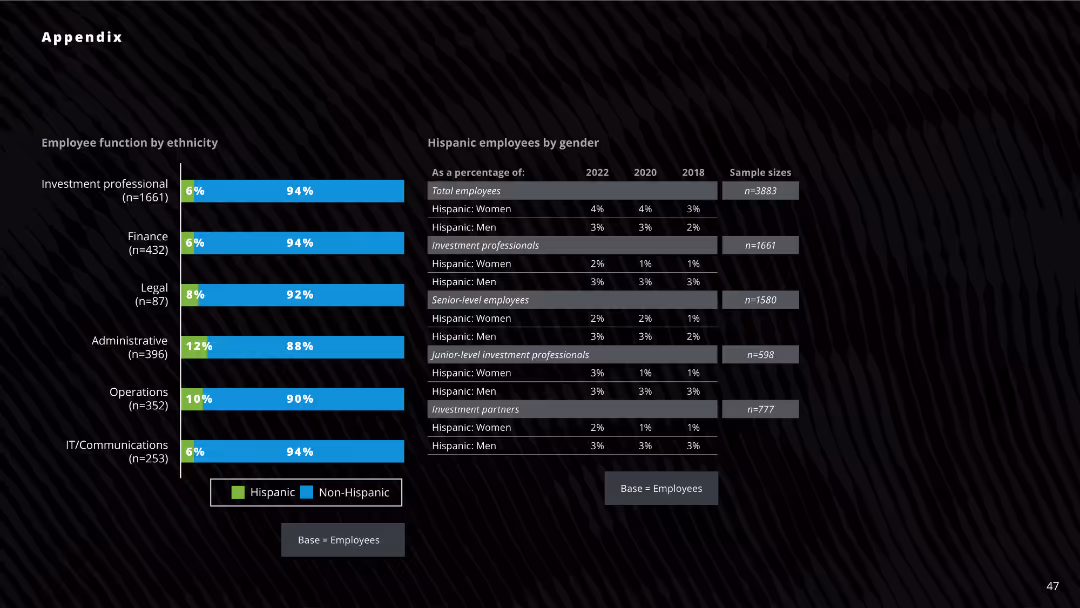
The slide features two column charts displaying the percentage distribution of employees by ethnicity and gender across various functions. The layout is visually dense, with a dark background and blue and green bars.
Human Resources and Talent Management
Professional Services
The slide presents the breakdown of employees by ethnicity and gender across different job functions in a company. It highlights the percentage of Hispanic and non-Hispanic employees and the distribution of Hispanic employees by gender from 2018 to 2022.
ethnicity, gender, employee distribution, column chart, job functions, Hispanic, non-Hispanic, professional services, HR
Mixed Chart
Deloitte
Saved
Showcases column chart and quotes within a visual narrative, using green tones to emphasize the thematic focus on 'green' investments.
Investment Analysis
Financial Services
Discusses the acceleration of green capital in Southeast Asia, identifying patterns and challenges in investment scalability.
green capital, SEA, investment trends, scalability, capital flow
Mixed Chart
Bain
Saved
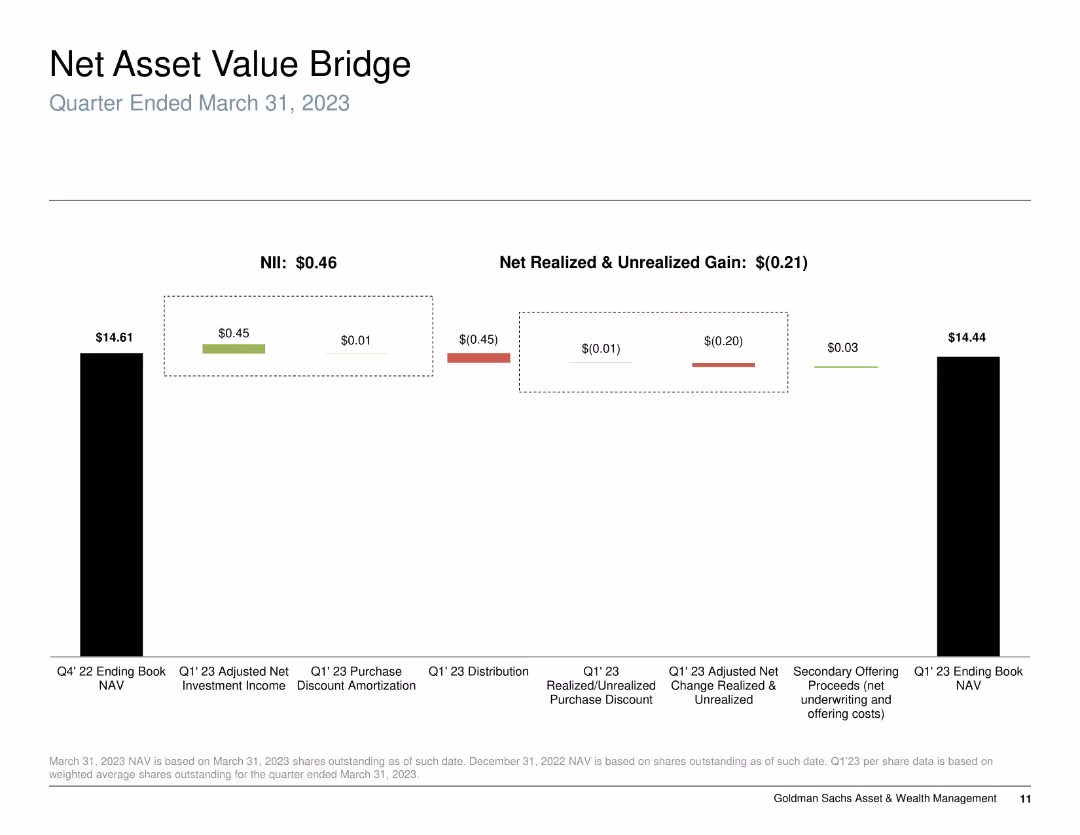
Column chart showing the changes in net asset value (NAV) over a specific quarter, with detailed components.
Financial Performance
Financial Services
Details the changes in NAV, including investment income, realized and unrealized gains/losses, and other factors affecting NAV.
NAV, net asset value, investment income, gains
Single Chart
Goldman Sachs
Saved
Previous
Next
If nothing, comes up, please save your slides first
Create a FREE account to continue browsing
Receive Instant Access to 1,000+ slides from companies like McKinsey, Google, and Goldman Sachs
First Name
Last Name
Email
Password
I agree to all
Terms & Privacy Policy
Thank you! Your submission has been received!
Oops! Something went wrong while submitting the form.
Have an account?
Sign in
Column Chart
Heatmap
Chevron
Org Chart
Infographic
Callouts
Timeline
List
Graphic
Picture
Process Flow
Diagram
Paragraph
Map
Table
Framework
Subtitle
Takeaway Box
Icon
Other Chart
Radar Chart
Waterfall Chart
Mekko Chart
Pie Chart
Scatter Plot
Line Chart
Bar chart
Bullet points