My Account
My Slides
Search by Category
Templates
View All Templates
Download Template Slides
Leave Feedback
Login
Logout
Get Started
Browse all Slides
Browse all Slides
Create a FREE Account
Instant access to 1,000+ real slides from top companies like McKinsey, BCG, Goldman Sachs, Google and many more!
First Name
Last Name
Email
Password
I agree to all
Terms & Privacy Policy
Thank you! Your submission has been received!
Oops! Something went wrong while submitting the form.
Have an account?
Sign in
Spark Your Next Big Idea with New Presentation Templates
VIEW ALL Templates
Welcome,
Welcome
PRO
Show Featured Only
Checkbox 8
Companies
Mckinsey
Bain
BCG
EY
Deloitte
Accenture
PwC/Strategy&
JP Morgan
Goldman Sachs
Morgan Stanley
Citigroup
Deutsche Bank
Barclays
LEK
KPMG
Kearney
Oliver Wyman
Booz Allen Hamilton
Gartner
IPSOS
Nielsen
Slide type
Text Only
Linear Flow
Vertical Flow
Single Chart
Header Horizontal
Mixed Chart
Header Vertical
Pillar
Multiple Chart
Graphic
Agenda
Title
Table
Framework
Industry
Technology & Software
Artificial Intelligence
Financial Services
Retail & E-commerce
Consumer Goods
Industrial & Manufacturing
Transportation & Logistics
Telecommunications
Real Estate & Construction
Hospitality & Tourism
Professional Services
Education & Training
Media & Entertainment
Agriculture & Food Production
Healthcare & Pharmaceuticals
Environmental Services & Sustainability
Government & Public Sector
Use Case
Mergers and Acquisitions
Performance Metrics and KPIs
Client Case Studies
Competitive Landscape
Corporate Finance and Valuation
Product and Service Analysis
Customer and Market Segmentation
Organizational Structure and Change
Industry Overview
Regulatory and Compliance
Risk Assessment and Management
Investment Analysis
Organizational Structure and Change
Human Resources and Talent Management
Financial Performance
Market Analysis and Trends
Sales and Business Development
Human Resources and Talent Management
Clear all
Thank you! Your submission has been received!
Oops! Something went wrong while submitting the form.
Tag
View slide
The slide shows a bar chart comparing the top 5 services consumers use or want in an EV app across different regions (APAC, EMEA, North America). Icons and colors differentiate services.
Strategic Planning
Transportation & Logistics
The slide presents the results of a survey on the most desired features in EV apps, illustrating regional differences in consumer preferences. It aims to guide EV app development strategies.
EV apps, consumer preferences, regional analysis, digital tools, survey results
false
Strategic Planning
Transportation & Logistics transportation-and-logistics
Mixed Chart
PwC/Strategy&
View slide
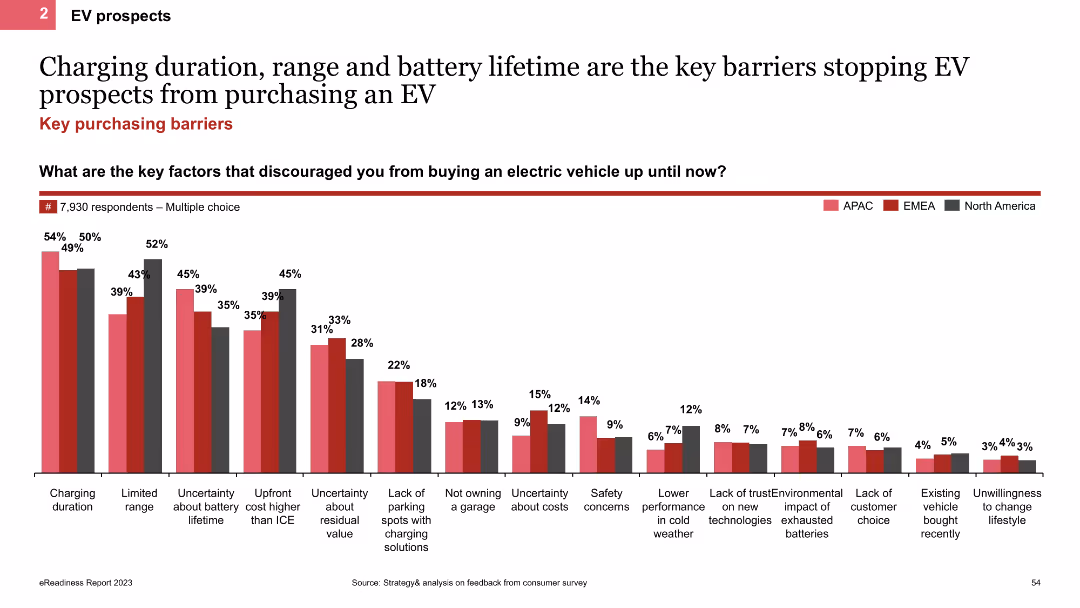
The slide uses a column chart to show the main barriers preventing EV purchases, such as charging duration, range, and battery lifetime. It includes regional comparisons indicated by colored bars for APAC, EMEA, and North America.
Market Analysis and Trends
Transportation & Logistics
This slide analyzes the key barriers to EV adoption, focusing on issues like charging duration, range, and battery lifetime. It provides regional data to show how these barriers vary across different areas.
EV barriers, column chart, charging duration, battery lifetime
false
Market Analysis and Trends
Transportation & Logistics transportation-and-logistics
Single Chart
PwC/Strategy&
View slide
Column charts compare the level of concern about environmental impacts of EV batteries between EV and ICE intenders, using two-tone color differentiation.
Regulatory and Compliance
Transportation & Logistics
Highlights environmental concerns related to electric vehicle batteries, crucial for regulatory compliance and sustainability strategies in the automotive and environmental sectors.
EV batteries, environmental impact, consumer concerns, regulatory compliance, sustainability, automotive industry, environmental strategy
false
Regulatory and Compliance
Transportation & Logistics transportation-and-logistics
Single Chart
Deloitte
View slide
Features a mix of text and stacked bar chart, showing the sourcing requirements for EV batteries and the global production shares of battery materials.
Strategic Planning
Transportation & Logistics
Discusses sourcing strategies for EV batteries under new regulations, highlighting dependency on specific countries. Essential for supply chain strategists in the automotive sector.
EV batteries, sourcing, supply chain, regulations, automotive, global production, trade
true
Strategic Planning
Transportation & Logistics transportation-and-logistics
Mixed Chart
BCG
View slide
Complex bar chart showing EV battery cost breakdown by component (e.g., raw material, CAM, cell production) with cost percentages and annotations.
Product and Service Analysis
Energy & Utilities
The slide breaks down the total cost structure of a lithium-ion EV battery pack (NCM 811) as of July 2021, attributing costs to materials, processing, and production. It highlights how semiconductor shortages increased costs by $2–3/kWh.
EV battery, cost breakdown, lithium-ion, NCM 811, material costs, CAM, cell production
false
Product and Service Analysis
Energy & Utilities energy-and-utilities
Single Chart
Roland Berger
View slide
Column chart showing the proportion of new business wins from EV projects from 2018 to 2020, using a grey and green color scheme to differentiate between non-EV and EV wins.
Strategic Planning
Industrial & Manufacturing
Focuses on the growth in new business awards related to electric vehicles (EV) for TI Fluid Systems, showing an increasing trend in EV market engagement from 2018 to 2020, reflecting strategic positioning in the evolving automotive market.
EV business, growth, 2018-2020, bar graph, strategic
false
Strategic Planning
Industrial & Manufacturing industrial-and-manufacturing
Mixed Chart
Deutsche Bank
View slide
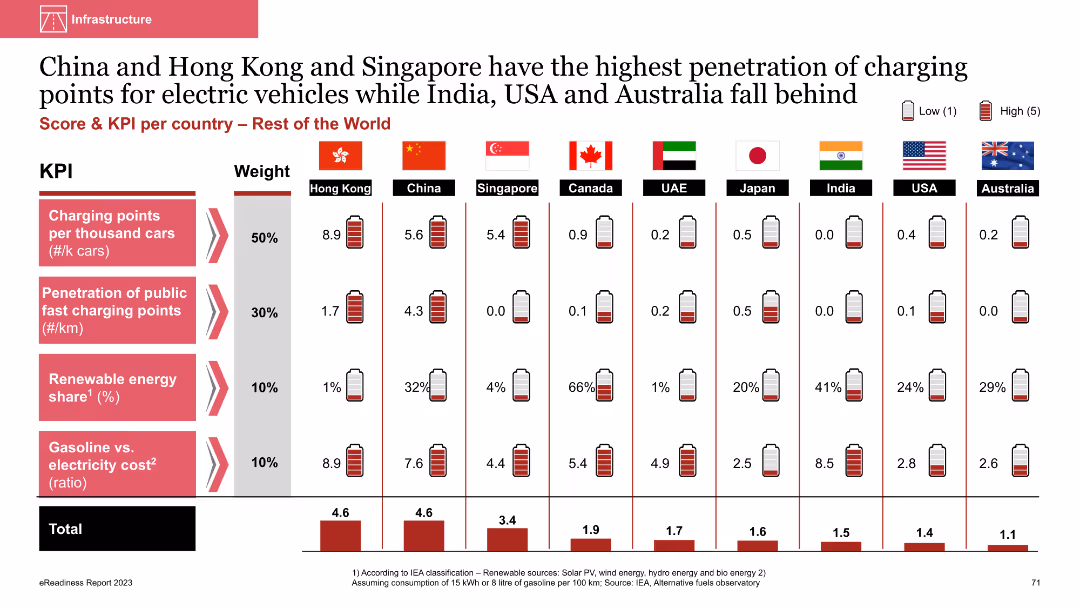
Column chart comparing EV charging infrastructure metrics across countries
Market Analysis and Trends
Energy & Utilities
This slide compares the penetration of EV charging points and renewable energy share across countries like China, Hong Kong, and Singapore, highlighting their advanced infrastructure compared to others
EV charging points, penetration, renewable energy, comparative analysis, international comparison
false
Market Analysis and Trends
Energy & Utilities energy-and-utilities
Multiple Chart
PwC/Strategy&
View slide
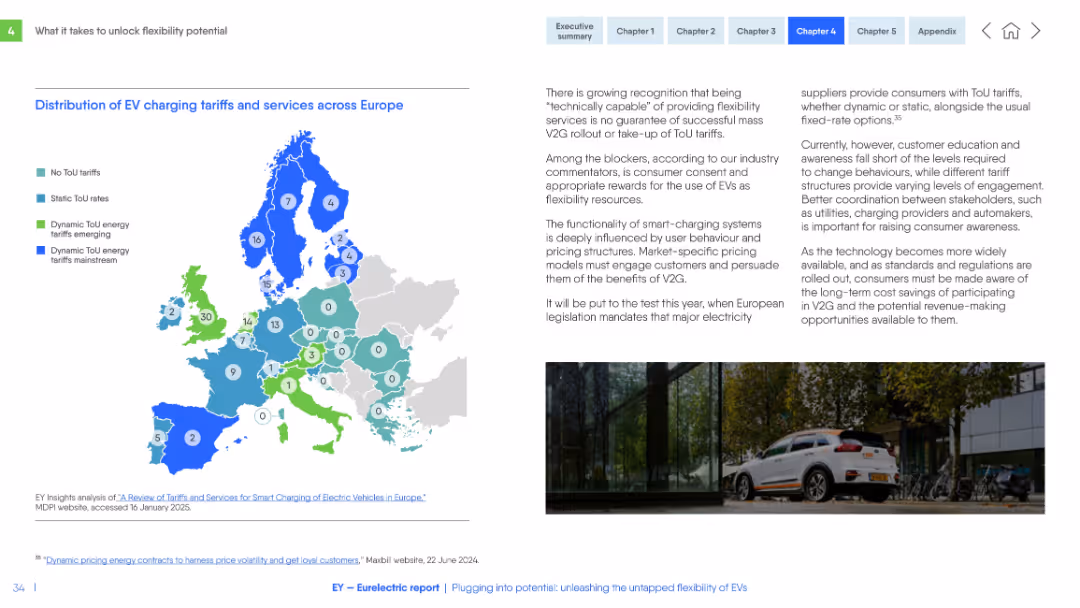
Color-coded map of Europe showing ToU tariffs. Text commentary on the right explains challenges of EV user engagement and pricing models.
Pricing Strategies
Transportation & Logistics
This slide maps the presence of time-of-use (ToU) tariffs across Europe and discusses consumer awareness, engagement levels, and regulatory implications of tariff adoption for EV smart-charging services.
EV charging, ToU tariffs, pricing models, Europe, consumer engagement, regulation, flexibility, energy services
false
Pricing Strategies
Transportation & Logistics transportation-and-logistics
Mixed Chart
EY
View slide
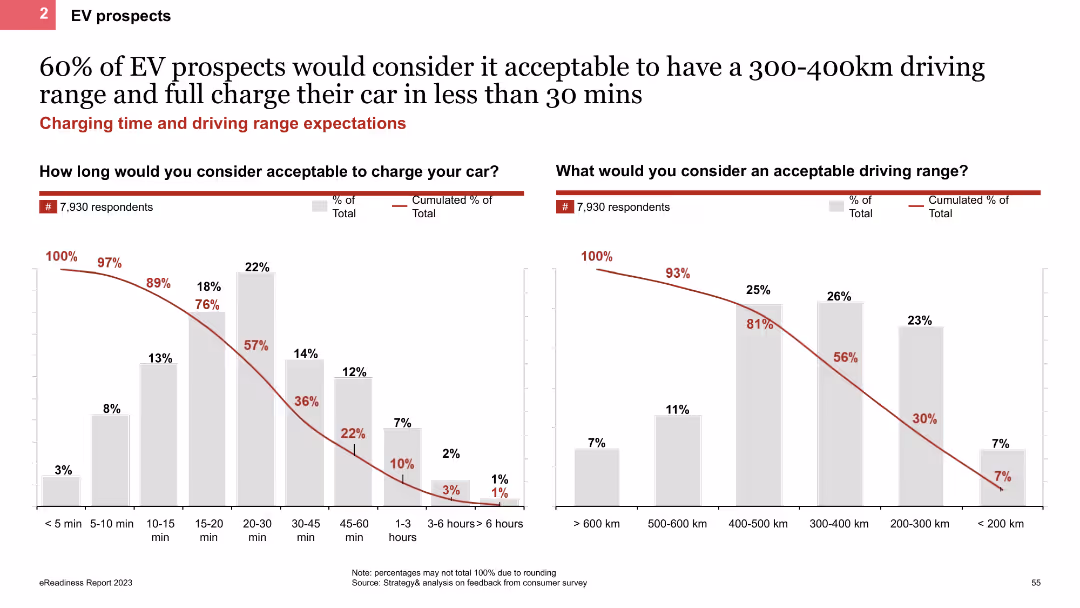
The slide contains two column charts displaying respondents' preferences for acceptable EV charging times and driving ranges. It includes clear labels and percentages, with data points highlighted for easy comparison.
Market Analysis and Trends
Transportation & Logistics
The slide highlights consumer expectations regarding EV charging times and driving ranges, based on a survey of 7,930 respondents. It aims to provide insights into the key factors influencing EV adoption.
EV charging, driving range, consumer preferences, survey data, electric vehicles
false
Market Analysis and Trends
Transportation & Logistics transportation-and-logistics
Multiple Chart
PwC/Strategy&
View slide
Bar charts detailing EV charging station penetration and infrastructure types.
Market Analysis and Trends
Energy & Utilities
Evaluates India's EV charging infrastructure development and market opportunities.
EV charging, infrastructure, India, market growth, investment
false
Market Analysis and Trends
Energy & Utilities energy-and-utilities
Mixed Chart
PwC/Strategy&
View slide
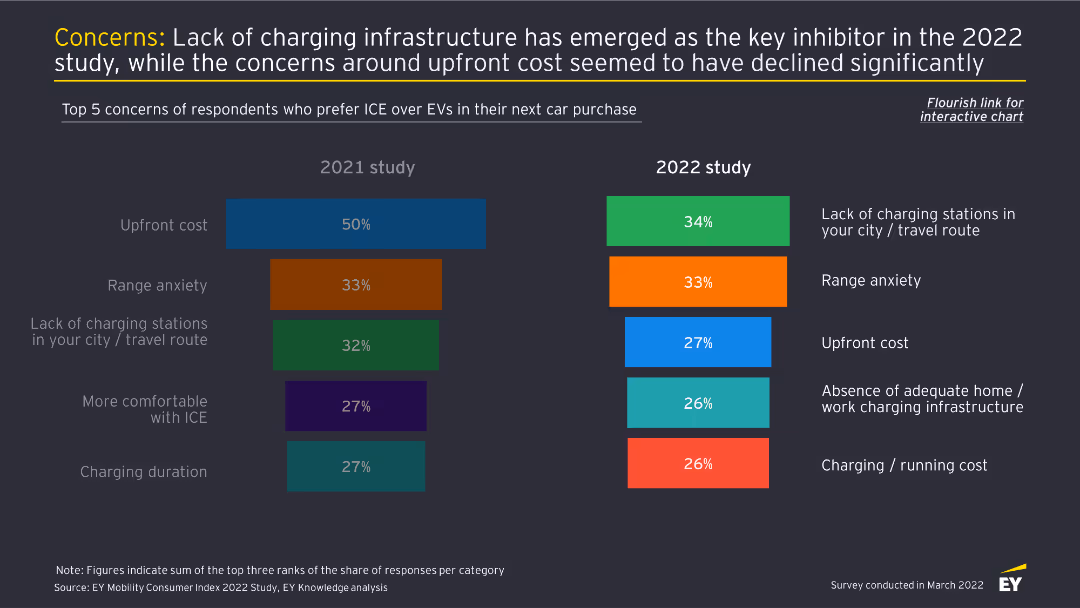
This slide features two column charts comparing the top five concerns about EV adoption between 2021 and 2022. Each concern is color-coded and ranked by percentage.
Market Analysis and Trends
Transportation & Logistics
The slide identifies the primary concerns of consumers preferring ICE over EVs, with lack of charging infrastructure being the top issue in 2022, and upfront cost concerns reducing significantly.
EV concerns, charging infrastructure, consumer behavior, market analysis, automotive industry
false
Market Analysis and Trends
Transportation & Logistics transportation-and-logistics
Multiple Chart
EY
View slide
The slide uses vertical bar charts to compare the top five concerns deterring EV adoption over three years (2021, 2022, 2023), each with different colors.
Market Analysis and Trends
Transportation & Logistics
This slide identifies the main concerns preventing consumers from buying EVs, such as lack of charging stations, limited range, and high purchase costs, across different years.
EV concerns, charging stations, purchase cost, range anxiety, consumer deterrents
false
Market Analysis and Trends
Transportation & Logistics transportation-and-logistics
Multiple Chart
EY
View slide
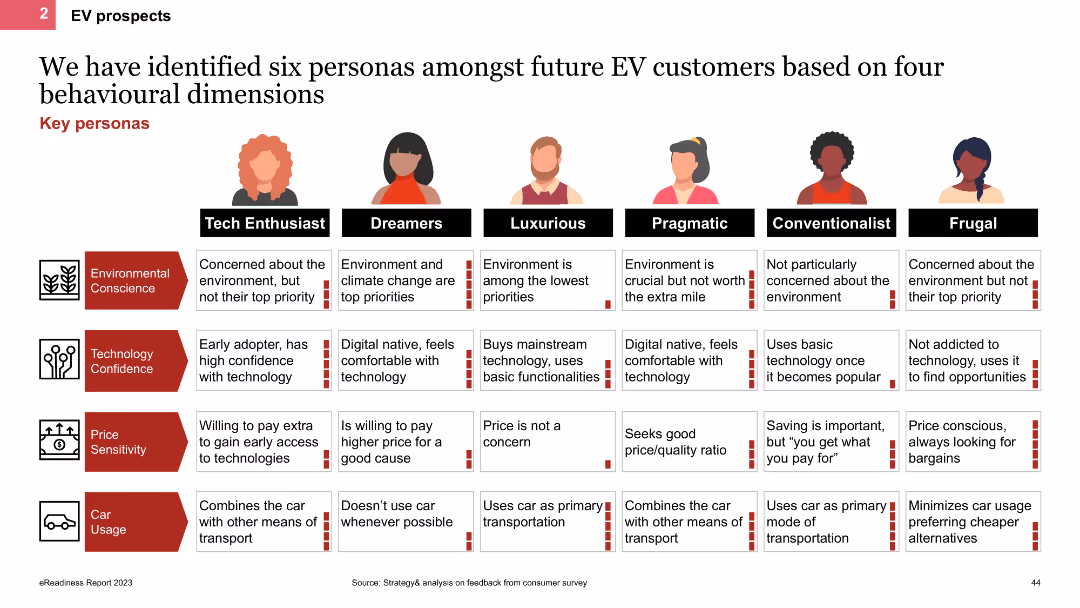
The slide features a comparative table outlining six personas of future EV customers (Tech Enthusiast, Dreamers, Luxurious, Pragmatic, Conventionalist, Frugal). Each persona is described based on environmental conscience, technology confidence, price sensitivity, and car usage.
Customer and Market Segmentation
Transportation & Logistics
This slide identifies six distinct personas of future EV customers, detailing their characteristics in terms of environmental conscience, technology confidence, price sensitivity, and car usage. It provides a framework for understanding diverse customer profiles.
EV customers, personas, behavioural dimensions, segmentation, characteristics, future trends
false
Customer and Market Segmentation
Transportation & Logistics transportation-and-logistics
Table
PwC/Strategy&
View slide
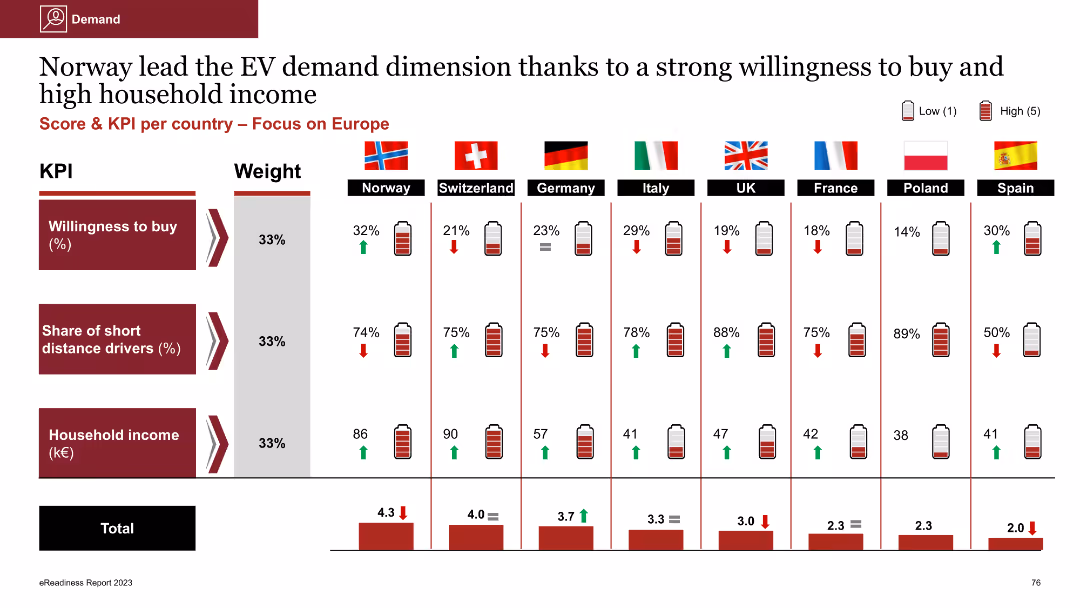
Column chart showing willingness to buy EVs, share of short distance drivers, and household income across Europe
Market Analysis and Trends
Energy & Utilities
This slide highlights Norway's lead in EV demand, supported by high willingness to buy and high household income, comparing these metrics with other European countries
EV demand, willingness to buy, household income, short distance drivers, European comparison
false
Market Analysis and Trends
Energy & Utilities energy-and-utilities
Multiple Chart
PwC/Strategy&
View slide
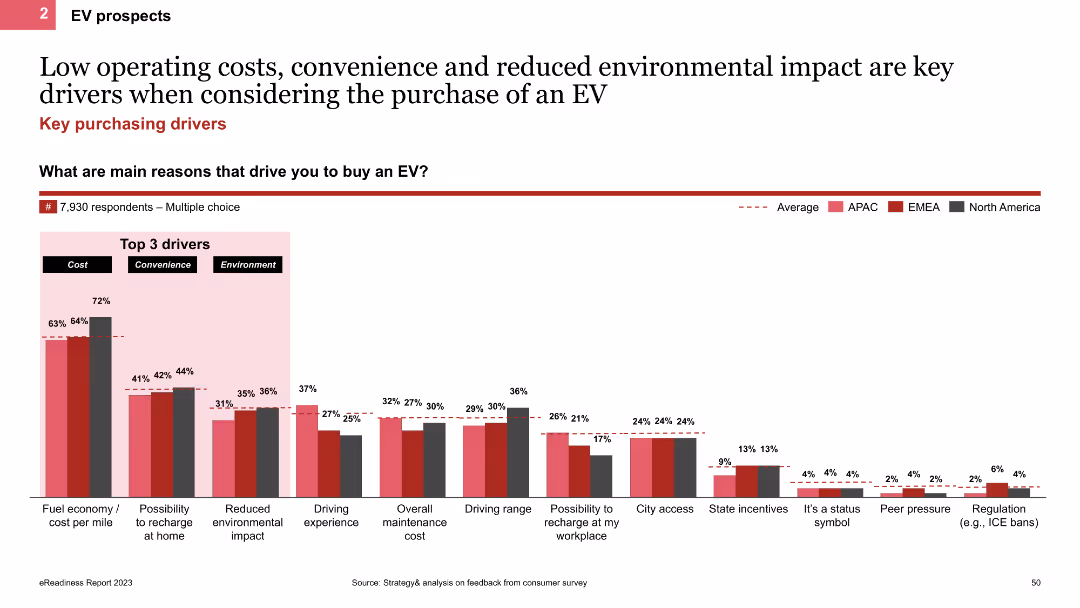
The slide features a column chart displaying the key reasons driving EV purchases, such as cost, convenience, and environmental impact. It also includes regional comparisons with colored bars representing APAC, EMEA, and North America.
Market Analysis and Trends
Transportation & Logistics
This slide analyzes the main drivers behind EV purchases, focusing on cost, convenience, and environmental impact. It provides a regional breakdown to show variations in purchasing motivations across different areas.
EV drivers, column chart, cost, convenience, environment
false
Market Analysis and Trends
Transportation & Logistics transportation-and-logistics
Single Chart
PwC/Strategy&
View slide
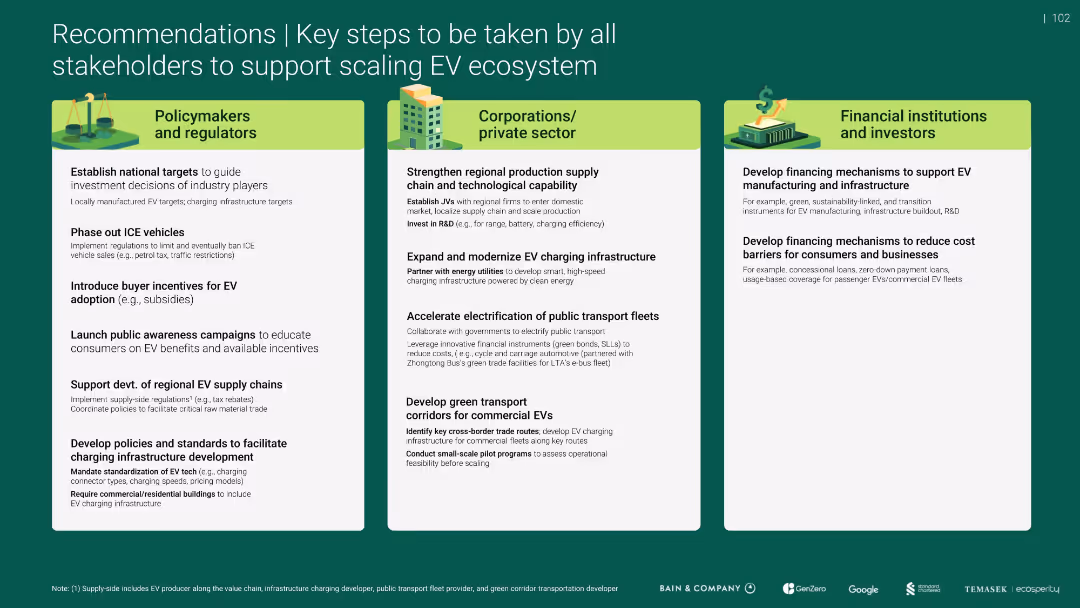
Triple-column layout with stakeholder categories; green color scheme; bullet points for action steps
Strategic Planning
Government & Public Sector
Provides tailored recommendations for scaling the EV ecosystem in SEA-6, targeting policymakers, private sector, and investors. Focuses on policy incentives, infrastructure development, and financial support mechanisms.
EV ecosystem, policy, infrastructure, investment, public sector, subsidies
false
Strategic Planning
Government & Public Sector government-and-public-sector
Pillar
Bain
View slide
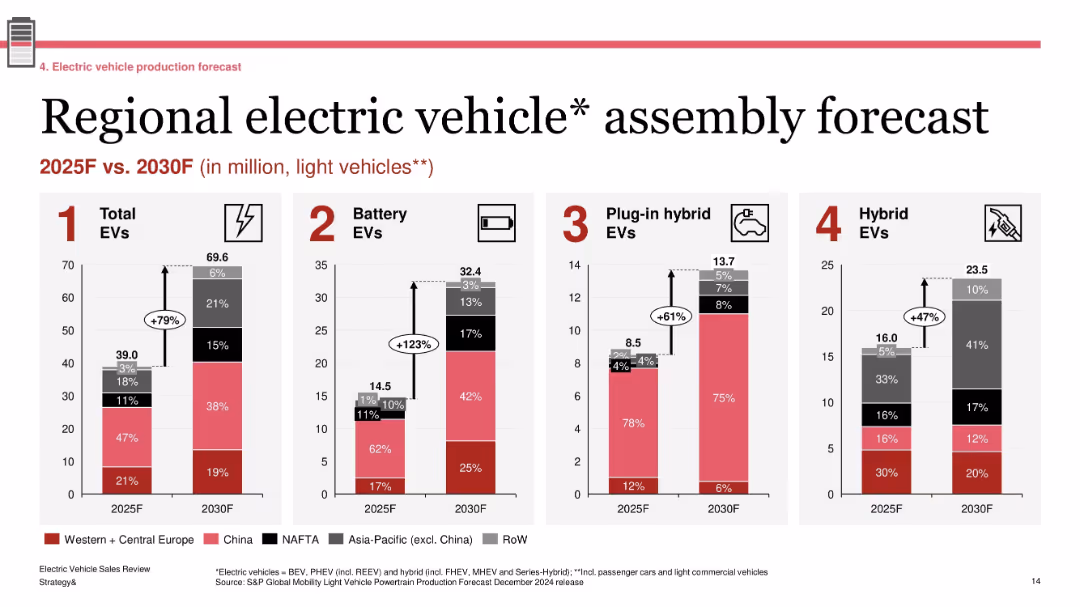
Four grouped bar charts showing production forecasts by region; labeled segments with growth percentages; standard red-gray-black color palette
Technology and Digital Transformation
Industrial & Manufacturing
The slide forecasts EV assembly volumes across major global regions between 2025 and 2030. It projects a 79% increase in total EVs, with battery EVs seeing the most significant growth (+123%). Regional shares are shown for each EV type (BEV, PHEV, Hybrid), emphasizing China and Western Europe as leading contributors.
EV forecast, regional production, BEV growth, 2030 outlook, light vehicles, automotive transformation
false
Technology and Digital Transformation
Industrial & Manufacturing industrial-and-manufacturing
Single Chart
PwC/Strategy&
View slide
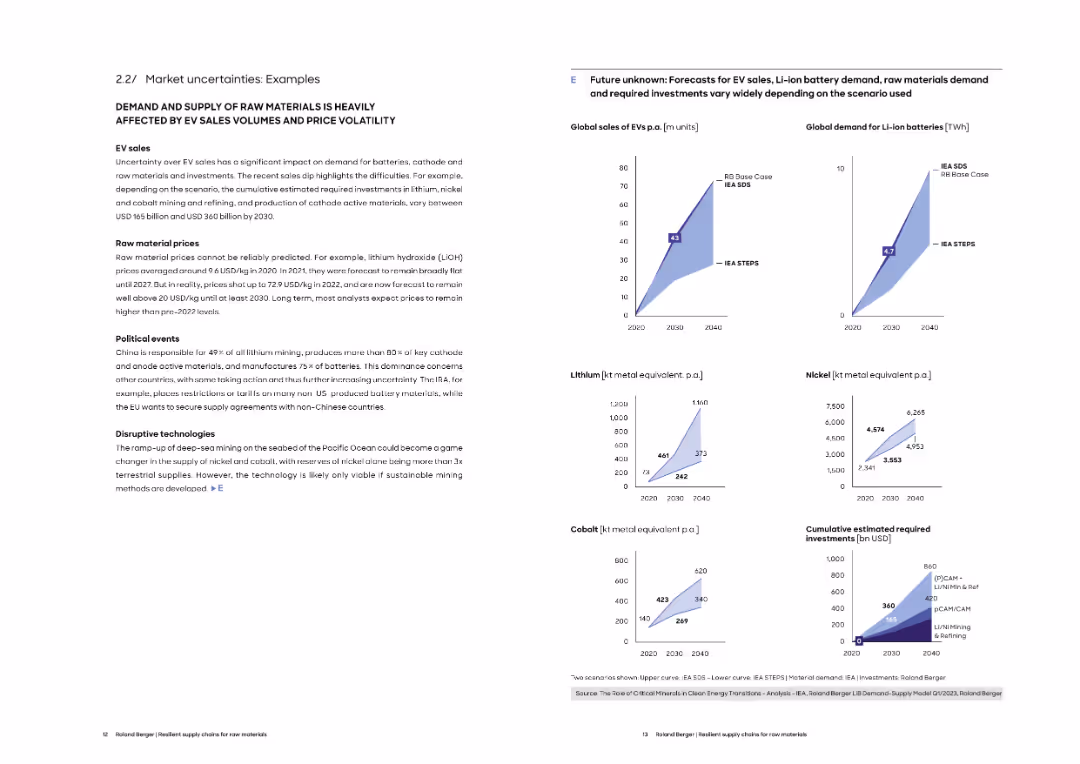
Left column provides narrative on EV sales, price volatility, and geopolitical issues. Right includes projected sales and demand curves under various scenarios.
Market Analysis and Trends
Energy & Utilities
This slide presents detailed scenarios of uncertainty affecting EV-related raw material markets. It compares forecast models for EV sales, Li-ion battery demand, and investment needs, reflecting varied assumptions and outcomes.
EV forecasts, battery demand, lithium, nickel, cobalt, scenario analysis, investment needs
false
Market Analysis and Trends
Energy & Utilities energy-and-utilities
Multiple Chart
Roland Berger
View slide
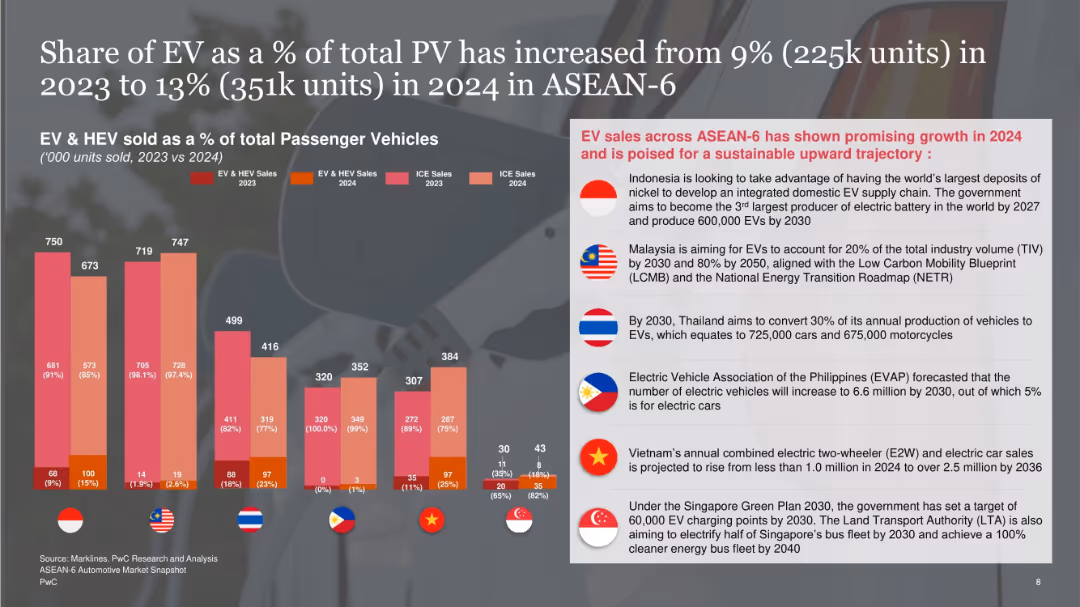
Vertical stacked bar charts of EV/HEV vs ICE vehicles by country on the left; right side has country-wise future targets and government initiatives on a shaded overlay.
Technology and Digital Transformation
Industrial & Manufacturing
Highlights EV and HEV penetration growth in ASEAN-6 from 2023 to 2024, rising to 13%. Presents government targets for EV adoption in each country, with emphasis on infrastructure development and regulatory support.
EV growth, ASEAN-6, government policy, electric vehicles, infrastructure, targets
false
Technology and Digital Transformation
Industrial & Manufacturing industrial-and-manufacturing
Mixed Chart
PwC/Strategy&
View slide
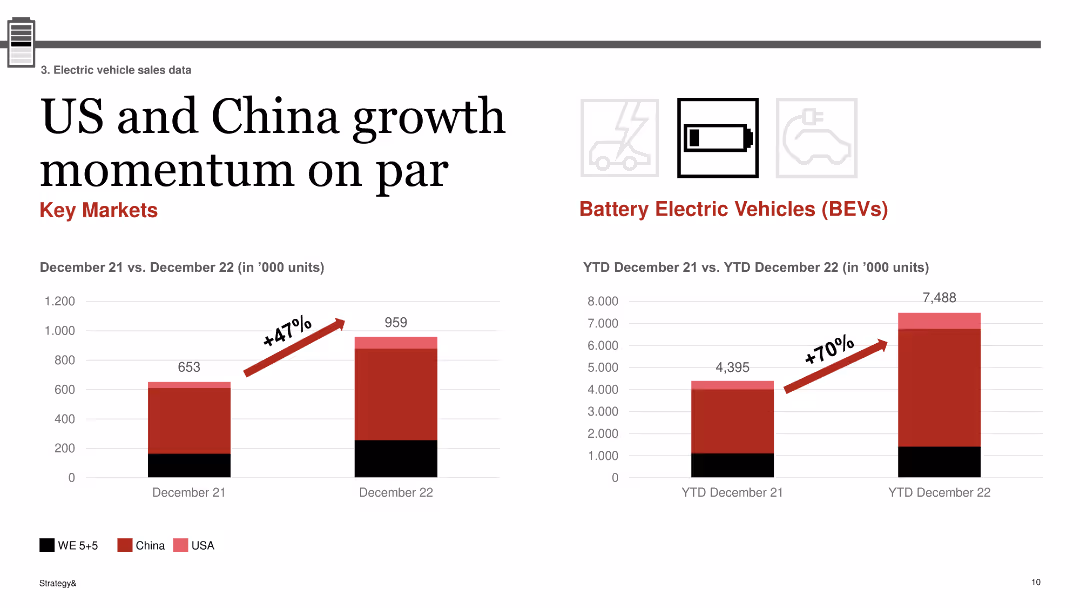
The slide includes two column charts: one showing growth in EV sales in the USA and China from December 21 to December 22, and the other showing BEV sales growth from December 21 to December 22.
Market Analysis and Trends
Transportation & Logistics
The slide highlights the parallel growth momentum in EV sales between the USA and China, with both markets experiencing significant increases in sales, demonstrating similar growth trajectories in the adoption of battery electric vehicles (BEVs).
EV growth, USA, China, BEV, sales momentum, comparison
false
Market Analysis and Trends
Transportation & Logistics transportation-and-logistics
Multiple Chart
PwC/Strategy&
View slide
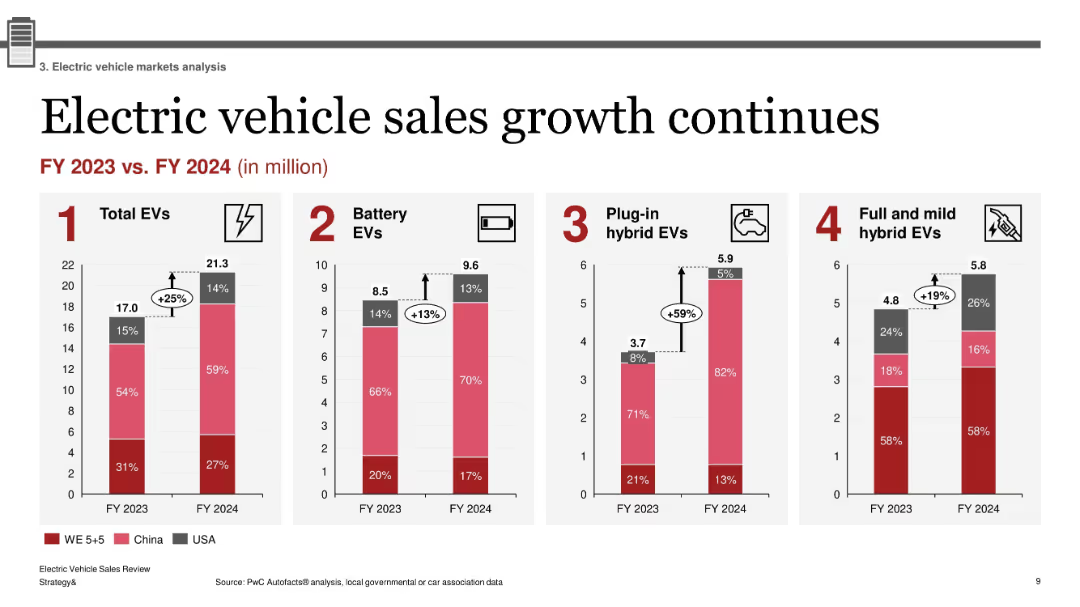
Four-column chart layout; red and gray vertical bar charts; minimal text above each chart; percentage growth bubbles; clean and consistent infographic style
Market Analysis and Trends
Industrial & Manufacturing
The slide illustrates year-over-year growth in EV sales across four categories (Total EVs, Battery EVs, Plug-in Hybrids, and Hybrids) from FY2023 to FY2024. It shows a 25% increase in total EVs, with notable growth in PHEVs (+59%). Sales are broken down by region (Western Europe, China, USA).
EV growth, battery EV, plug-in hybrid, market trends, regional EV sales, FY2024, BEV, hybrid EVs, PHEV
false
Market Analysis and Trends
Industrial & Manufacturing industrial-and-manufacturing
Multiple Chart
PwC/Strategy&
View slide
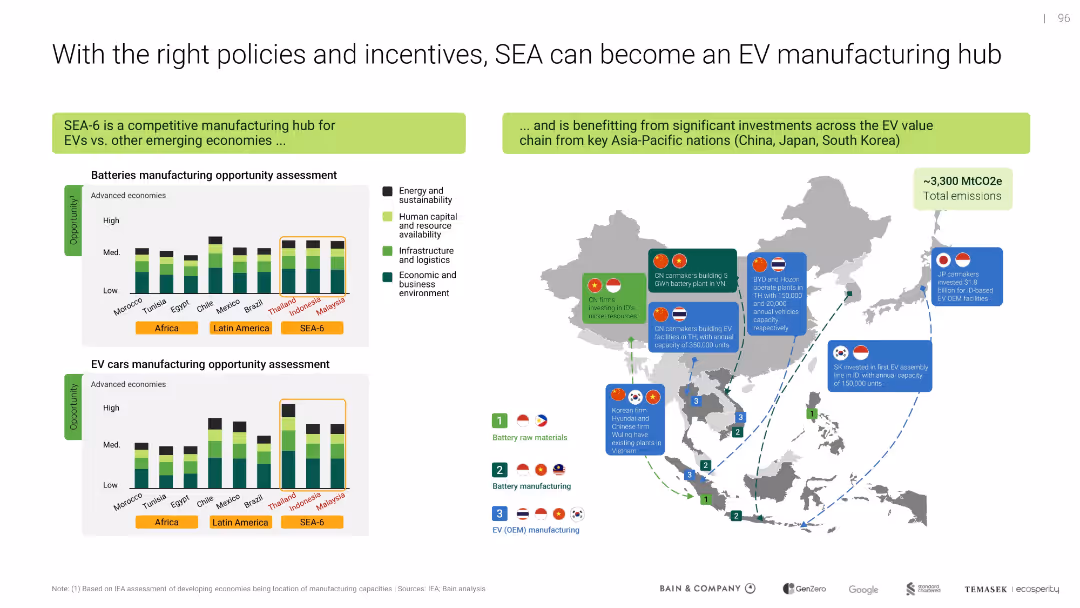
Map and bar charts show manufacturing opportunities and key investments; clear segmentation of countries and metrics
Strategic Planning
Industrial & Manufacturing
Highlights SEA-6's potential to become an EV manufacturing hub given supportive policies and investment flows from regional powers. Compares competitive advantages across battery and EV car manufacturing sectors.
EV hub, SEA-6, manufacturing, batteries, policy, incentives, investment
false
Strategic Planning
Industrial & Manufacturing industrial-and-manufacturing
Multiple Chart
Bain
View slide
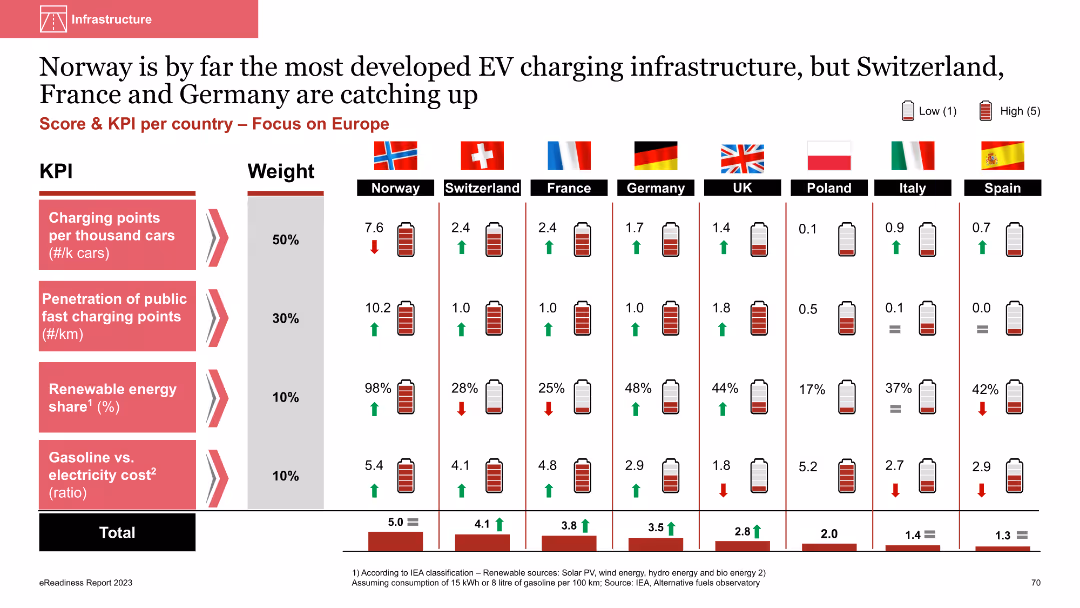
Column chart with multiple KPIs showing EV infrastructure status across European countries
Market Analysis and Trends
Energy & Utilities
The slide shows Norway's leading position in EV infrastructure, with metrics like charging points and renewable energy share, and compares it with other European countries. Norway leads significantly in all categories
EV infrastructure, charging points, renewable energy, comparative analysis, European countries
false
Market Analysis and Trends
Energy & Utilities energy-and-utilities
Multiple Chart
PwC/Strategy&
View slide
The slide uses column charts to show the intention to buy electric vehicles among different personas. It also features radial gauges indicating EV preference among each persona group. The layout is dense with multiple visual elements, including icons and illustrations.
Customer and Market Segmentation
Transportation & Logistics
This slide illustrates the EV purchase intentions among different personas, highlighting Tech Enthusiasts, Dreamers, Luxurious, and Pragmatic as key segments. It provides data on cluster sizes, regional distribution, and EV preference, focusing on key target groups.
EV intention, personas, column charts, radial gauges, target segments
false
Customer and Market Segmentation
Transportation & Logistics transportation-and-logistics
Multiple Chart
PwC/Strategy&
View slide
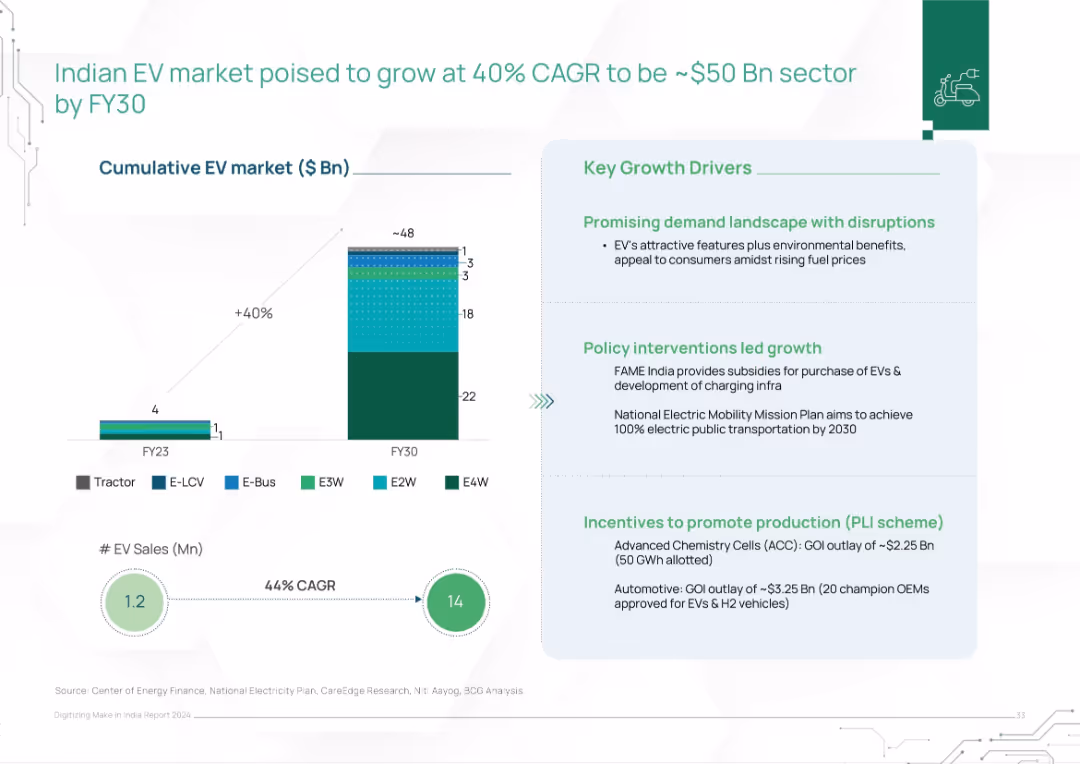
Bar chart comparing EV market size FY23 vs FY30. Segmented by EV types. Text box outlines growth drivers.
Market Analysis and Trends
Transportation & Logistics
This slide projects India’s EV market to grow to $50B by FY30 with a 40% CAGR, backed by strong policy support, consumer interest, and production incentives. EV sales are expected to rise from 1.2M to 14M units, across diverse vehicle segments.
EV market, electric vehicles, India, CAGR, growth, FY30, policy, FAME, incentives, clean mobility
false
Market Analysis and Trends
Transportation & Logistics transportation-and-logistics
Mixed Chart
BCG
View slide
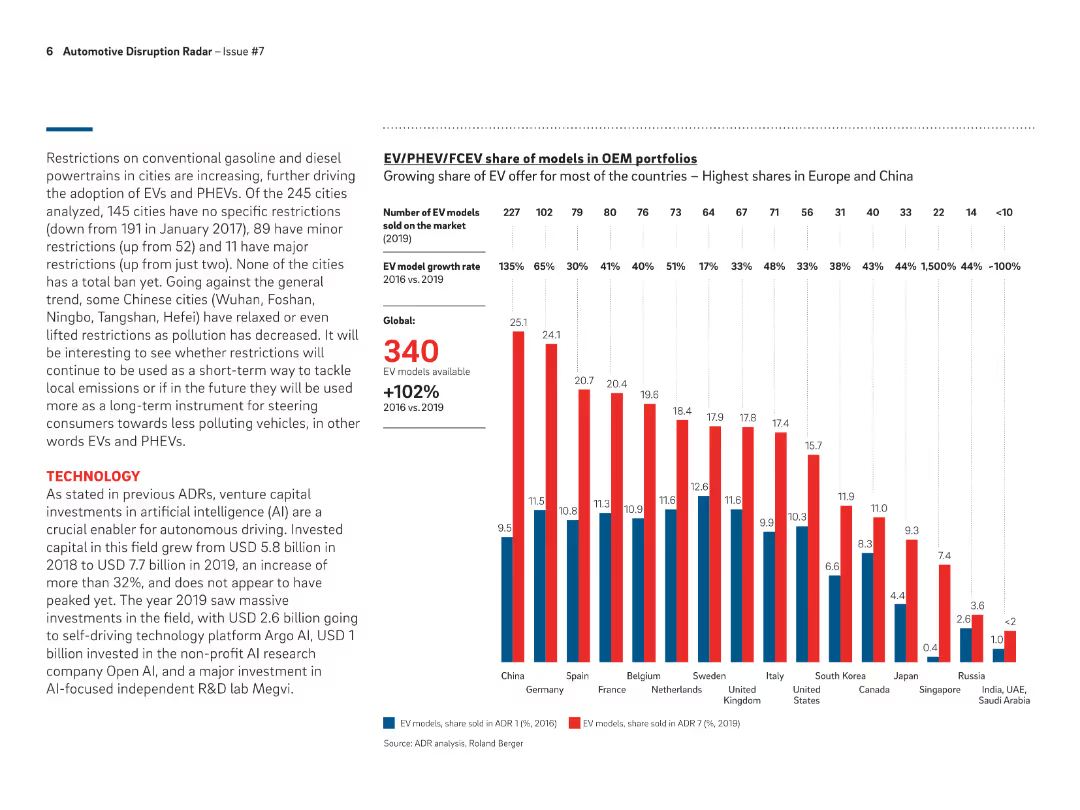
Bar chart showing the share of EV models in OEM portfolios across different countries in 2019, highlighting growth rates and number of models available globally.
Product and Service Analysis
Transportation & Logistics
Analyzes the growing share of EV models in OEM portfolios, with highest shares observed in Europe and China, and a global growth rate of 102% from 2016 to 2019.
EV models, OEM portfolios, growth rates, global, 2019
false
Product and Service Analysis
Transportation & Logistics transportation-and-logistics
Mixed Chart
Roland Berger
View slide
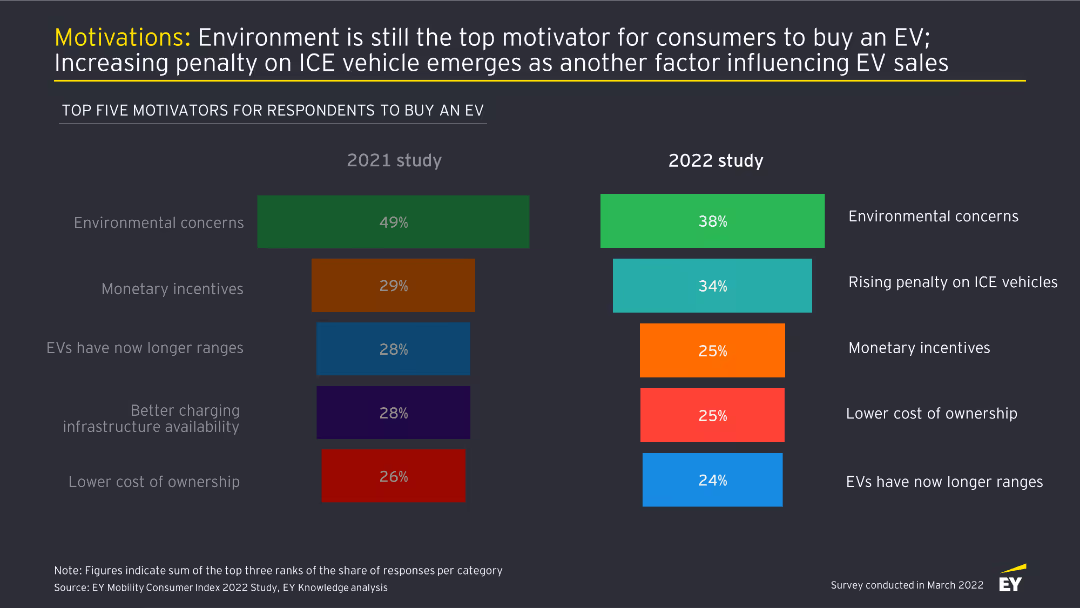
This slide contains two column charts comparing the top five motivators for buying an EV between 2021 and 2022. Each motivator is color-coded and ranked by percentage.
Market Analysis and Trends
Transportation & Logistics
The slide highlights the main reasons consumers choose to buy electric vehicles, with environmental concerns remaining the top motivator, and rising penalties on ICE vehicles becoming more significant in 2022.
EV motivations, environmental concerns, consumer behavior, market trends, automotive industry
false
Market Analysis and Trends
Transportation & Logistics transportation-and-logistics
Multiple Chart
EY
View slide
The slide uses vertical bar charts to compare top five motivators for respondents to buy an EV across three different years (2021, 2022, 2023). Each year's motivators are color-coded.
Market Analysis and Trends
Transportation & Logistics
This slide highlights the key motivators for potential EV buyers, showing how priorities like environmental concerns, high fuel prices, and penalties on ICE vehicles have shifted over time.
EV motivators, fuel prices, environmental concerns, ICE penalties, buyer priorities
false
Market Analysis and Trends
Transportation & Logistics transportation-and-logistics
Multiple Chart
EY
View slide
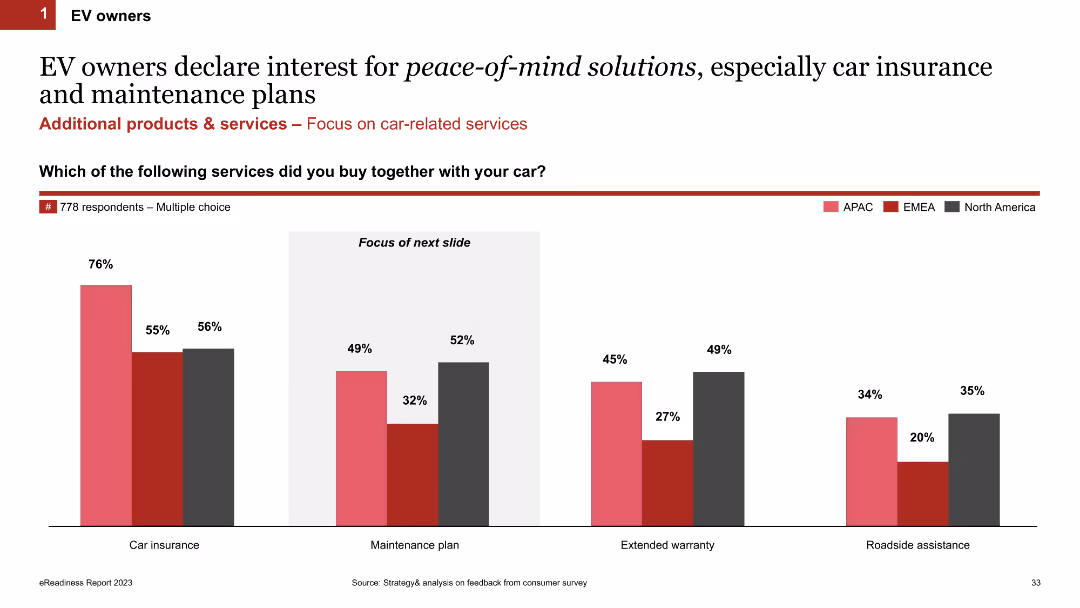
Column chart showing percentages of additional services bought by EV owners across different regions (APAC, EMEA, North America)
Market Analysis and Trends
Transportation & Logistics
This slide presents survey data on additional services purchased by EV owners, highlighting regional differences in the uptake of car insurance and maintenance plans.
EV owners, car insurance, maintenance, services, regional analysis
false
Market Analysis and Trends
Transportation & Logistics transportation-and-logistics
Single Chart
PwC/Strategy&
View slide
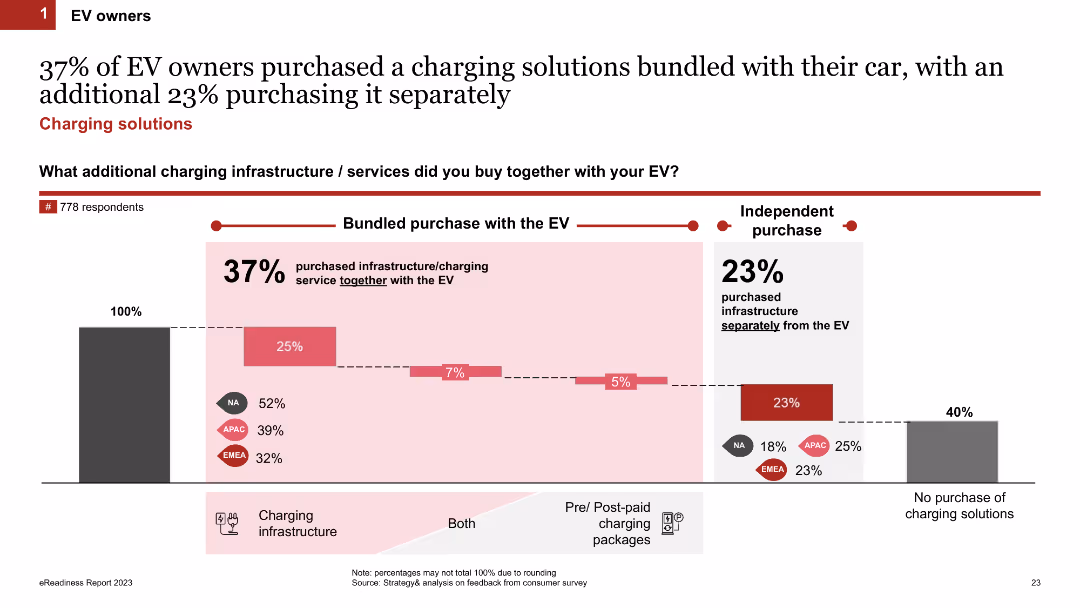
Column chart displaying percentages of EV owners who purchased charging solutions bundled with their car or separately. The slide uses shades of red and grey, includes regional breakdowns, and has text annotations explaining the data.
Market Analysis and Trends
Transportation & Logistics
This slide shows the percentage of EV owners who purchased charging solutions bundled with their car, separately, or not at all. It includes regional data from NA, APAC, and EMEA regions, highlighting purchasing trends.
EV owners, charging solutions, bundled purchase, regional breakdown, purchasing trends
false
Market Analysis and Trends
Transportation & Logistics transportation-and-logistics
Single Chart
PwC/Strategy&
Previous
Loading...
Hold On!
We are searching in our database
If nothing, comes up, please try different filters!
Column Chart
Heatmap
Chevron
Org Chart
Infographic
Callouts
Timeline
List
Graphic
Picture
Process Flow
Diagram
Paragraph
Map
Table
Framework
Subtitle
Takeaway Box
Icon
Other Chart
Radar Chart
Waterfall Chart
Mekko Chart
Pie Chart
Scatter Plot
Line Chart
Bar chart
Bullet points
Create a FREE account to continue browsing
Receive Instant Access to 1,000+ slides from companies like McKinsey, Google, and Goldman Sachs
First Name
Last Name
Email
Password
I agree to all
Terms & Privacy Policy
Thank you! Your submission has been received!
Oops! Something went wrong while submitting the form.
Have an account?
Sign in
Upgrade to PRO to Save slides
Advanced Search and Filters
Access to 15,000+ slides
Access to Category Pages
Save/Bookmark Slides
PowerPoint Template Library
Pick a Plan
MONTHLY
$12/month
Billed every month, Cancel anytime.
YEARLY
$9/year
Billed $108 annually, Cancel anytime.
Checkout for $12/month
Checkout for $108/yr
Secured by Stripe | AES-256 bit encryption


![Batteries are key for electrification – EV battery pack cost ca. 130 USD/kWh, depending on technology/design, location, and material prices [Jul 2021 figures]](https://cdn.prod.website-files.com/654e70fb59937215cac87b19/6896e49e87536d2c8f631147_gUCi-EabqOeV5oJ6xMWkmKCydv3SD-Km2BuVp7MIklo.avif)