My Account
My Slides
Search by Category
Templates
View All Templates
Download Template Slides
Leave Feedback
Login
Logout
Get Started
Browse all Slides
Browse all Slides
Create a FREE Account
Instant access to 1,000+ real slides from top companies like McKinsey, BCG, Goldman Sachs, Google and many more!
First Name
Last Name
Email
Password
I agree to all
Terms & Privacy Policy
Thank you! Your submission has been received!
Oops! Something went wrong while submitting the form.
Have an account?
Sign in
Spark Your Next Big Idea with New Presentation Templates
VIEW ALL Templates
Welcome,
Welcome
PRO
Show Featured Only
Checkbox 8
Companies
Mckinsey
Bain
BCG
EY
Deloitte
Accenture
PwC/Strategy&
JP Morgan
Goldman Sachs
Morgan Stanley
Citigroup
Deutsche Bank
Barclays
LEK
KPMG
Kearney
Oliver Wyman
Booz Allen Hamilton
Gartner
IPSOS
Nielsen
Slide type
Text Only
Linear Flow
Vertical Flow
Single Chart
Header Horizontal
Mixed Chart
Header Vertical
Pillar
Multiple Chart
Graphic
Agenda
Title
Table
Framework
Industry
Technology & Software
Artificial Intelligence
Financial Services
Retail & E-commerce
Consumer Goods
Industrial & Manufacturing
Transportation & Logistics
Telecommunications
Real Estate & Construction
Hospitality & Tourism
Professional Services
Education & Training
Media & Entertainment
Agriculture & Food Production
Healthcare & Pharmaceuticals
Environmental Services & Sustainability
Government & Public Sector
Use Case
Mergers and Acquisitions
Performance Metrics and KPIs
Client Case Studies
Competitive Landscape
Corporate Finance and Valuation
Product and Service Analysis
Customer and Market Segmentation
Organizational Structure and Change
Industry Overview
Regulatory and Compliance
Risk Assessment and Management
Investment Analysis
Organizational Structure and Change
Human Resources and Talent Management
Financial Performance
Market Analysis and Trends
Sales and Business Development
Human Resources and Talent Management
Clear all
Thank you! Your submission has been received!
Oops! Something went wrong while submitting the form.
Tag
View slide
The slide includes two column charts. The left chart shows the sales forecast for electric vehicles in the U.S. from 2012 to 2030, divided into plug-in hybrid and battery electric vehicles. The right chart presents the forecasted number of electric vehicle charging points in the U.S. from 2012 to 2030. Both charts use vertical bars and dotted lines to indicate future forecasts.
Market Analysis and Trends
Transportation & Logistics
This slide forecasts the growth of the electric vehicle market in the U.S., highlighting the increasing sales of electric vehicles and the expansion of charging infrastructure. It is intended to showcase the potential growth and investment opportunities in the electric vehicle sector.
Electric vehicles, market forecast, EV sales, charging infrastructure, transportation trends, market growth
false
Market Analysis and Trends
Transportation & Logistics transportation-and-logistics
Multiple Chart
JP Morgan
View slide
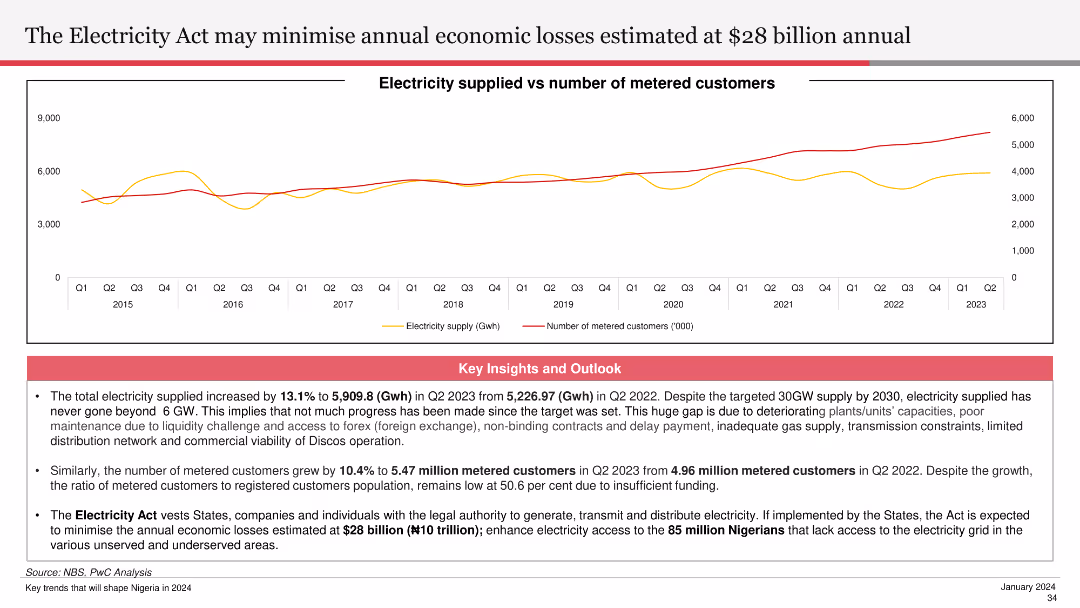
The slide includes a line chart showing electricity supplied versus the number of metered customers from Q1 2015 to Q2 2023. Key insights and outlooks discuss the potential economic impact of the Electricity Act and improvements in electricity supply.
Regulatory and Compliance
Energy & Utilities
This slide analyzes the expected impact of the Electricity Act on minimizing annual economic losses, highlighting improvements in electricity supply and customer metering. It discusses the Act's potential to enhance access and economic stability.
Electricity Act, economic losses, electricity supply, metered customers, economic stability
false
Regulatory and Compliance
Energy & Utilities energy-and-utilities
Mixed Chart
PwC/Strategy&
View slide
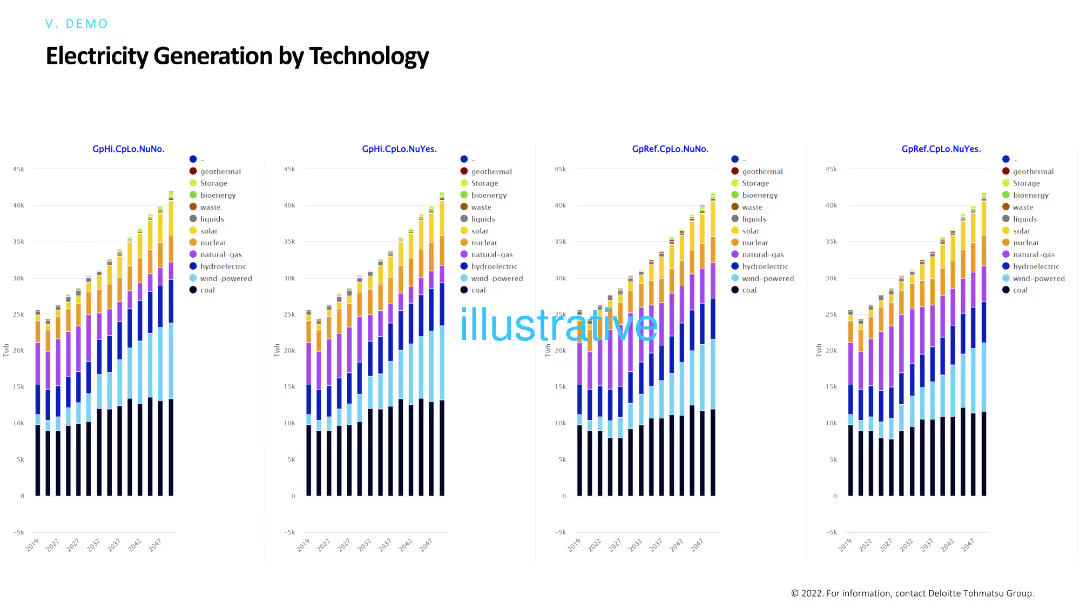
The slide includes multiple column charts comparing electricity generation by different technologies (geothermal, solar, nuclear, etc.) under various scenarios. Each chart shows a breakdown of technology contributions over time.
Technology and Digital Transformation
Energy & Utilities
This slide compares electricity generation technologies across different scenarios, highlighting the contributions of various sources like solar, wind, and nuclear, and projecting future energy mixes.
Electricity generation, technology, renewable energy, scenarios, energy mix
false
Technology and Digital Transformation
Energy & Utilities energy-and-utilities
Multiple Chart
Deloitte
View slide
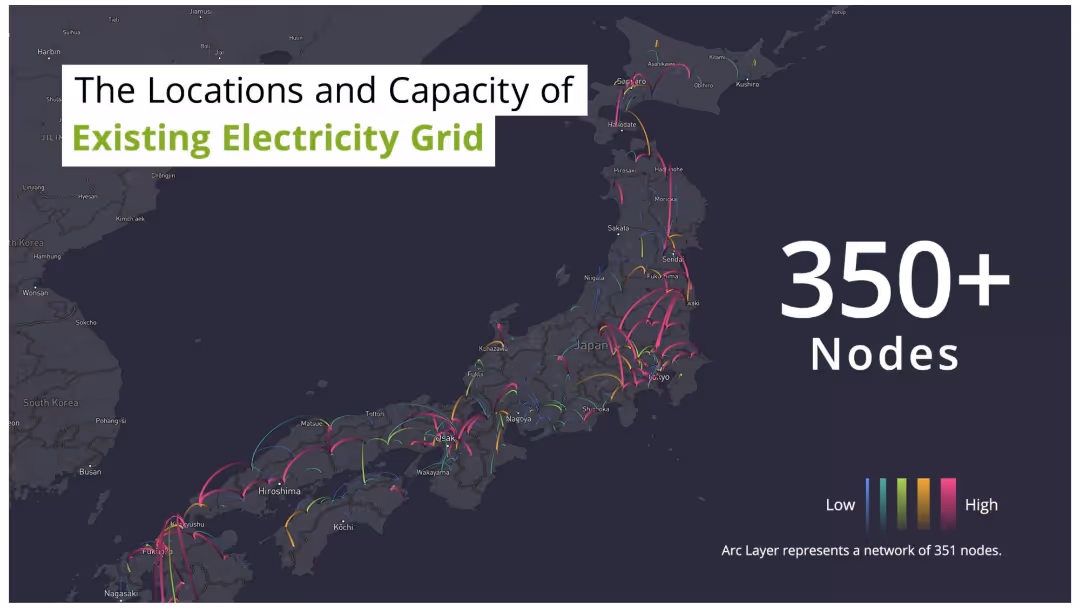
The slide features a dark map of Japan with arc lines connecting various points, indicating the locations and capacities of the electricity grid nodes. The arcs are color-coded from low to high capacity. There is also a legend.
Technology and Digital Transformation
Energy & Utilities
The slide provides an overview of the existing electricity grid in Japan, highlighting over 350 nodes with varying capacities. It's useful for understanding current infrastructure and planning upgrades.
Electricity grid, nodes, capacity, Japan, map
false
Technology and Digital Transformation
Energy & Utilities energy-and-utilities
Graphic
Deloitte
View slide
Utilizes bubble charts and linear elements to depict potential industry and societal values from digitalization in electricity, including negative impacts.
Market Analysis and Trends
Energy & Utilities
Discusses the digital transformation in electricity potentially unlocking $3.1 trillion in value, focusing on customer and emissions benefits.
Electricity, Digitalization, Societal Impact, Customer Value, Emissions Reduction
false
Market Analysis and Trends
Energy & Utilities energy-and-utilities
Mixed Chart
Accenture
View slide
The slide includes a bar chart showing the projected electricity demand growth by end-use technologies (TWh) from 2022 to 2050. Categories include Industrial, Commercial, Residential, Road Transport, and Other Transport. Each category has a detailed breakdown for the years 2022 and 2030.
Market Analysis and Trends
Energy & Utilities
This slide forecasts the doubling of power demand by 2050 due to electrification across various sectors. It emphasizes the significant growth in industrial and transport electricity demand, driven by technological advancements and increased adoption of electric vehicles.
Electrification, Power, Demand, Growth, 2050, Industrial, Transport
false
Market Analysis and Trends
Energy & Utilities energy-and-utilities
Mixed Chart
EY
View slide
Images of batteries, pie chart, partnership flowchart
Strategic Planning
Industrial & Manufacturing
LANXESS's partnership with TINCI in electrolyte production
Electrolyte, Batteries, Partnership, TINCI, Market Leader
false
Strategic Planning
Industrial & Manufacturing industrial-and-manufacturing
Mixed Chart
Morgan Stanley
View slide
Two sections are presented for "Electronics" and "Leonardo DRS" with red text highlighting financial data. Each section has a list of bullet points detailing strengths and initiatives. Icons represent each sub-sector. Column charts are incorrectly identified as bar charts in the OCR output.
Financial Performance
Industrial & Manufacturing
This slide indicates a positive outlook on the future potential of the electronics and defense sectors, with an emphasis on financials, such as backlog and revenue growth. It could be used to reassure stakeholders about the company's position and strategic direction in the market.
Electronics, Defense, Revenue Growth, Backlog, Strategic Direction
false
Financial Performance
Industrial & Manufacturing industrial-and-manufacturing
Header Vertical
Goldman Sachs
View slide
Features images of a digital banking interface, application components, and text descriptions on the side.
Technology and Digital Transformation
Technology & Software
Details J.P.Morgan's new product development for embedded banking, emphasizing speed and user experience.
Embedded Banking, Product Development, User Experience, J.P.Morgan, Digital Onboarding
false
Technology and Digital Transformation
Technology & Software technology-and-software
Header Horizontal
JP Morgan
View slide
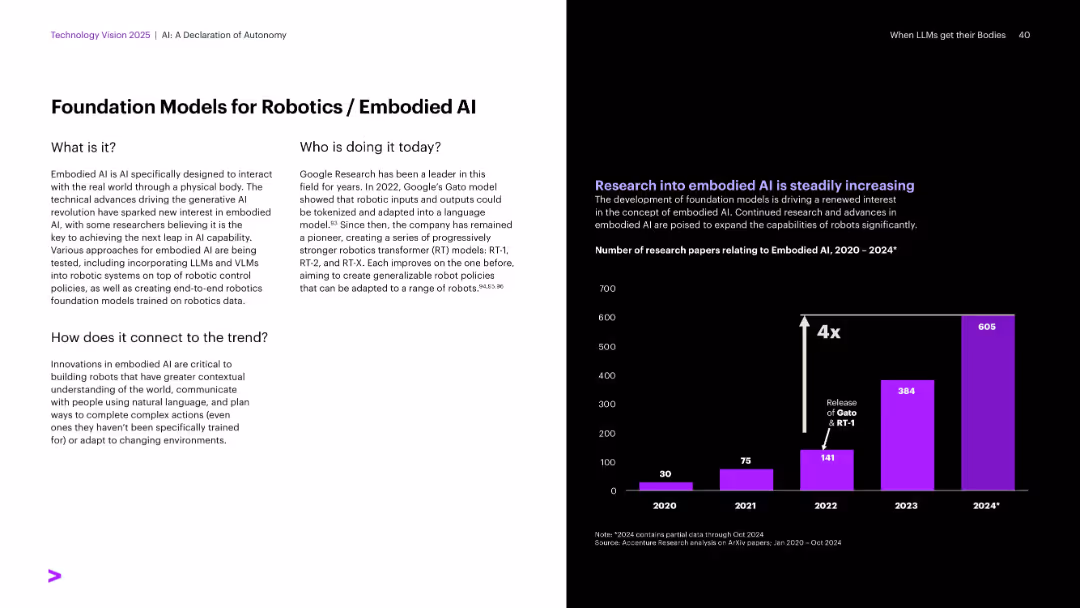
White text section on the left; dark background with vertical purple bar graph on the right.
Technology and Digital Transformation
Artificial Intelligence
Defines embodied AI and its application in robotics, emphasizing physical interaction with the world. Google’s Gato model and the RT-series are highlighted. A chart shows a 4x increase in related research papers, indicating growing industry interest and technological progress.
Embodied AI, robotics, Google Gato, RT models, foundation models
false
Technology and Digital Transformation
Artificial Intelligence artificial-intelligence
Mixed Chart
Accenture
View slide
Scatter plot comparing the Global Innovation Index and GDP per capita PPP for 2011 and 2019, focusing on emerging countries like India, Brazil, Mexico, Indonesia, Turkey, Russia, and China.
Technology and Digital Transformation
Technology & Software
The slide illustrates the progress of emerging countries in terms of innovation capabilities and economic development from 2011 to 2019. It shows how increased innovation has led to higher GDP per capita, highlighting the importance of sustained investment in technology and innovation for long-term growth.
Emerging Countries, Innovation, GDP, 2019
false
Technology and Digital Transformation
Technology & Software technology-and-software
Mixed Chart
Roland Berger
View slide
Multiple line charts display sovereign and corporate EMD spreads, along with local EMD yields. Each chart is color-coded for clarity.
Market Analysis and Trends
Financial Services
The slide provides an update on the emerging markets bond market, analyzing sovereign, corporate spreads, and local yields, presenting recent trends and averages.
Emerging Markets, Bond Market, EMD Spreads, Local Yields, Trends
false
Market Analysis and Trends
Financial Services financial-services
Multiple Chart
Morgan Stanley
View slide
Line charts showing sovereign, corporate, and local EMD spreads and yields over time, with tables for average spreads and returns.
Market Analysis and Trends
Financial Services
Discusses the emerging markets bond market, analyzing sovereign, corporate, and local bond yields and spreads.
Emerging Markets, Bond Spreads, Sovereign Bonds, Corporate Bonds, Yields
false
Market Analysis and Trends
Financial Services financial-services
Multiple Chart
Morgan Stanley
View slide
Comprises three line charts for 'Sovereign EMD Spreads', 'Corporate EMD Spreads', and 'Local EMD Yields'. Includes a color-coded legend and a table summarizing the current, 1-month ago, 12-month ago, and median values. The design is sophisticated with data-rich visualizations.
Market Analysis and Trends
Financial Services
The slide evaluates the emerging markets bond sector, comparing sovereign and corporate spreads, alongside local EMD yields. It is directed at financial professionals analyzing global market trends, offering insight into the performance of emerging markets, and is instrumental for investment strategy discussions.
Emerging Markets, Bond Spreads, Yields, Investment Strategy
false
Market Analysis and Trends
Financial Services financial-services
Multiple Chart
Morgan Stanley
View slide
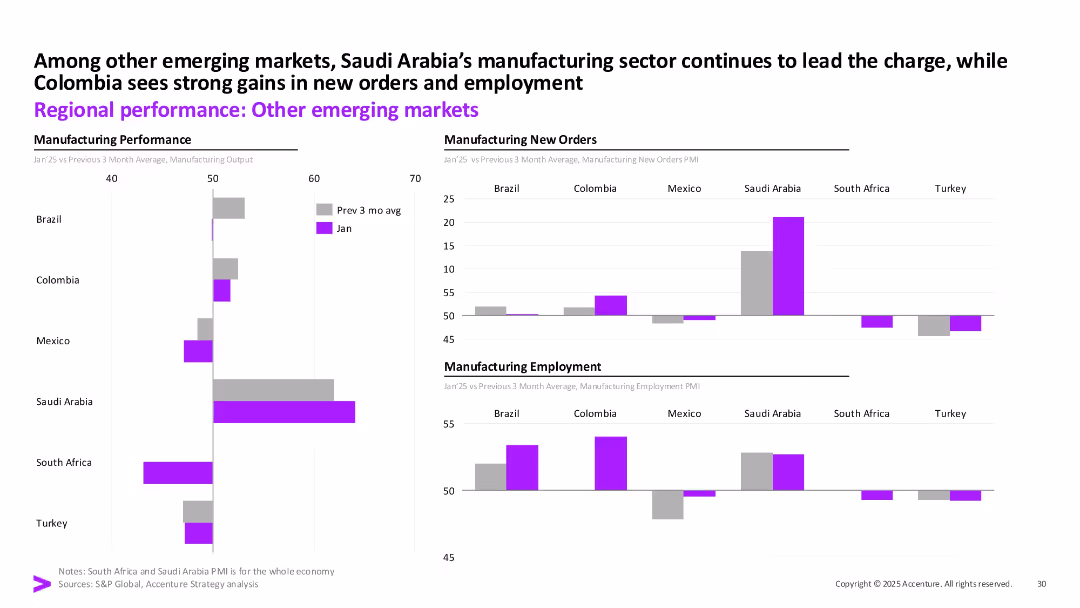
Three-column layout with bar charts showing output, new orders, and employment for emerging markets; data for Jan vs. 3-month avg.
Industry Overview
Industrial & Manufacturing
Saudi Arabia leads in manufacturing strength among emerging markets, with Colombia also showing strong gains. Other countries exhibit mixed or declining trends, particularly in new orders and employment.
Emerging Markets, Manufacturing, Saudi Arabia, Colombia, PMI, Output, Employment, Accenture
false
Industry Overview
Industrial & Manufacturing industrial-and-manufacturing
Multiple Chart
Accenture
View slide
Pie chart showing the percentage distribution of net sales in emerging markets with an additional focus on market positions for various products in Latin America and Asia.
Market Analysis and Trends
Consumer Goods
Details Essity's market positioning in emerging markets, highlighting sales figures and leading product categories, valuable for strategic planning and competitive analysis.
Emerging Markets, Market Positioning, Sales Figures, Strategic Planning
false
Market Analysis and Trends
Consumer Goods consumer-goods
Mixed Chart
Barclays
View slide
Features multiple pie charts and tables comparing emerging risks by overall, G-SIB, and non-G-SIB perspectives, alongside organizational change statistics.
Risk Assessment and Management
Financial Services
The slide provides a detailed analysis of the most critical emerging risks identified by CROs, including climate risk and technological disruptions, with comparative insights by bank type.
Emerging Risks, Climate Risk, Technological Disruption, Comparative
false
Risk Assessment and Management
Financial Services financial-services
Multiple Chart
EY
View slide
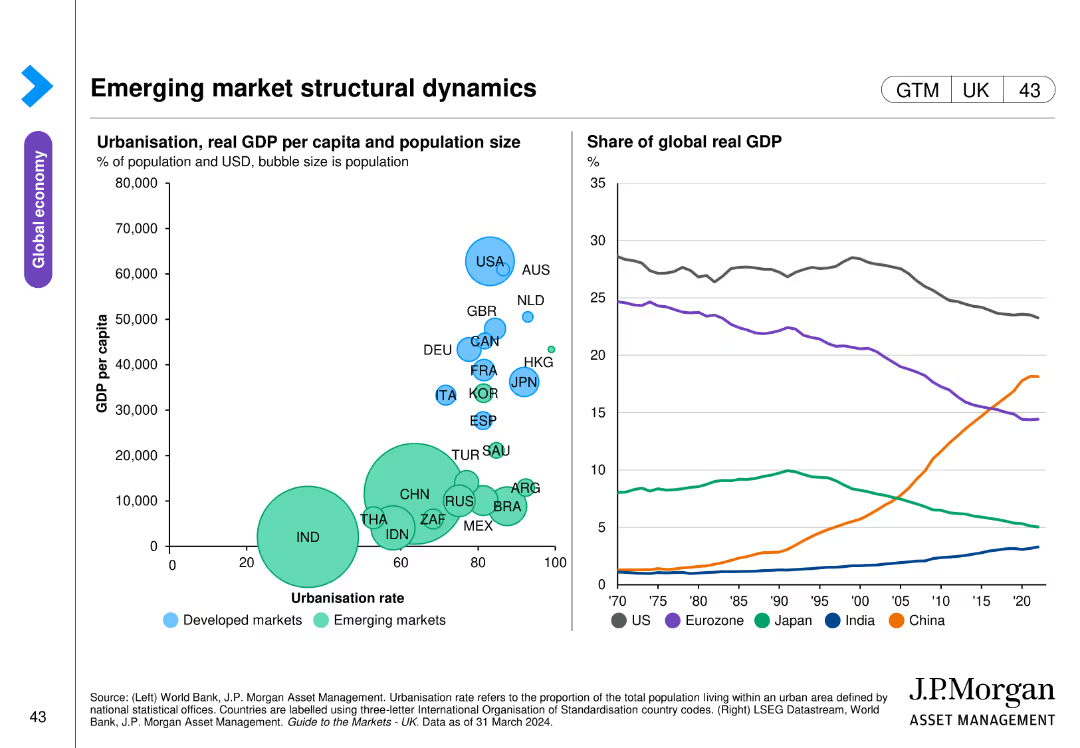
Two charts: a bubble chart comparing urbanization rate with GDP per capita across countries, and a line chart showing the share of global real GDP over time by region.
Market Analysis and Trends
Financial Services
This slide explores the structural dynamics of emerging markets, with a focus on urbanization, GDP per capita, and regional contributions to global GDP. Used for economic analysis and strategic planning in emerging markets.
Emerging markets, GDP, urbanization, global
false
Market Analysis and Trends
Financial Services financial-services
Multiple Chart
JP Morgan
View slide
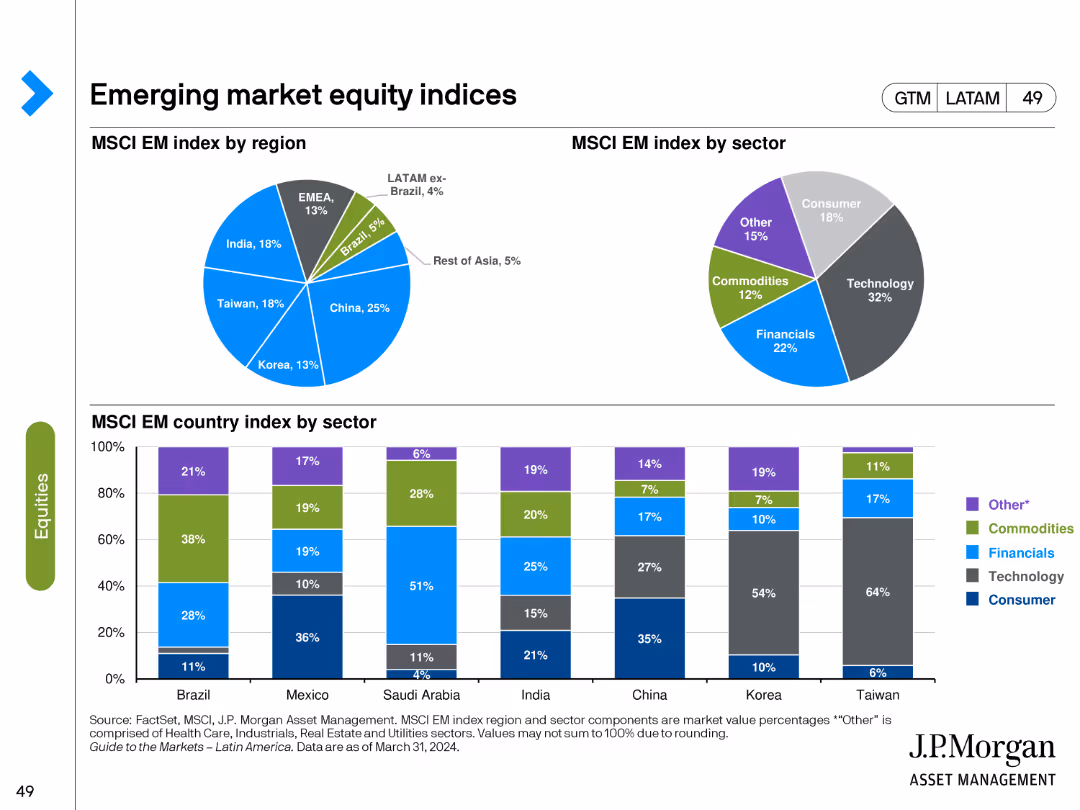
The slide features pie charts showing the MSCI Emerging Market index by region and sector, and bar charts for the index by country and sector. Various colors represent different regions, sectors, and countries.
Market Analysis and Trends
Financial Services
It breaks down the MSCI Emerging Market index, providing insights into the regional and sectoral composition of the index, which can inform investment strategies in emerging markets.
Emerging markets, MSCI index, regional composition, sectoral composition, investment
false
Market Analysis and Trends
Financial Services financial-services
Multiple Chart
JP Morgan
View slide
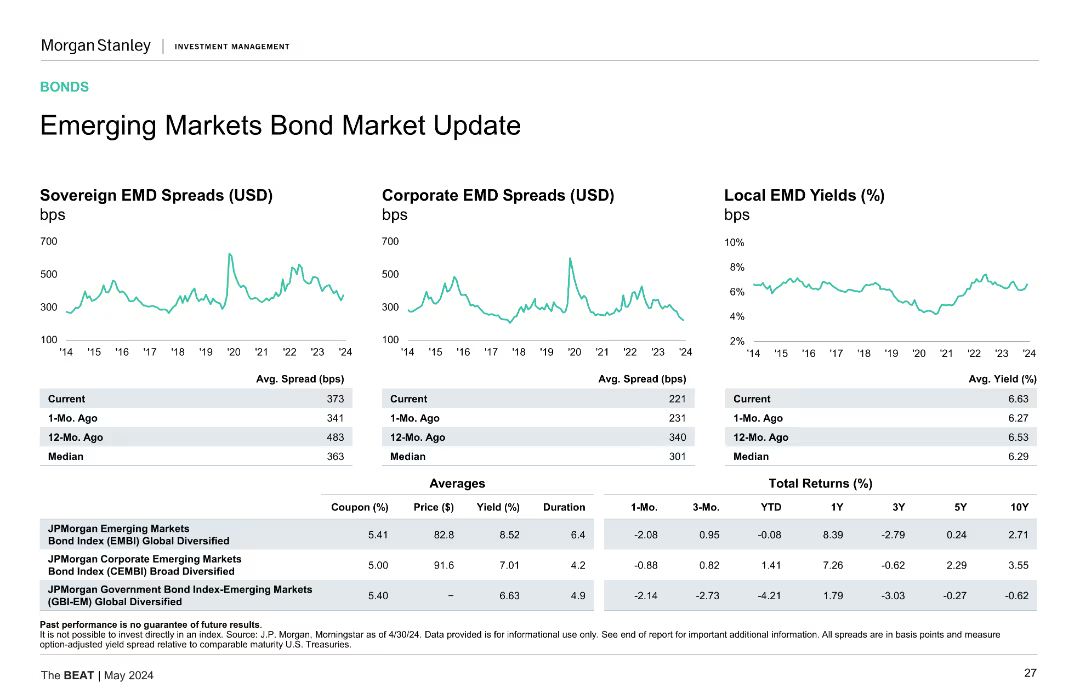
This slide features three line charts showing Sovereign EMD Spreads (USD), Corporate EMD Spreads (USD), and Local EMD Yields (%). The charts display data from 2014 to 2024, with tables providing current, 1-Mo. Ago, 12-Mo. Ago, and Median values. Additionally, there are tables showing coupon, price, yield, duration, and total returns.
Market Analysis and Trends
Financial Services
The slide provides an overview of the emerging markets bond market, highlighting sovereign and corporate EMD spreads, local EMD yields, and total returns.
Emerging markets, bond spreads, EMD, yields, returns, sovereign, corporate
false
Market Analysis and Trends
Financial Services financial-services
Multiple Chart
Morgan Stanley
View slide
Multiple line charts showing sovereign EMD spreads, corporate EMD spreads, and local EMD yields over time.
Market Analysis and Trends
Financial Services
Updates on emerging market bonds with data on sovereign and corporate EMD spreads, and local EMD yields, providing a comprehensive view of the emerging markets bond environment.
Emerging markets, bond spreads, yields
false
Market Analysis and Trends
Financial Services financial-services
Multiple Chart
Morgan Stanley
View slide
The slide includes multiple charts: line charts for EM earnings by region and price-to-book ratio, and a bar chart for the growth of the middle class. Different colors distinguish regions and forecast years.
Market Analysis and Trends
Financial Services
It analyzes earnings, valuation ratios, and the growth of the middle class in emerging markets, offering a comprehensive view of the economic potential and investment opportunities in these regions.
Emerging markets, earnings, price-to-book, middle class, valuation
false
Market Analysis and Trends
Financial Services financial-services
Multiple Chart
JP Morgan
View slide
The slide contains a mix of text and column charts. The left side has a textual overview while the right side includes two column charts with horizontal bars.
Risk Assessment and Management
Financial Services
The slide discusses the top emerging risks identified by CROs, including climate change and AI, and how these risks are viewed by risk organizations and boards.
Emerging risks, CRO, climate change, AI, risk management
false
Risk Assessment and Management
Financial Services financial-services
Multiple Chart
EY
View slide
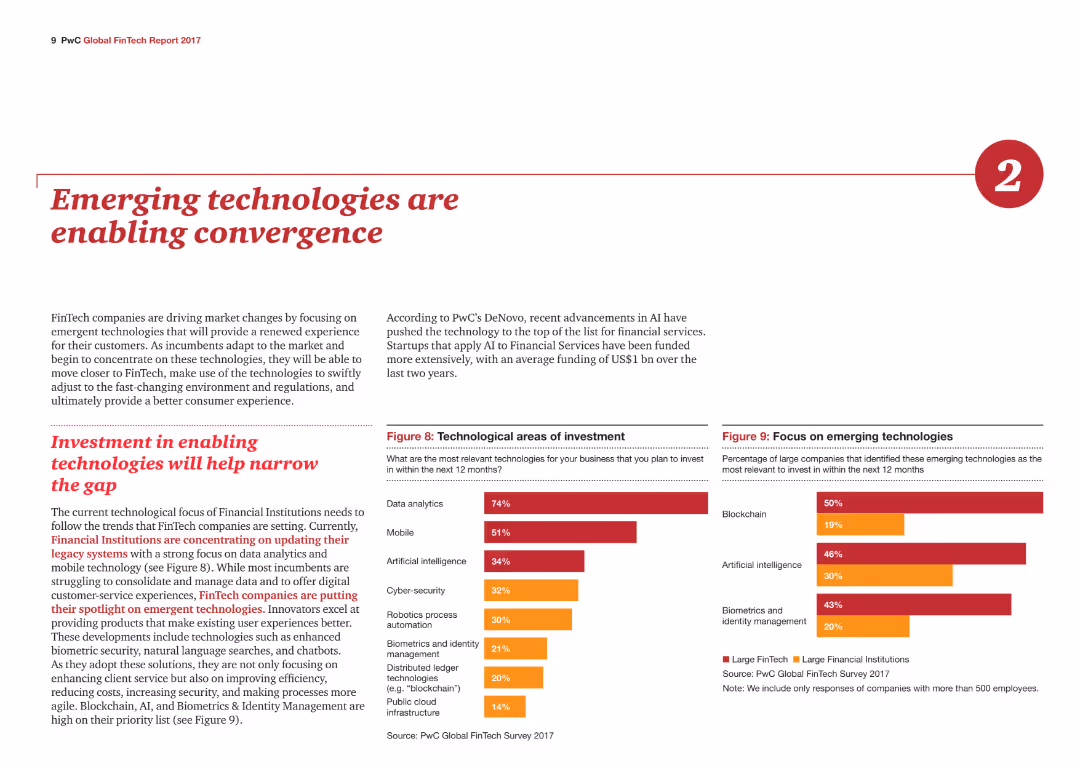
Two column charts show technological areas of investment and focus on emerging technologies, with different colors representing large FinTech and financial institutions.
Technology and Digital Transformation
Financial Services
The slide highlights how emerging technologies like AI and blockchain are driving changes in FinTech, with investment trends in data analytics, mobile, and artificial intelligence.
Emerging technologies, Investment, FinTech, AI, Blockchain
false
Technology and Digital Transformation
Financial Services financial-services
Multiple Chart
PwC/Strategy&
View slide
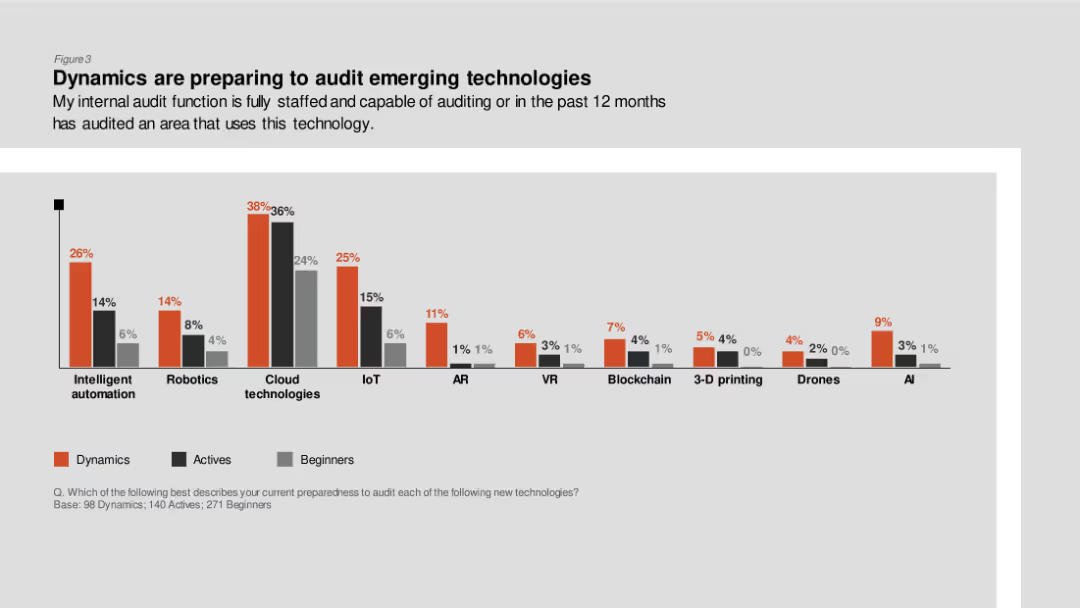
Column chart showing the preparedness of internal audit functions to audit various emerging technologies like robotics, cloud technologies, and AI, divided by Dynamics, Actives, and Beginners.
Technology and Digital Transformation
Professional Services
The slide presents data on how prepared internal audit functions are to audit emerging technologies, emphasizing higher preparedness in Dynamics for technologies like cloud and AI.
Emerging technologies, internal audit, preparedness, Dynamics, Actives
false
Technology and Digital Transformation
Professional Services professional-services
Single Chart
PwC/Strategy&
View slide
Contains a clear visual hierarchy with text and iconography to delineate key principles, opportunities, and actions. The slide follows a consistent color scheme with blue as the primary color.
Strategic Planning
Financial Services
This slide outlines principles and responses to emerging trends in payments, highlighting customer choice, data-led services, and sustainable innovation. It is crafted to guide strategic thinking and decision-making in response to market trends, particularly in the areas of payment flexibility and risk management.
Emerging trends, Payment innovation, Customer choice, Strategic response
false
Strategic Planning
Financial Services financial-services
Table
JP Morgan
View slide
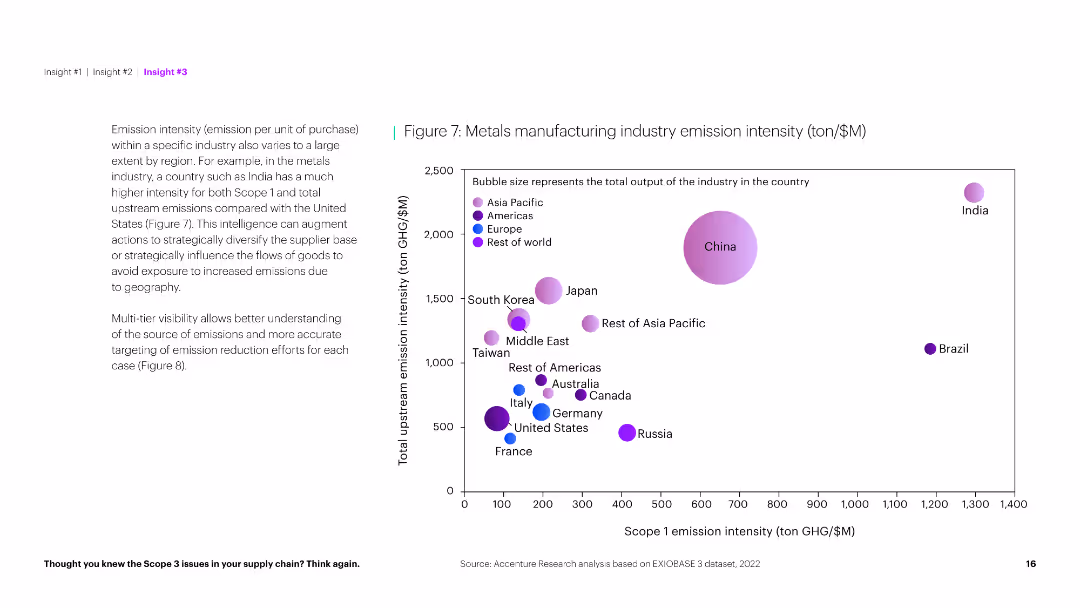
The slide uses a bubble chart to depict the emission intensity of metals manufacturing across various countries, with a clean and informative layout.
Market Analysis and Trends
Industrial & Manufacturing
This slide presents an analysis of emission intensity in the metals manufacturing industry, comparing scope 1 and upstream emissions across different countries.
Emission intensity, metals manufacturing, industry analysis, country comparison, environmental impact, sustainability, bubble chart, data visualization
false
Market Analysis and Trends
Industrial & Manufacturing industrial-and-manufacturing
Mixed Chart
Accenture
View slide
World map showing required emission reduction percentages by 2050 for major countries, with specific targets highlighted for each. The slide uses clear labeling and contrasting colors for different targets.
Regulatory and Compliance
Environmental Services & Sustainability
Outlines the necessary emission reductions by 2050 for major countries to align with climate goals, emphasizing the varied targets across different nations. Useful for discussing policy adjustments and international agreements aimed at combating climate change.
Emission reduction, 2050, Targets, Climate goals, Policy
false
Regulatory and Compliance
Environmental Services & Sustainability environmental-services-and-sustainability
Graphic
BCG
View slide
The slide compares the emission reduction targets and timelines for key automotive and construction industry companies, with data on their green steel demand shares.
Regulatory and Compliance
Environmental Services & Sustainability
This slide examines how emission reduction targets in the automotive and construction industries are driving demand for low-CO2 steel, with comparative data on target timelines and demand shares.
Emission reduction, low-CO2 steel, automotive, construction, targets, demand drivers, green steel, regulatory
false
Regulatory and Compliance
Environmental Services & Sustainability environmental-services-and-sustainability
Single Chart
BCG
View slide
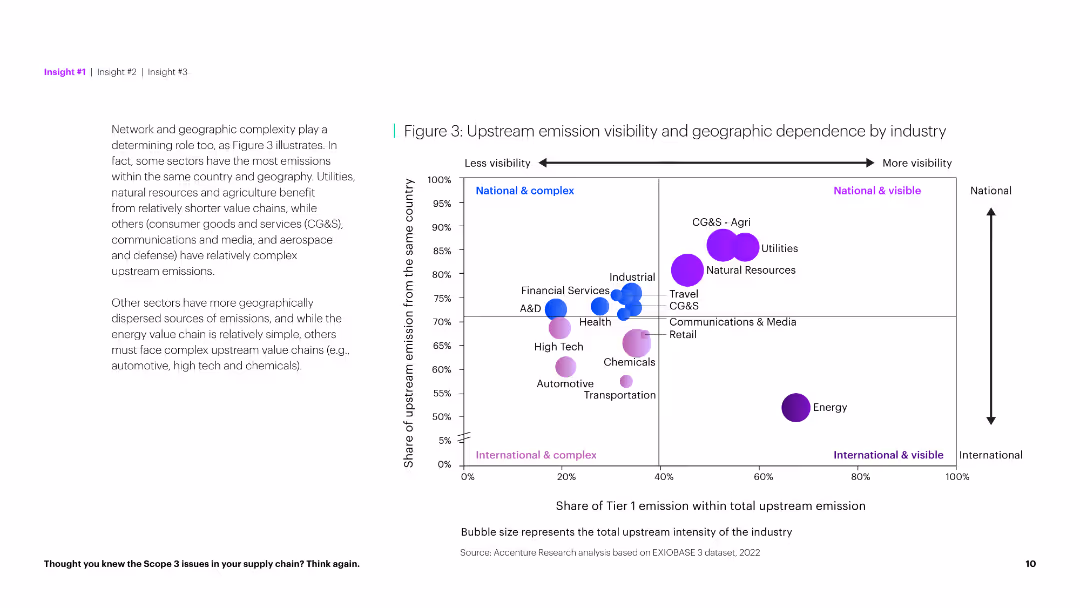
The slide uses a scatter plot to show the geographic dependency of upstream emissions and a textual analysis on the left. It has a clear and informative layout.
Market Analysis and Trends
Environmental Services & Sustainability
This slide explores the relationship between upstream emission visibility and geographic dependence across industries, identifying complex and simple sectors.
Emission visibility, geographic dependence, industry, complexity, analysis, environmental impact, sustainability, data visualization, scatter plot, insights
false
Market Analysis and Trends
Environmental Services & Sustainability environmental-services-and-sustainability
Mixed Chart
Accenture
Previous
Loading...
Hold On!
We are searching in our database
If nothing, comes up, please try different filters!
Column Chart
Heatmap
Chevron
Org Chart
Infographic
Callouts
Timeline
List
Graphic
Picture
Process Flow
Diagram
Paragraph
Map
Table
Framework
Subtitle
Takeaway Box
Icon
Other Chart
Radar Chart
Waterfall Chart
Mekko Chart
Pie Chart
Scatter Plot
Line Chart
Bar chart
Bullet points
Create a FREE account to continue browsing
Receive Instant Access to 1,000+ slides from companies like McKinsey, Google, and Goldman Sachs
First Name
Last Name
Email
Password
I agree to all
Terms & Privacy Policy
Thank you! Your submission has been received!
Oops! Something went wrong while submitting the form.
Have an account?
Sign in
Upgrade to PRO to Save slides
Advanced Search and Filters
Access to 15,000+ slides
Access to Category Pages
Save/Bookmark Slides
PowerPoint Template Library
Pick a Plan
MONTHLY
$12/month
Billed every month, Cancel anytime.
YEARLY
$9/year
Billed $108 annually, Cancel anytime.
Checkout for $12/month
Checkout for $108/yr
Secured by Stripe | AES-256 bit encryption