My Account
My Slides
Search by Category
Templates
View All Templates
Download Template Slides
Leave Feedback
Login
Logout
Get Started
Browse all Slides
Browse all Slides
Create a FREE Account
Instant access to 1,000+ real slides from top companies like McKinsey, BCG, Goldman Sachs, Google and many more!
First Name
Last Name
Email
Password
I agree to all
Terms & Privacy Policy
Thank you! Your submission has been received!
Oops! Something went wrong while submitting the form.
Have an account?
Sign in
Spark Your Next Big Idea with New Presentation Templates
VIEW ALL Templates
Welcome,
Welcome
PRO
Show Featured Only
Checkbox 8
Companies
Mckinsey
Bain
BCG
EY
Deloitte
Accenture
PwC/Strategy&
JP Morgan
Goldman Sachs
Morgan Stanley
Citigroup
Deutsche Bank
Barclays
LEK
KPMG
Kearney
Oliver Wyman
Booz Allen Hamilton
Gartner
IPSOS
Nielsen
Slide type
Text Only
Linear Flow
Vertical Flow
Single Chart
Header Horizontal
Mixed Chart
Header Vertical
Pillar
Multiple Chart
Graphic
Agenda
Title
Table
Framework
Industry
Technology & Software
Artificial Intelligence
Financial Services
Retail & E-commerce
Consumer Goods
Industrial & Manufacturing
Transportation & Logistics
Telecommunications
Real Estate & Construction
Hospitality & Tourism
Professional Services
Education & Training
Media & Entertainment
Agriculture & Food Production
Healthcare & Pharmaceuticals
Environmental Services & Sustainability
Government & Public Sector
Use Case
Mergers and Acquisitions
Performance Metrics and KPIs
Client Case Studies
Competitive Landscape
Corporate Finance and Valuation
Product and Service Analysis
Customer and Market Segmentation
Organizational Structure and Change
Industry Overview
Regulatory and Compliance
Risk Assessment and Management
Investment Analysis
Organizational Structure and Change
Human Resources and Talent Management
Financial Performance
Market Analysis and Trends
Sales and Business Development
Human Resources and Talent Management
Clear all
Thank you! Your submission has been received!
Oops! Something went wrong while submitting the form.
Tag
View slide
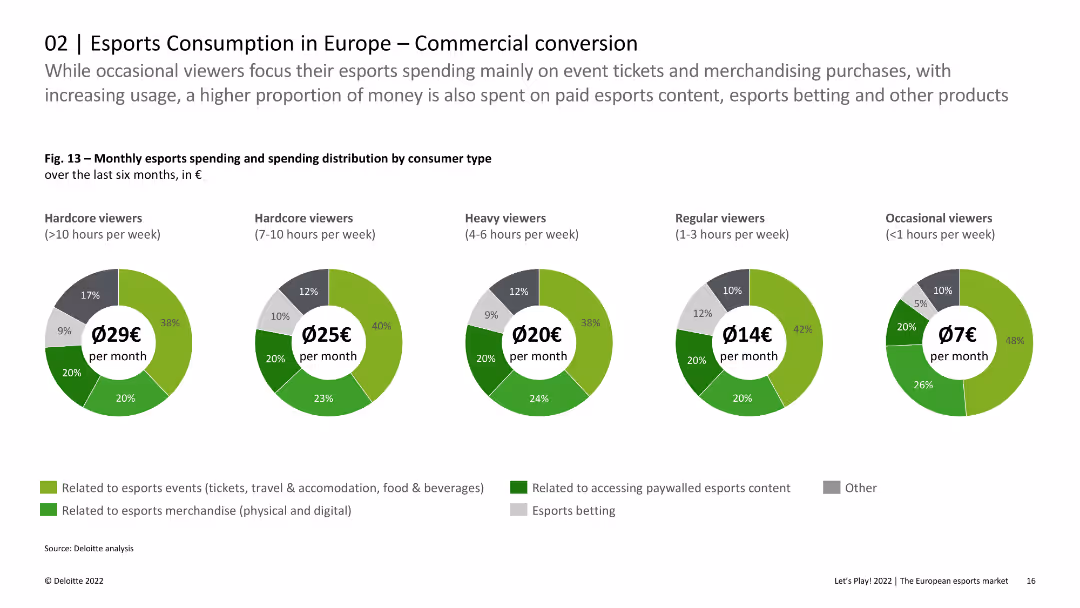
The slide includes pie charts showing monthly esports spending and spending distribution by consumer type. The visual presentation is balanced and data-rich.
Market Analysis and Trends
Media & Entertainment
This slide analyzes the spending habits of different types of esports viewers in Europe, highlighting that hardcore viewers spend more on various esports-related expenses compared to occasional viewers. It provides insights into the commercial potential of esports.
Esports, Spending, Consumer Types, Europe, Commercial
false
Market Analysis and Trends
Media & Entertainment media-and-entertainment
Multiple Chart
Deloitte
View slide
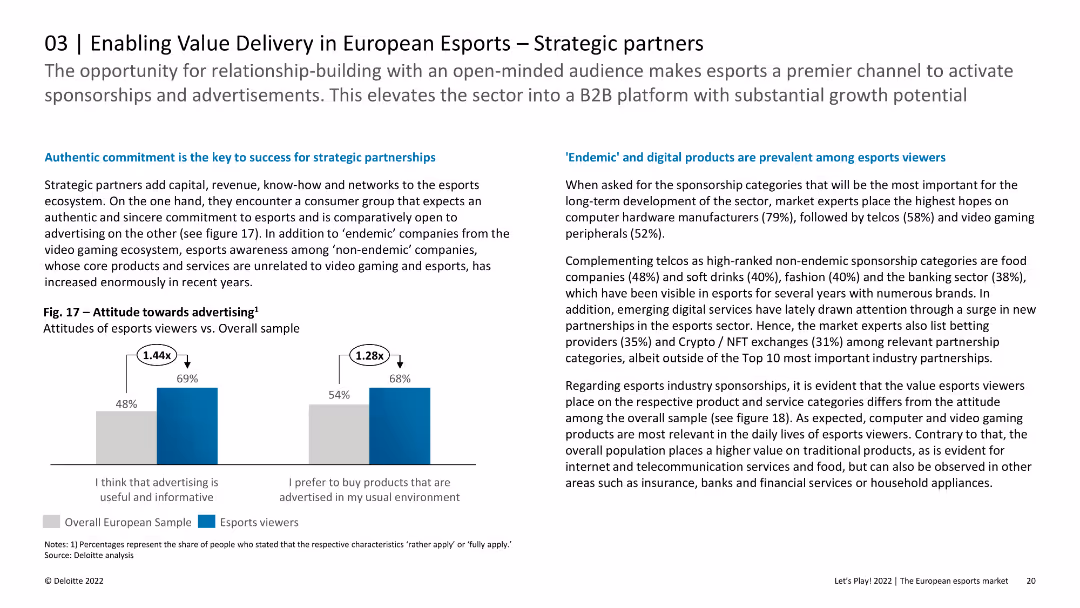
The slide includes column charts showing attitudes towards advertising among esports viewers compared to the overall sample. The layout is clean and focused on data presentation.
Strategic Planning
Media & Entertainment
This slide discusses the importance of strategic partnerships in the esports ecosystem, highlighting the positive attitudes of esports viewers towards advertising. It provides insights into the preferred sponsorship categories and the relevance of different products and services.
Esports, Strategic Partnerships, Advertising, Europe
false
Strategic Planning
Media & Entertainment media-and-entertainment
Mixed Chart
Deloitte
View slide
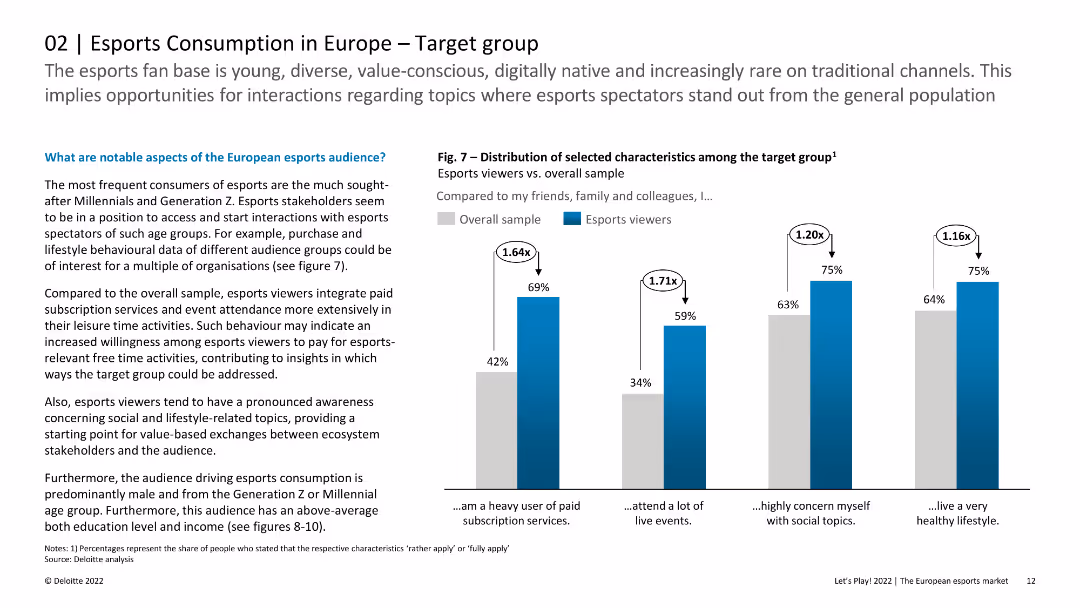
The slide features multiple charts comparing the characteristics of esports viewers to the overall sample, including paid subscription services usage and attendance at live events.
Customer and Market Segmentation
Media & Entertainment
This slide examines the demographics and behavioral characteristics of esports viewers in Europe, contrasting them with the general population. It highlights that esports fans are predominantly young, value-conscious, and digitally native.
Esports, Target Group, Demographics, Europe, Viewers
false
Customer and Market Segmentation
Media & Entertainment media-and-entertainment
Mixed Chart
Deloitte
View slide
Features a dark background and multiple horizontal bars in a gradient of warm colors representing various industries. The arrangement allows for an immediate visual comparison of data.
Product and Service Analysis
Consumer Goods
Illustrates industry-specific projections for ethically driven consumer purchases by 2026. This slide is pertinent for analyzing product and service impact in the context of ethical consumerism within different sectors.
Ethical Consumerism, Industry Analysis, 2026 Forecast, Product Impact, Service Analysis
false
Product and Service Analysis
Consumer Goods consumer-goods
Single Chart
Kearney
View slide
This slide features a dark background with a blue and yellow pie chart on the right and a vertical bar graph on the left. Both visual elements are clear and distinct, with text annotations providing context to the data presented.
Customer and Market Segmentation
Retail & E-commerce
The slide presents data on consumer purchasing driven by ethical concerns, projected for 2026, which is crucial for discussions on ethical practices and consumer trends within various industries.
Ethical Purchasing, Consumer Trends, 2026 Forecast, Industry Analysis, Ethical Practices
false
Customer and Market Segmentation
Retail & E-commerce retail-and-e-commerce
Multiple Chart
Kearney
View slide
Slide includes multiple column charts comparing German and Global responses regarding the ethical implications and organizational investments related to Industry 4.0 technologies. It shows leaders' perspectives on ethical concerns, policy exploration, and investment strategies in technologies to protect businesses.
Regulatory and Compliance
Technology & Software
Discusses ethical considerations and investment strategies by German and Global executives in response to Industry 4.0 technologies. It explores the level of concern and proactive measures taken to mitigate unethical use and disruptions.
Ethics, Industry 4.0, Technology, Investment, Germany, Global, Business Protection, Leadership
false
Regulatory and Compliance
Technology & Software technology-and-software
Multiple Chart
Deloitte
View slide
Slide with a dual layout, left side with a photo of foliage, right side with text and two pie charts in red and grey tones illustrating statistical data.
Corporate Finance and Valuation
Government & Public Sector
This slide discusses the shift in corporate goals towards ethical values and social responsibility, highlighting the expectations and perceptions of companies and their employees.
Ethics, Responsibility, Environment, Social, Corporate
false
Corporate Finance and Valuation
Government & Public Sector government-and-public-sector
Mixed Chart
PwC/Strategy&
View slide
A dark-themed slide with two sets of horizontal bar graphs, accompanied by callouts with key percentages and notable quotes. The layout is well-structured to compare categories and provides insights through selected respondent quotes.
Customer and Market Segmentation
Retail & E-commerce
Focuses on how companies plan to incorporate ethical concerns into their operations, with emphasis on transparent communication, making it relevant for discussions on corporate responsibility and communication strategies.
Ethics, Transparency, Corporate Communication, Operational Strategy, Corporate Responsibility
false
Customer and Market Segmentation
Retail & E-commerce retail-and-e-commerce
Mixed Chart
Kearney
View slide
The slide contains column charts showing ethnic diversity percentages among employees, with a focus on investment professionals, junior-level professionals, and partners. Textual insights and footnotes are included.
Human Resources and Talent Management
Professional Services
This slide presents data on ethnic diversity in the venture capital industry, analyzing differences in representation among various ethnic groups across professional levels and comparing data from 2018, 2020, and 2022.
Ethnic diversity, Investment professionals, Diversity trends, VC industry, Racial representation
false
Human Resources and Talent Management
Professional Services professional-services
Mixed Chart
Deloitte
View slide
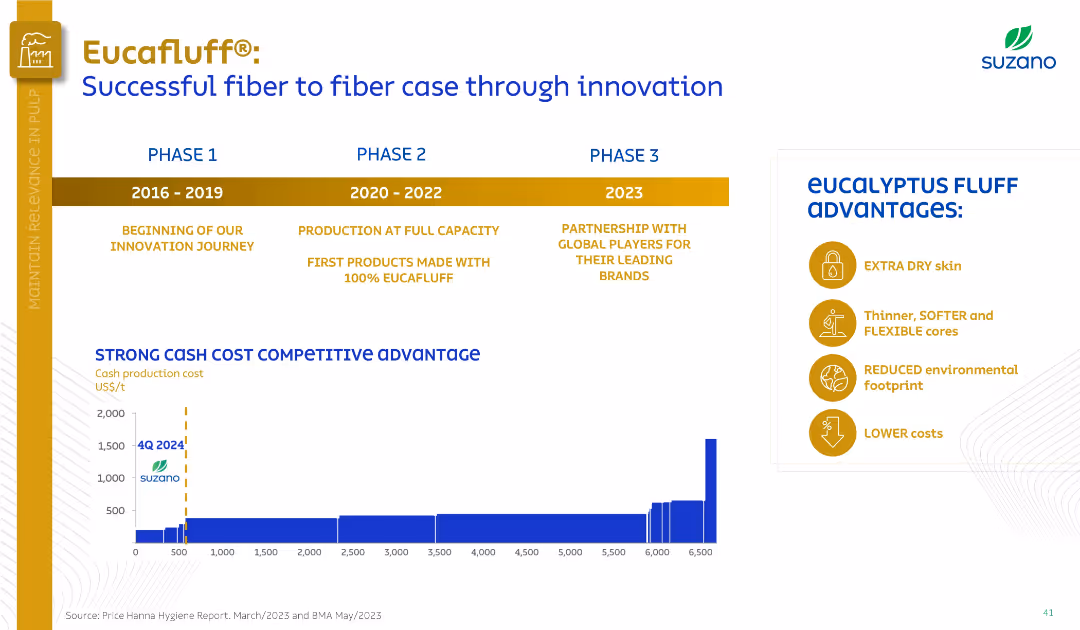
Timeline with three phases (2016–2023), bar chart of production costs, and a list of product advantages.
Product and Service Analysis
Consumer Goods
Showcasing Eucafluff® development, the slide highlights its innovation journey across three phases, production scalability, and cost competitiveness. Key advantages like softness, lower cost, and eco-friendliness are visually presented.
Eucafluff, product innovation, cost advantage, eucalyptus, hygiene
false
Product and Service Analysis
Consumer Goods consumer-goods
Mixed Chart
Goldman Sachs
View slide
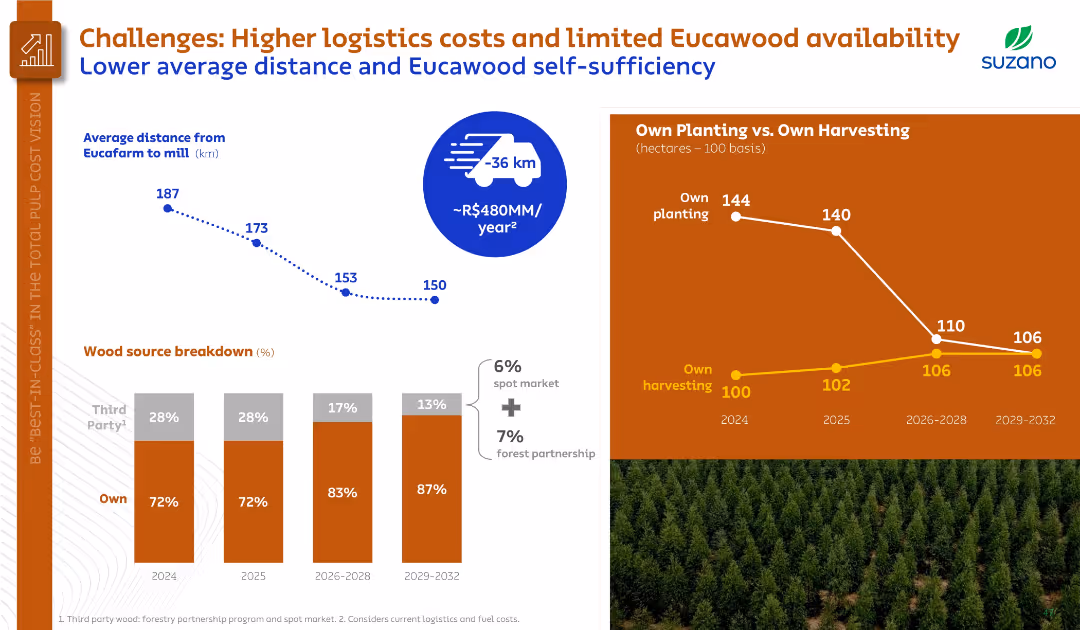
Mixed visuals including line chart, bar chart, and line comparison; two-tone theme differentiates wood source and logistics data.
Risk Assessment and Management
Agriculture & Food Production
Focused on logistics and Eucawood availability, this slide shows decreasing average distances from forest to mill and increasing self-sufficiency in wood sourcing. It details the cost-saving potential of these operational shifts.
Eucawood, logistics, cost reduction, self-sufficiency, forest operations
false
Risk Assessment and Management
Agriculture & Food Production agriculture-and-food-production
Multiple Chart
Goldman Sachs
View slide
Line chart displaying Euro area wage growth from 1999 to 2019, with separate lines for Germany and Euro area excl. Germany. Colors are orange and blue with a source citation at the bottom left corner.
Market Analysis and Trends
Financial Services
This slide presents comparative wage growth data for Germany and the rest of the Euro area, indicating economic trends and providing insights for market analysis and financial forecasting.
Euro area, wage growth, Germany, economic data, line chart, comparison, financial trends, market analysis, ECB, J.P. Morgan.
false
Market Analysis and Trends
Financial Services financial-services
Single Chart
JP Morgan
View slide
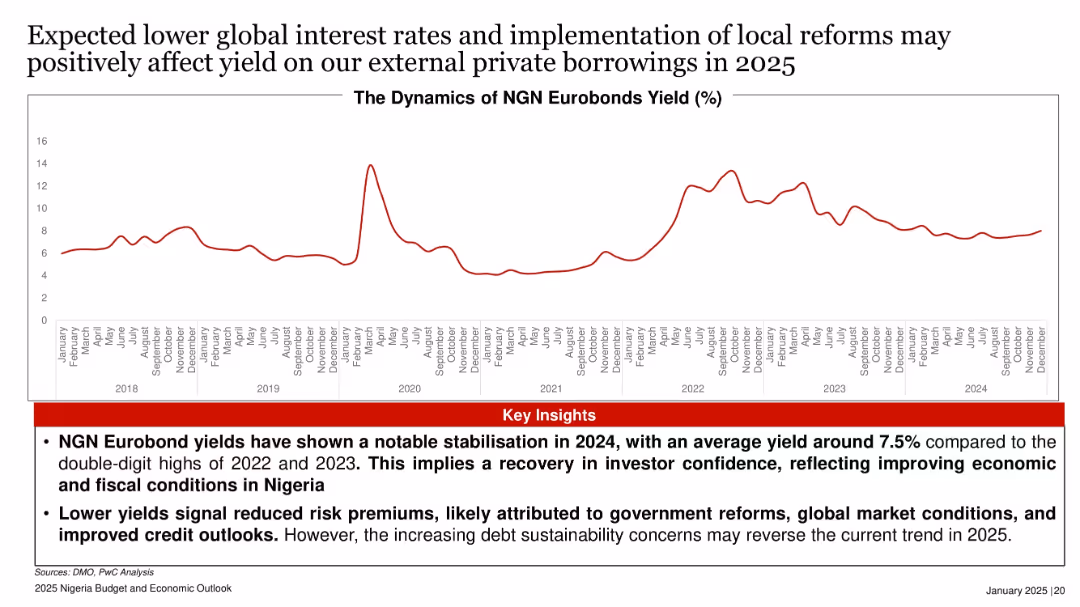
Line graph of Eurobond yields (2018–2024), illustrating volatility and recent stabilization.
Investment Analysis
Government & Public Sector
The slide reports stabilized Eurobond yields at around 7.5% in 2024, signaling improving investor confidence amid government reforms and favorable interest rates. However, rising debt risks may threaten this positive trend in 2025.
Eurobond, yield, interest rates, investor confidence, Nigeria, fiscal reforms
false
Investment Analysis
Government & Public Sector government-and-public-sector
Mixed Chart
PwC/Strategy&
View slide
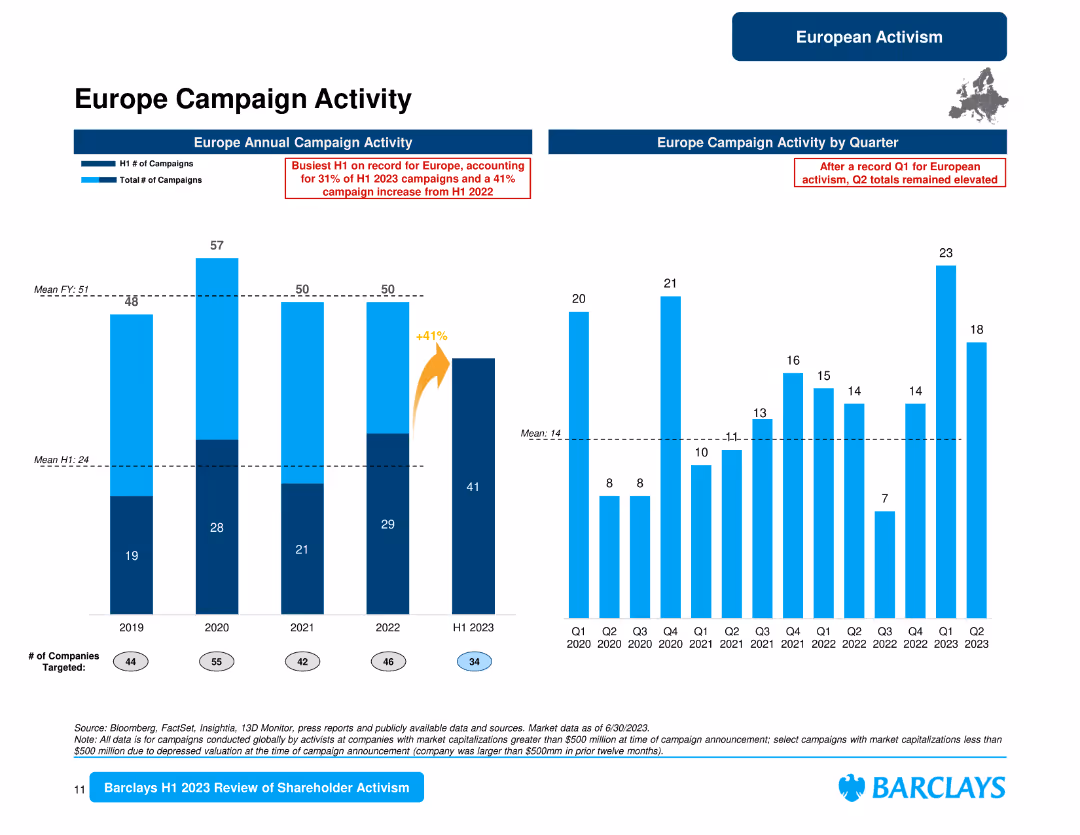
The slide displays column charts for Europe campaign activity by year and quarter, and a bar chart for campaign activity by country with percentages and counts.
Market Analysis and Trends
Financial Services
This slide reviews the European campaign activity, showing yearly and quarterly trends, and details the distribution of campaigns by country, highlighting the U.K., Germany, and the Netherlands.
Europe campaigns, annual activity, quarterly trends, country distribution, U.K., Germany, Netherlands, shareholder activism
false
Market Analysis and Trends
Financial Services financial-services
Multiple Chart
Barclays
View slide
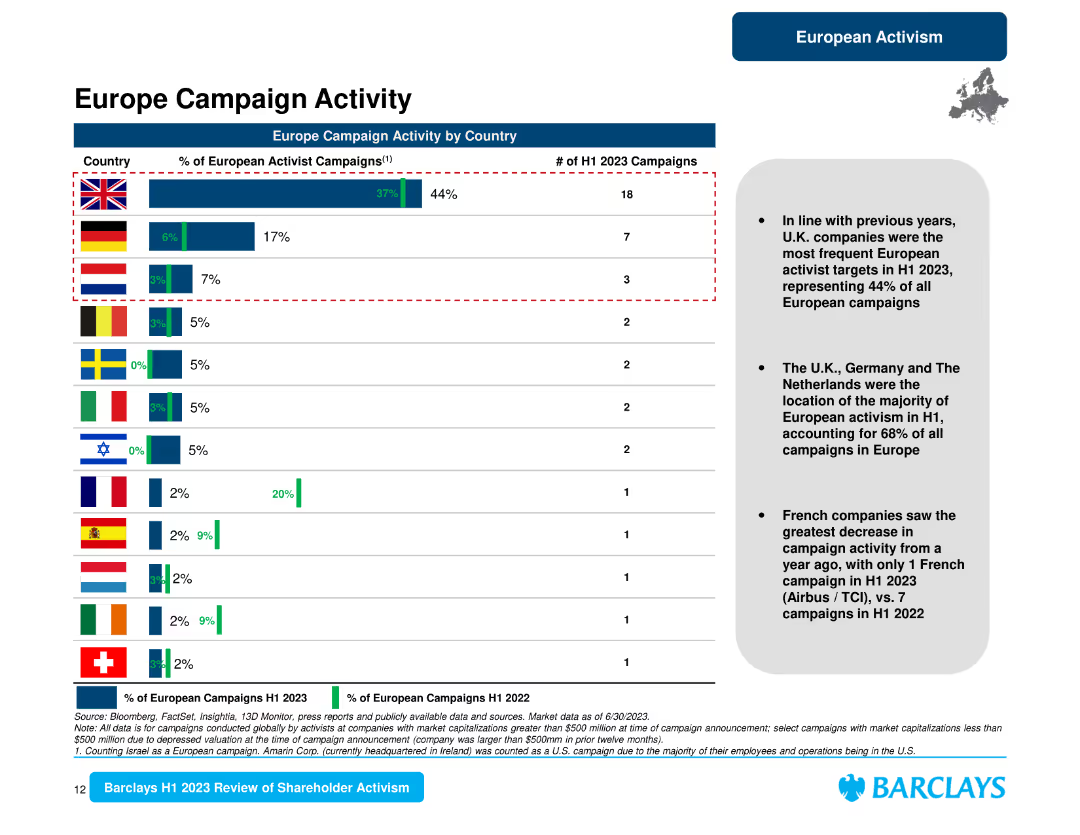
The slide presents a horizontal bar chart comparing the percentage of European activist campaigns by country and a summary text on the right.
Market Analysis and Trends
Financial Services
It provides a detailed look at European campaign activity by country, indicating that the U.K. led with 44% of campaigns, followed by Germany and the Netherlands.
Europe campaigns, country analysis, U.K., Germany, Netherlands, activism, shareholder trends
false
Market Analysis and Trends
Financial Services financial-services
Mixed Chart
Barclays
View slide
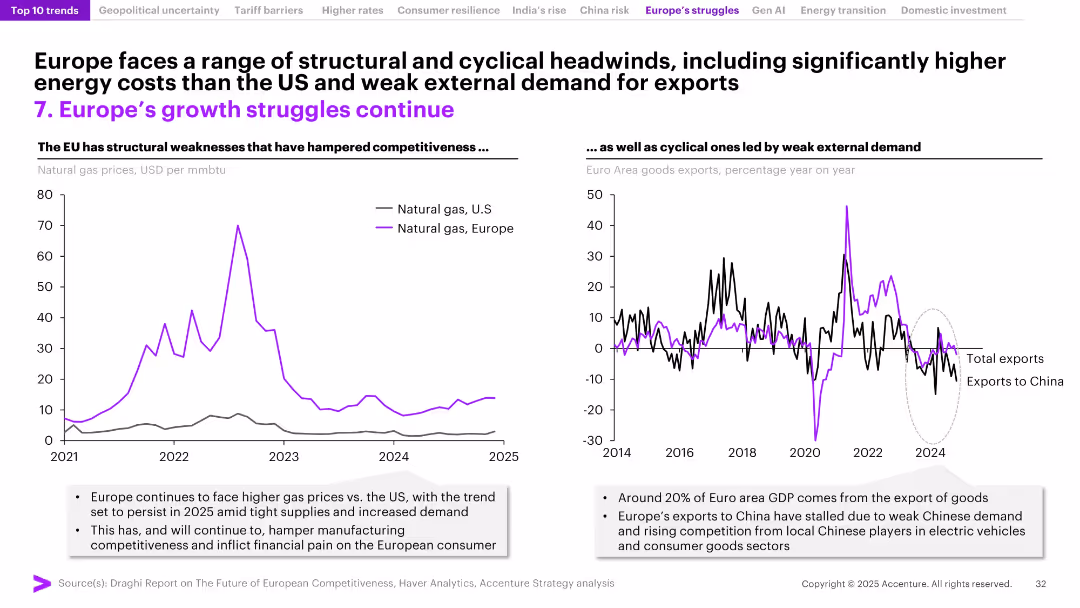
Two-panel layout: natural gas price comparison (US vs. Europe) and export trends chart (total vs. China); visual focus on cyclical and structural issues.
Market Analysis and Trends
Energy & Utilities
The slide outlines Europe's competitiveness challenges stemming from high energy costs and declining exports, particularly to China. It explains how structural inefficiencies, including energy price disparities with the US, undermine Europe’s manufacturing base and export performance.
Europe economy, energy prices, exports, competitiveness, manufacturing, natural gas, trade deficit, structural weakness, China, Eurozone
false
Market Analysis and Trends
Energy & Utilities energy-and-utilities
Multiple Chart
Accenture
View slide
Column charts for industry performance, country performance, and new orders index
Market Analysis and Trends
Financial Services
This slide examines the industry performance in Europe, detailing country-specific trends and the new orders index.
Europe outlook, industry performance, country trends, new orders
false
Market Analysis and Trends
Financial Services financial-services
Multiple Chart
Accenture
View slide
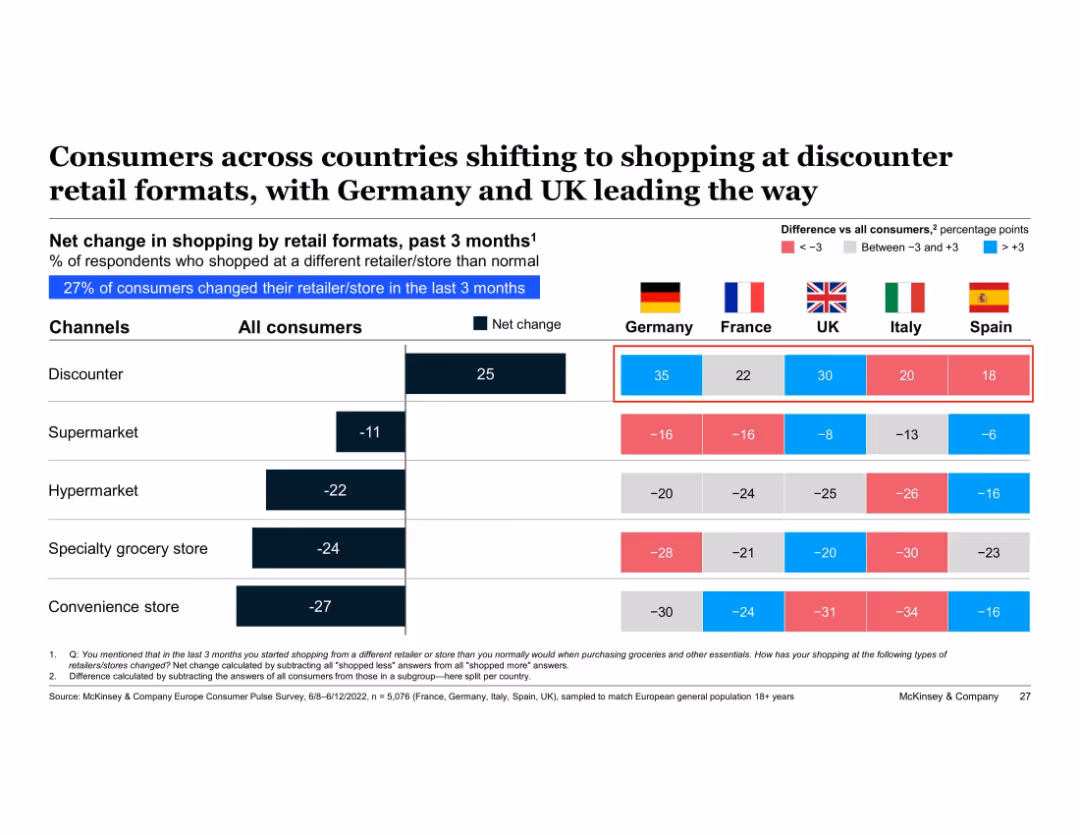
Table showing net change in retail channel preferences by country with color-coded differences vs. average; country flags and key metrics shown
Market Analysis and Trends
Retail & E-commerce
Cross-country comparison of net shopping changes by retail format highlights a Europe-wide shift toward discounter channels. Germany and the UK show the strongest movement, while traditional retail like supermarkets and specialty stores have negative net change. The data reflects a continent-wide price-conscious shopping trend.
Europe retail trends, discounters, Germany, UK, shopping behavior, cross-country comparison, inflation, consumer shift
false
Market Analysis and Trends
Retail & E-commerce retail-and-e-commerce
Multiple Chart
McKinsey
View slide
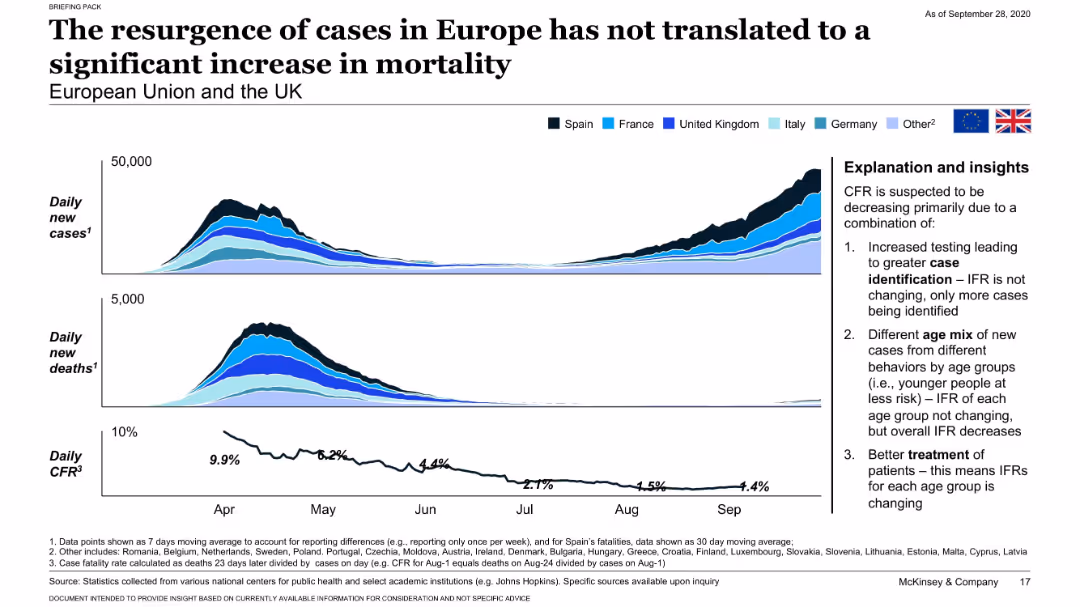
Dual area and line charts showing new cases, deaths, and CFR across European countries with explanation sidebar.
Risk Assessment and Management
Healthcare & Pharmaceuticals
Highlights the European resurgence in COVID-19 cases with no equivalent rise in mortality. Attributes the decoupling of cases and deaths to improved detection, younger age distribution, and better treatment.
Europe, COVID-19 resurgence, CFR, case detection, mortality
false
Risk Assessment and Management
Healthcare & Pharmaceuticals healthcare-and-pharmaceuticals
Mixed Chart
McKinsey
View slide
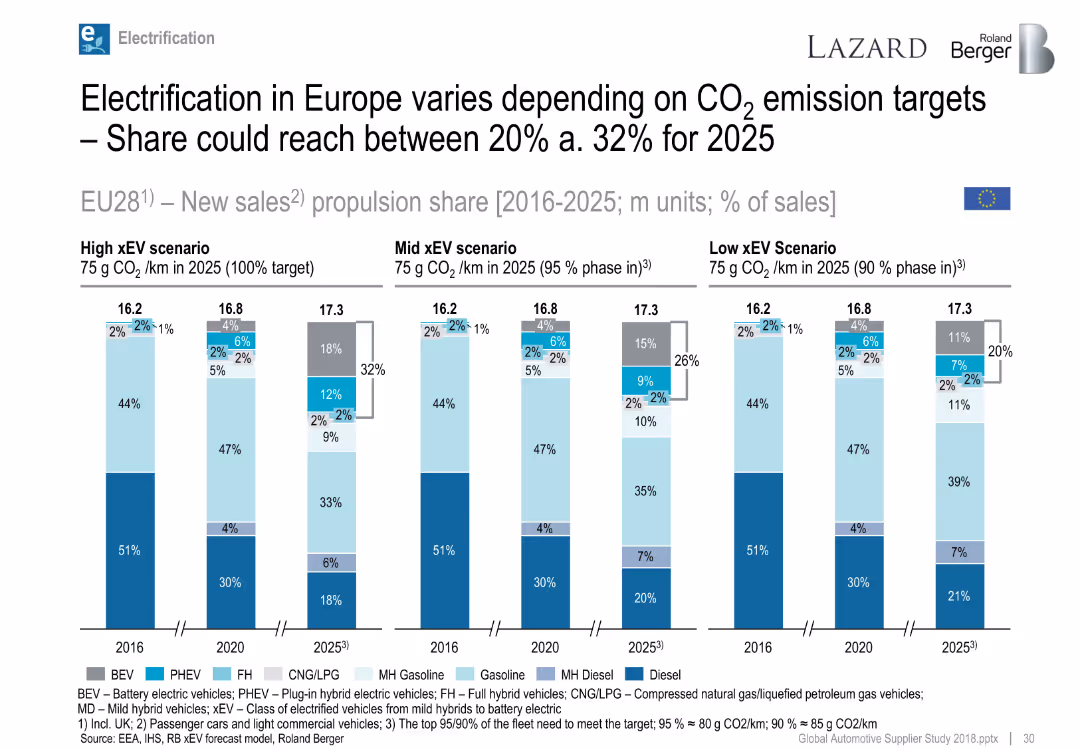
Multiple bar charts showing EU propulsion scenarios from 2016 to 2025.
Regulatory and Compliance
Industrial & Manufacturing
Projects EU xEV market penetration depending on compliance with CO₂ targets; high adoption scenario sees ~32% xEV share by 2025.
Europe, CO₂ targets, BEV, PHEV, emissions, 2025 forecast, propulsion mix
false
Regulatory and Compliance
Industrial & Manufacturing industrial-and-manufacturing
Single Chart
Roland Berger
View slide
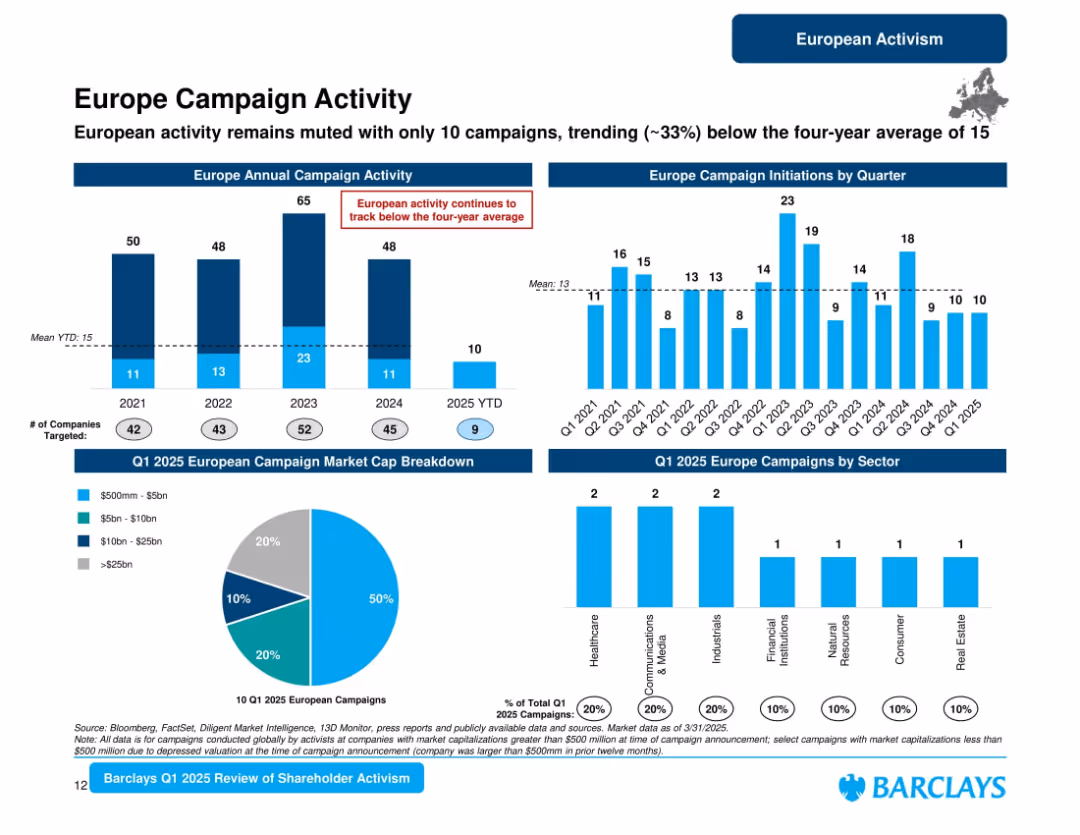
Multi-panel slide with bar charts, pie chart, and a small map. Predominantly blue color scheme. Structured in horizontal sections with clear headers.
Market Analysis and Trends
Financial Services
This slide tracks shareholder activism campaigns in Europe from 2021 to Q1 2025, noting a muted start to 2025 with activity down ~33% from the four-year average. It also breaks down market cap and sector data for Q1 2025.
Europe, Campaigns, Market Cap, Activism, Trends, Sectors, Shareholder, Quarterly, 2025, Barclays
false
Market Analysis and Trends
Financial Services financial-services
Multiple Chart
Barclays
View slide
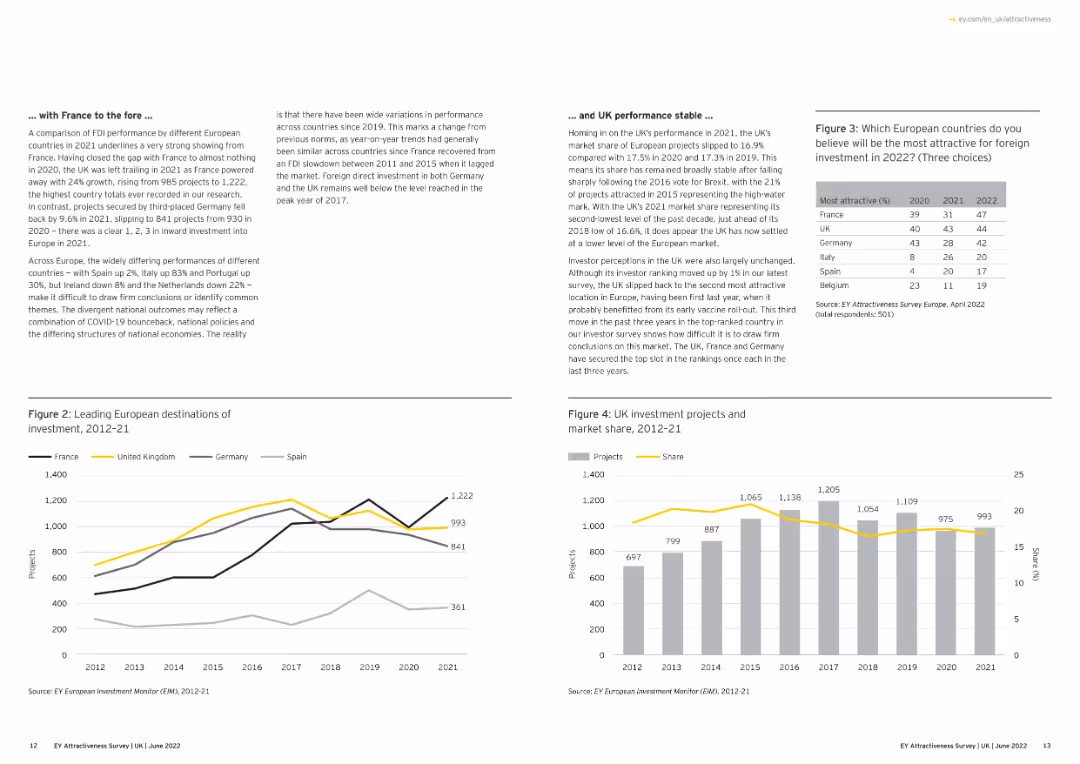
A combination of text and line graphs showing the performance of different European countries.
Market Analysis and Trends
Financial Services
The slide compares FDI performance among European countries, focusing on France's strong showing in 2021 and the UK's steady performance. It includes graphs depicting investment project numbers and market share over time.
Europe, FDI, France, UK, Market Share
false
Market Analysis and Trends
Financial Services financial-services
Multiple Chart
EY
View slide
A slide with two main sections, each containing bullet points, highlighted statistics, and icons representing different countries.
Market Analysis and Trends
Financial Services
The slide summarizes the macroeconomic impact on Europe’s FDI in 2022 and discusses investment trends in various European countries.
Europe, FDI, investment, macroeconomic, trends
false
Market Analysis and Trends
Financial Services financial-services
Multiple Chart
EY
View slide
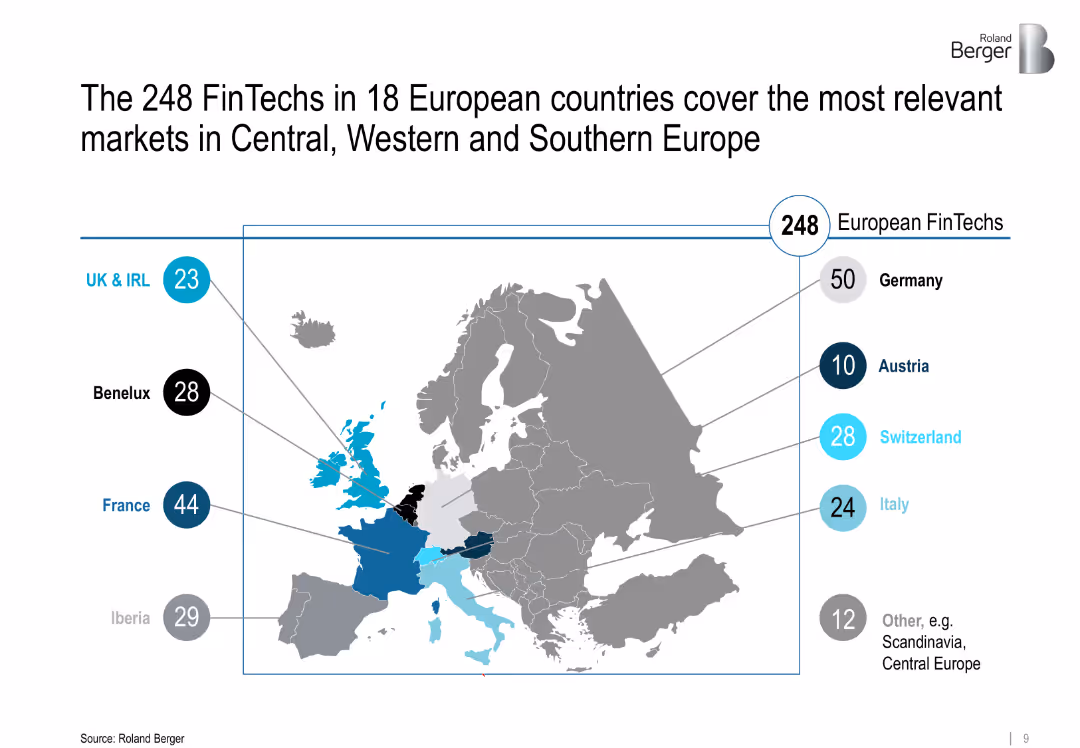
Map of Europe highlighting FinTech distribution by region with bubbles and numeric labels
Market Analysis and Trends
Financial Services
Geographic distribution of 248 FinTechs across 18 European countries, emphasizing Central, Western, and Southern Europe with visual emphasis on countries like Germany, France, and Iberia.
Europe, FinTech hubs, regional analysis, Central Europe, startup ecosystems
false
Market Analysis and Trends
Financial Services financial-services
Single Chart
Roland Berger
View slide
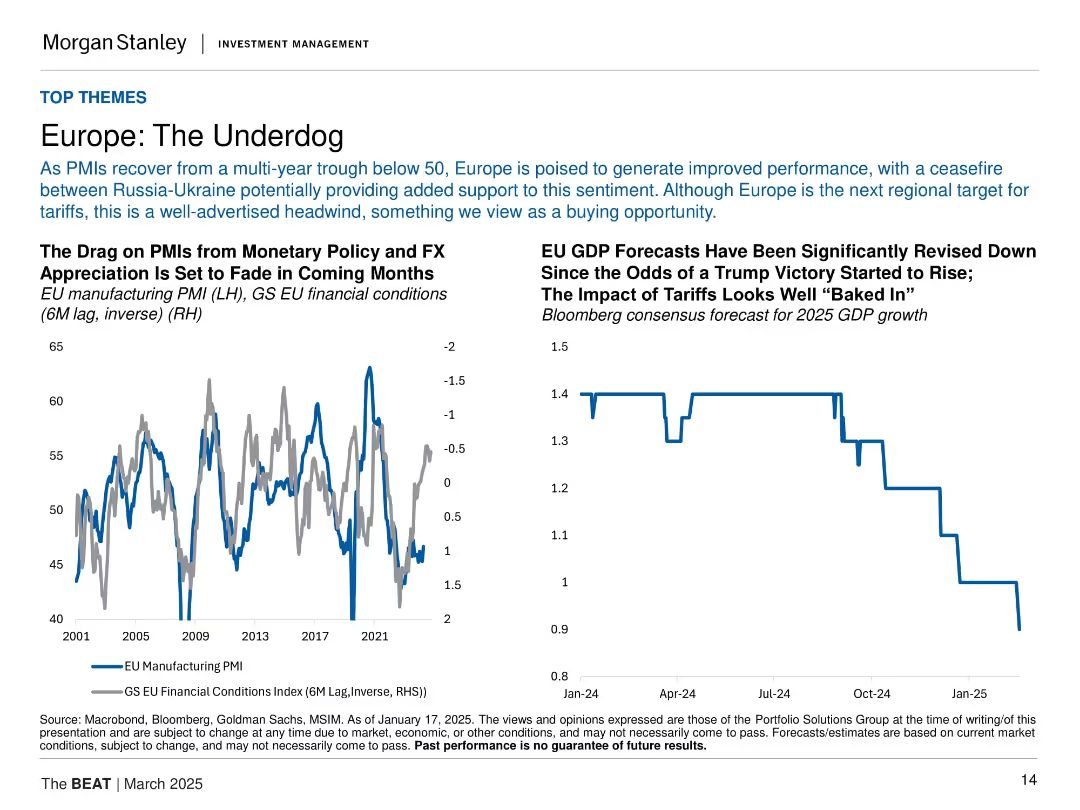
Left chart shows EU PMI vs financial conditions (inverted); right shows GDP forecast trend. Uses line and step charts in a split layout.
Strategic Planning
Financial Services
Europe is positioned as an undervalued opportunity, with easing financial conditions expected to support PMIs. Despite tariff risks and GDP downgrades, the region could improve performance due to recovering conditions and a Russia-Ukraine ceasefire outlook.
Europe, GDP forecast, PMI, financial conditions, tariffs, valuation, macro recovery
false
Strategic Planning
Financial Services financial-services
Multiple Chart
Morgan Stanley
View slide
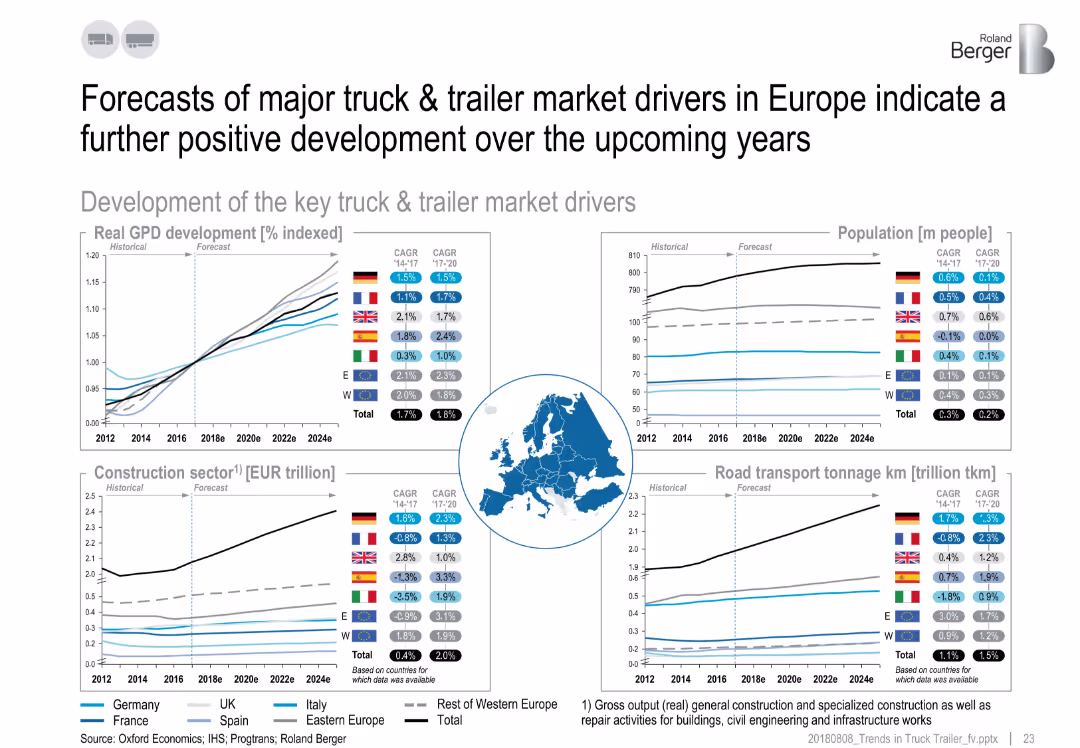
Four charts with trend lines and CAGR values, centered map of Europe, icons for each chart topic.
Market Analysis and Trends
Transportation & Logistics
The slide projects a positive outlook for European truck & trailer markets. It presents growth forecasts in GDP, population, construction sector, and road transport tonnage, highlighting economic and infrastructure drivers with country-level CAGR data.
Europe, GDP, truck drivers, forecasts, construction, transport, population
false
Market Analysis and Trends
Transportation & Logistics transportation-and-logistics
Multiple Chart
Roland Berger
View slide
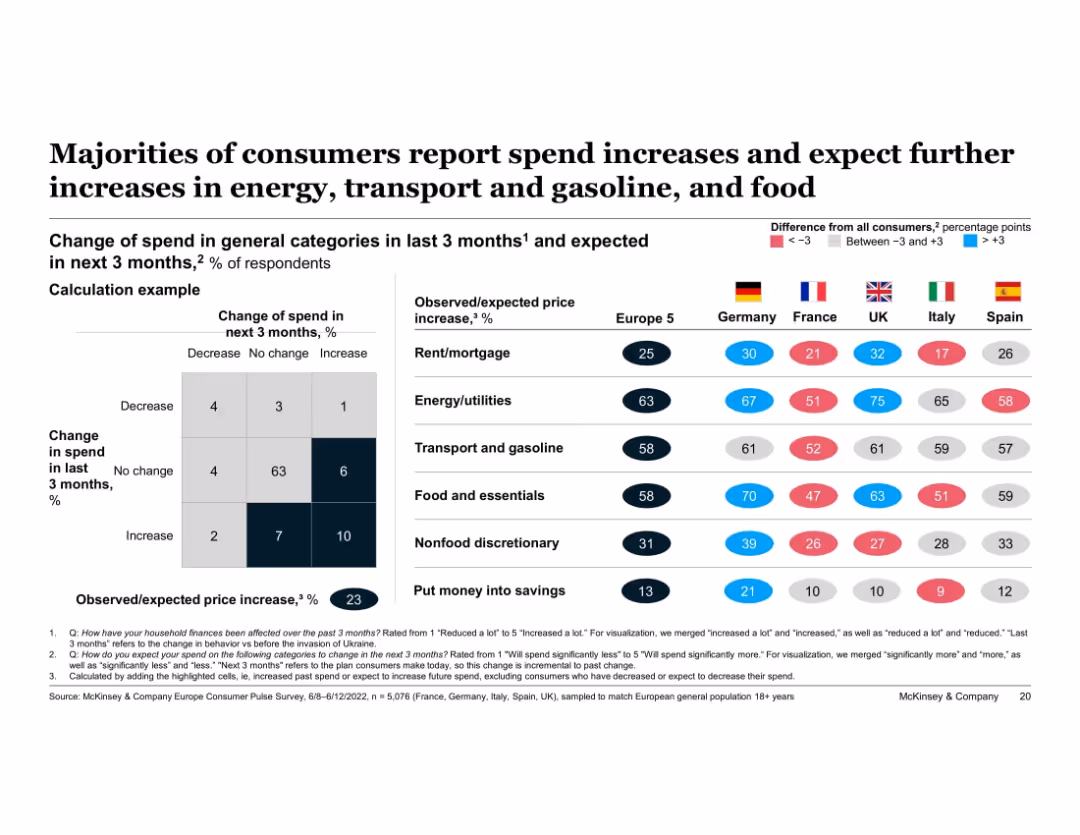
Matrix chart on left explains methodology. Right table compares observed/expected price increase % by category across Europe 5 and individual countries. Colored dots indicate variance from European average.
Market Analysis and Trends
Financial Services
This slide compares actual and expected spend increases across major categories like food, energy, transport, and savings among European countries. Germany reports above-average inflation impacts in several areas, particularly food and energy, with consistently high future spend expectations.
Europe, Germany, inflation comparison, consumer spend, future spending, energy, food, international comparison
false
Market Analysis and Trends
Financial Services financial-services
Multiple Chart
McKinsey
View slide
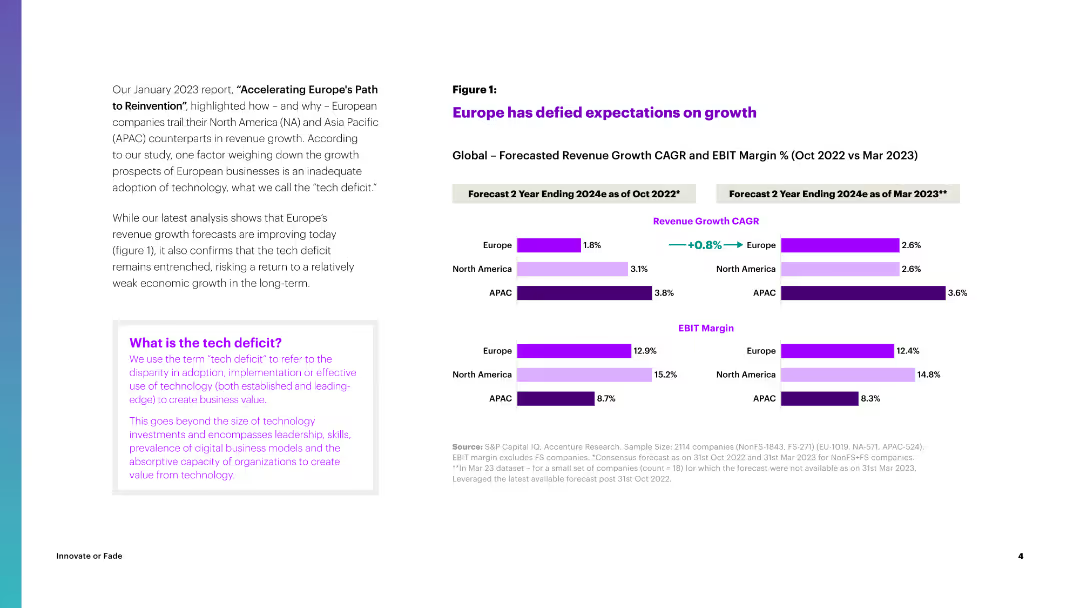
The slide presents a combination of column charts showing revenue growth CAGR and EBIT margin forecasts for Europe, North America, and APAC for 2024, compared between Oct and Mar 2023.
Market Analysis and Trends
Financial Services
It discusses how Europe's revenue growth forecasts have improved, comparing growth expectations across different regions and highlighting the tech deficit's impact.
Europe, Growth, Revenue, CAGR, EBIT Margin
false
Market Analysis and Trends
Financial Services financial-services
Multiple Chart
Accenture
View slide
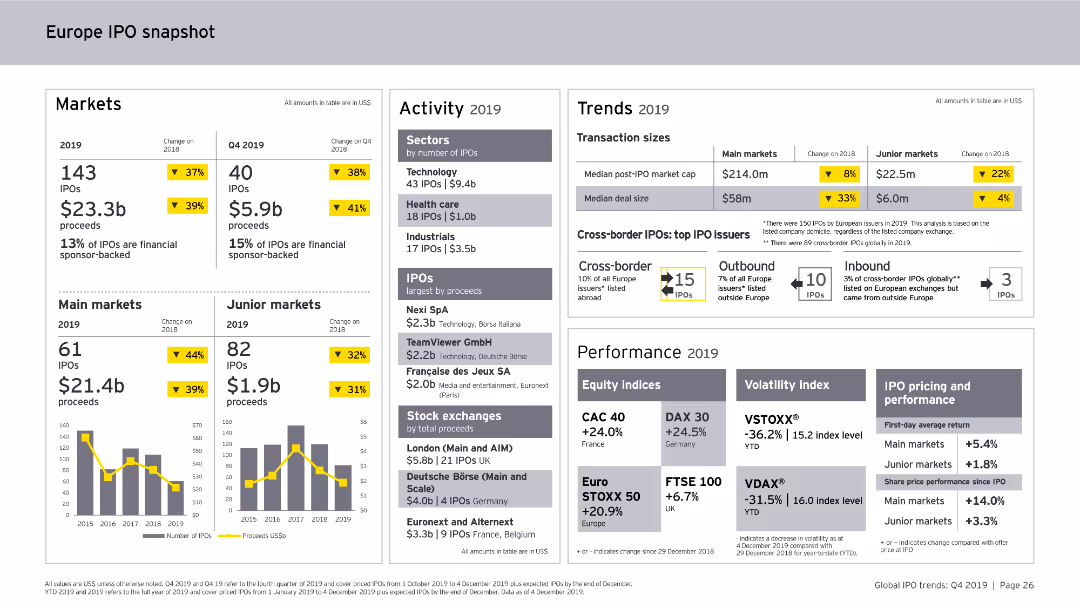
This slide includes column charts and numerical data points. It provides a snapshot of the Europe IPO market in 2019, covering markets, activity levels, trends, and performance metrics.
Market Analysis and Trends
Financial Services
The slide offers an overview of the Europe IPO market for 2019, detailing the number of IPOs, proceeds, sector activity, transaction sizes, cross-border IPOs, and performance indicators.
Europe, IPO, Market Analysis, Financial Services, Trends, Activity, Performance, 2019
false
Market Analysis and Trends
Financial Services financial-services
Multiple Chart
EY
View slide
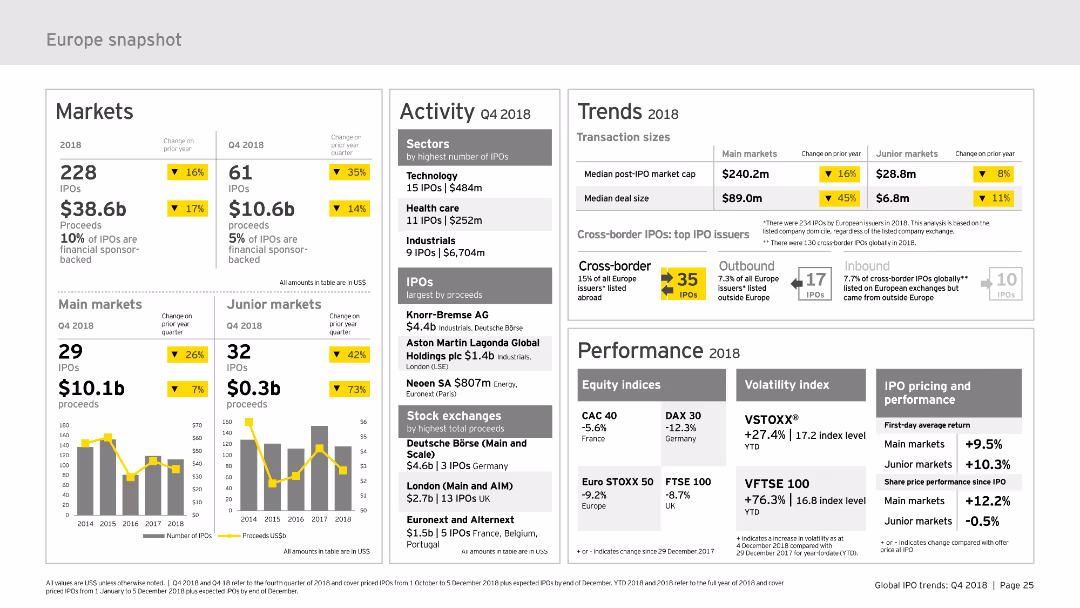
The slide provides a comprehensive snapshot of the European IPO market, divided into sections such as markets, activity, trends, and performance. It uses column charts and data tables to present information clearly. The layout is moderately complex, designed to offer detailed insights into market trends and activities.
Market Analysis and Trends
Financial Services
Offers a detailed overview of the European IPO market for 2018, including market performance, activity data, trends, and key metrics. It is useful for understanding the European market dynamics and making strategic decisions.
Europe, IPO, market snapshot, performance, trends
false
Market Analysis and Trends
Financial Services financial-services
Multiple Chart
EY
Previous
Loading...
Hold On!
We are searching in our database
If nothing, comes up, please try different filters!
Column Chart
Heatmap
Chevron
Org Chart
Infographic
Callouts
Timeline
List
Graphic
Picture
Process Flow
Diagram
Paragraph
Map
Table
Framework
Subtitle
Takeaway Box
Icon
Other Chart
Radar Chart
Waterfall Chart
Mekko Chart
Pie Chart
Scatter Plot
Line Chart
Bar chart
Bullet points
Create a FREE account to continue browsing
Receive Instant Access to 1,000+ slides from companies like McKinsey, Google, and Goldman Sachs
First Name
Last Name
Email
Password
I agree to all
Terms & Privacy Policy
Thank you! Your submission has been received!
Oops! Something went wrong while submitting the form.
Have an account?
Sign in
Upgrade to PRO to Save slides
Advanced Search and Filters
Access to 15,000+ slides
Access to Category Pages
Save/Bookmark Slides
PowerPoint Template Library
Pick a Plan
MONTHLY
$12/month
Billed every month, Cancel anytime.
YEARLY
$9/year
Billed $108 annually, Cancel anytime.
Checkout for $12/month
Checkout for $108/yr
Secured by Stripe | AES-256 bit encryption