My Account
My Slides
Search by Category
Templates
View All Templates
Download Template Slides
Leave Feedback
Login
Logout
Get Started
Browse all Slides
Browse all Slides
Create a FREE Account
Instant access to 1,000+ real slides from top companies like McKinsey, BCG, Goldman Sachs, Google and many more!
First Name
Last Name
Email
Password
I agree to all
Terms & Privacy Policy
Thank you! Your submission has been received!
Oops! Something went wrong while submitting the form.
Have an account?
Sign in
Spark Your Next Big Idea with New Presentation Templates
VIEW ALL Templates
Welcome,
Welcome
PRO
Show Featured Only
Checkbox 8
Companies
Mckinsey
Bain
BCG
EY
Deloitte
Accenture
PwC/Strategy&
JP Morgan
Goldman Sachs
Morgan Stanley
Citigroup
Deutsche Bank
Barclays
LEK
KPMG
Kearney
Oliver Wyman
Booz Allen Hamilton
Gartner
IPSOS
Nielsen
Slide type
Text Only
Linear Flow
Vertical Flow
Single Chart
Header Horizontal
Mixed Chart
Header Vertical
Pillar
Multiple Chart
Graphic
Agenda
Title
Table
Framework
Industry
Technology & Software
Artificial Intelligence
Financial Services
Retail & E-commerce
Consumer Goods
Industrial & Manufacturing
Transportation & Logistics
Telecommunications
Real Estate & Construction
Hospitality & Tourism
Professional Services
Education & Training
Media & Entertainment
Agriculture & Food Production
Healthcare & Pharmaceuticals
Environmental Services & Sustainability
Government & Public Sector
Use Case
Mergers and Acquisitions
Performance Metrics and KPIs
Client Case Studies
Competitive Landscape
Corporate Finance and Valuation
Product and Service Analysis
Customer and Market Segmentation
Organizational Structure and Change
Industry Overview
Regulatory and Compliance
Risk Assessment and Management
Investment Analysis
Organizational Structure and Change
Human Resources and Talent Management
Financial Performance
Market Analysis and Trends
Sales and Business Development
Human Resources and Talent Management
Clear all
Thank you! Your submission has been received!
Oops! Something went wrong while submitting the form.
Tag
View slide
Column charts and tables are used to illustrate the number of IPOs and proceeds in Europe, including main and junior markets.
Market Analysis and Trends
Financial Services
It details the performance of IPOs in Europe, highlighting major stock exchanges, sectors, and notable IPOs by proceeds.
Europe, IPOs, main markets, junior markets, stock exchanges
false
Market Analysis and Trends
Financial Services financial-services
Multiple Chart
EY
View slide
The slide features a map of Europe on the left, highlighting countries in blue. On the right, there are three vertical sections with numbers 1, 2, and 3, each containing text. The layout is simple and visually balanced.
Strategic Planning
Professional Services
The slide outlines the benefits of KnowledgePanel's expansion across Europe, highlighting increased brand recognition, revenue gains, and expanded market presence.
Europe, KnowledgePanel, expansion, strategy, benefits
false
Strategic Planning
Professional Services professional-services
Graphic
IPSOS
View slide
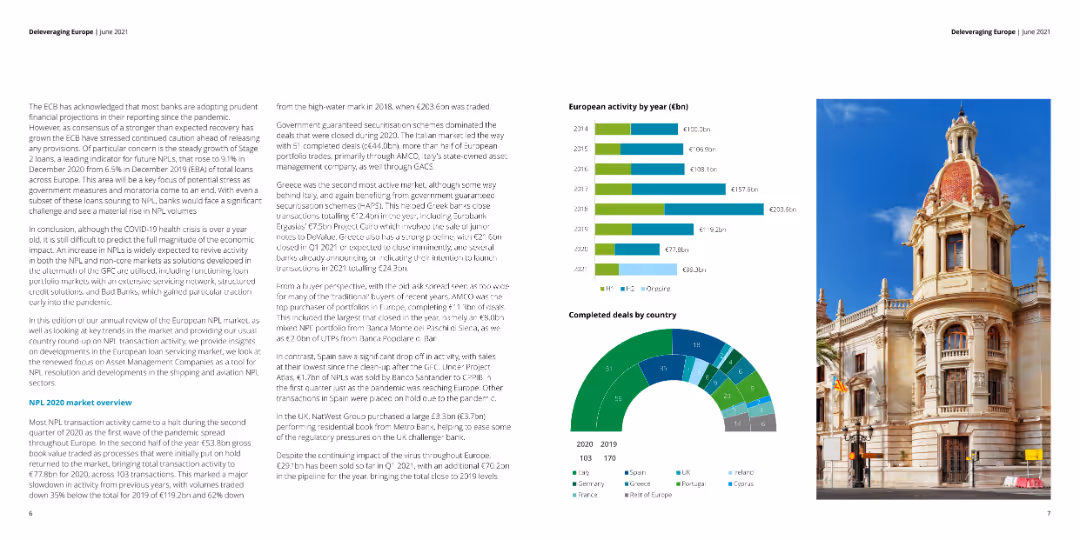
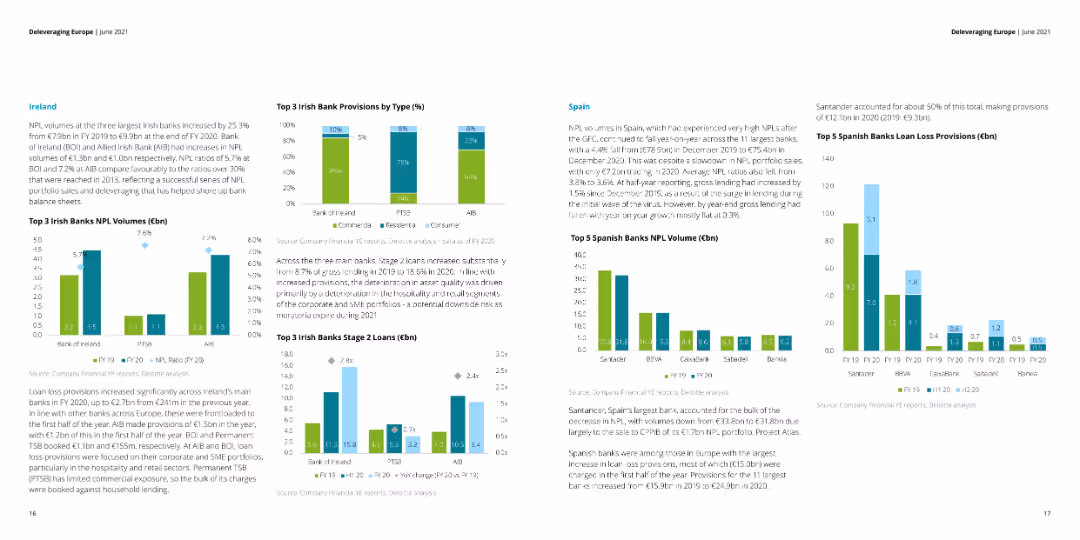
Multiple column charts showing European activity by year, completed deals by country, and NPL market overview.
Market Analysis and Trends
Financial Services
Provides an overview of NPL transactions and activity across Europe by year and by country.
Europe, NPL, activity, market, trends
false
Market Analysis and Trends
Financial Services financial-services
Multiple Chart
Deloitte
View slide
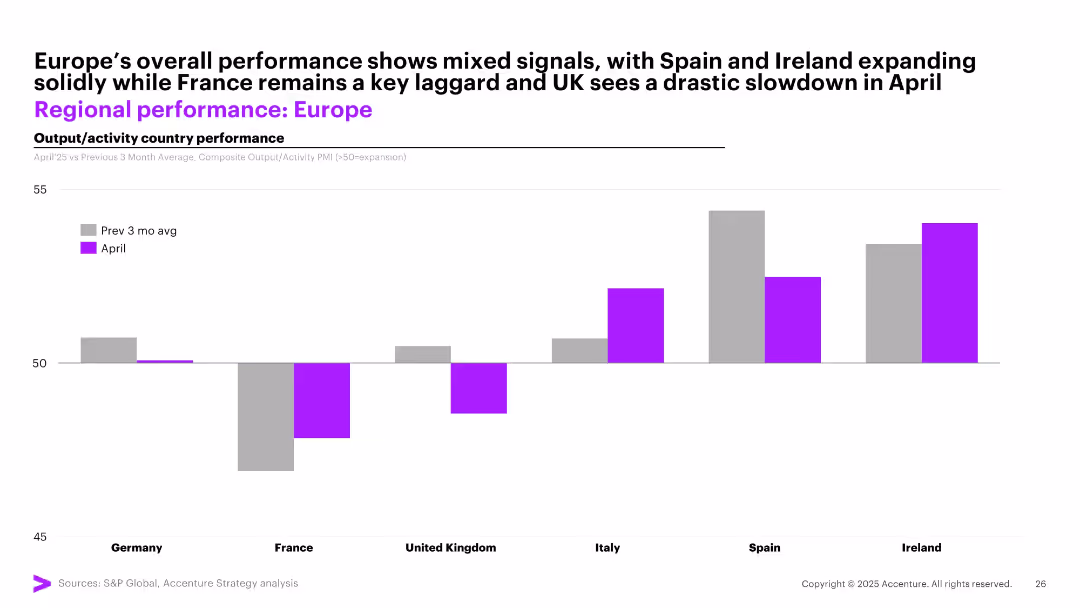
Single bar chart comparing April PMI activity vs 3-month average across major European countries; uses color coding and simple layout with country names on x-axis.
Performance Metrics and KPIs
Industrial & Manufacturing
This slide provides a comparative snapshot of economic activity in Europe. Spain and Ireland show solid growth, while France and the UK have seen notable slowdowns. Businesses should adjust regional strategies based on diverging economic performance.
Europe, PMI, regional output, France, Spain, UK, performance variation
false
Performance Metrics and KPIs
Industrial & Manufacturing industrial-and-manufacturing
Single Chart
Accenture
View slide
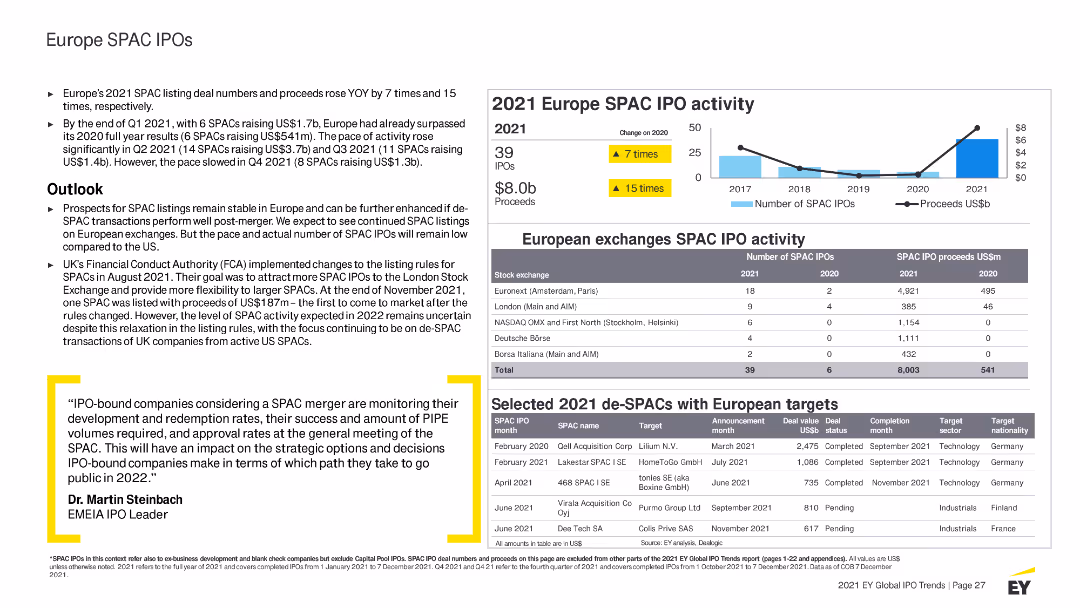
Features column charts, tables, and bullet points with highlighted statistics. Uses blue and yellow colors to indicate different SPAC activities and trends.
Market Analysis and Trends
Financial Services
Summarizes SPAC IPO activities in Europe for 2021, detailing trends, major SPAC IPOs by region and sector, and outlook for SPAC activities in Europe.
Europe, SPAC, IPO, 2021 activity, market highlights, trends, sectors, performance, outlook, stock exchanges, regulations
false
Market Analysis and Trends
Financial Services financial-services
Mixed Chart
EY
View slide
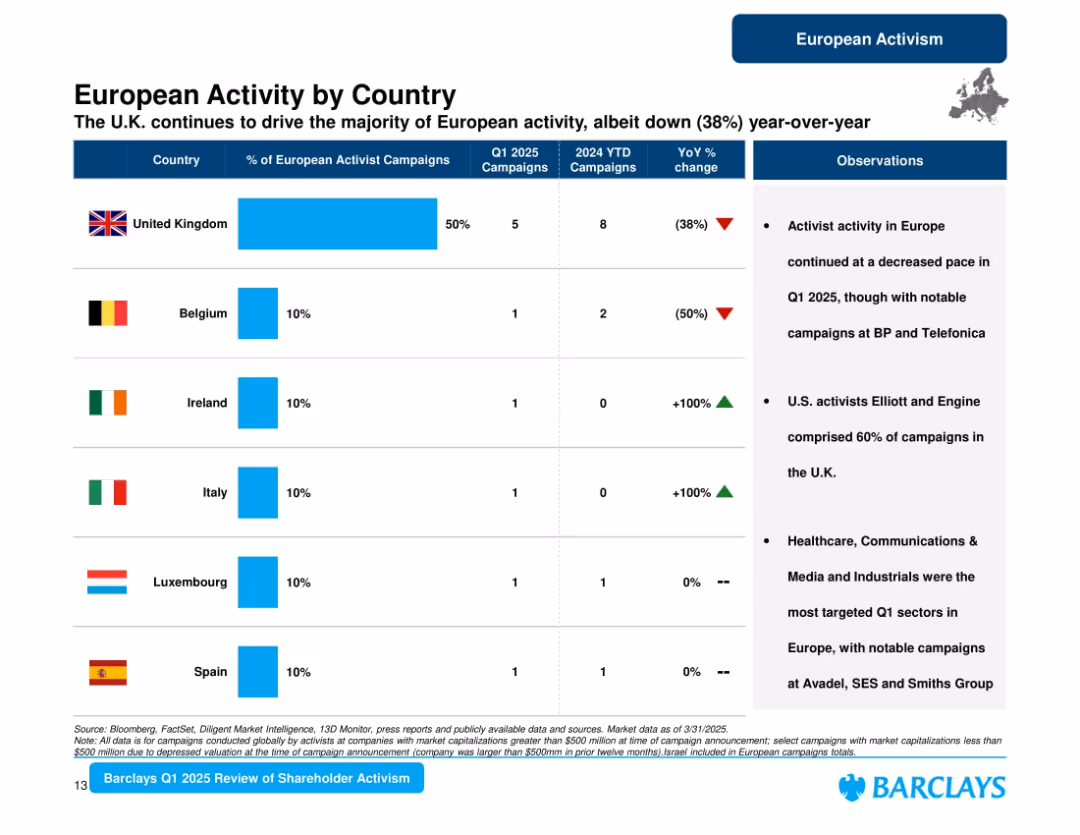
Tabular format with country flags, bars, and bullet point observations. Three main columns for metrics and one for insights.
Market Analysis and Trends
Financial Services
Provides a country-wise breakdown of activist campaign activity across Europe in Q1 2025, highlighting the UK’s dominant share and YoY changes. It also notes trends in activist involvement and sector focus across countries.
Europe, UK, Belgium, Campaigns, Activism, YoY Change, Sector Focus, Shareholder, 2025
false
Market Analysis and Trends
Financial Services financial-services
Mixed Chart
Barclays
View slide
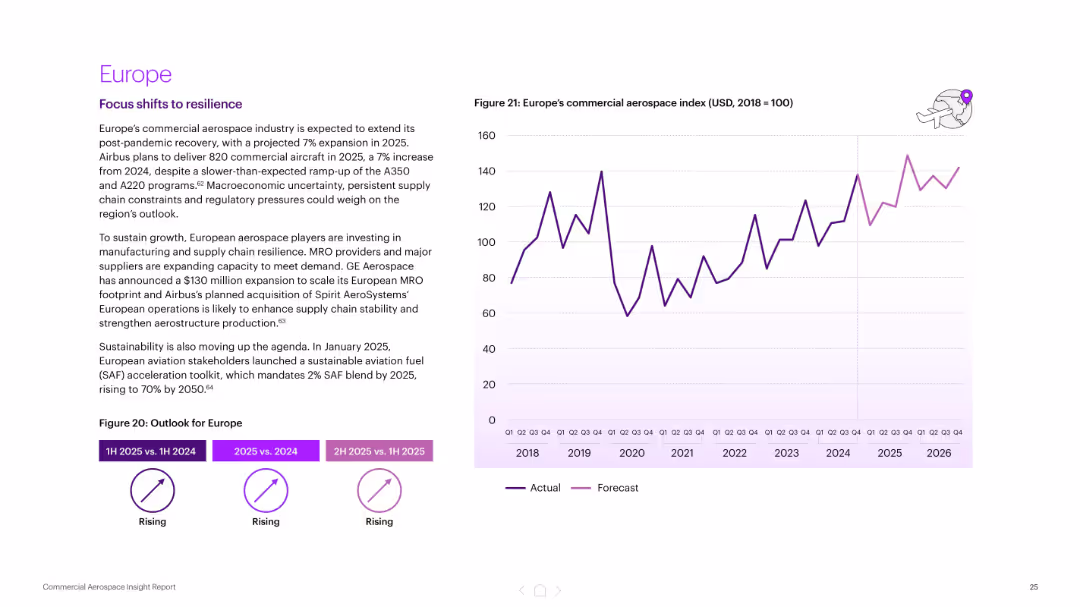
Text section on the left with growth summary; right side graph shows Europe’s aerospace index (2018–2026). Consistent with other regional slides.
Market Analysis and Trends
Industrial & Manufacturing
Forecasts a 7% growth in Europe’s aerospace sector for 2025. Highlights Airbus production targets, supply chain resilience investments, and the introduction of sustainability regulations (SAF blend targets).
Europe, aerospace growth, Airbus, supply chain resilience, sustainability, SAF, forecast, commercial aviation
false
Market Analysis and Trends
Industrial & Manufacturing industrial-and-manufacturing
Mixed Chart
Accenture
View slide
Multiple column charts showing activity by asset type, completed deals, and loan sale activity by portfolio type.
Market Analysis and Trends
Financial Services
Analyzes European activity in various asset types since 2014, highlighting trends in completed and ongoing deals by country.
Europe, asset, market, trends, deals
false
Market Analysis and Trends
Financial Services financial-services
Multiple Chart
Deloitte
View slide
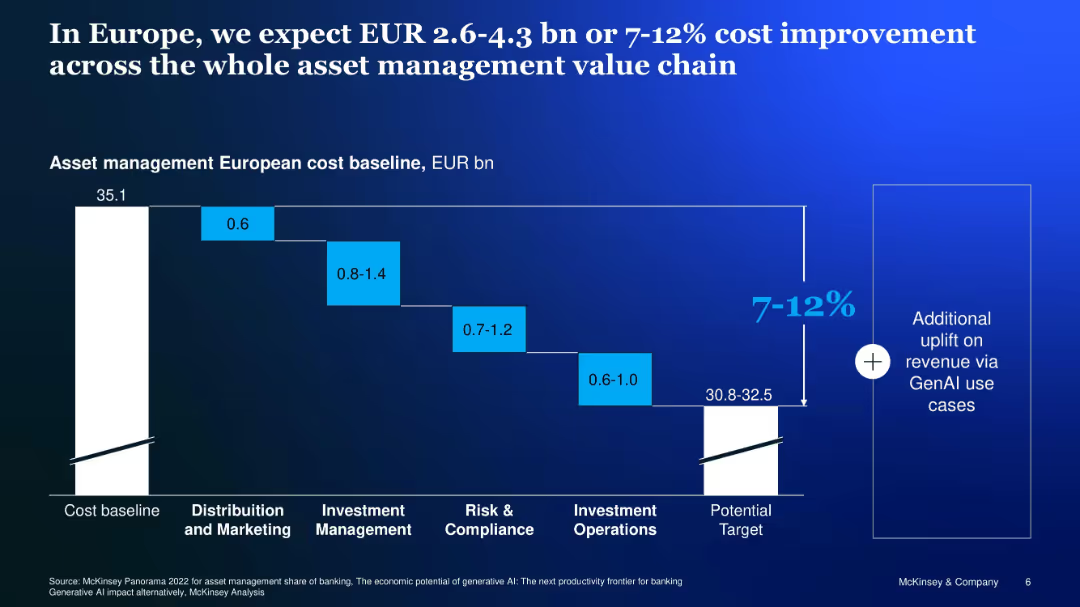
Waterfall chart showing potential GenAI-related cost reduction across asset management functions
Financial Performance
Financial Services
Analyzes cost-saving potential of GenAI across European asset management, estimating 7–12% savings from process efficiencies across marketing, investment, compliance, and operations.
Europe, cost savings, asset management, GenAI, waterfall, value chain
false
Financial Performance
Financial Services financial-services
Single Chart
McKinsey
View slide
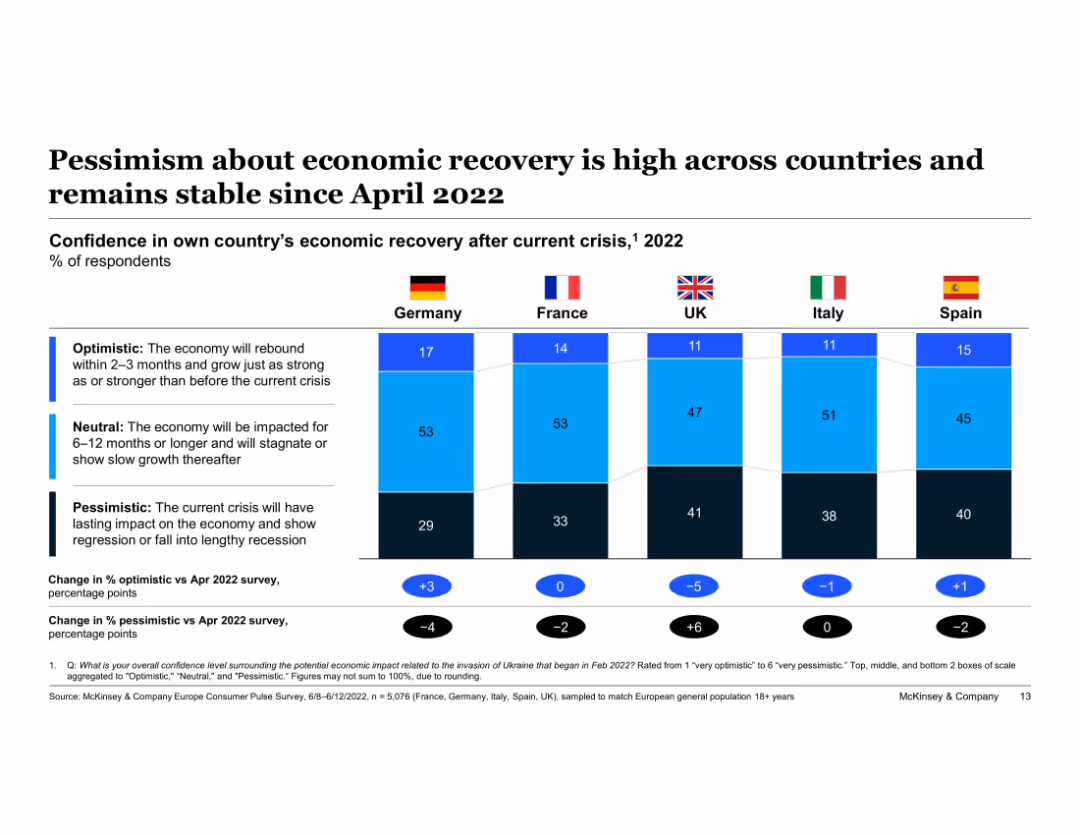
Horizontal segmented bar chart comparing Germany, France, UK, Italy, and Spain. Bars divided into “Optimistic,” “Neutral,” and “Pessimistic.” Flags above each bar. Differences from April 2022 shown below. Legends and description provided on left.
Market Analysis and Trends
Financial Services
The chart compares economic recovery confidence across five European countries in 2022, showing that pessimism remains high. Germany has slightly improved optimism (+3%) while the UK has the highest pessimistic shift. Each country’s sentiment is broken into three categories for comparison.
Europe, economic sentiment, pessimism, optimism, recovery confidence, Germany, France, UK, Italy, Spain
false
Market Analysis and Trends
Financial Services financial-services
Single Chart
McKinsey
View slide
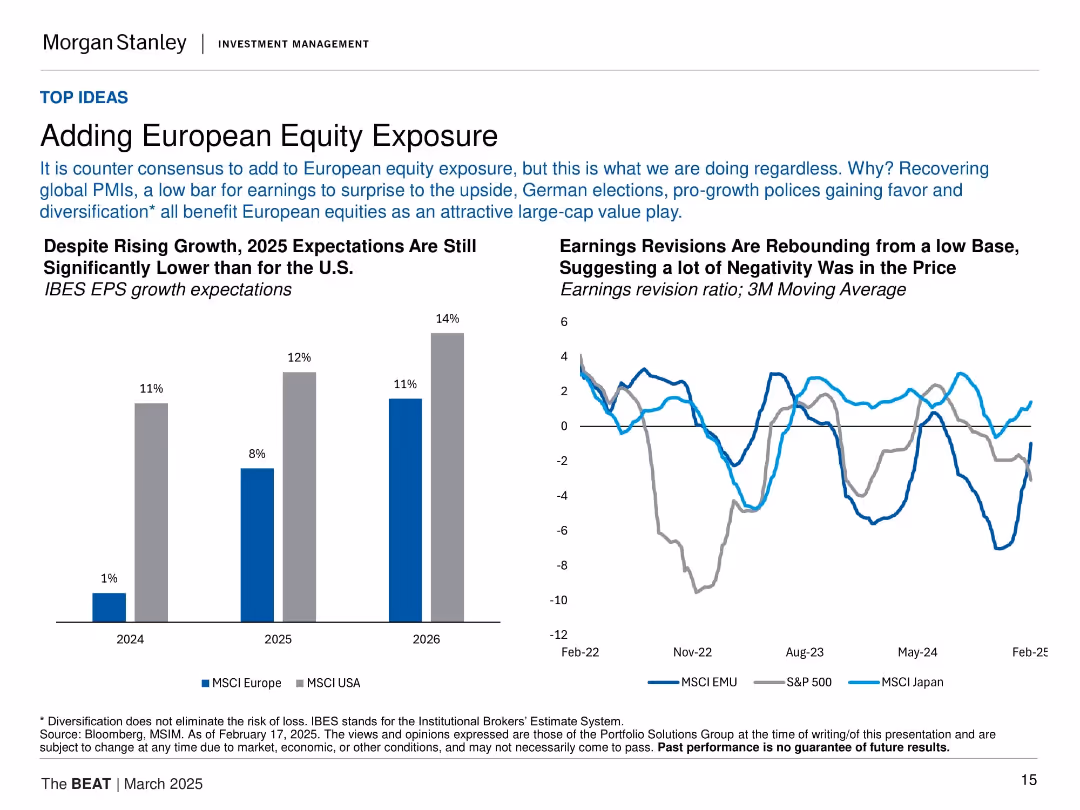
Bar chart of EPS growth expectations (EU vs US); line chart of earnings revisions by region. Clear labels and dual layout.
Investment Analysis
Financial Services
Advocates for increased European equity exposure despite a generally cautious consensus. Notes that EPS expectations are rising and revisions are turning positive, aided by global PMIs, pro-growth policies, and low valuation baselines.
Europe, equities, EPS growth, earnings revisions, MSCI Europe, diversification, investment strategy
false
Investment Analysis
Financial Services financial-services
Multiple Chart
Morgan Stanley
View slide
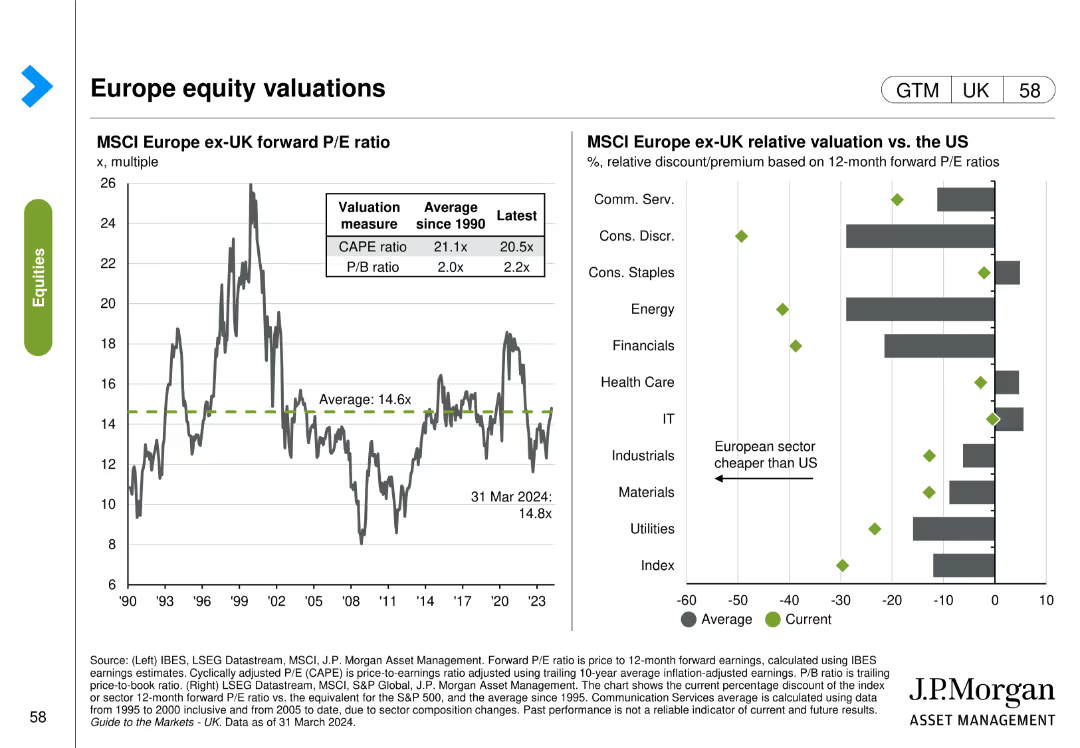
This slide features two column charts. The first chart shows the MSCI Europe ex-UK forward P/E ratio over time. The second chart compares MSCI Europe ex-UK relative valuation vs. the US across different sectors.
Investment Analysis
Financial Services
The slide presents an analysis of the MSCI Europe ex-UK forward P/E ratio and its comparison with US sectors, useful for investment analysis and strategy formulation.
Europe, equity, valuations, MSCI, P/E ratio, US, comparison, sectors
false
Investment Analysis
Financial Services financial-services
Multiple Chart
JP Morgan
View slide
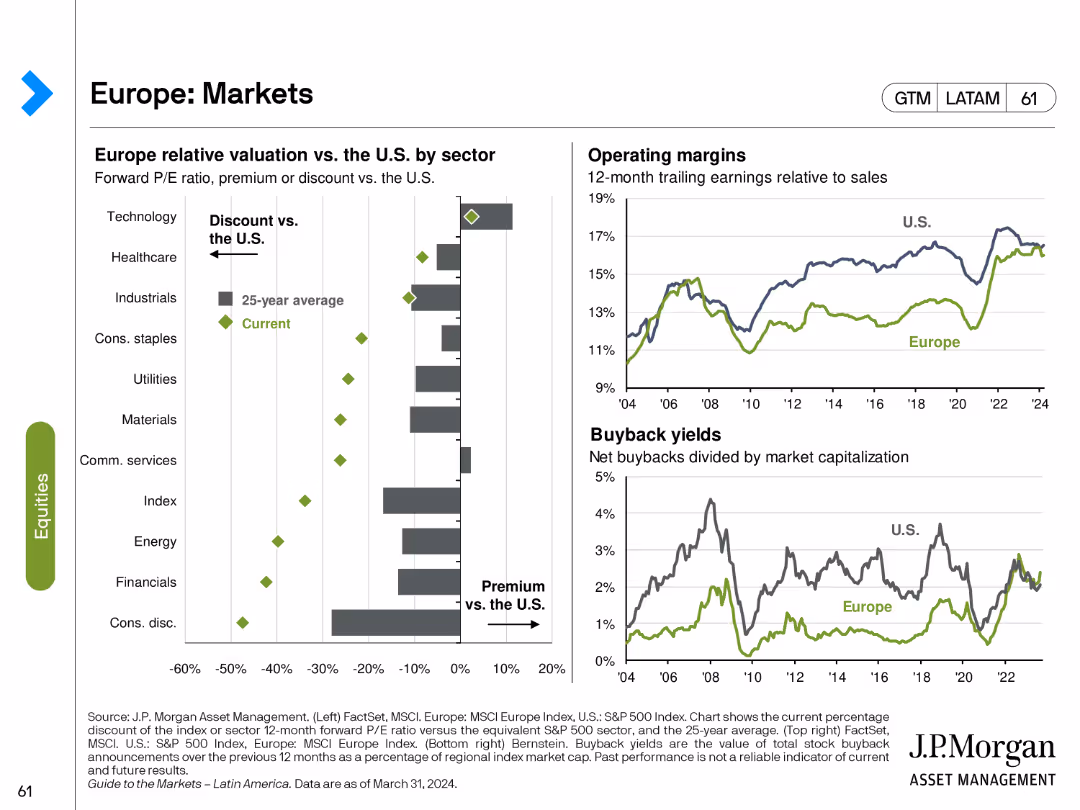
The slide features a bar chart showing Europe relative valuation vs. U.S. by sector, and two line charts depicting operating margins and buyback yields.
Market Analysis and Trends
Financial Services
This slide analyzes the European market, focusing on sector valuations relative to the U.S., as well as operating margins and buyback yields over time.
Europe, markets, sector valuation, operating margins, buyback yields
false
Market Analysis and Trends
Financial Services financial-services
Multiple Chart
JP Morgan
View slide
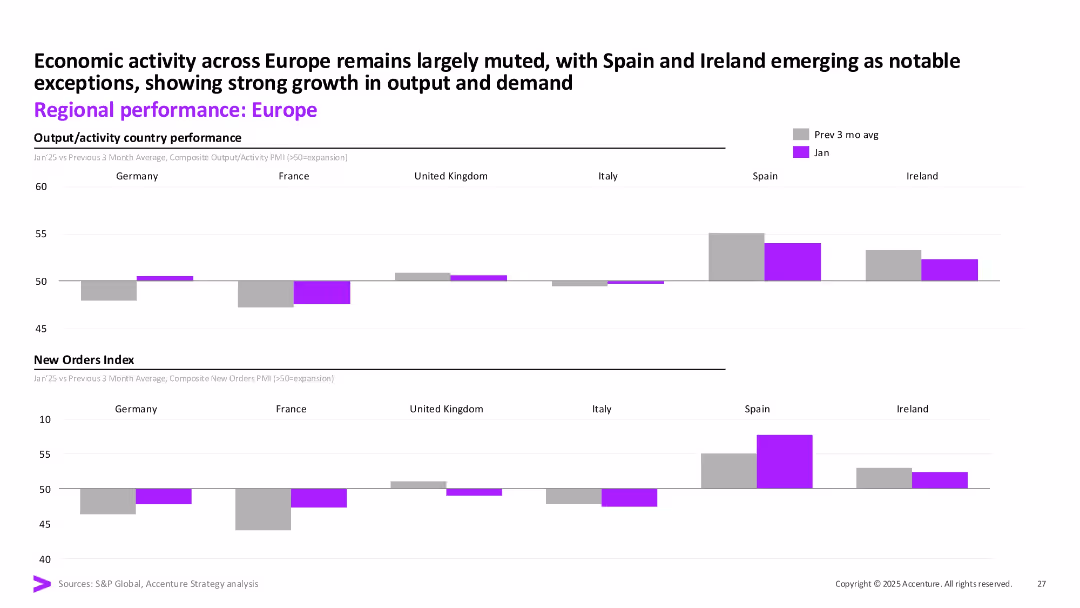
Two stacked bar sections showing composite output and new orders for major European economies. Purple bars indicate January values vs previous 3-month average.
Market Analysis and Trends
Financial Services
This slide compares economic activity in Europe by country, showing muted growth overall with notable strength in Spain and Ireland. Both output and new orders show divergence across the region, offering a granular look at regional demand and recovery.
Europe, output, new orders, Spain, Ireland, Germany, PMI, activity
false
Market Analysis and Trends
Financial Services financial-services
Multiple Chart
Accenture
View slide
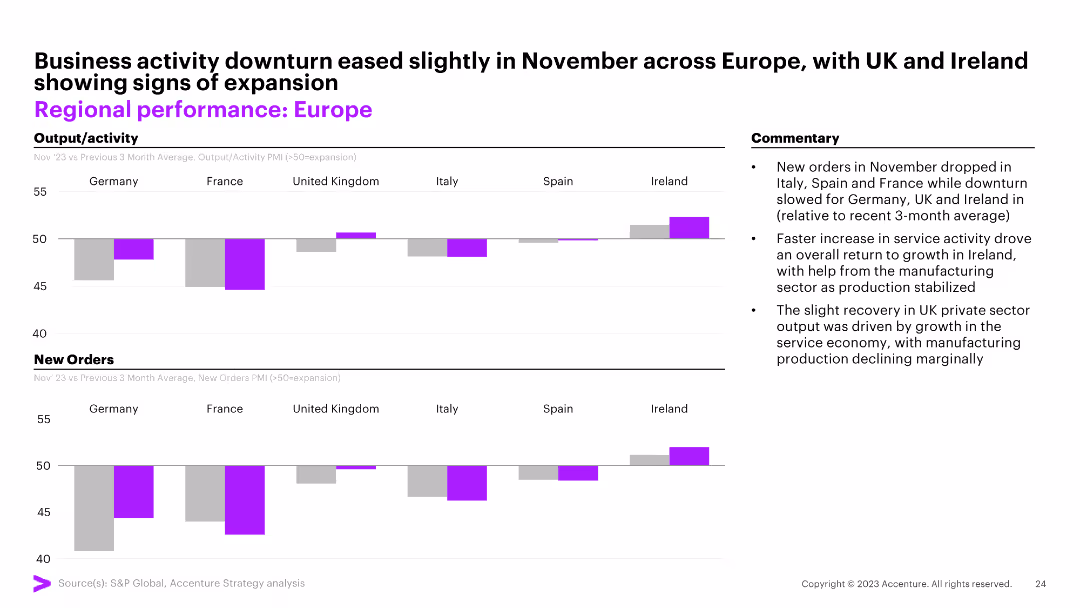
Two column charts comparing output/activity and new orders across European countries. The slide also includes commentary on business activity in November.
Market Analysis and Trends
Financial Services
This slide analyzes the performance of different European countries, comparing their output/activity and new orders, with a focus on changes observed in November.
Europe, performance, activity, orders, November
false
Market Analysis and Trends
Financial Services financial-services
Multiple Chart
Accenture
View slide
Map of Europe showing bank coverage, icons representing key statistics such as number of banks, branches, dimensions analyzed, and annual records database. Purple color scheme.
Market Analysis and Trends
Financial Services
Provides an overview of the 2024 Retail Banking Radar, tracking 89 retail banks across 21 European markets, detailing coverage, branches, dimensions analyzed, and annual records.
Europe, retail banks, coverage, branches, dimensions
false
Market Analysis and Trends
Financial Services financial-services
Graphic
Kearney
View slide
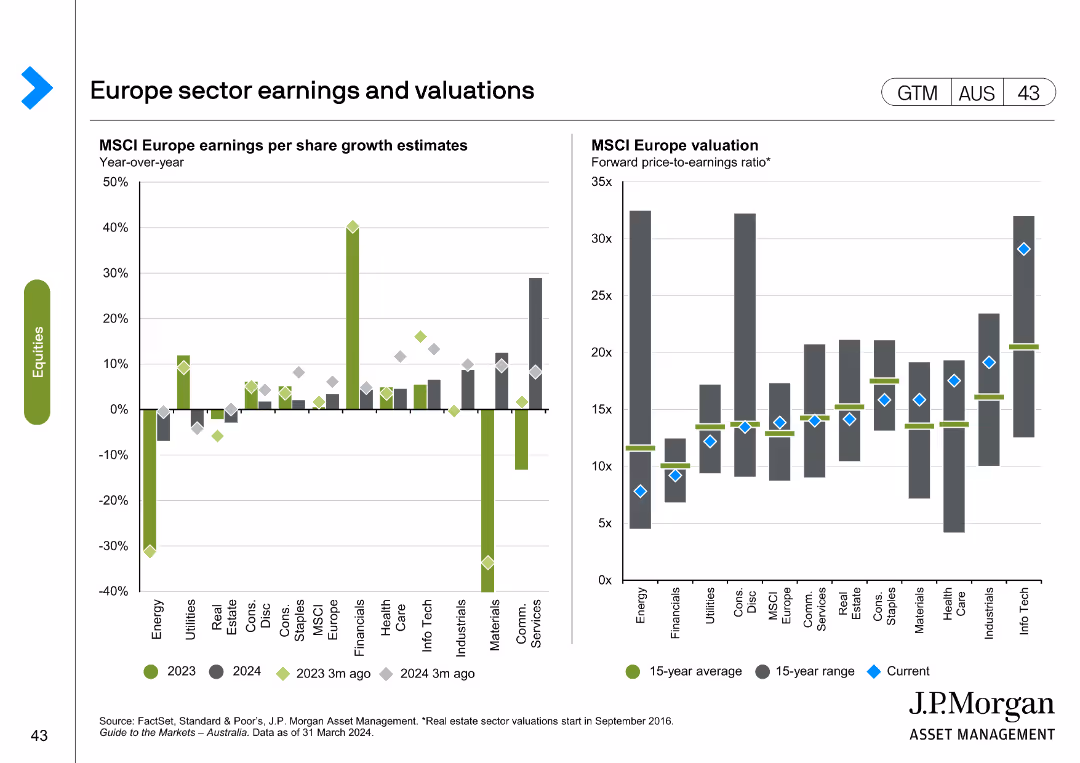
The slide includes two charts: a column chart on MSCI Europe earnings per share growth estimates, and a line chart on MSCI Europe valuation forward price-to-earnings ratio.
Financial Performance
Financial Services
Analyzes sector earnings and valuations in Europe, focusing on MSCI Europe growth estimates and P/E ratios, useful for financial performance analysis.
Europe, sector earnings, valuations, MSCI Europe, growth estimates
false
Financial Performance
Financial Services financial-services
Multiple Chart
JP Morgan
View slide
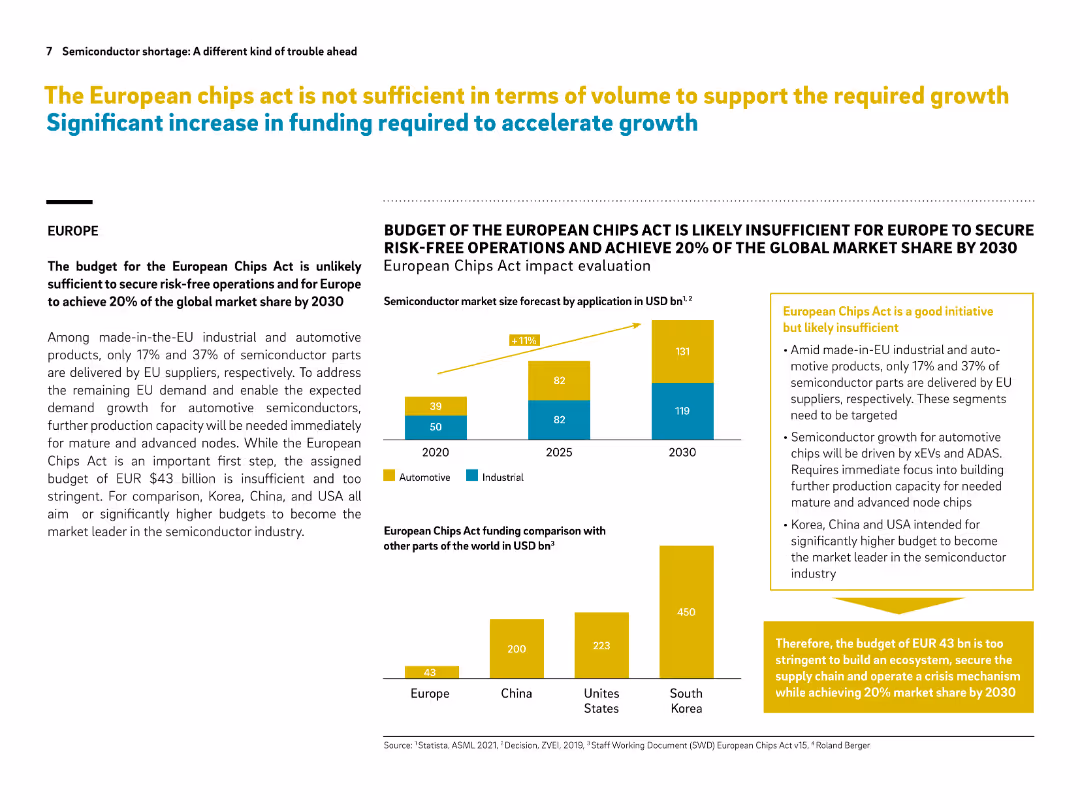
Layout includes text, bar graphs, and callout boxes in yellow. Data visuals compare budgets and market share ambitions.
Regulatory and Compliance
Government & Public Sector
This slide critiques the European Chips Act, indicating its budget is too low to secure 20% global market share by 2030. It compares funding plans across regions, highlighting that Europe’s $43B is dwarfed by the US, Korea, and China. Immediate investment in mature nodes is urged.
European Chips Act, semiconductor, funding gap, market share, automotive chips, EU policy, comparison, risk-free operations
false
Regulatory and Compliance
Government & Public Sector government-and-public-sector
Multiple Chart
Roland Berger
View slide
This slide combines text and a map image. On the left, there are four bullet points highlighting the sponsor's qualifications, including alignment with unitholders and on-ground European teams. On the right, there's a map of Europe indicating the sponsor's office locations with simple icons.
Strategic Planning
Real Estate & Construction
Outlines the Cromwell Property Group's strengths, including investment alignment, local expertise, and European market presence.
European Footprint, Local Expertise, Real Estate Sponsorship, Office Locations, Market Presence, Professional Experience
false
Strategic Planning
Real Estate & Construction real-estate-and-construction
Table
Morgan Stanley
View slide
The slide includes column charts and tables summarizing IPO activities in European main and junior markets. It shows number of IPOs, proceeds, and details on stock exchanges and sectors.
Market Analysis and Trends
Financial Services
The slide reviews the subdued IPO market in Europe, discussing the cautious investor sentiment and regulatory efforts to stimulate activity. Data on IPOs, proceeds, and key stock exchanges and sectors are provided.
European IPOs, market trends, investor sentiment, regulatory efforts, financial analysis
false
Market Analysis and Trends
Financial Services financial-services
Multiple Chart
EY
View slide
Contains a flow diagram for a delivery model, capabilities checklist, and visual icons representing different payment methods.
Market Analysis and Trends
Technology & Software
Discusses J.P.Morgan's opportunities in serving European SMBs and Marketplaces, showing their capabilities and potential growth areas.
European Market, SMBs, Marketplaces, Payment Methods, J.P.Morgan, Growth Opportunity
false
Market Analysis and Trends
Technology & Software technology-and-software
Diagram
JP Morgan
View slide
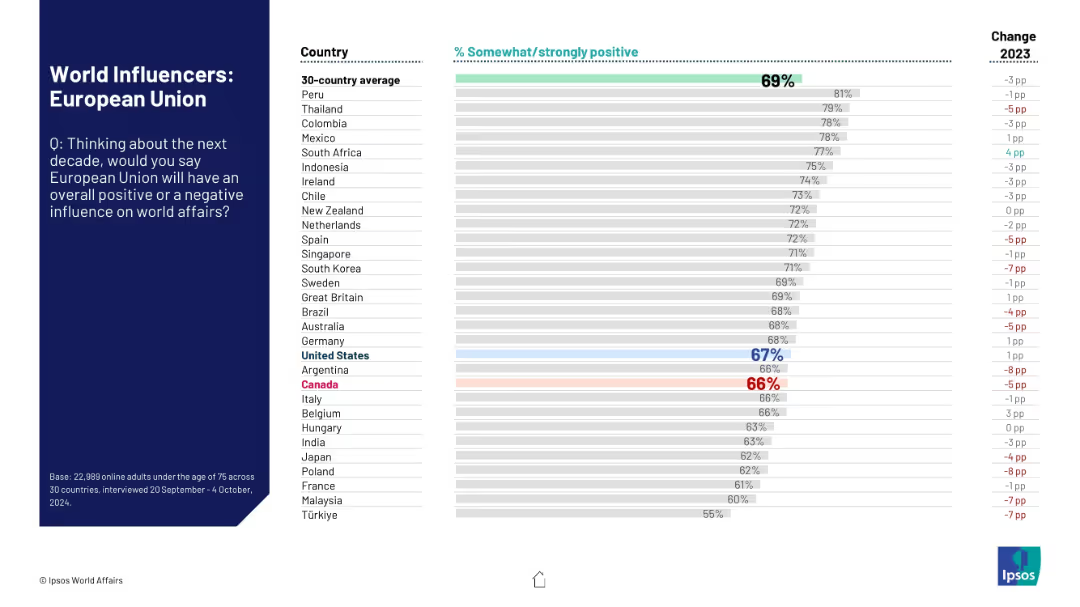
Bar chart of 30 countries' public opinion on whether the EU will have a positive influence in world affairs over the next decade.
Strategic Planning
Government & Public Sector
This slide ranks global views on the European Union’s projected influence in world affairs. It shows overall positive sentiment and highlights changes in perception from 2023, with the EU placed alongside national actors.
European Union, global affairs, influence ranking, international relations, public sentiment, Ipsos data, geopolitical perception
false
Strategic Planning
Government & Public Sector government-and-public-sector
Mixed Chart
IPSOS
View slide
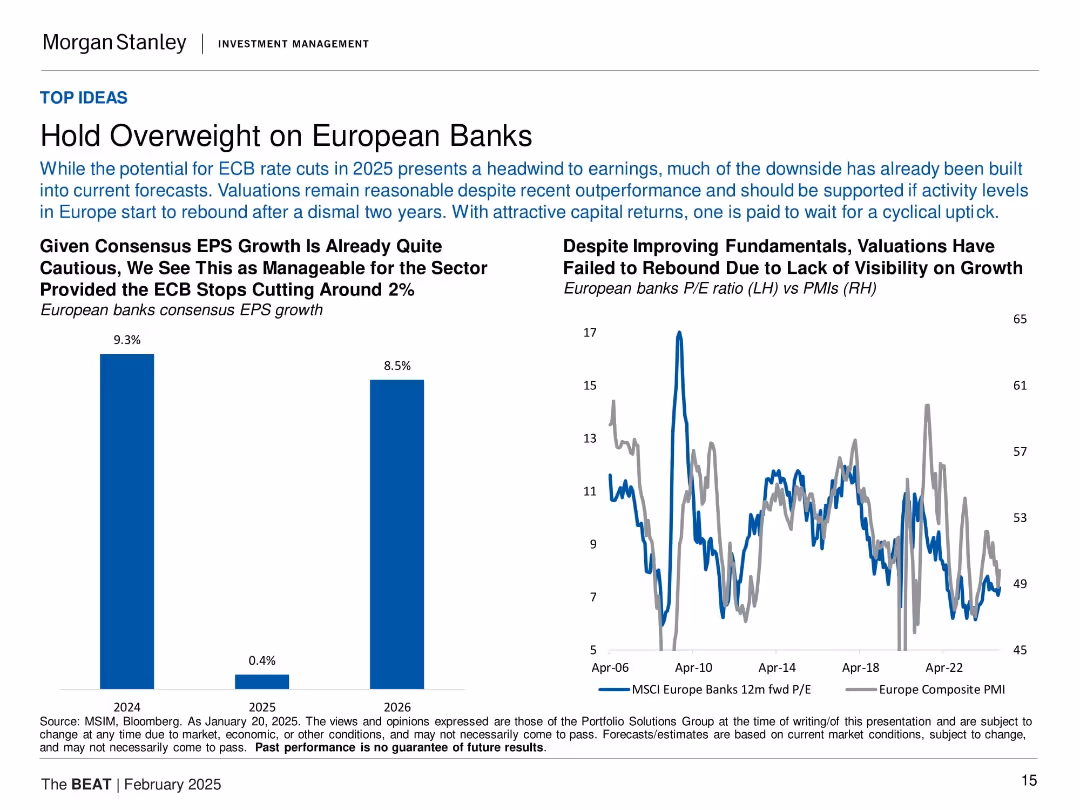
Left: bar chart of EPS forecasts for 2024–2026; Right: line chart showing P/E ratio vs PMI for European banks.
Investment Analysis
Financial Services
The slide recommends overweighting European banks, citing cautious yet positive earnings forecasts and attractive valuations. It shows earnings estimates for 2024–2026 and compares long-term valuation trends against business sentiment (PMI). The analysis suggests the downside is priced in and valuations are attractive if ECB cuts stabilize around 2%.
European banks, P/E ratio, PMI, EPS forecast, ECB cuts, valuation, overweight, investment thesis
false
Investment Analysis
Financial Services financial-services
Multiple Chart
Morgan Stanley
View slide
A column chart shows sovereign debt securities as a percentage of total bank assets across various European economies as of December 2022. The textbox details implications for corporates, focusing on the potential impact of sovereign debt exposure on credit standards and lending.
Market Analysis and Trends
Financial Services
This slide evaluates the sovereign debt exposure of European banks, particularly noting the implications of confidence events on the real economy, investment, and profit pressures. It discusses potential impacts on credit availability and funding costs for corporates.
European banks, sovereign debt, credit standards, lending, confidence events, economic impact, funding costs, corporate implications, debt exposure, market analysis
false
Market Analysis and Trends
Financial Services financial-services
Mixed Chart
Accenture
View slide
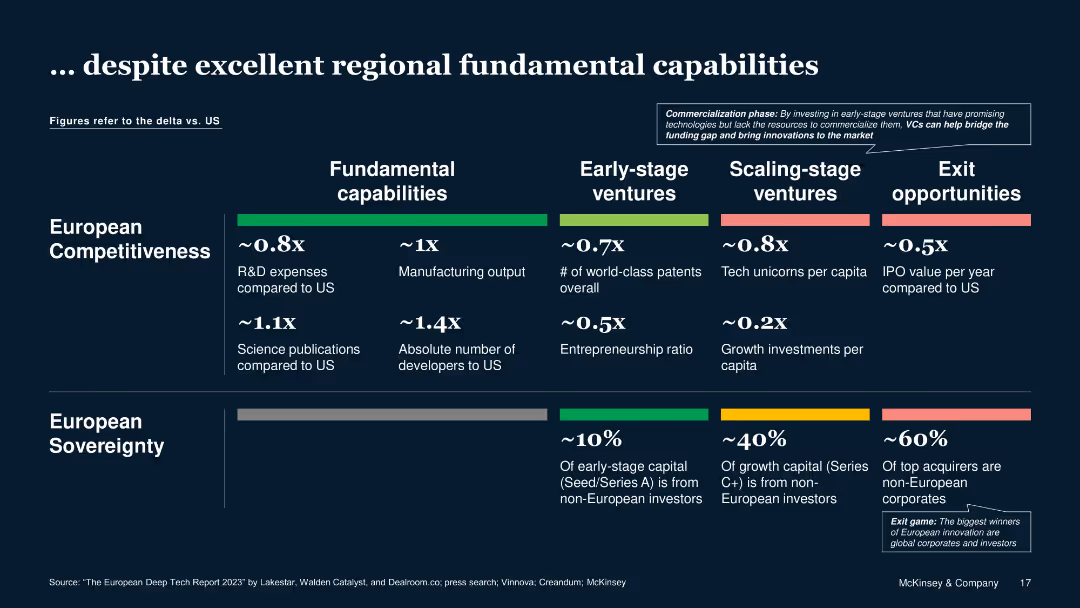
Horizontal comparative matrix across stages (capabilities to exits), US vs. Europe, using deltas and bar segments
Competitive Landscape
Technology & Software
Despite limitations in growth investments and IPOs versus the U.S., Europe shows strong fundamentals in science publications, developer availability, and manufacturing, indicating potential in Deep Tech commercialization.
European competitiveness, innovation, start-up scale, funding, R&D, patents
false
Competitive Landscape
Technology & Software technology-and-software
Table
McKinsey
View slide
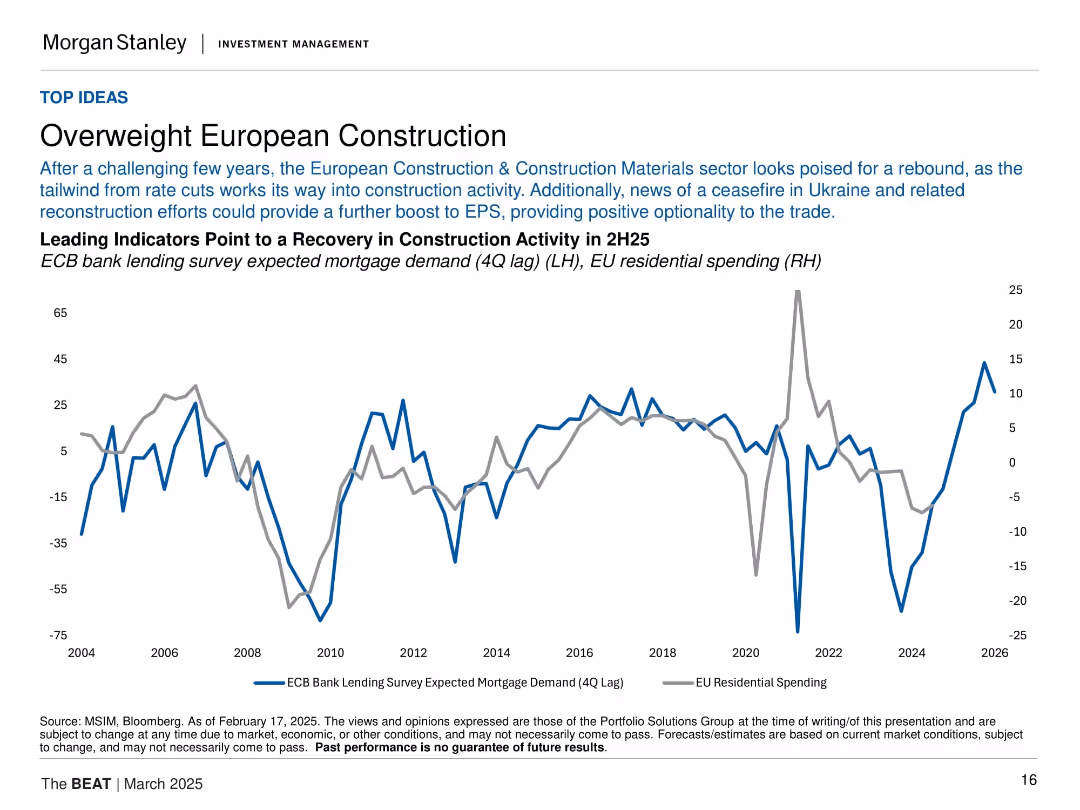
Two-line title followed by multi-sentence explanatory text in smaller font. Includes a dual-axis line graph with two indicators (blue and grey lines) showing correlation between mortgage demand and EU residential spending.
Investment Analysis
Real Estate & Construction
The slide presents an investment thesis favoring European construction, citing easing monetary policy and geopolitical developments (e.g., Ukraine ceasefire) as catalysts for recovery. The chart illustrates leading indicators of a potential rebound in EU residential construction spending.
European construction, mortgage demand, residential spending, ECB, EPS, macro trends, Ukraine, investment thesis, housing rebound, rate cuts
false
Investment Analysis
Real Estate & Construction real-estate-and-construction
Single Chart
Morgan Stanley
View slide
Contains bar graphs and a column chart, statistical breakdowns of European Earth Observation sales and market share.
Market Analysis and Trends
Technology & Software
Provides detailed insights into the European market for Earth Observation, discussing sales trends and market share.
European market, EO sales, market trends, Earth Observation
false
Market Analysis and Trends
Technology & Software technology-and-software
Multiple Chart
PwC/Strategy&
View slide
This slide contains a column chart and bar chart showing the growth of the European EO downstream market with detailed annotations. The layout is dense with textual information complementing the charts.
Market Analysis and Trends
Environmental Services & Sustainability
Focuses on the growth of the European Earth Observation downstream market, showing revenue forecasts and comparing different segments’ sales. It’s valuable for understanding regional market dynamics and growth potentials.
European market, growth forecast, revenue, market segments, Earth Observation
false
Market Analysis and Trends
Environmental Services & Sustainability environmental-services-and-sustainability
Multiple Chart
PwC/Strategy&
View slide
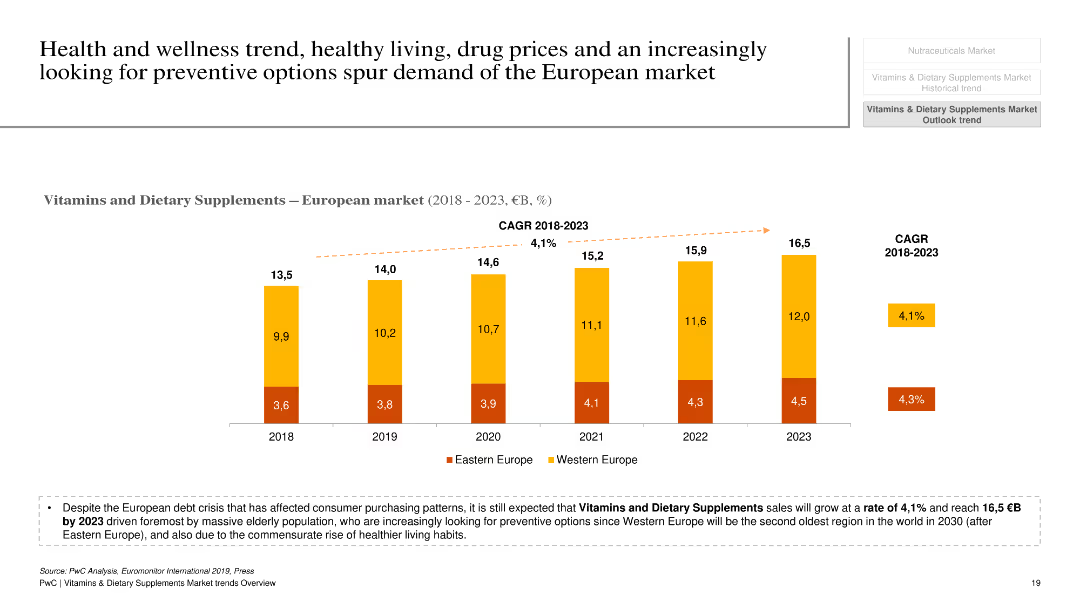
The slide features a column chart illustrating the growth of the European market for vitamins and dietary supplements from 2018 to 2023, segmented by Eastern and Western Europe. A text box below the chart highlights key drivers and market trends.
Market Analysis and Trends
Healthcare & Pharmaceuticals
The slide outlines the expected growth of the European vitamins and dietary supplements market, driven by health and wellness trends, preventive health measures, and demographic factors. It includes a comparative analysis of market segments and provides an overview of growth rates and key influencing factors.
European market, vitamins, dietary supplements, growth drivers, preventive health
false
Market Analysis and Trends
Healthcare & Pharmaceuticals healthcare-and-pharmaceuticals
Mixed Chart
PwC/Strategy&
View slide
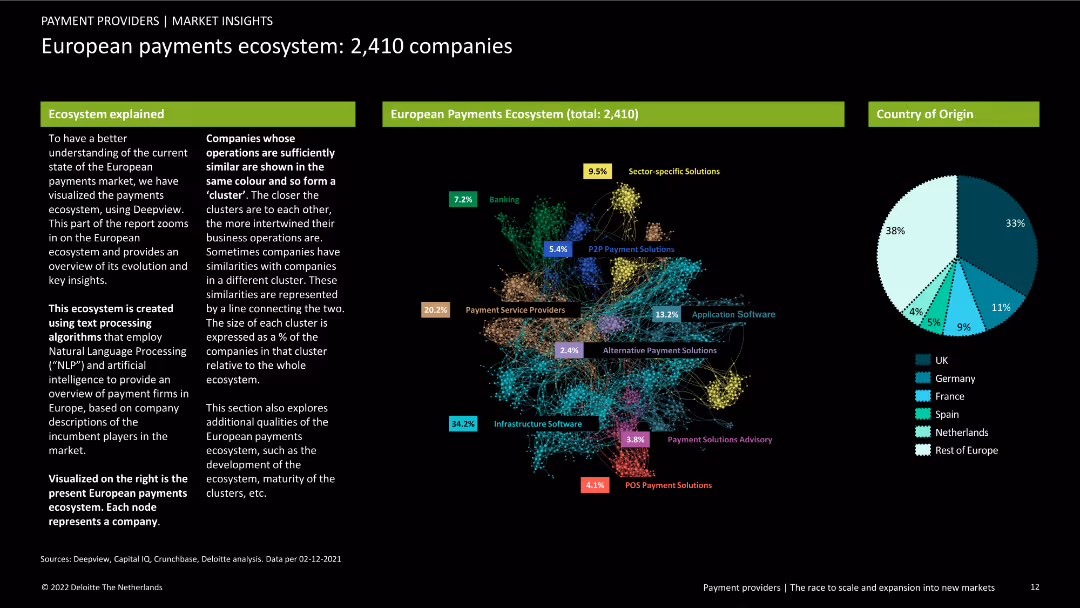
A dense slide with multiple colored clusters representing companies in the European payments ecosystem. Includes pie chart for country origin. Text explanations on left and right.
Market Analysis and Trends
Financial Services
Visualization of the European payments ecosystem showing company clusters by similarity and origin. Highlights industry structure using NLP and AI text processing.
European payments, ecosystem, companies, clustering, country origin, NLP, AI, market analysis, financial services, trends
false
Market Analysis and Trends
Financial Services financial-services
Mixed Chart
Deloitte
Previous
Loading...
Hold On!
We are searching in our database
If nothing, comes up, please try different filters!
Column Chart
Heatmap
Chevron
Org Chart
Infographic
Callouts
Timeline
List
Graphic
Picture
Process Flow
Diagram
Paragraph
Map
Table
Framework
Subtitle
Takeaway Box
Icon
Other Chart
Radar Chart
Waterfall Chart
Mekko Chart
Pie Chart
Scatter Plot
Line Chart
Bar chart
Bullet points
Create a FREE account to continue browsing
Receive Instant Access to 1,000+ slides from companies like McKinsey, Google, and Goldman Sachs
First Name
Last Name
Email
Password
I agree to all
Terms & Privacy Policy
Thank you! Your submission has been received!
Oops! Something went wrong while submitting the form.
Have an account?
Sign in
Upgrade to PRO to Save slides
Advanced Search and Filters
Access to 15,000+ slides
Access to Category Pages
Save/Bookmark Slides
PowerPoint Template Library
Pick a Plan
MONTHLY
$12/month
Billed every month, Cancel anytime.
YEARLY
$9/year
Billed $108 annually, Cancel anytime.
Checkout for $12/month
Checkout for $108/yr
Secured by Stripe | AES-256 bit encryption