My Account
My Slides
Search by Category
Templates
View All Templates
Download Template Slides
Leave Feedback
Login
Logout
Get Started
Browse all Slides
Browse all Slides
Create a FREE Account
Instant access to 1,000+ real slides from top companies like McKinsey, BCG, Goldman Sachs, Google and many more!
First Name
Last Name
Email
Password
I agree to all
Terms & Privacy Policy
Thank you! Your submission has been received!
Oops! Something went wrong while submitting the form.
Have an account?
Sign in
Spark Your Next Big Idea with New Presentation Templates
VIEW ALL Templates
Welcome,
Welcome
PRO
Show Featured Only
Checkbox 8
Companies
Mckinsey
Bain
BCG
EY
Deloitte
Accenture
PwC/Strategy&
JP Morgan
Goldman Sachs
Morgan Stanley
Citigroup
Deutsche Bank
Barclays
LEK
KPMG
Kearney
Oliver Wyman
Booz Allen Hamilton
Gartner
IPSOS
Nielsen
Slide type
Text Only
Linear Flow
Vertical Flow
Single Chart
Header Horizontal
Mixed Chart
Header Vertical
Pillar
Multiple Chart
Graphic
Agenda
Title
Table
Framework
Industry
Technology & Software
Artificial Intelligence
Financial Services
Retail & E-commerce
Consumer Goods
Industrial & Manufacturing
Transportation & Logistics
Telecommunications
Real Estate & Construction
Hospitality & Tourism
Professional Services
Education & Training
Media & Entertainment
Agriculture & Food Production
Healthcare & Pharmaceuticals
Environmental Services & Sustainability
Government & Public Sector
Use Case
Mergers and Acquisitions
Performance Metrics and KPIs
Client Case Studies
Competitive Landscape
Corporate Finance and Valuation
Product and Service Analysis
Customer and Market Segmentation
Organizational Structure and Change
Industry Overview
Regulatory and Compliance
Risk Assessment and Management
Investment Analysis
Organizational Structure and Change
Human Resources and Talent Management
Financial Performance
Market Analysis and Trends
Sales and Business Development
Human Resources and Talent Management
Clear all
Thank you! Your submission has been received!
Oops! Something went wrong while submitting the form.
Tag
View slide
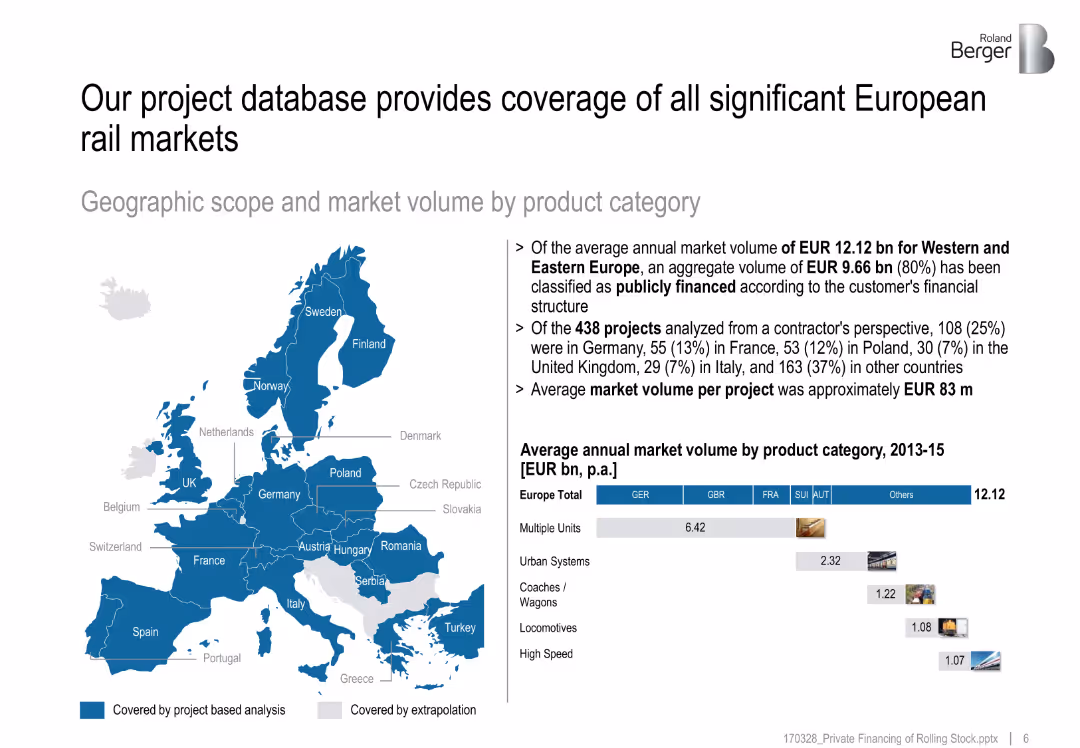
Map of Europe with market analysis coverage in blue; side panel with text insights
Market Analysis and Trends
Transportation & Logistics
Describes the geographic scope of rail project analysis in Europe, highlighting a market volume of EUR 12.12 bn and top countries by number of analyzed projects.
European rail market, project analysis, market volume, coverage map, public financing
false
Market Analysis and Trends
Transportation & Logistics transportation-and-logistics
Multiple Chart
Roland Berger
View slide
The slide features two column charts. The left chart shows European real estate transaction volumes in EUR billions from 1Q13 to 1Q24. The right chart breaks down transaction volumes by property type from 1Q07 to 4Q23.
Market Analysis and Trends
Real Estate & Construction
This slide provides an overview of European real estate transaction volumes over time and by property type, offering insights into the market's performance and investment distribution across different property sectors.
European real estate, transaction volumes, property types, market performance, investment trends
false
Market Analysis and Trends
Real Estate & Construction real-estate-and-construction
Multiple Chart
JP Morgan
View slide
Features a column chart comparing the economic impact of tourism in Europe's top countries versus the rest of Europe.
Financial Performance
Hospitality & Tourism
Provides a financial analysis of tourism's economic impact in Europe, focusing on the contribution of key countries.
European tourism, Economic impact, Financial analysis, Germany, Spain, UK, Italy, France
false
Financial Performance
Hospitality & Tourism hospitality-and-tourism
Multiple Chart
Bain
View slide
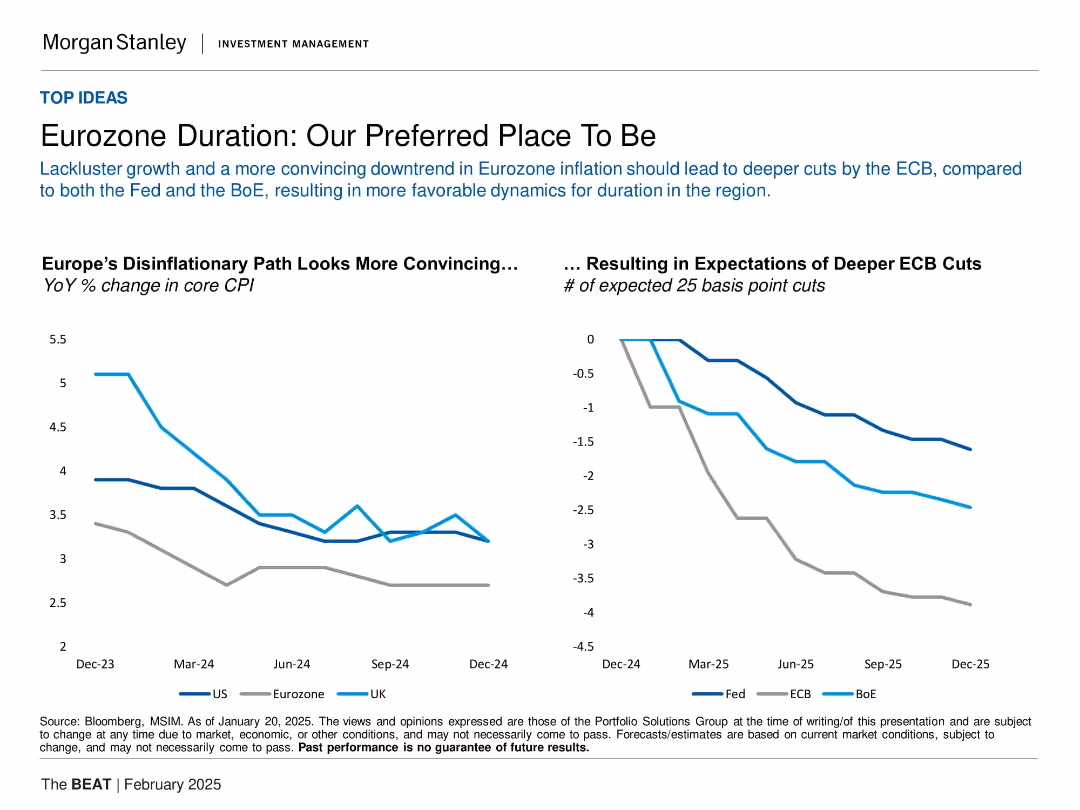
Two-line charts: Left shows YoY % change in core CPI (US, Eurozone, UK); right shows expected rate cuts (Fed, ECB, BoE) from Dec 2024–Dec 2025.
Investment Analysis
Financial Services
The slide argues that the Eurozone offers the most compelling case for bond duration investing in 2025 due to clearer disinflation trends. It compares inflation rates and interest rate expectations across major economies, showing the ECB is expected to make deeper cuts than the Fed or BoE. This sets the Eurozone apart as favorable for fixed-income strategies.
Eurozone, CPI, ECB, rate cuts, inflation, fixed income, duration strategy, disinflation, BoE, Fed
false
Investment Analysis
Financial Services financial-services
Multiple Chart
Morgan Stanley
View slide
This slide contains two graphical elements: a bar chart showing Eurozone GDP quarter growth and a line chart depicting the Eurocoin index. The design includes textual elements on a white background, with the charts situated centrally for focus.
Financial Performance
Financial Services
The slide provides a comparative analysis of Eurozone GDP growth and the Eurocoin index, highlighting economic performance by country. It's useful for discussions about economic policy or investment strategy in the region.
Eurozone, GDP Growth, Economic Performance, France, Spain, Germany, Italy, Comparative Analysis, Eurocoin Index
false
Financial Performance
Financial Services financial-services
Multiple Chart
McKinsey
View slide
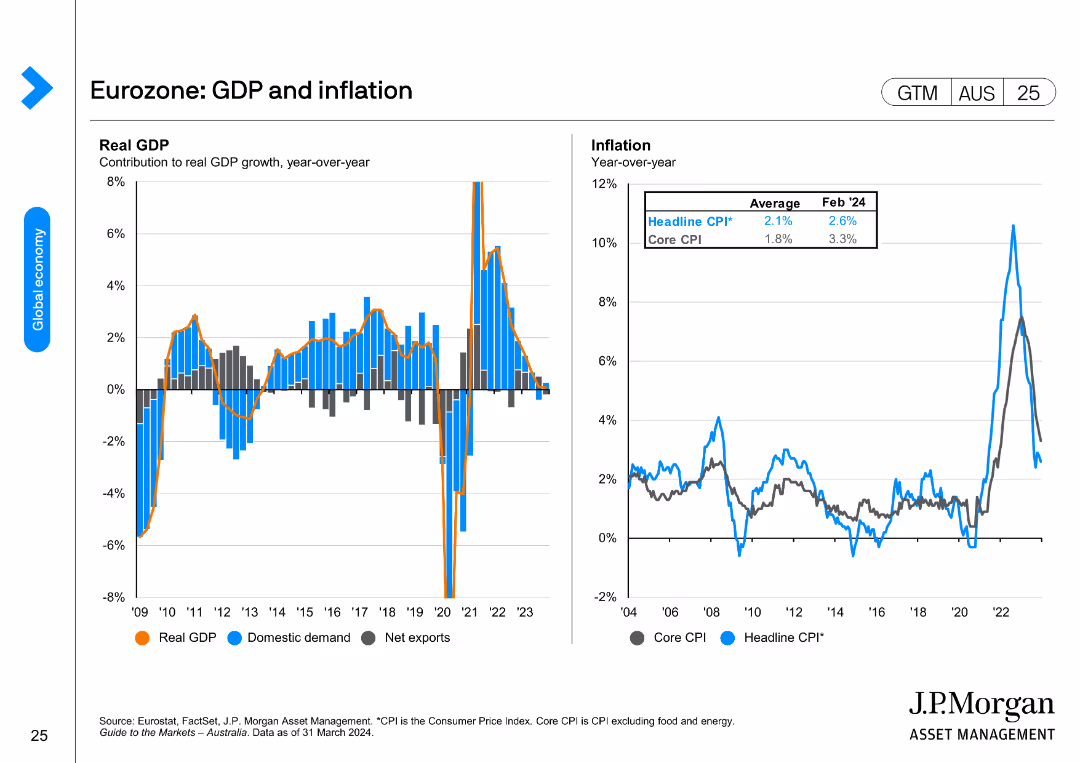
Two line charts showing year-over-year changes in Eurozone's real GDP and inflation rates, including headline and core CPI.
Market Analysis and Trends
Financial Services
The slide illustrates the Eurozone's GDP growth and inflation rates over the years, highlighting changes in domestic demand, net exports, and CPI.
Eurozone, GDP, inflation, headline CPI, core CPI, domestic demand
false
Market Analysis and Trends
Financial Services financial-services
Multiple Chart
JP Morgan
View slide
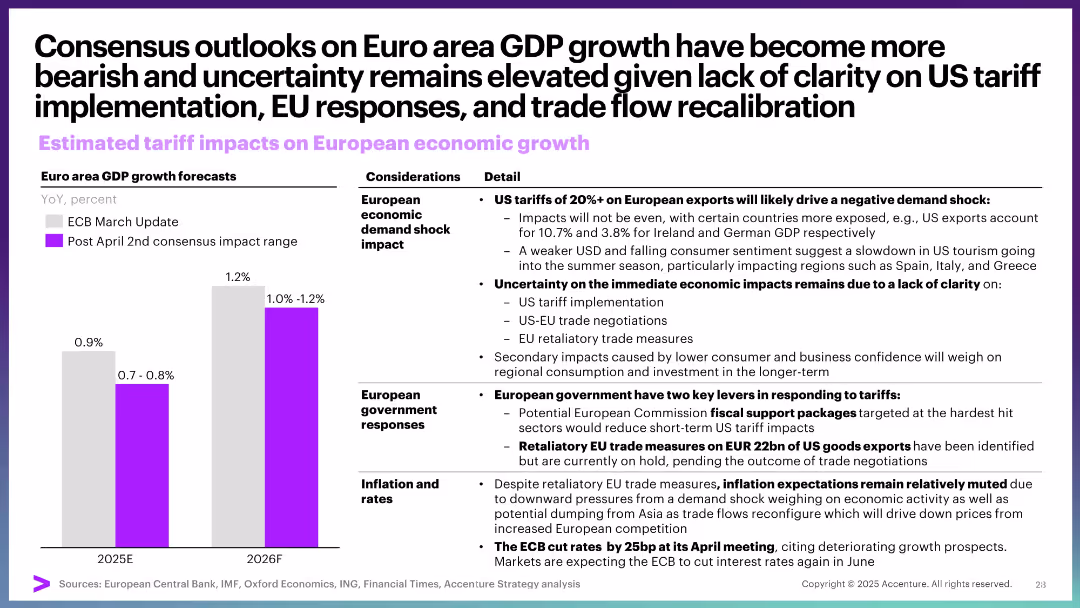
Bar chart for GDP forecasts; detailed text columns on economic shock, EU responses, and inflation. Structured layout.
Market Analysis and Trends
Government & Public Sector
This slide covers expected negative effects of US tariffs on EU economic growth, emphasizing demand shock, lack of clarity on implementation, and EU response options. Inflation expectations remain muted due to broader economic weakening.
Eurozone, GDP, tariffs, economic growth, inflation, trade negotiation, EU response
false
Market Analysis and Trends
Government & Public Sector government-and-public-sector
Mixed Chart
Accenture
View slide
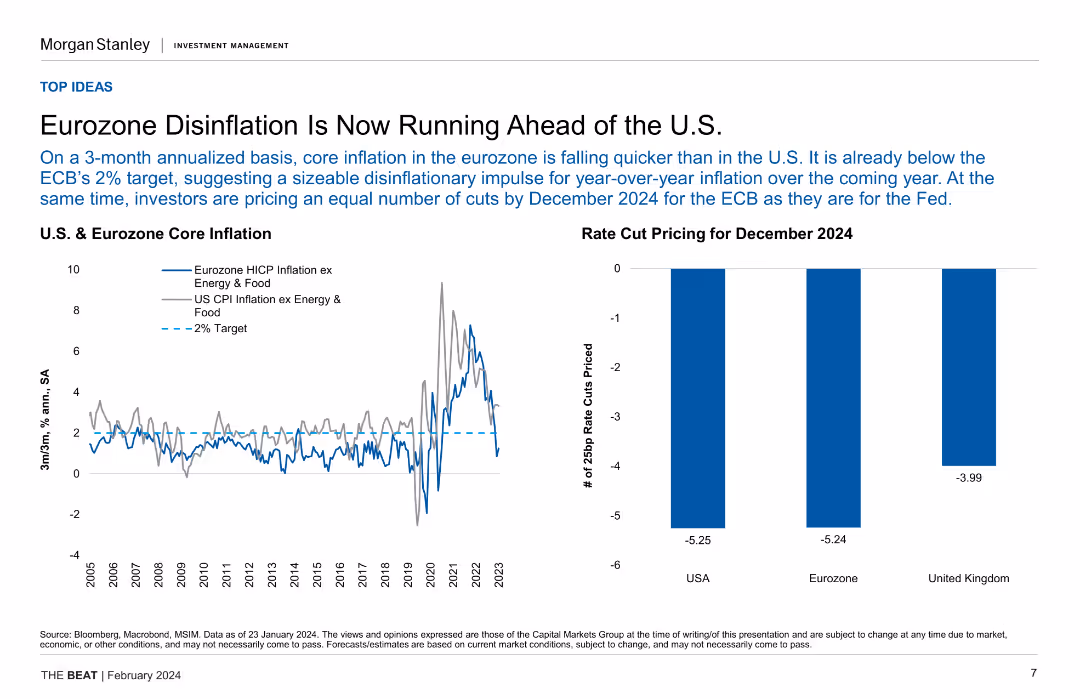
Line chart comparing U.S. and Eurozone core inflation rates, along with a column chart showing rate cut pricing for December 2024.
Market Analysis and Trends
Financial Services
The slide highlights the disinflation trend in the Eurozone compared to the U.S., projecting future rate cuts by the ECB and the Fed.
Eurozone, disinflation, core inflation, rate cut, economic trend
false
Market Analysis and Trends
Financial Services financial-services
Multiple Chart
Morgan Stanley
View slide
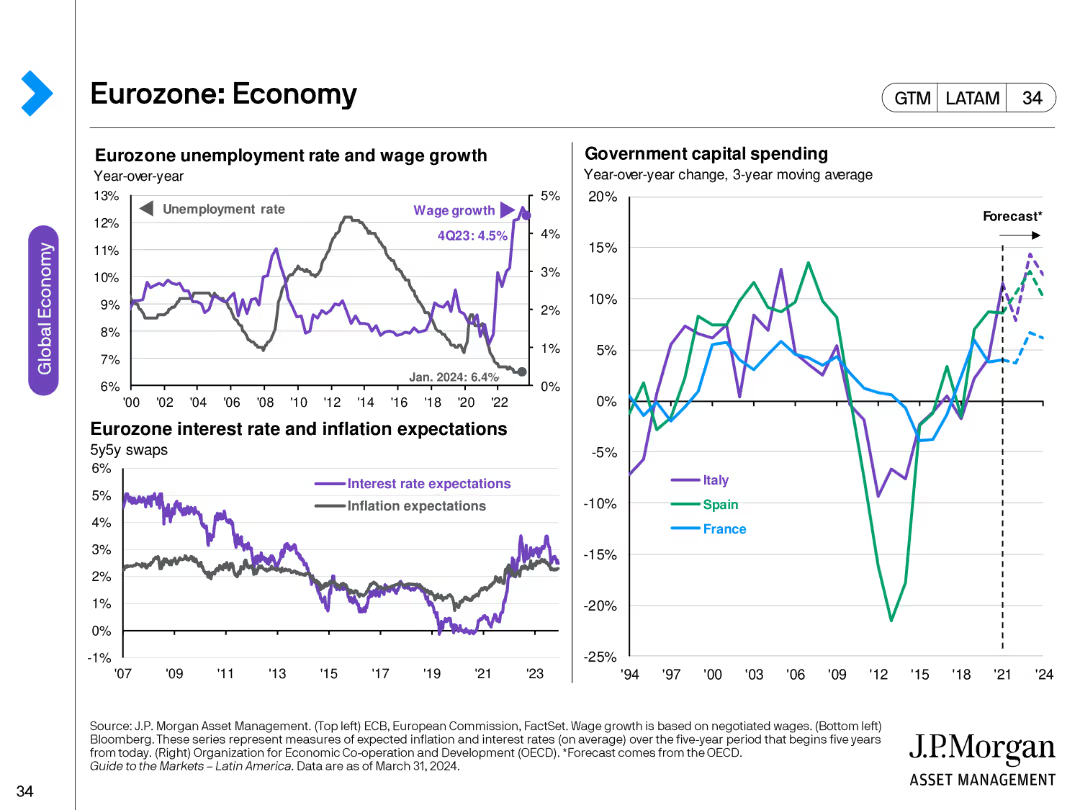
This slide includes multiple line charts showing Eurozone unemployment rate, wage growth, interest rate, and inflation expectations, along with a column chart displaying government capital spending for Italy, Spain, and France.
Market Analysis and Trends
Financial Services
The slide presents data on the Eurozone's economic indicators, including unemployment, wage growth, interest rates, and inflation expectations, alongside government capital spending trends, providing an economic overview.
Eurozone, economy, unemployment, wage growth, inflation, interest rates, government spending, Italy, Spain, France
false
Market Analysis and Trends
Financial Services financial-services
Multiple Chart
JP Morgan
View slide
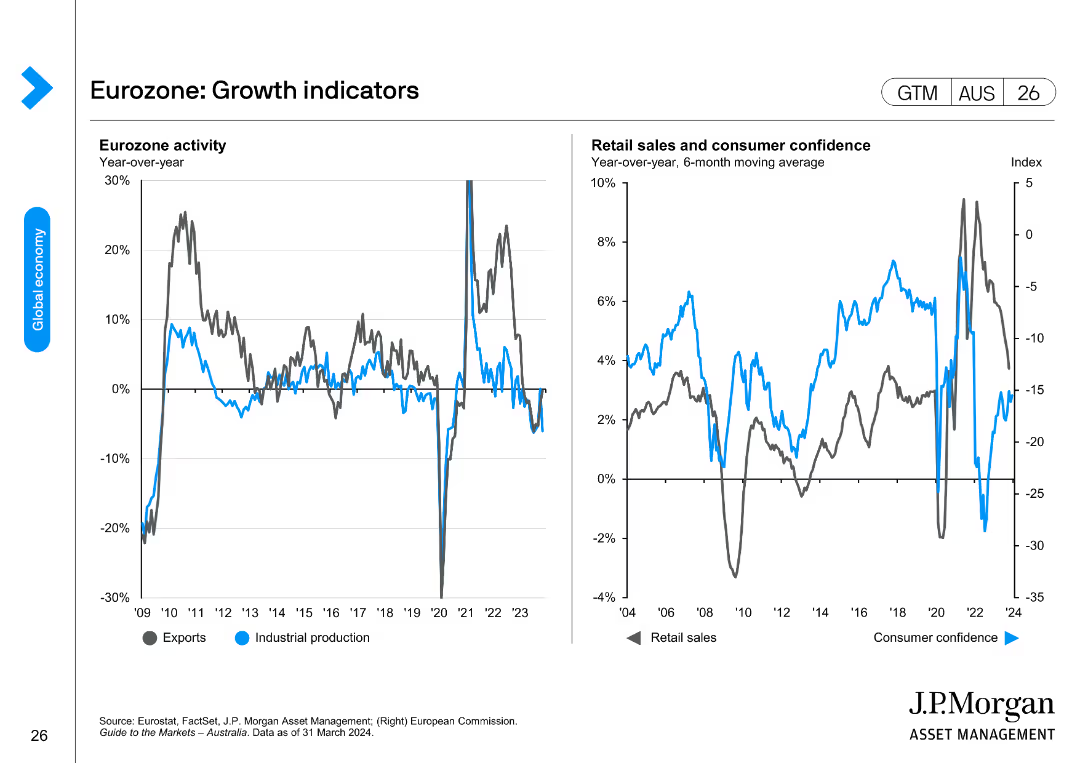
Two line charts depicting Eurozone activity through exports and industrial production, and retail sales and consumer confidence trends.
Market Analysis and Trends
Financial Services
This slide provides insights into the Eurozone's economic activity and growth indicators, focusing on exports, industrial production, retail sales, and consumer confidence.
Eurozone, growth indicators, exports, industrial production, retail sales, consumer confidence
false
Market Analysis and Trends
Financial Services financial-services
Multiple Chart
JP Morgan
View slide
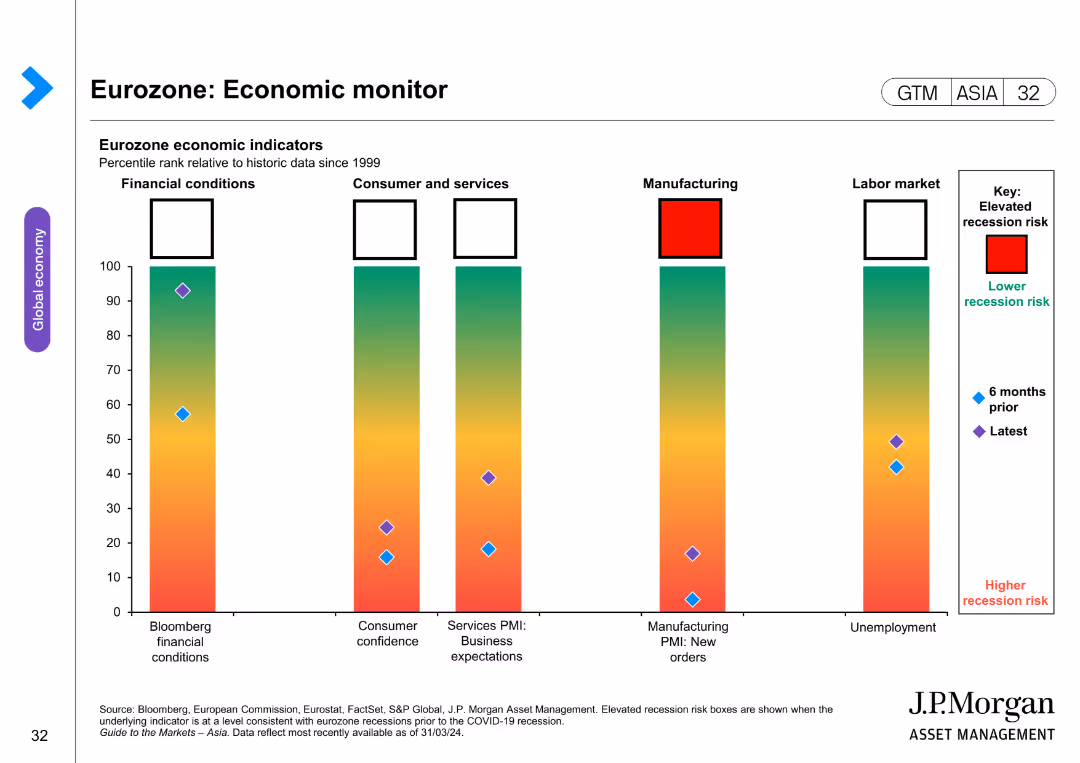
The slide includes a bar chart with color-coded bars indicating recession risks for various Eurozone economic indicators. The layout is detailed and moderately complex.
Risk Assessment and Management
Financial Services
The slide presents the risk levels of potential recession in the Eurozone using various economic indicators, comparing current data with historical trends.
Eurozone, recession risk, economic indicators, risk levels, economic stability
false
Risk Assessment and Management
Financial Services financial-services
Single Chart
JP Morgan
View slide
Evaluation of funding models under different assumptions
Strategic Planning
Telecommunications
Presents bar graphs with detailed cost analyses for different funding models under varying assumptions. The visual representation uses different colors to denote various types of costs, making it easy to understand at a glance which factors are the most significant in each model.
Evaluates the potential for school connectivity in Kalimantan, Sulawesi, Nusa Tenggara, and Papua under different financial assumptions, focusing on the sustainability and impact of various funding models.
false
Strategic Planning
Telecommunications telecommunications
Multiple Chart
BCG
View slide
Hype Cycle chart focusing on Event-Driven APIs, with annotations about their current status in the market, highlighting technologies like AsyncAPI and Webhooks, and their growing importance.
Technology and Digital Transformation
Technology & Software
The slide details the market position and importance of Event-Driven APIs, supported by technologies like AsyncAPI, webhooks, and WebSocket, noting the necessity to manage both request-response and event-driven APIs.
Event-Driven APIs, AsyncAPI, Webhooks, market position
false
Technology and Digital Transformation
Technology & Software technology-and-software
Mixed Chart
Gartner
View slide
Simplistic layout with a text box listing organizational aspects on the left and attributes on the right, with converging lines leading to the text.
Strategic Planning
Professional Services
Depicts the company's foundational aspects and their evolution into future strategic attributes. Ideal for discussing company growth or cultural shifts.
Evolution, Company Culture, Strategy, Organizational Growth, Transparency, Core Values
false
Strategic Planning
Professional Services professional-services
Text Only
Goldman Sachs
View slide
Horizontal timeline showing four key phases of Morgan Stanley's evolution from 2009 with corresponding milestones and strategies.
Strategic Planning
Financial Services
Chronicles Morgan Stanley's evolution through four strategic phases, from building scale to deepening client relationships.
Evolution, Morgan Stanley, strategic phases, building scale, technology, channel expansion, client relationships
false
Strategic Planning
Financial Services financial-services
Linear Flow
Goldman Sachs
View slide
This slide provides a timeline from the 1980s to the 2010s, detailing the evolution of services with a blue and white color scheme.
Organizational Structure and Change
Financial Services
This slide could be used to depict the growth and diversification of a company's services over decades, emphasizing its established presence in the industry.
Evolution, Services, Growth, Diversification, Decades, Fixed Income, Equity, Advisory, ESG, Real Estate Credit
false
Organizational Structure and Change
Financial Services financial-services
Linear Flow
Goldman Sachs
View slide
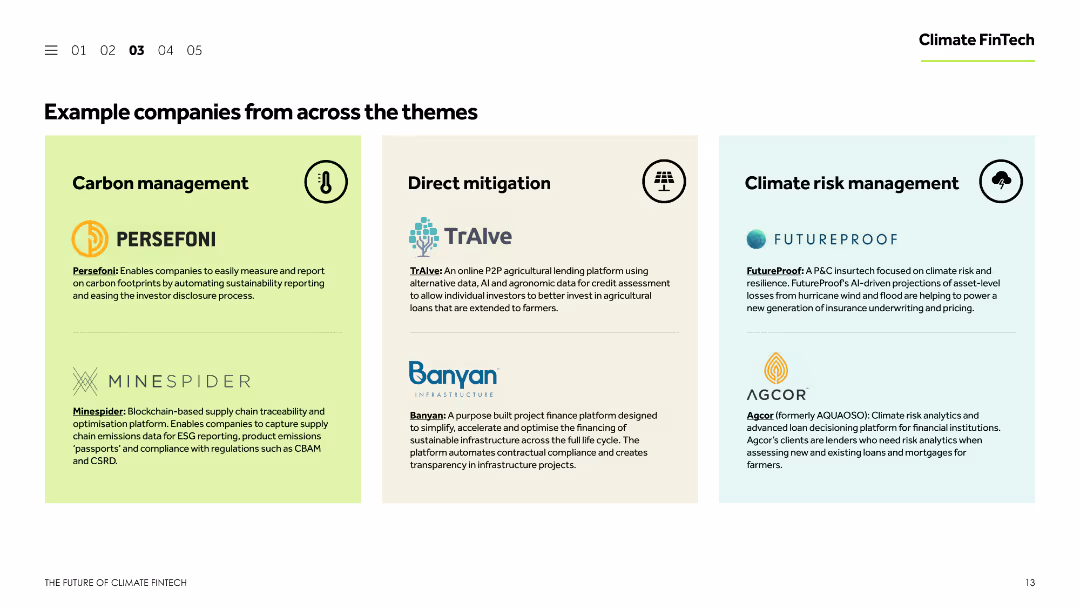
The slide presents three columns, each listing example companies under different themes: carbon management, direct mitigation, and climate risk management. Each column contains company names, logos, and brief descriptions of their activities.
Technology and Digital Transformation
Financial Services
The slide showcases example companies within the Climate FinTech sector, categorized by themes: carbon management, direct mitigation, and climate risk management. It includes brief descriptions of the companies' activities and their contributions to these themes.
Example companies, Climate FinTech, carbon management, direct mitigation, climate risk management
false
Technology and Digital Transformation
Financial Services financial-services
Pillar
Barclays
View slide
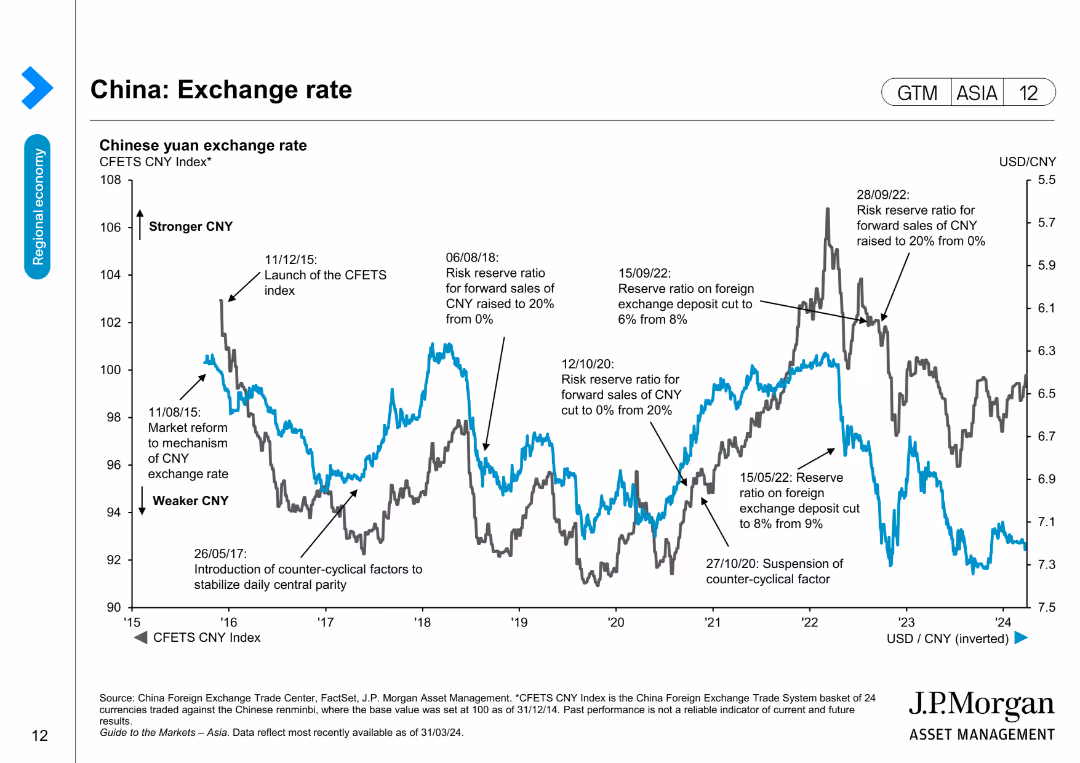
Displays a line chart depicting the Chinese yuan exchange rate with historical data and significant economic events affecting the rate.
Market Analysis and Trends
Financial Services
Provides an overview of the Chinese yuan exchange rate against a basket of currencies, useful for analyzing currency trends and economic impacts.
Exchange rate, Yuan, China, Currency trends, Economic events, Financial analysis, Market trends, FX
false
Market Analysis and Trends
Financial Services financial-services
Single Chart
JP Morgan
View slide
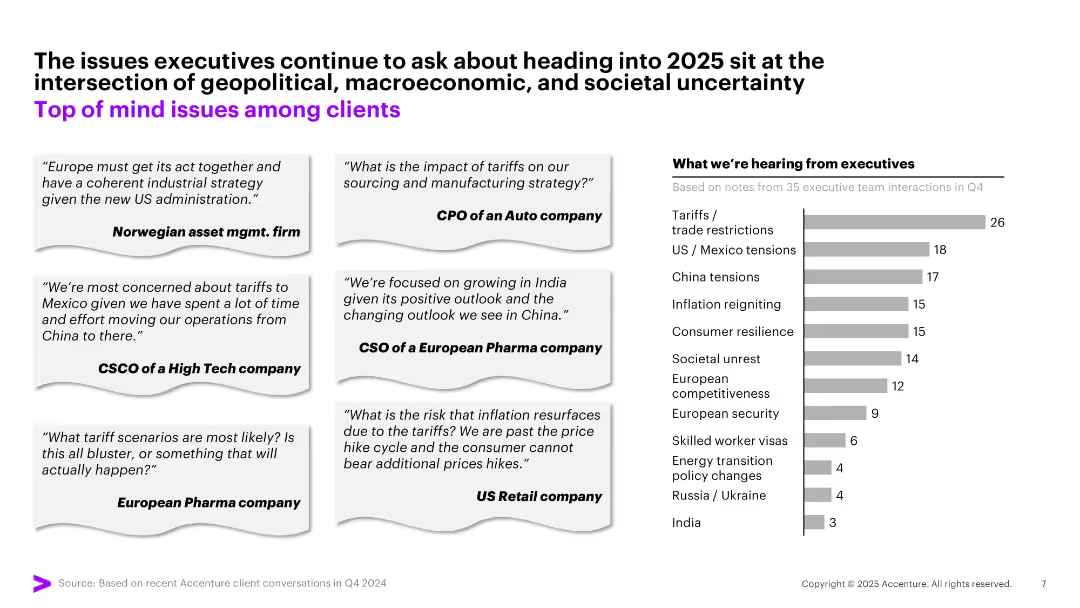
Combination of executive quote boxes (left) and a horizontal bar chart (right) with monochrome tones and minimal visuals; layout is clean and business-formal.
Market Analysis and Trends
Professional Services
The slide compiles direct executive quotes reflecting concerns about tariffs, inflation, and geopolitical shifts going into 2025. A chart ranks the top issues by frequency, led by tariffs/trade restrictions, followed by US/Mexico tensions and China-related concerns.
Executive Insights, Trade, Inflation, Tariffs, US/Mexico, China, Uncertainty, Business Risks, 2025, Priorities
false
Market Analysis and Trends
Professional Services professional-services
Mixed Chart
Accenture
View slide
This slide has a red and black color scheme with a two-column layout. The left side contains a block of text with a bold title "Executive Summary," and the right side features a column chart titled "Family law final order by finalisation type, ('000) 2016-17" with data provided by FCC.
Operational Efficiency
Government & Public Sector
The slide presents a comparison between operational practices in case allocation and management within courts, highlighting differences and statistics regarding family law final orders.
Executive, Summary, Operational Practices, Courts, Comparison, Family Law, Final Orders, Statistics, FCC, Management
false
Operational Efficiency
Government & Public Sector government-and-public-sector
Mixed Chart
PwC/Strategy&
View slide
A timeline representation for various international markets with signed exit status, and a two-column summary of exit markets contribution to P&L and balance sheet.
Strategic Planning
Financial Services
Displays the timelines for exiting specific international markets and their financial impact, aiding in strategic decision-making and financial planning.
Exit Markets, Timelines, Financial Impact, P&L, Balance Sheet, Strategic Planning, International Markets, Financial Planning
false
Strategic Planning
Financial Services financial-services
Table
Citigroup
View slide
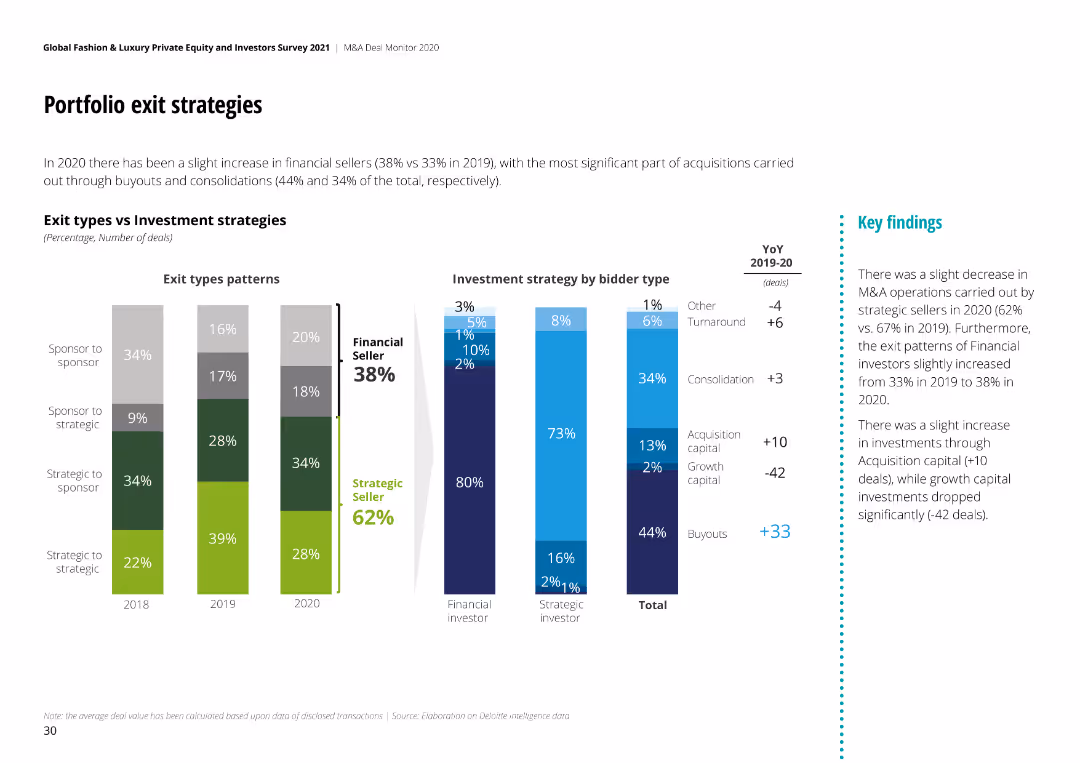
The slide includes bar charts comparing exit types and investment strategies by bidder type, with changes from 2019-2020.
Investment Analysis
Consumer Goods
It analyzes exit strategies and investment patterns, showing the distribution of different exit types and strategies in M&A deals.
Exit Strategies, Investment, Bidder Type, M&A, 2020
false
Investment Analysis
Consumer Goods consumer-goods
Multiple Chart
Deloitte
View slide
Contains a timeline, column chart, and tables outlining market exit strategies and financial impacts.
Strategic Planning
Financial Services
Outlines the planned and completed exits from certain markets by a financial institution, along with the financial contribution to the company's P&L.
Exit Strategy, Timeline, Market, Financial Impact, Strategic Planning, Bar Graph
false
Strategic Planning
Financial Services financial-services
Table
Citigroup
View slide
Two primary visual elements: a column chart showing U.S. venture-backed exits by type for different quarters, and a pie chart depicting companies' long-term goals. The layout includes headers and an implications section.
Market Analysis and Trends
Financial Services
The slide juxtaposes venture-backed exit strategies against actual market realities, with implications suggesting that the uncertain macroeconomic environment makes timing for exits critical.
Exit Strategy, Venture-Backed, IPO, M&A, SPAC
false
Market Analysis and Trends
Financial Services financial-services
Multiple Chart
JP Morgan
View slide
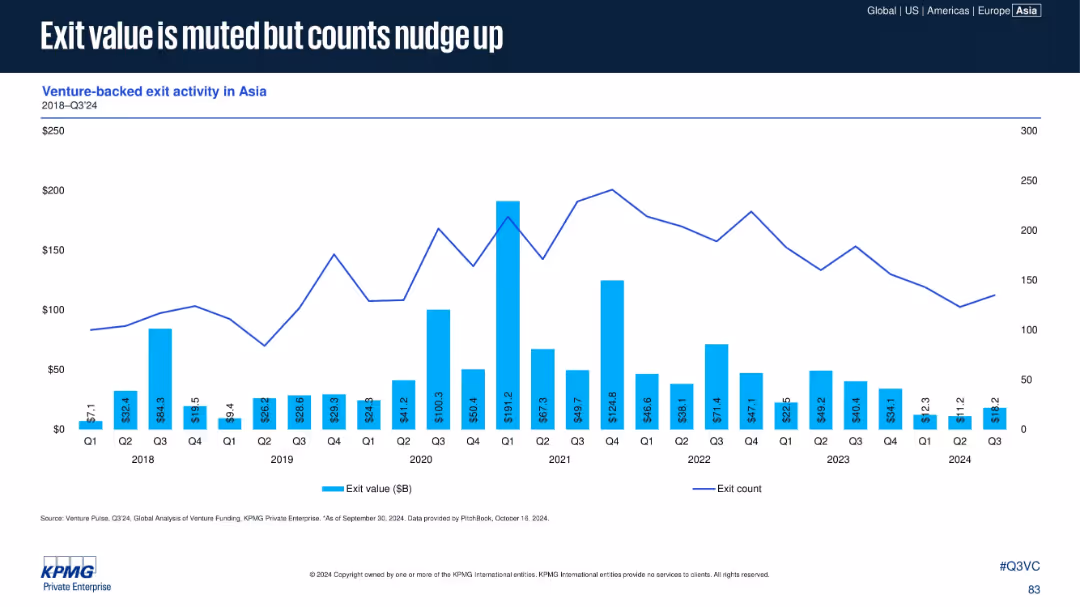
Bar chart with exit value ($B) and line for exit count from 2018–Q3 2024. Bright blue bars and navy line over white background.
Investment Analysis
Financial Services
Details trends in exit activity for VC-backed companies in Asia. While total exit values have declined, the number of exits is slightly increasing—indicating more activity despite reduced returns, likely reflecting lower valuations.
Exit Value, Asia, Venture-backed, Exits, VC Returns, Exit Count, 2024 Q3
false
Investment Analysis
Financial Services financial-services
Single Chart
KPMG
View slide
This slide features a mix of bar charts and column charts. The left side shows horizontal bar charts for top sectors by value and volume, while the right side shows vertical bar charts for deal types.
Market Analysis and Trends
Financial Services
The slide provides an overview of exits in February 2023, highlighting the total value and volume of deals across various sectors and types of transactions. It aims to inform on market activity and trends within the financial services industry.
Exits, Deals, February 2023, Sectors, Value, Volume, Charts
false
Market Analysis and Trends
Financial Services financial-services
Multiple Chart
EY
View slide
Features a U.S. map highlighting expansion and legacy states, alongside a column chart showing revenue growth in expansion markets.
Strategic Planning
Financial Services
Details JPMorgan’s expansion strategy in Middle Market Banking, highlighting the increase in clientele and revenue in new markets, thus providing a geographical and financial overview of market penetration.
Expansion, Revenue Growth, Banking, Market Analysis, Clientele Increase, Geographical Data
false
Strategic Planning
Financial Services financial-services
Mixed Chart
JP Morgan
View slide
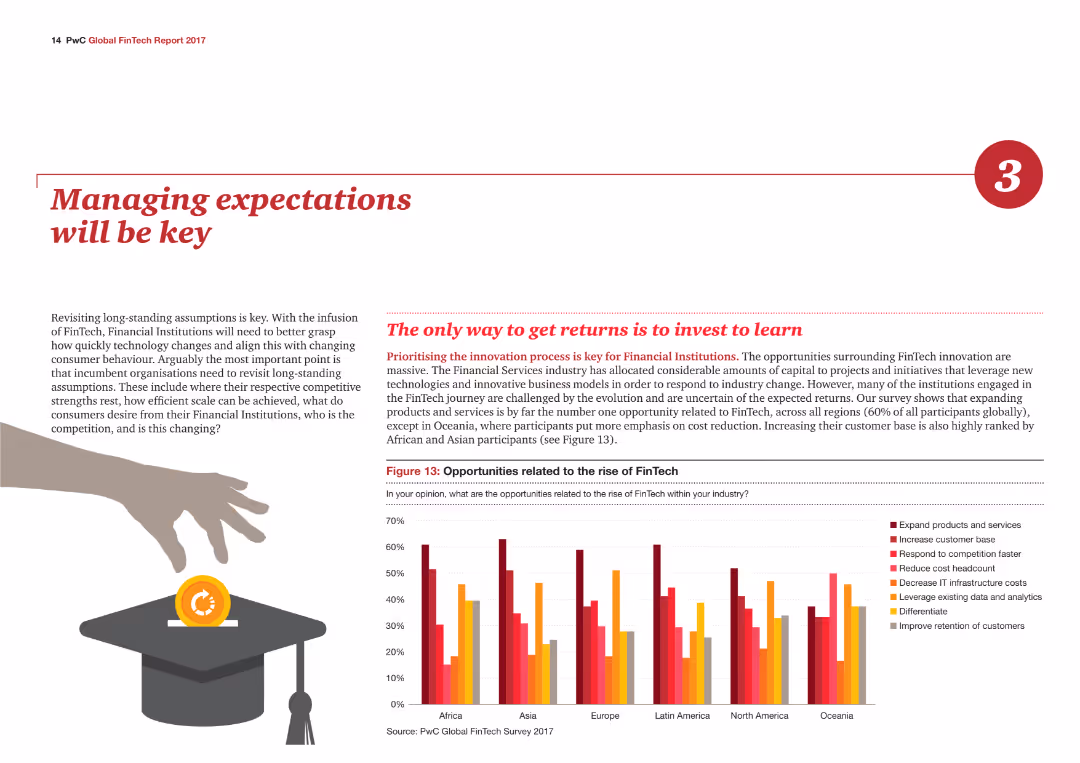
The slide contains a column chart illustrating opportunities related to the rise of FinTech by region, with different colors representing various opportunities such as expanding products.
Strategic Planning
Financial Services
The slide emphasizes the importance of managing expectations in the financial services industry, highlighting key opportunities related to FinTech across different regions.
Expectations, FinTech, Opportunities, Regions, Strategic
false
Strategic Planning
Financial Services financial-services
Mixed Chart
PwC/Strategy&
View slide
Depicts execution rates of expenditure over three fiscal years using vertical thermometers, showing percentages to illustrate fiscal discipline or lack thereof.
Financial Performance
Government & Public Sector
Evaluates the effectiveness of Namibia's government expenditure over three fiscal years, highlighting trends in budget utilization and fiscal management. Useful for assessing government efficiency and fiscal health.
Expenditure, Budget, Fiscal, Efficiency
false
Financial Performance
Government & Public Sector government-and-public-sector
Single Chart
PwC/Strategy&
View slide
Features a pie chart detailing various segments of national expenditure such as personnel costs, goods and services, and interest payments.
Financial Performance
Government & Public Sector
Breaks down Namibia's government expenditure for 2018/19 into major categories, providing a fiscal snapshot useful for financial analysis and planning. The slide helps in understanding how public funds are distributed across different governmental activities.
Expenditure, Budget, Personnel, Services
false
Financial Performance
Government & Public Sector government-and-public-sector
Single Chart
PwC/Strategy&
Previous
Loading...
Hold On!
We are searching in our database
If nothing, comes up, please try different filters!
Column Chart
Heatmap
Chevron
Org Chart
Infographic
Callouts
Timeline
List
Graphic
Picture
Process Flow
Diagram
Paragraph
Map
Table
Framework
Subtitle
Takeaway Box
Icon
Other Chart
Radar Chart
Waterfall Chart
Mekko Chart
Pie Chart
Scatter Plot
Line Chart
Bar chart
Bullet points
Create a FREE account to continue browsing
Receive Instant Access to 1,000+ slides from companies like McKinsey, Google, and Goldman Sachs
First Name
Last Name
Email
Password
I agree to all
Terms & Privacy Policy
Thank you! Your submission has been received!
Oops! Something went wrong while submitting the form.
Have an account?
Sign in
Upgrade to PRO to Save slides
Advanced Search and Filters
Access to 15,000+ slides
Access to Category Pages
Save/Bookmark Slides
PowerPoint Template Library
Pick a Plan
MONTHLY
$12/month
Billed every month, Cancel anytime.
YEARLY
$9/year
Billed $108 annually, Cancel anytime.
Checkout for $12/month
Checkout for $108/yr
Secured by Stripe | AES-256 bit encryption