My Account
My Slides
Search by Category
Templates
View All Templates
Download Template Slides
Leave Feedback
Login
Logout
Get Started
Browse all Slides
Browse all Slides
Create a FREE Account
Instant access to 1,000+ real slides from top companies like McKinsey, BCG, Goldman Sachs, Google and many more!
First Name
Last Name
Email
Password
I agree to all
Terms & Privacy Policy
Thank you! Your submission has been received!
Oops! Something went wrong while submitting the form.
Have an account?
Sign in
Spark Your Next Big Idea with New Presentation Templates
VIEW ALL Templates
Welcome,
Welcome
PRO
Show Featured Only
Checkbox 8
Companies
Mckinsey
Bain
BCG
EY
Deloitte
Accenture
PwC/Strategy&
JP Morgan
Goldman Sachs
Morgan Stanley
Citigroup
Deutsche Bank
Barclays
LEK
KPMG
Kearney
Oliver Wyman
Booz Allen Hamilton
Gartner
IPSOS
Nielsen
Slide type
Text Only
Linear Flow
Vertical Flow
Single Chart
Header Horizontal
Mixed Chart
Header Vertical
Pillar
Multiple Chart
Graphic
Agenda
Title
Table
Framework
Industry
Technology & Software
Artificial Intelligence
Financial Services
Retail & E-commerce
Consumer Goods
Industrial & Manufacturing
Transportation & Logistics
Telecommunications
Real Estate & Construction
Hospitality & Tourism
Professional Services
Education & Training
Media & Entertainment
Agriculture & Food Production
Healthcare & Pharmaceuticals
Environmental Services & Sustainability
Government & Public Sector
Use Case
Mergers and Acquisitions
Performance Metrics and KPIs
Client Case Studies
Competitive Landscape
Corporate Finance and Valuation
Product and Service Analysis
Customer and Market Segmentation
Organizational Structure and Change
Industry Overview
Regulatory and Compliance
Risk Assessment and Management
Investment Analysis
Organizational Structure and Change
Human Resources and Talent Management
Financial Performance
Market Analysis and Trends
Sales and Business Development
Human Resources and Talent Management
Clear all
Thank you! Your submission has been received!
Oops! Something went wrong while submitting the form.
Tag
View slide
This slide displays a dot plot chart tracking expenditure execution rates over three fiscal years, each marked with a percentage.
Regulatory and Compliance
Government & Public Sector
Evaluates the efficiency of expenditure management in the government by showing the execution rates of allocated budgets.
Expenditure, execution rates, fiscal years, government spending
false
Regulatory and Compliance
Government & Public Sector government-and-public-sector
Single Chart
PwC/Strategy&
View slide
Two column charts depict volatility comparisons, complemented by a bullet-point list of expense management strategies.
Risk Assessment and Management
Financial Services
Analyzes how dynamic expense management can stabilize earnings, aimed at financial risk management or operational planning sessions.
Expense Management, Earnings Stability, Volatility, Risk Management, Operational Planning
false
Risk Assessment and Management
Financial Services financial-services
Multiple Chart
Goldman Sachs
View slide
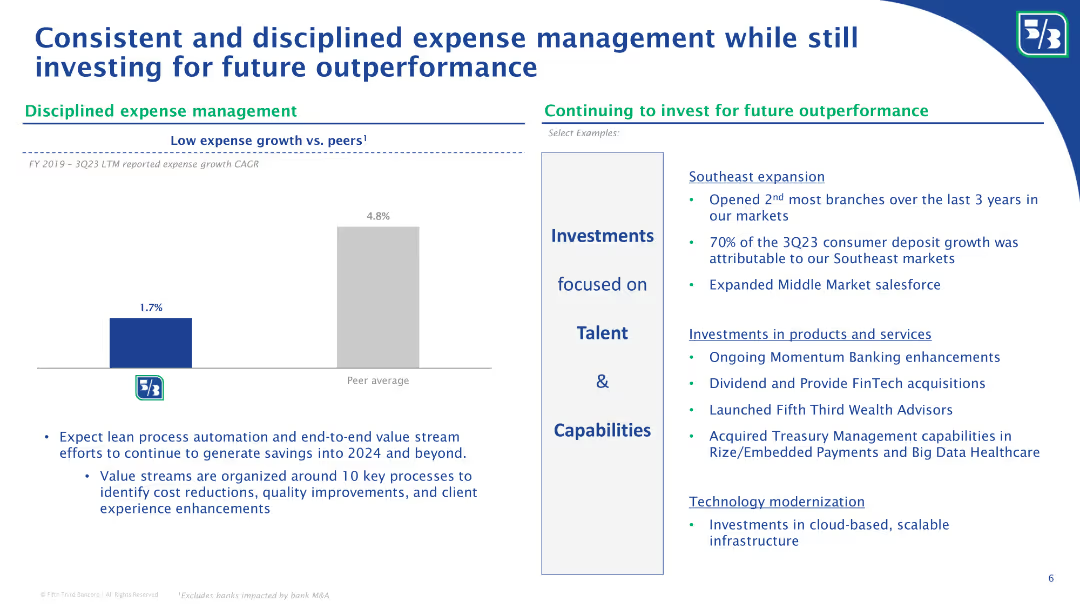
The slide features a comparative column chart depicting expense growth, a sidebar with key strategic points, and a blue background. The column chart contrasts the company's low expense growth against the peer average, using shades of blue to differentiate the data. The sidebar uses icons and bullet points to concisely present information.
Operational Efficiency
Financial Services
This slide outlines Fifth Third's expense management strategy, emphasizing its disciplined approach relative to peers. It also details investments focused on talent and capabilities, alongside technology modernization efforts. The data and content suggest its use in financial and operational strategy discussions, highlighting cost management while investing for future growth.
Expense Management, Investment, Future Growth, Comparative Analysis, Strategy, Financial Services, Technology Modernization, Talent Development
false
Operational Efficiency
Financial Services financial-services
Mixed Chart
Goldman Sachs
View slide
A column chart shows predicted expenses for 2023 with additional annotations on integration costs and considerations from FDIC. The layout is straightforward with clear divisions between sections.
Financial Performance
Financial Services
The slide outlines JPMorgan Chase's expense projections for 2023, excluding costs related to First Republic. It includes a detailed analysis of various business units and factors that might impact these expenses, like FDIC assessments and labor inflation.
Expense Outlook, FDIC, First Republic, Financial Analysis, JPMorgan Chase
false
Financial Performance
Financial Services financial-services
Mixed Chart
JP Morgan
View slide
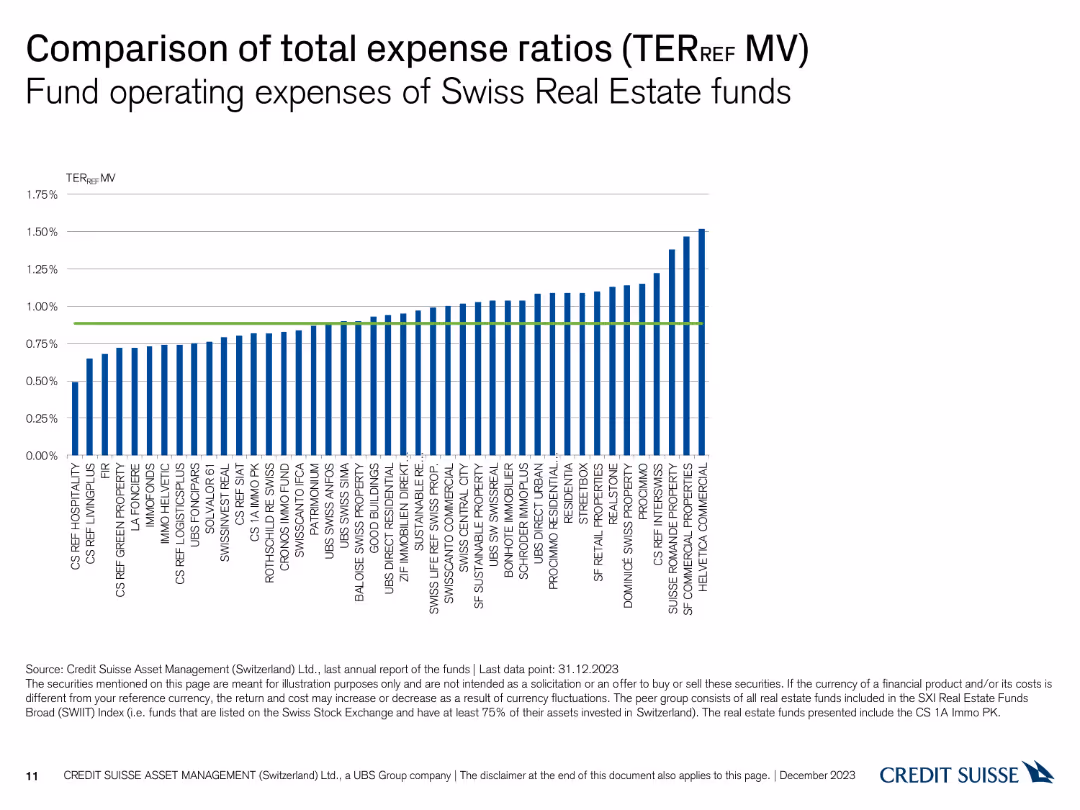
A column chart comparing the total expense ratios (TER) of various Swiss real estate funds based on market value, with a reference line for average TER.
Financial Performance
Financial Services
This slide compares the total expense ratios (TER) of Swiss real estate funds, adjusted for market value, showcasing the operational cost differences between funds.
Expense Ratios, TER, Market Value, Real Estate Funds, Cost Comparison
false
Financial Performance
Financial Services financial-services
Single Chart
Credit Suisse
View slide
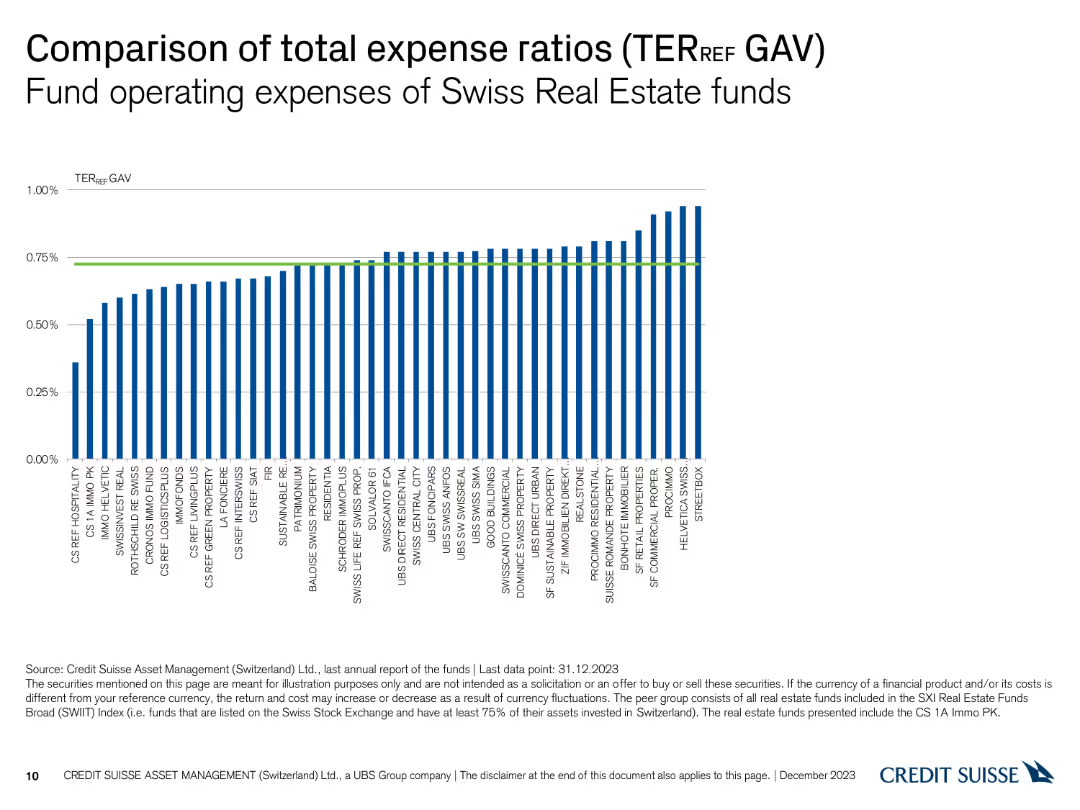
A column chart comparing the total expense ratios (TER) of various Swiss real estate funds, with a reference line for average TER.
Financial Performance
Financial Services
This slide provides a comparison of the total expense ratios (TER) for Swiss real estate funds, indicating the relative operating expenses of each fund.
Expense Ratios, TER, Real Estate Funds, Comparison, Operating Expenses
false
Financial Performance
Financial Services financial-services
Single Chart
Credit Suisse
View slide
Title at the top, a three-part diagram describing expense savings strategies with bullet points in each part. Dark blue and light blue color scheme.
Operational Efficiency
Financial Services
The slide focuses on the financial impact of streamlining the organization, investing in automation, and integrated expense management to achieve significant expense savings over three years.
Expense Savings, Automation, Streamlining, Investment, Strategy
false
Operational Efficiency
Financial Services financial-services
Linear Flow
Goldman Sachs
View slide
Features column chart with efficiency ratios and a strategic plan outline with arrows and bullet points detailing expense management.
Operational Efficiency
Financial Services
Showcases a plan for expense savings to enable growth funding, likely used for operational strategy meetings or financial planning discussions.
Expense Savings, Efficiency, Growth Funding, Operational Strategy, Financial Planning
false
Operational Efficiency
Financial Services financial-services
Mixed Chart
Goldman Sachs
View slide
The slide includes a column chart depicting expense trends from 2021 to 2023, with text explaining transformation investments, business-led investments, volume-related, and structural expenses.
Financial Performance
Financial Services
The slide outlines Citi's expense trends, detailing areas of investment and expense growth, aligned with strategic goals and operational efficiency improvements.
Expense Trend, Citi, Financial Performance, 2021-2023, Investment Areas, Column Chart, Strategic Goals, Operational Efficiency
false
Financial Performance
Financial Services financial-services
Mixed Chart
Citigroup
View slide
It has a split layout with a column chart on the left and bullet points on the right. The graph uses shades of blue and green, with a dotted line indicating future projections.
Financial Performance
Financial Services
The slide predicts the firm's payment expenses over the medium term and outlines the contributing factors to the anticipated expense growth.
Expense growth, forecast, firmwide payments, projections, wage inflation, productivity, investments
false
Financial Performance
Financial Services financial-services
Mixed Chart
JP Morgan
View slide
The slide includes a bar chart showing expense growth vs. peers and bullet points on the right detailing investments in talent and capabilities, with specific examples of expansions and technological modernization.
Operational Efficiency
Financial Services
The slide discusses Fifth Third Bank’s disciplined expense management, comparing their expense growth to peers and detailing ongoing investments in talent, capabilities, and technology. It highlights key areas of expansion and modernization aimed at sustaining future outperformance.
Expense management, operational efficiency, investments, talent, capabilities, technological modernization, expense growth, peer comparison, Fifth Third Bank
false
Operational Efficiency
Financial Services financial-services
Mixed Chart
Goldman Sachs
View slide
The slide features a column chart of full-year expense trend and detailed points for 2024 expense drivers.
Strategic Planning
Financial Services
This slide presents an expense outlook for 2024, highlighting the expected expense trends and the key drivers behind these projections.
Expense, Outlook, 2024, Drivers, Strategic, Planning, Financial, Trends, Forecast, Analysis
false
Strategic Planning
Financial Services financial-services
Mixed Chart
Citigroup
View slide
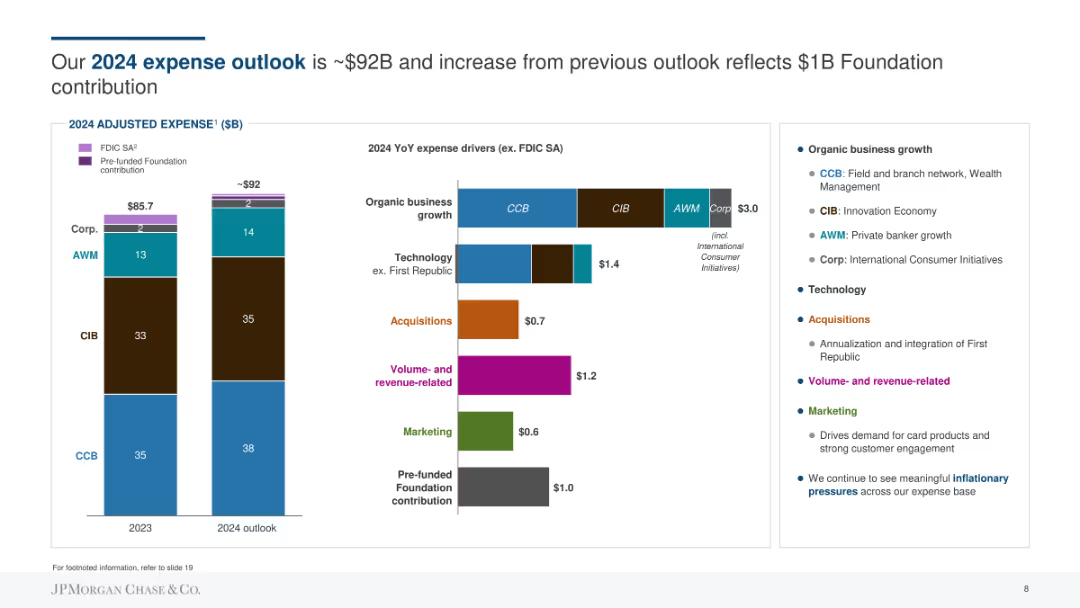
Column chart showing 2023 vs 2024 expense outlook in billions of dollars with various categories like CCB, CIB, AWM, and Corp. Contains colored segments to indicate different contributions such as FDIC SA and pre-funded Foundation contributions. Text on the right explains organic business growth and expense drivers.
Financial Performance
Financial Services
Highlights the expected 2024 expense outlook of ~$92B, an increase from the previous outlook due to a $1B Foundation contribution. The slide explains expense drivers, including organic business growth, technology, acquisitions, and marketing.
Expense, Outlook, Foundation, Technology, Growth, Acquisitions, Marketing, Financial
false
Financial Performance
Financial Services financial-services
Multiple Chart
JP Morgan
View slide
This slide visually compares expenses between 2022 and 2023 using column charts, with additional details on drivers of expenses and the impact of divestitures. The design is straightforward, focusing on clarity and comparison.
Operational Efficiency
Financial Services
A detailed comparison and analysis of expected expenses, this slide is used to inform on financial planning, cost management, and operational budgeting. It highlights the influence of market factors on expense trends and is likely used in management meetings, financial reviews, and planning sessions to optimize cost-efficiency.
Expenses Comparison, Cost Management, Financial Planning, Divestiture Impact
false
Operational Efficiency
Financial Services financial-services
Mixed Chart
Citigroup
View slide
This slide has the same layout as slide 3612, offering a comparative view of expenses with updated quarterly data. It features a table, a column chart on efficiency ratio, and annotations in blue tones.
Operational Efficiency
Financial Services
Offers an updated comparison of company expenses across different sectors, focusing on changes and the efficiency ratio, critical for stakeholders monitoring operational costs and efficiency.
Expenses Tracking, Efficiency, Cost Management
false
Operational Efficiency
Financial Services financial-services
Mixed Chart
Goldman Sachs
View slide
This slide is text-heavy with several bullet points, accompanied by column charts and a table. It utilizes a blue and gray color palette and is quite data-intensive.
Operational Efficiency
Financial Services
Focuses on a detailed breakdown of expenses, suitable for financial analysis and operational budgeting.
Expenses, Breakdown, Financial, Analysis, Operational, Budgeting, Detailed, Column Chart, Table, Data-Intensive
false
Operational Efficiency
Financial Services financial-services
Multiple Chart
Goldman Sachs
View slide
The slide displays a complex table comparing different expense categories over various quarters, alongside a single column chart showing the efficiency ratio. It utilizes a muted color palette with highlights in blue.
Operational Efficiency
Financial Services
This slide presents an in-depth look at the company's expenses, showing changes over time and highlighting operational efficiency through an efficiency ratio metric. It is used to evaluate financial management and cost-efficiency within the company.
Expenses, Efficiency Ratio, Operational, Financial Data
false
Operational Efficiency
Financial Services financial-services
Mixed Chart
Goldman Sachs
View slide
The slide features multiple column charts displaying 'Adjusted Expenses' over a period, accompanied by annotations for specific expense categories. Other smaller bar charts illustrate cost per account for operations and branch network. The design uses shades of blue and annotations to make distinctions clear.
Operational Efficiency
Financial Services
This slide delves into the financial institution's expense management, highlighting efficiencies and cost per account metrics. It is intended for use in operational reviews and strategy meetings, potentially to discuss cost-saving measures, investment in technology, and operational improvements aimed at achieving scalability and sustainable growth.
Expenses, Efficiency, Cost Management, Financial Institutions, Technology Investment, Operational Improvement
false
Operational Efficiency
Financial Services financial-services
Multiple Chart
JP Morgan
View slide
The slide features a column chart comparing 'Efficiency Ratio' for 2023 YTD and 2022 YTD, alongside a comprehensive table detailing financial expenses in various categories such as compensation, transaction-based fees, and total operating expenses with percentage changes from the previous year.
Financial Performance
Financial Services
This slide analyzes financial expenses, showing year-on-year and year-to-date comparisons. It includes insights on significant changes in non-compensation expenses and the impact of taxes on earnings, aimed at providing a snapshot of financial health and operational efficiency.
Expenses, Financial Analysis, Efficiency Ratio, Depreciation, Compensation, Year-to-Year Comparison, Taxes, Operating Expenses
false
Financial Performance
Financial Services financial-services
Mixed Chart
Goldman Sachs
View slide
The slide shows a column chart representing 'CCB Adjusted Expense' in billions from 2021 to 2022, with projections for 2023. Factors contributing to changes in expenses are highlighted with arrows and brief descriptions. There are also several small icons, such as a car and a computer, which serve as visual aids to accompany the explanations of the various contributing factors.
Operational Efficiency
Financial Services
Aimed at showcasing a financial institution's expense management over the years with future outlook, the slide presents how investments, structural changes, and other factors influence overall expenses. It's meant to convey fiscal discipline and strategic investment with a goal of sustainable growth, possibly for investor reassurance or internal review.
Expenses, Financial Discipline, Investment, Forecast, Growth, Management, Strategic Planning
false
Operational Efficiency
Financial Services financial-services
Single Chart
JP Morgan
View slide
The slide displays tables and bullet points outlining financial expenses and highlights, including a graph showing efficiency ratio trends.
Operational Efficiency
Financial Services
Outlines the company's financial expenses, focusing on compensation, transaction fees, and other operating costs. It also discusses the impact of litigation on the overall financial performance and operational efficiency, as well as the company's tax rate.
Expenses, Financial Performance, Operational Efficiency, Litigation, Tax Rate
false
Operational Efficiency
Financial Services financial-services
Mixed Chart
Goldman Sachs
View slide
Column chart illustrating changes in operating expenses from 3Q23 to 4Q23 with contributing factors and expense categories.
Financial Performance
Financial Services
Reviews UBS's operating expenses for 4Q23, highlighting an increase compared to 3Q23, with a detailed breakdown of expense factors.
Expenses, Financial Performance, UBS, 4Q23, Analysis
false
Financial Performance
Financial Services financial-services
Mixed Chart
UBS
View slide
The slide is dense with a mix of column charts and a data table. On the left, a table lists financial metrics with percentages. On the right, a column chart compares the efficiency ratio between 2023 and 2022, below which is a bullet point list of expense highlights.
Financial Performance
Financial Services
The slide presents a detailed financial analysis of quarterly expenses including compensation, transaction fees, and various operational costs, contrasted against previous quarters and years. An efficiency ratio graph highlights improvements in operational costs. This slide could be used in a financial review meeting to discuss cost management strategies and efficiency gains.
Expenses, Financial, Analysis, Efficiency, Cost Management, Operational, Quarterly, Comparison
false
Financial Performance
Financial Services financial-services
Mixed Chart
Goldman Sachs
View slide
Column chart showing changes in expenses year-over-year, broken down by categories like transformation and technology investment.
Financial Performance
Financial Services
Analyzes Citigroup's operational expenses throughout 2021, detailing specific investments in technology and other strategic areas.
Expenses, Investment, Technology, Banking, Efficiency
false
Financial Performance
Financial Services financial-services
Single Chart
Citigroup
View slide
Features a large column chart showing expense trends over three quarters and four key investment themes described in separate text boxes.
Operational Efficiency
Financial Services
Discusses quarterly expense trends and strategic investments focusing on simplification, security, client experience, and data improvements. Illustrates how investments align with operational strategies to enhance overall business performance.
Expenses, Investments, Trends, Operational, Strategy
false
Operational Efficiency
Financial Services financial-services
Mixed Chart
Citigroup
View slide
Displays a column chart on efficiency ratio and comprehensive tables listing various expense categories with associated financial data.
Operational Efficiency
Financial Services
The slide offers a detailed breakdown of expenses, highlighting changes over time and efficiency ratios. It can be used to discuss operational expenses, budget planning, and financial strategy adjustments based on the illustrated data.
Expenses, Operational, Efficiency Ratio, Compensation, Technology, Clearing, Market Development, Tax Rate, Financial Results, Litigation Provision
false
Operational Efficiency
Financial Services financial-services
Mixed Chart
Goldman Sachs
View slide
A mix of column chart and comprehensive text boxes, depicting various financial metrics.
Operational Efficiency
Financial Services
Overview of company expenses including compensation, transaction, and technology costs with a year-over-year comparison.
Expenses, Operational, Efficiency, Bar Chart, Financial Results, Compensation, Technology, Tax Rate, Comparison
false
Operational Efficiency
Financial Services financial-services
Mixed Chart
Goldman Sachs
View slide
A column chart showing the 2018 to 2019 outlook with changes in expenses broken down by type, such as tech investments and FDIC/other, with a title above and footnotes below.
Financial Performance
Financial Services
Demonstrates the company's financial planning, highlighting changes in expenses and investments year over year, useful for financial analysis and performance discussions.
Expenses, Outlook, Financial Planning, Investments, FDIC
false
Financial Performance
Financial Services financial-services
Single Chart
JP Morgan
View slide
Includes column charts showing past and projected expenses, with a legend explaining different categories of expenses. The design is clean with the use of colors to differentiate data.
Operational Efficiency
Financial Services
It presents J.P.Morgan's firmwide expenses over time with projections, indicating areas of investment and expected declines in growth rate.
Expenses, Projections, Investment, Efficiency, Growth Rate, Financial Services, J.P.Morgan
false
Operational Efficiency
Financial Services financial-services
Mixed Chart
JP Morgan
View slide
This slide displays a column chart tracking expenses from 2018 to 2019 in billions of dollars, highlighting overhead, revenue-related, and investment areas. The chart has a balance of dark and light blue tones, with green bars for positive changes and red for negative ones.
Financial Performance
Financial Services
The slide analyzes the expense trends for JPMorgan, showing an increase in overall expenses from 2018 to 2019 due to higher revenues and investments in technology and non-tech areas. A bar and column chart illustrates the changes in financial figures, such as overhead ratio and revenue-related expenses, offering insights into the financial planning and budgeting of the firm.
Expenses, Revenue, Investments, JPMorgan, Financial Analysis, Overhead Ratio, Bar Chart, Column Chart, Financial Planning
false
Financial Performance
Financial Services financial-services
Single Chart
JP Morgan
Previous
Loading...
Hold On!
We are searching in our database
If nothing, comes up, please try different filters!
Column Chart
Heatmap
Chevron
Org Chart
Infographic
Callouts
Timeline
List
Graphic
Picture
Process Flow
Diagram
Paragraph
Map
Table
Framework
Subtitle
Takeaway Box
Icon
Other Chart
Radar Chart
Waterfall Chart
Mekko Chart
Pie Chart
Scatter Plot
Line Chart
Bar chart
Bullet points
Create a FREE account to continue browsing
Receive Instant Access to 1,000+ slides from companies like McKinsey, Google, and Goldman Sachs
First Name
Last Name
Email
Password
I agree to all
Terms & Privacy Policy
Thank you! Your submission has been received!
Oops! Something went wrong while submitting the form.
Have an account?
Sign in
Upgrade to PRO to Save slides
Advanced Search and Filters
Access to 15,000+ slides
Access to Category Pages
Save/Bookmark Slides
PowerPoint Template Library
Pick a Plan
MONTHLY
$12/month
Billed every month, Cancel anytime.
YEARLY
$9/year
Billed $108 annually, Cancel anytime.
Checkout for $12/month
Checkout for $108/yr
Secured by Stripe | AES-256 bit encryption