My Account
My Slides
Search by Category
Templates
View All Templates
Download Template Slides
Leave Feedback
Login
Logout
Get Started
Browse all Slides
Browse all Slides
Create a FREE Account
Instant access to 1,000+ real slides from top companies like McKinsey, BCG, Goldman Sachs, Google and many more!
First Name
Last Name
Email
Password
I agree to all
Terms & Privacy Policy
Thank you! Your submission has been received!
Oops! Something went wrong while submitting the form.
Have an account?
Sign in
Spark Your Next Big Idea with New Presentation Templates
VIEW ALL Templates
Welcome,
Welcome
PRO
Show Featured Only
Checkbox 8
Companies
Mckinsey
Bain
BCG
EY
Deloitte
Accenture
PwC/Strategy&
JP Morgan
Goldman Sachs
Morgan Stanley
Citigroup
Deutsche Bank
Barclays
LEK
KPMG
Kearney
Oliver Wyman
Booz Allen Hamilton
Gartner
IPSOS
Nielsen
Slide type
Text Only
Linear Flow
Vertical Flow
Single Chart
Header Horizontal
Mixed Chart
Header Vertical
Pillar
Multiple Chart
Graphic
Agenda
Title
Table
Framework
Industry
Technology & Software
Artificial Intelligence
Financial Services
Retail & E-commerce
Consumer Goods
Industrial & Manufacturing
Transportation & Logistics
Telecommunications
Real Estate & Construction
Hospitality & Tourism
Professional Services
Education & Training
Media & Entertainment
Agriculture & Food Production
Healthcare & Pharmaceuticals
Environmental Services & Sustainability
Government & Public Sector
Use Case
Mergers and Acquisitions
Performance Metrics and KPIs
Client Case Studies
Competitive Landscape
Corporate Finance and Valuation
Product and Service Analysis
Customer and Market Segmentation
Organizational Structure and Change
Industry Overview
Regulatory and Compliance
Risk Assessment and Management
Investment Analysis
Organizational Structure and Change
Human Resources and Talent Management
Financial Performance
Market Analysis and Trends
Sales and Business Development
Human Resources and Talent Management
Clear all
Thank you! Your submission has been received!
Oops! Something went wrong while submitting the form.
Tag
View slide
Multiple bar charts show percentages of where GBS services are provided for China, India, Brazil, Japan, and Russia from various countries.
Industry Overview
Professional Services
Presents data on the geographical distribution of GBS services among different countries, indicating major service locations like China and Brazil and the variety of sourcing countries.
GBS, services, global, distribution
false
Industry Overview
Professional Services professional-services
Multiple Chart
Deloitte
View slide
Two-column text-heavy layout with Circular diagram split into four quadrants illustrating skill distribution within GBS roles.
Organizational Structure and Change
Professional Services
Discusses key skills for GBS effectiveness and strategic value, highlighting areas like leadership and action orientation.
GBS, skills, strategy, leadership, action-oriented
false
Organizational Structure and Change
Professional Services professional-services
Diagram
Deloitte
View slide
Combines text and an image of a flowchart outlining the phases of implementing a global business strategy with deliverables highlighted in different colors.
Operational Efficiency
Professional Services
Provides a comprehensive view on developing a commercial mindset within GBS, detailing the process and strategic phases necessary for effective global operation and management.
GBS, strategy, implementation, phases
false
Operational Efficiency
Professional Services professional-services
Linear Flow
Deloitte
View slide
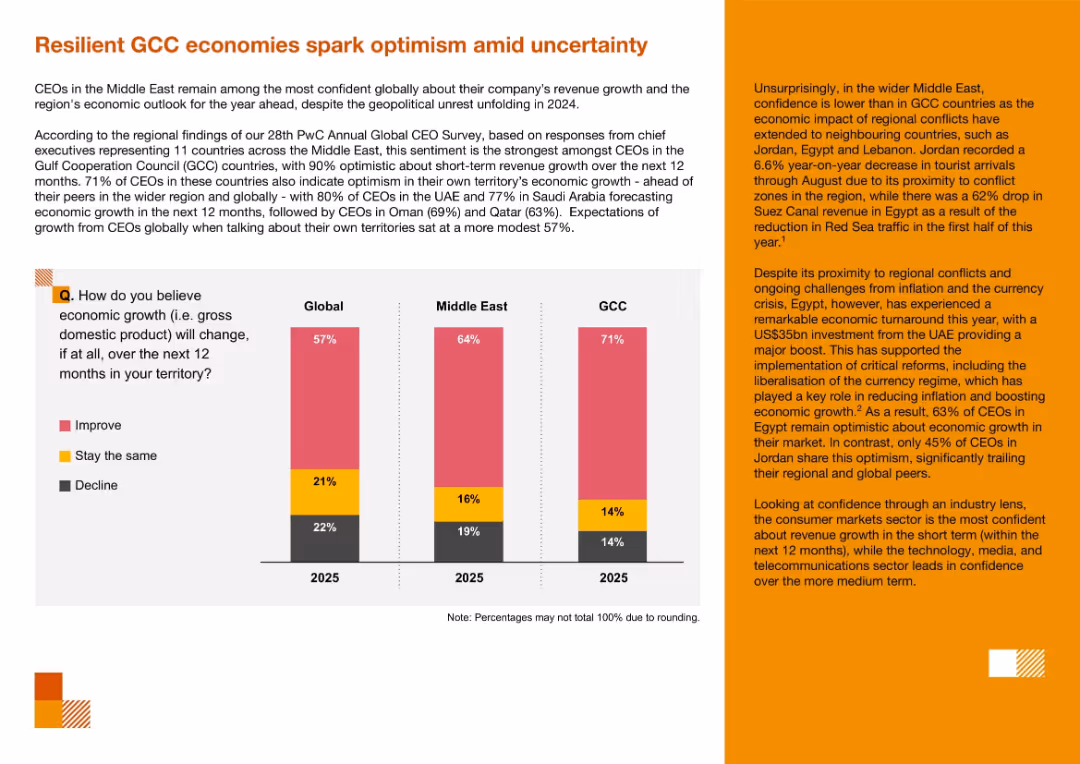
Mixed layout with left-side chart comparing optimism levels (global vs GCC), and right-side narrative text with orange highlights. Regionally themed.
Market Analysis and Trends
Professional Services
This slide highlights optimism among GCC CEOs about short-term revenue and economic growth despite geopolitical uncertainty. It contrasts GCC confidence levels with global and regional peers and discusses positive investor sentiment in Egypt versus lower confidence in Jordan.
GCC economies, optimism, economic growth, Middle East, CEO confidence, regional outlook
false
Market Analysis and Trends
Professional Services professional-services
Mixed Chart
PwC/Strategy&
View slide
The slide includes text blocks with points about GCC countries' potential for CCUS, including geological storage capacity and government plans.
Strategic Planning
Energy & Utilities
Discusses the potential for CCUS in GCC countries, citing geological capacity, emission statistics, and governmental commitment to reducing CO2 emissions.
GCC, CCUS, potential, geological storage, government plans, CO2 emissions, strategic planning
false
Strategic Planning
Energy & Utilities energy-and-utilities
Multiple Chart
Kearney
View slide
This slide contains graphical elements such as bar graphs, and detailed supplemental text explaining the data presented. The graphs are accompanied by explanatory notes on the right-hand side.
Financial Performance
Education & Training
It models GDP growth and potential forgone growth under various skilling and technology investment scenarios, indicating economic impacts. Used for discussing investment in education technology and its economic implications.
GDP Growth, Economic Impact, Investment, Skilling, Technology
false
Financial Performance
Education & Training education-and-training
Multiple Chart
Accenture
View slide
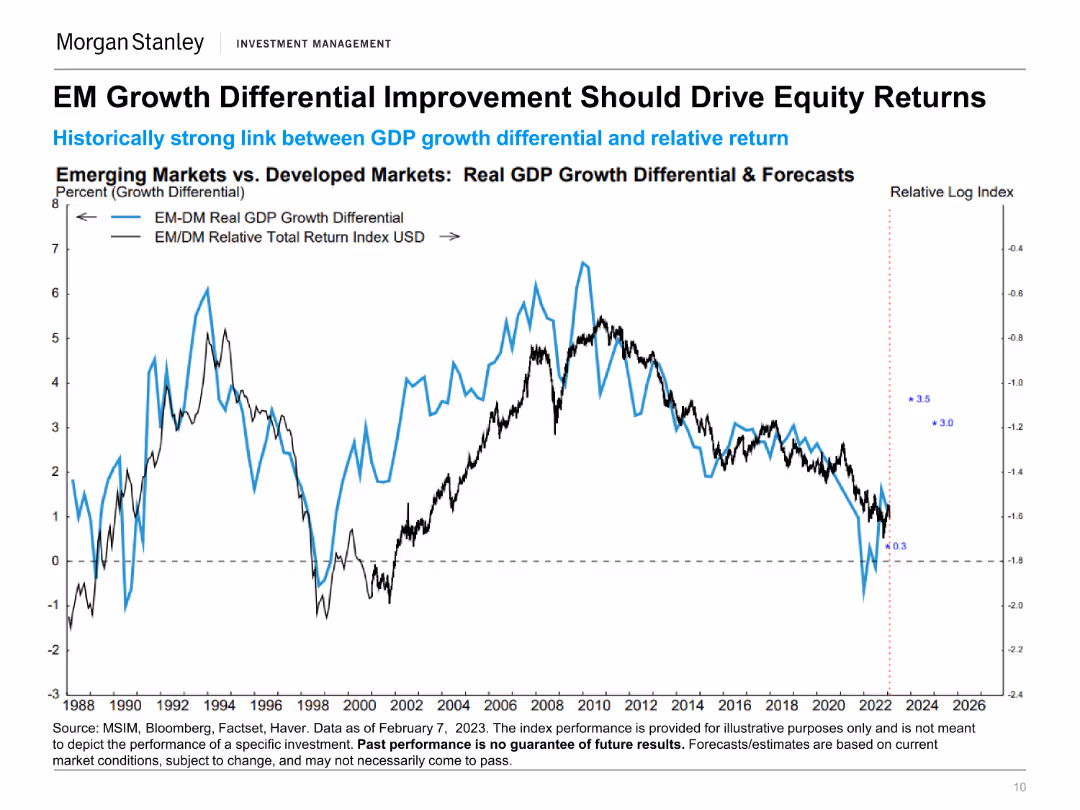
This slide shows a line chart comparing the EM-DM Real GDP Growth Differential and the EMDM Relative Total Return Index in USD from 1988 to 2026. The chart uses two lines to display the data.
Investment Analysis
Financial Services
The slide explains the relationship between GDP growth differential and relative return between emerging markets and developed markets, with future forecasts included.
GDP Growth, Equity Returns, Emerging Markets, Developed Markets, Growth Differential, Investment Forecast, Economic Trends, Market Analysis
false
Investment Analysis
Financial Services financial-services
Single Chart
Morgan Stanley
View slide
Features a table on the left with GDP growth assumptions and two line graphs on the right showing earnings projections and market indices. Predominantly textual with accompanying data visualizations.
Investment Analysis
Financial Services
The slide forecasts global GDP growth and equities earnings, analyzing financial markets and investment opportunities. It compares historical data with future projections.
GDP Growth, Financial Markets, Equities Earnings, Investment Opportunities, Projections, Global Economy
false
Investment Analysis
Financial Services financial-services
Mixed Chart
Citigroup
View slide
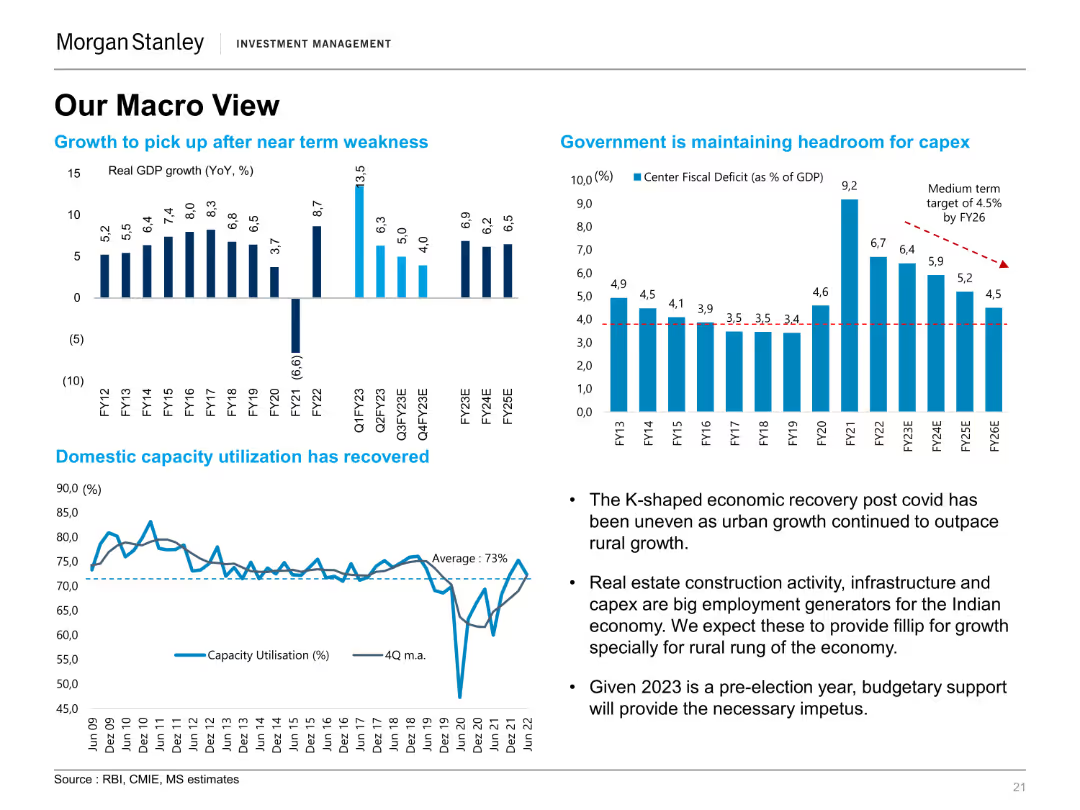
Multiple column charts and a line graph displaying real GDP growth, center fiscal deficit, and domestic capacity utilization from FY12 to FY25E.
Strategic Planning
Financial Services
The slide presents a macroeconomic view of India, covering GDP growth, fiscal deficit, and capacity utilization, forecasting near-term economic recovery.
GDP Growth, Fiscal Deficit, Capacity Utilization, Economic Recovery, India
false
Strategic Planning
Financial Services financial-services
Multiple Chart
Morgan Stanley
View slide
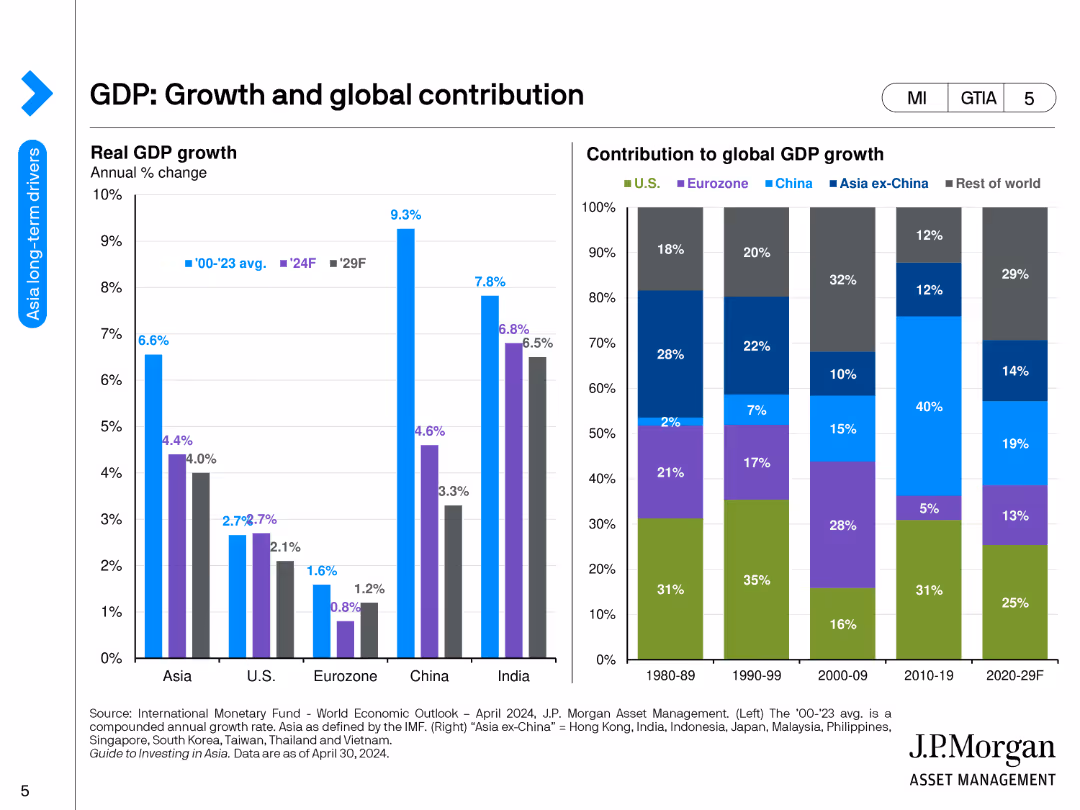
The slide features a bar chart showing real GDP growth rates from 2000 to 2029 for different regions, and a stacked bar chart showing contribution to global GDP growth by region.
Market Analysis and Trends
Financial Services
This slide analyzes global GDP growth rates and contributions from various regions, providing insights into economic performance and forecasts. It highlights the significant role of Asia in global growth.
GDP Growth, Global Contribution, Economic Performance, Regions, Forecast
false
Market Analysis and Trends
Financial Services financial-services
Multiple Chart
JP Morgan
View slide
Features a global map with data boxes showing GDP growth rates by region. The design is clean, with a balance of text and graphics, using shades of blue and green for emphasis.
Market Analysis and Trends
Financial Services
Provides a global overview of economic forecasts for 2019, focusing on GDP and manufacturing growth rates across key regions. Essential for strategic planning and understanding economic trends in a global context.
GDP Growth, Global Economy, Forecast, 2019, Economic Trends
false
Market Analysis and Trends
Financial Services financial-services
Graphic
Deutsche Bank
View slide
This slide has a dual-axis line chart comparing US growth in nominal GDP (in orange) and M1 money supply (in blue) from the 1960s to the 2020s. Both lines show significant volatility over time, intersecting and diverging at various points.
Market Analysis and Trends
Financial Services
The slide compares US growth in nominal GDP with M1 money supply, highlighting the correlation and lags between the two metrics. It can be used to discuss monetary policy implications, economic forecasting, and the relationship between money supply and economic growth.
GDP Growth, M1 Money Supply, US Economy, Dual-axis Chart, Economic Indicators, Monetary Policy
false
Market Analysis and Trends
Financial Services financial-services
Single Chart
JP Morgan
View slide
Features a world map highlighting the GDP PPP growth rates of specific countries and bar charts showing the share of global GDP PPP. Utilizes color differentiation for clear distinction among country groups.
Market Analysis and Trends
Financial Services
The slide presents real GDP PPP growth rates alongside the global share of GDP, useful for discussions on economic influence and forecasting global economic balances.
GDP PPP, economic forecasting, BRICS, global economy, growth rates
false
Market Analysis and Trends
Financial Services financial-services
Multiple Chart
Roland Berger
View slide
The slide contains two line charts showing GDP size by region from 1992 to 2023, and a bar chart listing the 10 biggest economies in the world by nominal GDP in 2023.
Market Analysis and Trends
Financial Services
This slide presents data on GDP sizes and growth rates by region, and ranks the largest economies in the world, highlighting economic trends and projections.
GDP Size, Economic Growth, Regions, World Economies, Data Presentation
false
Market Analysis and Trends
Financial Services financial-services
Multiple Chart
JP Morgan
View slide
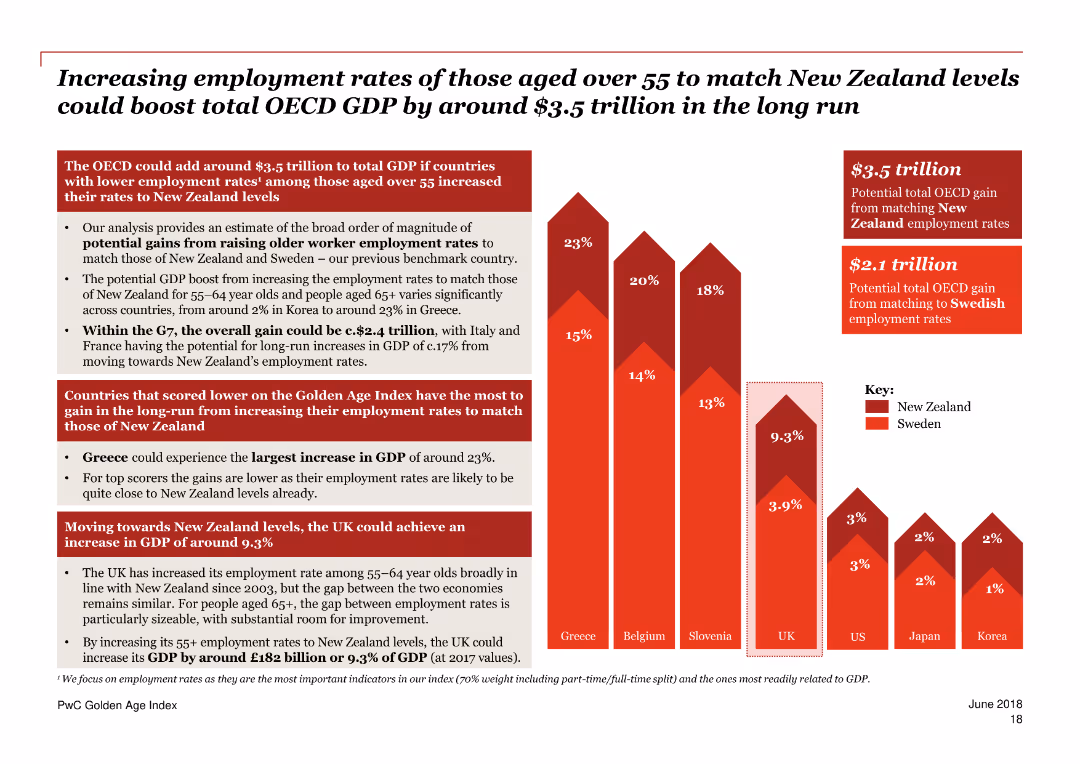
A column chart with varying shades of red, showing potential GDP boost percentages for different countries.
Market Analysis and Trends
Government & Public Sector
Highlights countries scoring lower on the Golden Age Index that have the most to gain from boosting employment rates for older workers to New Zealand levels.
GDP boost, Golden Age Index, employment, older workers, New Zealand, countries, comparison, trends, analysis, potential gains
false
Market Analysis and Trends
Government & Public Sector government-and-public-sector
Mixed Chart
PwC/Strategy&
View slide
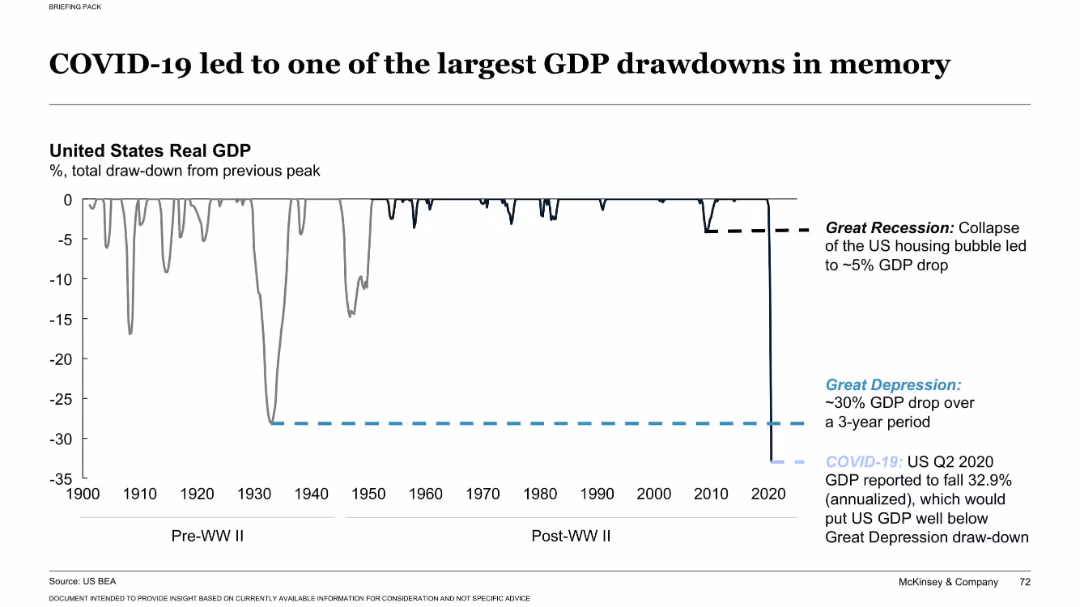
Single large line chart depicting U.S. GDP drawdowns from 1900–2020 with labeled economic crises
Market Analysis and Trends
Financial Services
This slide compares the U.S. GDP drawdown during COVID-19 to historic crises like the Great Depression and Great Recession. It highlights the exceptional severity of the 2020 Q2 drop, estimated at 32.9% annualized, the largest recorded in modern economic history.
GDP drawdown, COVID-19, recession, Great Depression, economic history
false
Market Analysis and Trends
Financial Services financial-services
Single Chart
McKinsey
View slide
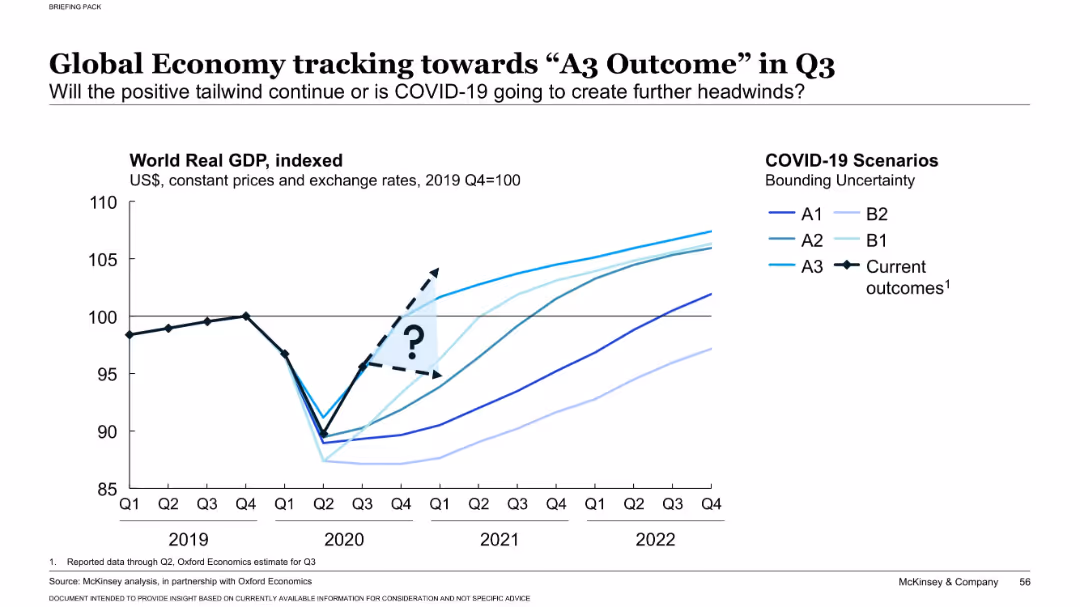
Line chart showing world real GDP indexed to 2019 Q4 = 100 across time, with curves for various COVID-19 recovery scenarios (A1, A2, A3, B1, B2) and actual outcome. Light blue gradient arrow represents uncertainty window.
Market Analysis and Trends
Financial Services
Shows that the global economy is trending toward the A3 recovery scenario, characterized by strong rebound and recovery. The chart emphasizes the degree of uncertainty about future economic performance and visualizes actual versus projected recovery trajectories.
GDP forecast, A3 scenario, COVID-19 recovery, economic trends, real GDP, scenario analysis, uncertainty, growth tracking, Q3 projections, rebound scenario
false
Market Analysis and Trends
Financial Services financial-services
Single Chart
McKinsey
View slide
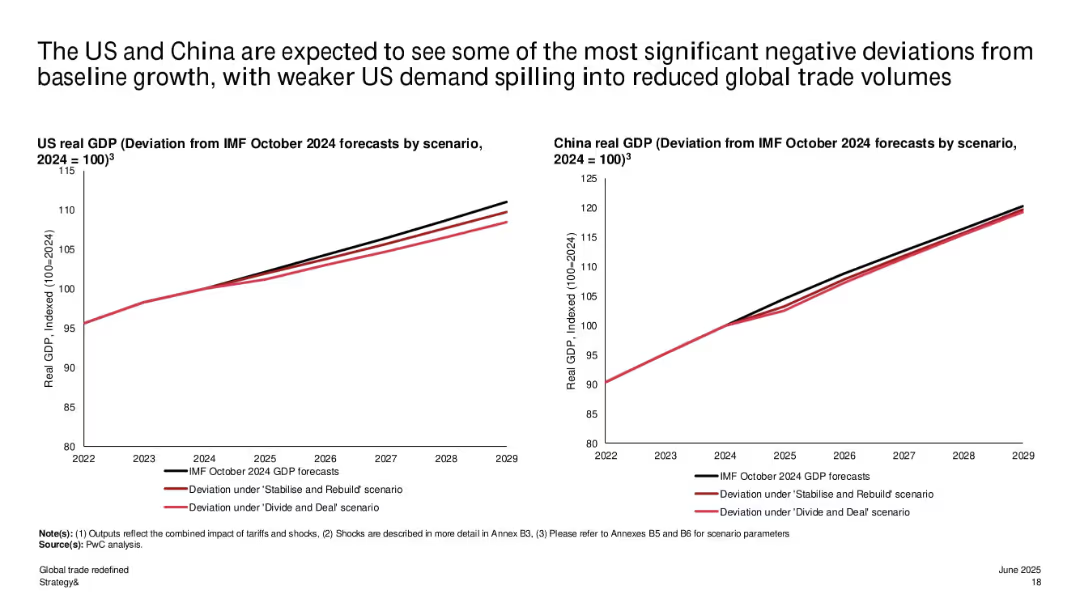
Dual line graphs tracking US and China GDP projections (indexed from 2024); colored lines compare forecast scenarios against IMF baseline.
Financial Performance
Government & Public Sector
This slide illustrates forecasted GDP paths for the US and China under different trade scenarios. Both countries are projected to fall below IMF baseline expectations, with greater deviation under "Divide and Deal", implying weaker demand and trade volume.
GDP forecast, US-China, trade volume, IMF projections, deviation, real GDP, trade disruption, economic modeling
false
Financial Performance
Government & Public Sector government-and-public-sector
Multiple Chart
PwC/Strategy&
View slide
A dense slide with multiple bar graphs comparing GDP growth forecasts, accompanied by a textual analysis of the economic conditions.
Market Analysis and Trends
Financial Services
Analyzes adjustments in global growth projections and their drivers, likely used in financial services and economic strategy presentations.
GDP forecast, economic analysis, inflation, financial sector, geopolitical impact, growth projections, market trends
false
Market Analysis and Trends
Financial Services financial-services
Mixed Chart
McKinsey
View slide
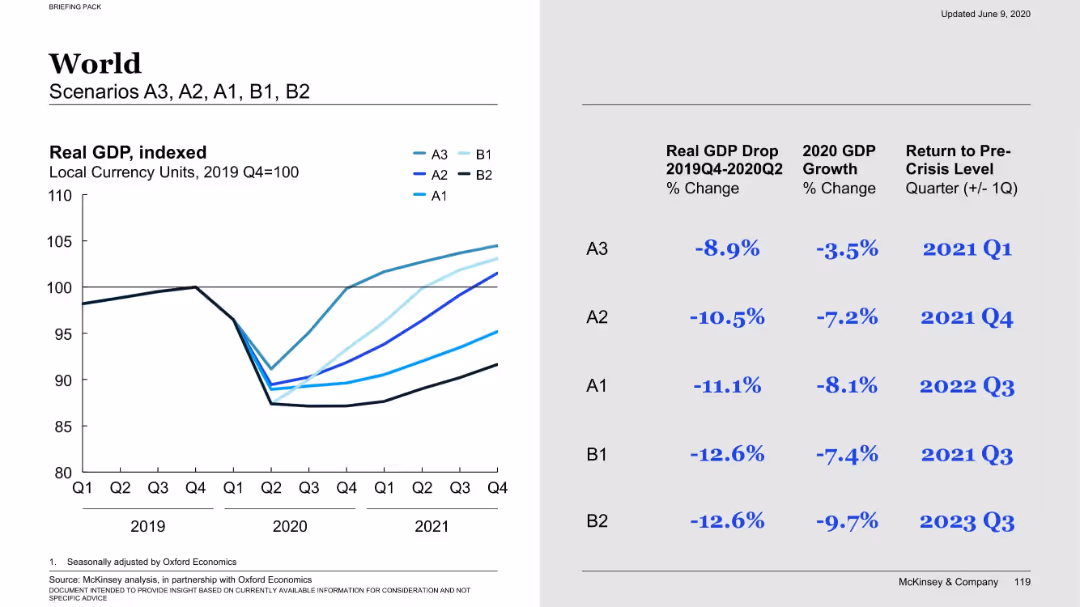
Left side: a multi-line graph comparing global GDP under different scenarios. Right side: scenario-specific metrics (GDP drop, 2020 growth, recovery timeline).
Market Analysis and Trends
Financial Services
Compares global GDP performance under five economic scenarios, outlining percentage GDP drop and estimated recovery quarters. Scenario A3 recovers fastest; B2 is the most pessimistic with prolonged recovery into late 2023.
GDP forecast, economic scenarios, global trends, recovery, A1-B2 scenarios
false
Market Analysis and Trends
Financial Services financial-services
Mixed Chart
McKinsey
View slide
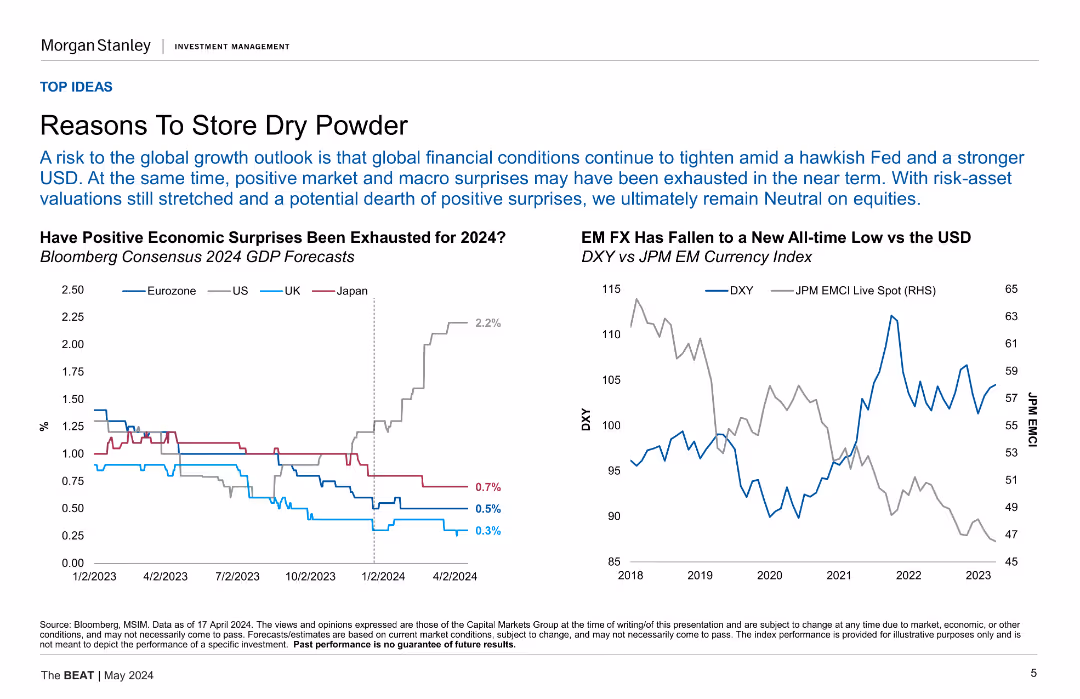
The slide features two line charts, one showing GDP forecasts for different regions and another comparing EM FX and the USD index.
Strategic Planning
Financial Services
The slide discusses the rationale for maintaining liquidity, highlighting GDP forecasts and emerging market currency trends against the USD.
GDP forecasts, liquidity, EM FX, USD index, strategic planning
false
Strategic Planning
Financial Services financial-services
Multiple Chart
Morgan Stanley
View slide
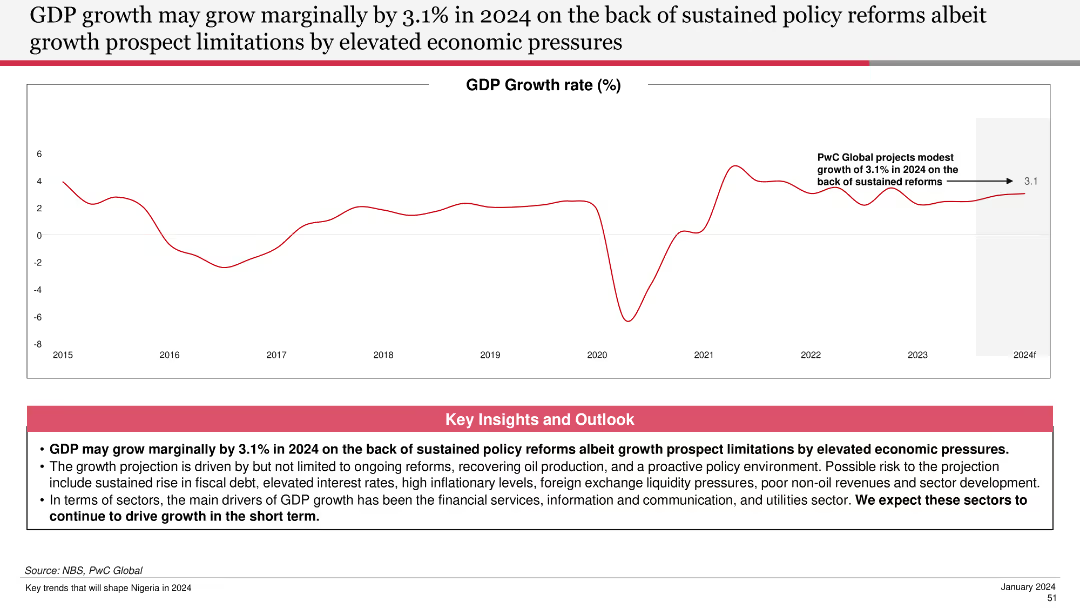
Includes a line chart showing GDP growth rate trends from 2015 to 2024, with annotations.
Financial Performance
Financial Services
Projects a modest GDP growth of 3.1% in 2024, driven by policy reforms. Discusses various factors and risks affecting economic growth.
GDP growth, 2024, policy reforms, economic pressures, financial services, projections, risks
false
Financial Performance
Financial Services financial-services
Mixed Chart
PwC/Strategy&
View slide
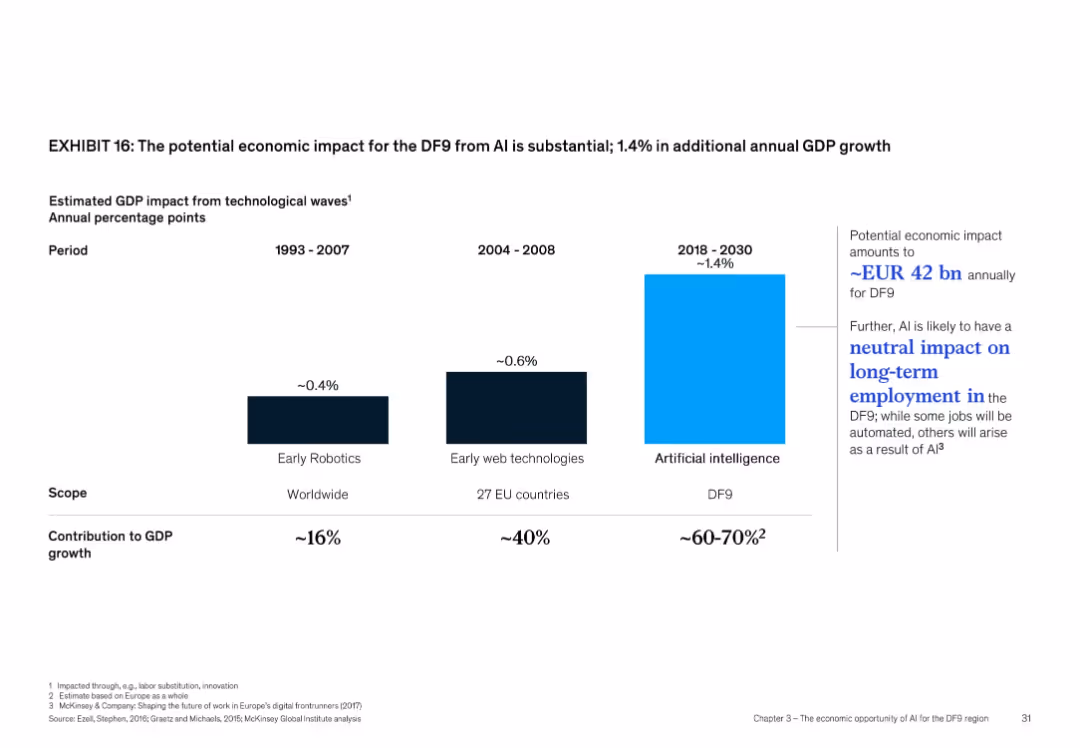
Bar chart comparison with three periods and technologies, light and dark bars, minimalistic design
Market Analysis and Trends
Artificial Intelligence
This slide compares GDP impacts of technological waves across three eras: early robotics (~0.4%), web technologies (~0.6%), and AI (~1.4%). It suggests AI could add EUR 42 bn annually for DF9 and may have a neutral net employment effect due to job creation balancing automation-related losses.
GDP growth, AI impact, employment, DF9, robotics, web, economic value
false
Market Analysis and Trends
Artificial Intelligence artificial-intelligence
Single Chart
McKinsey
View slide
This slide features a combined line and column chart comparing "Global GDP growth" and "Change in CEO confidence" from 2008 to 2019. The background is white with a gray overlay on recent years, emphasizing the latest data points.
Market Analysis and Trends
Financial Services
The slide illustrates the correlation between CEO confidence and global economic growth, suggesting predictive power of CEO outlook over actual economic outcomes. It is used for economic forecasting discussions.
GDP growth, CEO confidence, economic forecasting, predictive analysis, correlation, economic indicators, global outlook.
false
Market Analysis and Trends
Financial Services financial-services
Mixed Chart
PwC/Strategy&
View slide
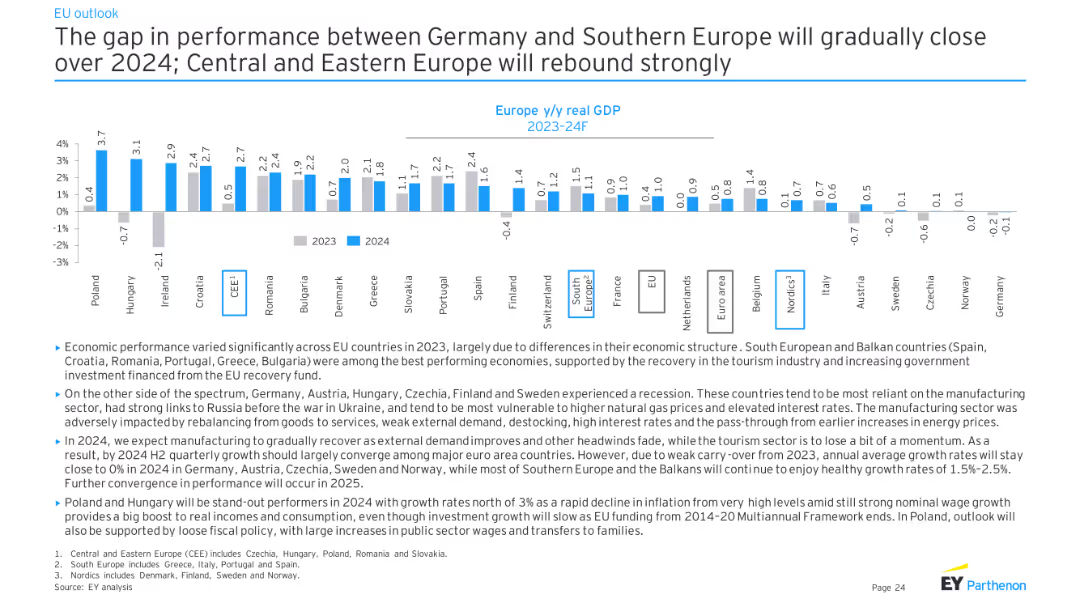
The slide features a column chart depicting Europe y/y real GDP (2023-24F) for various countries. The data is presented in a comparative format, showing projected GDP growth rates across Europe with textual explanations at the bottom.
Market Analysis and Trends
Financial Services
This slide discusses the expected convergence in economic performance between Germany and Southern Europe in 2024, while Central and Eastern Europe are projected to rebound strongly. It provides a comparative analysis of GDP growth rates across different European regions.
GDP growth, Europe, economic convergence, forecast
false
Market Analysis and Trends
Financial Services financial-services
Mixed Chart
EY
View slide
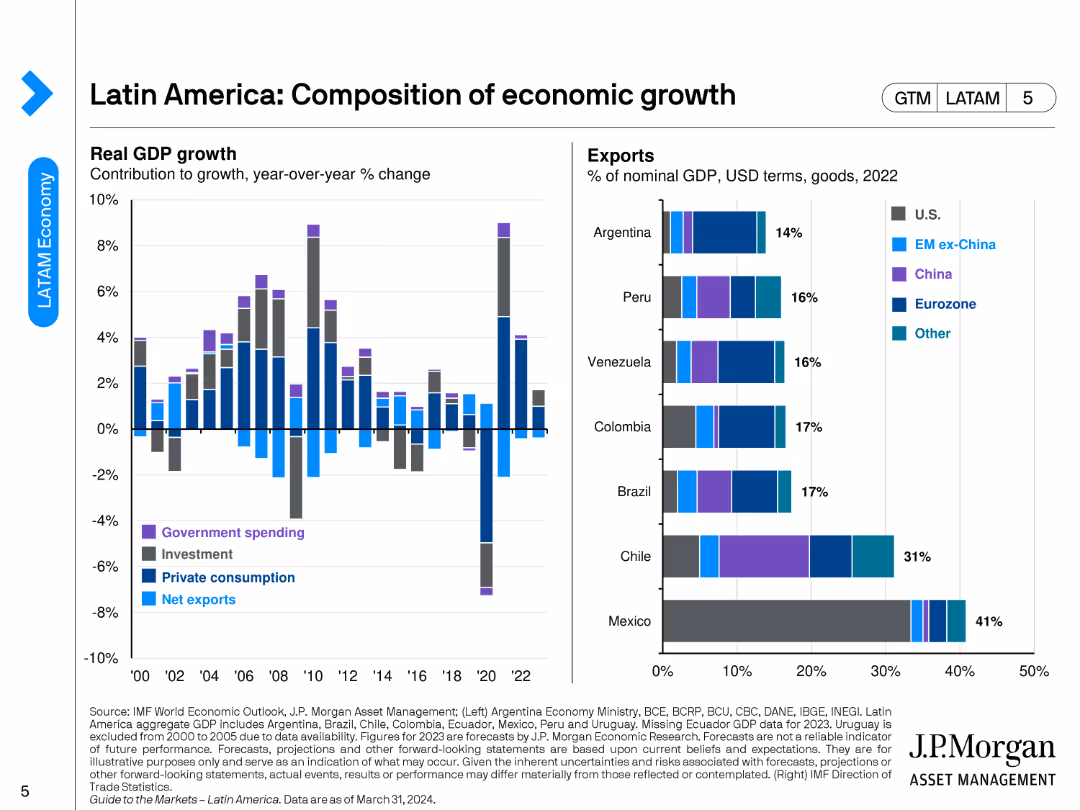
The slide contains a bar chart displaying the composition of GDP growth (government spending, investment, private consumption, net exports) and a stacked bar chart showing exports by country and region (U.S., EM ex-China, China, Eurozone, Other).
Market Analysis and Trends
Financial Services
This slide breaks down the components of GDP growth in Latin America, along with an analysis of export contributions by country and region.
GDP growth, Latin America, exports, economic composition, trade
false
Market Analysis and Trends
Financial Services financial-services
Multiple Chart
JP Morgan
View slide
Includes a landscape photo with a starry sky, two column charts on GDP growth, and a line chart on global economic outlook involving multiple regions.
Financial Performance
Government & Public Sector
This slide connects Namibia's GDP growth trends with broader economic conditions, offering insights into fiscal challenges and global economic interactions.
GDP growth, Namibia, economic conditions, fiscal challenges, global economy, economic outlook
false
Financial Performance
Government & Public Sector government-and-public-sector
Multiple Chart
PwC/Strategy&
View slide
This slide contains two visualizations: a column chart showing consensus forecasts for real GDP growth and a line chart illustrating Composite Purchasing Managers’ Index (PMI) for the UK, Eurozone, Japan, US, and China.
Market Analysis and Trends
Financial Services
The slide provides data on global GDP growth forecasts for 2023 and 2024, along with PMI trends for major economies, useful for understanding economic performance and future expectations.
GDP growth, PMI, global economy, economic performance, trends
false
Market Analysis and Trends
Financial Services financial-services
Multiple Chart
JP Morgan
View slide
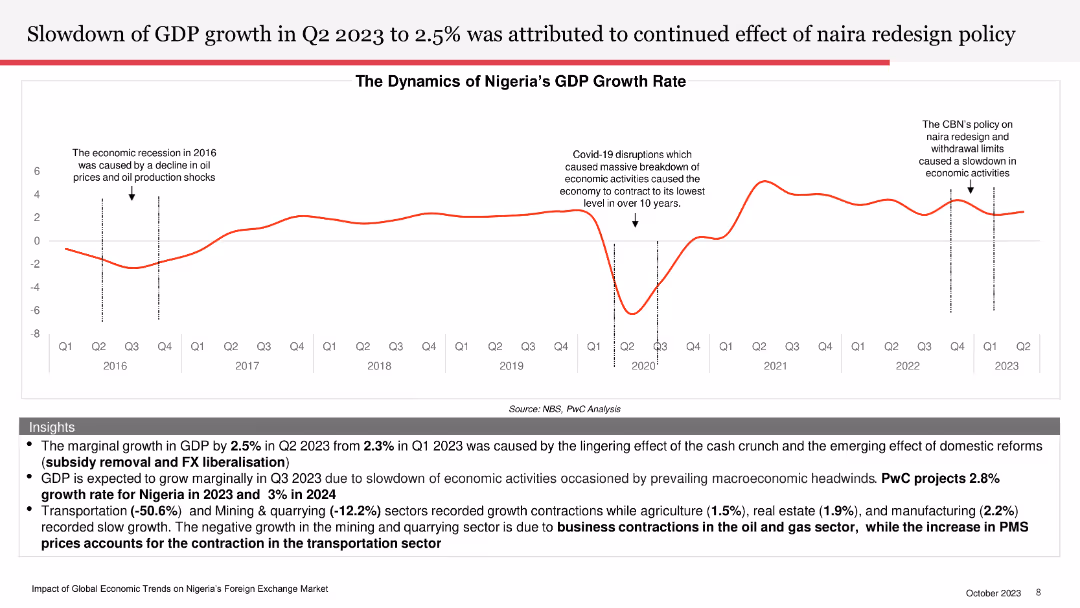
Includes a line chart depicting GDP growth rate from Q1 2016 to Q2 2023, with annotations on significant economic events affecting the growth rate.
Financial Performance
Financial Services
Discusses the factors behind the slowdown in GDP growth in Q2 2023, particularly the impact of the naira redesign policy and other economic factors.
GDP growth, Q2 2023, naira redesign policy, economic factors, financial performance, growth rate
false
Financial Performance
Financial Services financial-services
Mixed Chart
PwC/Strategy&
View slide
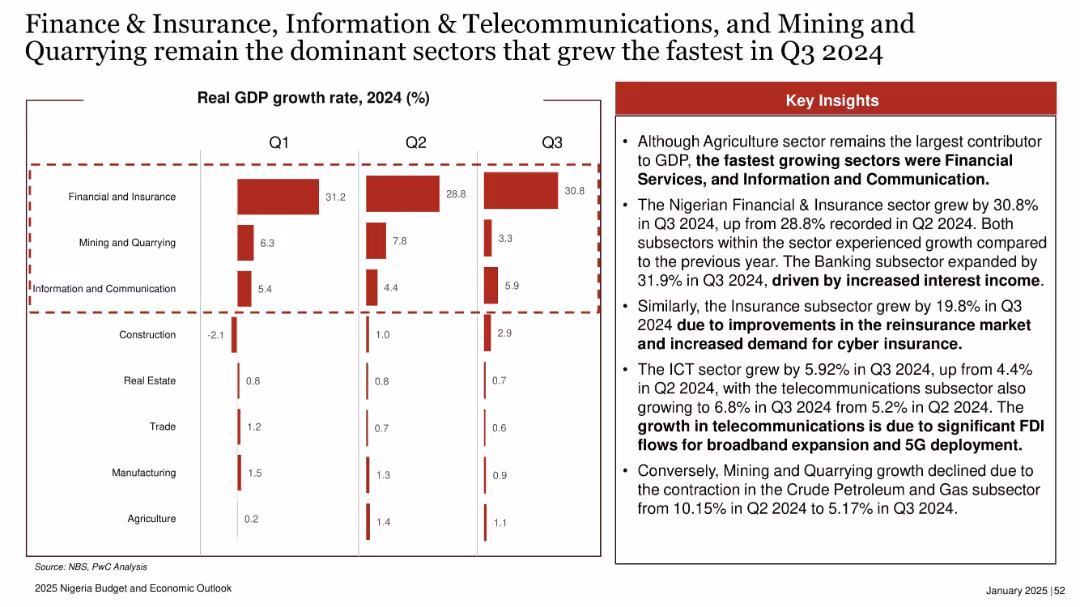
Bar charts per sector for Q1–Q3 2024 with detailed key insights at right. Dotted border highlights focus sectors.
Industry Overview
Financial Services
This slide analyzes quarterly GDP growth rates in 2024, highlighting the top-performing sectors: Finance & Insurance, ICT, and Mining. Key growth drivers include higher interest income and foreign investment in telecoms.
GDP growth, Q3 2024, finance, insurance, ICT, mining, sectoral analysis, Nigeria economy
false
Industry Overview
Financial Services financial-services
Mixed Chart
PwC/Strategy&
Previous
Loading...
Hold On!
We are searching in our database
If nothing, comes up, please try different filters!
Column Chart
Heatmap
Chevron
Org Chart
Infographic
Callouts
Timeline
List
Graphic
Picture
Process Flow
Diagram
Paragraph
Map
Table
Framework
Subtitle
Takeaway Box
Icon
Other Chart
Radar Chart
Waterfall Chart
Mekko Chart
Pie Chart
Scatter Plot
Line Chart
Bar chart
Bullet points
Create a FREE account to continue browsing
Receive Instant Access to 1,000+ slides from companies like McKinsey, Google, and Goldman Sachs
First Name
Last Name
Email
Password
I agree to all
Terms & Privacy Policy
Thank you! Your submission has been received!
Oops! Something went wrong while submitting the form.
Have an account?
Sign in
Upgrade to PRO to Save slides
Advanced Search and Filters
Access to 15,000+ slides
Access to Category Pages
Save/Bookmark Slides
PowerPoint Template Library
Pick a Plan
MONTHLY
$12/month
Billed every month, Cancel anytime.
YEARLY
$9/year
Billed $108 annually, Cancel anytime.
Checkout for $12/month
Checkout for $108/yr
Secured by Stripe | AES-256 bit encryption