My Account
My Slides
Search by Category
Templates
View All Templates
Download Template Slides
Leave Feedback
Login
Logout
Get Started
Browse all Slides
Browse all Slides
Create a FREE Account
Instant access to 1,000+ real slides from top companies like McKinsey, BCG, Goldman Sachs, Google and many more!
First Name
Last Name
Email
Password
I agree to all
Terms & Privacy Policy
Thank you! Your submission has been received!
Oops! Something went wrong while submitting the form.
Have an account?
Sign in
Spark Your Next Big Idea with New Presentation Templates
VIEW ALL Templates
Welcome,
Welcome
PRO
Show Featured Only
Checkbox 8
Companies
Mckinsey
Bain
BCG
EY
Deloitte
Accenture
PwC/Strategy&
JP Morgan
Goldman Sachs
Morgan Stanley
Citigroup
Deutsche Bank
Barclays
LEK
KPMG
Kearney
Oliver Wyman
Booz Allen Hamilton
Gartner
IPSOS
Nielsen
Slide type
Text Only
Linear Flow
Vertical Flow
Single Chart
Header Horizontal
Mixed Chart
Header Vertical
Pillar
Multiple Chart
Graphic
Agenda
Title
Table
Framework
Industry
Technology & Software
Artificial Intelligence
Financial Services
Retail & E-commerce
Consumer Goods
Industrial & Manufacturing
Transportation & Logistics
Telecommunications
Real Estate & Construction
Hospitality & Tourism
Professional Services
Education & Training
Media & Entertainment
Agriculture & Food Production
Healthcare & Pharmaceuticals
Environmental Services & Sustainability
Government & Public Sector
Use Case
Mergers and Acquisitions
Performance Metrics and KPIs
Client Case Studies
Competitive Landscape
Corporate Finance and Valuation
Product and Service Analysis
Customer and Market Segmentation
Organizational Structure and Change
Industry Overview
Regulatory and Compliance
Risk Assessment and Management
Investment Analysis
Organizational Structure and Change
Human Resources and Talent Management
Financial Performance
Market Analysis and Trends
Sales and Business Development
Human Resources and Talent Management
Clear all
Thank you! Your submission has been received!
Oops! Something went wrong while submitting the form.
Tag
View slide
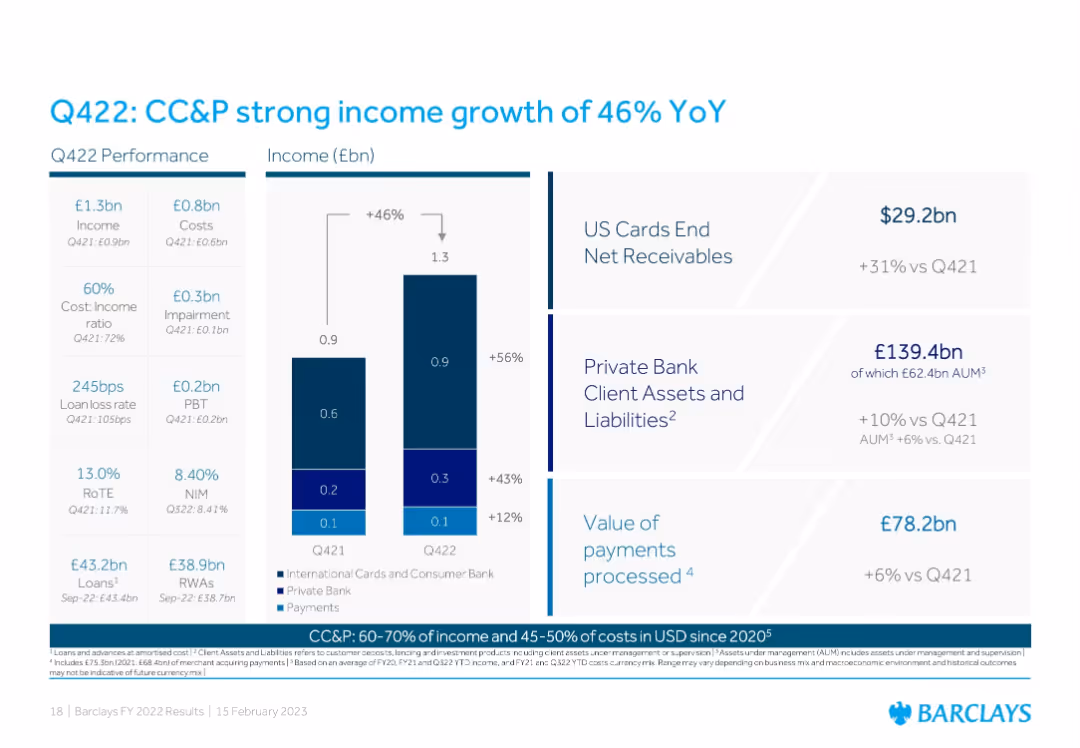
Three-part design: Left has Q422 metrics; center shows YoY income comparison by business area using stacked bars; right provides KPIs like US card receivables, client assets, and payments processed.
Performance Metrics and KPIs
Financial Services
Highlights significant income growth in Consumer, Cards & Payments (CC&P), driven by increased receivables, client assets, and payments. The slide emphasizes cost-income improvements and diversified revenue streams.
CC&P, income growth, payments, private bank, US cards, performance, KPIs, Q422, Barclays
false
Performance Metrics and KPIs
Financial Services financial-services
Mixed Chart
Barclays
View slide
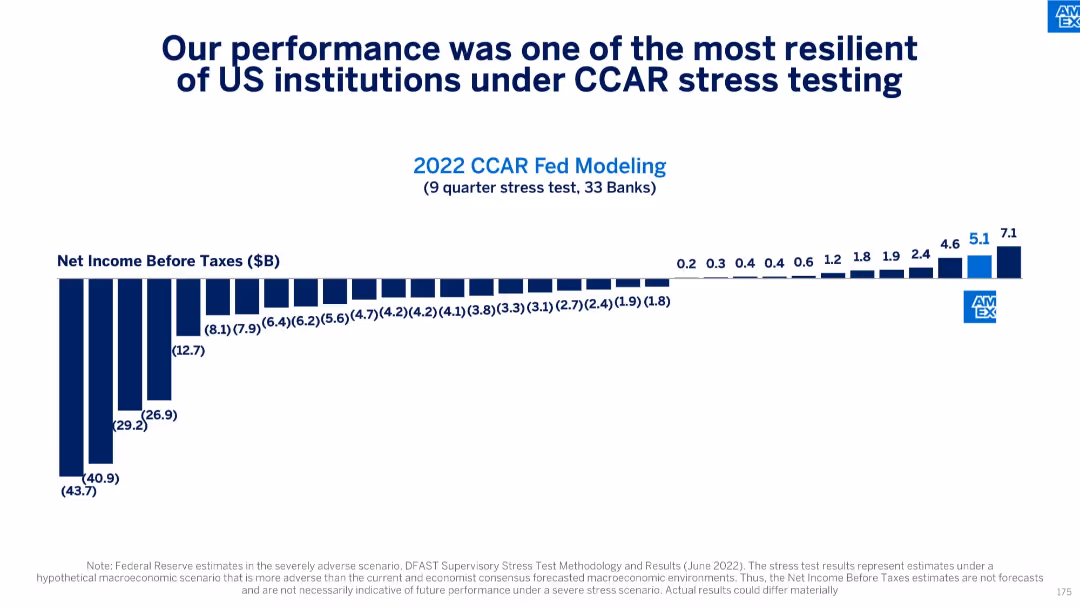
Horizontal bar chart showing Net Income Before Taxes under Fed stress test (2022) for 33 banks
Risk Assessment and Management
Financial Services
Demonstrates American Express’s superior stress-test resilience with the highest modeled net income under Fed CCAR. Indicates strong balance sheet and risk management relative to other U.S. banks.
CCAR, stress testing, net income, financial resilience, Federal Reserve, risk management
false
Risk Assessment and Management
Financial Services financial-services
Single Chart
McKinsey
View slide
The slide contains a stacked column chart representing CCB investments over time, with annotations detailing areas of growth and investment returns. There's also a sidebar with additional notes on investment focus.
Strategic Planning
Financial Services
Slide presents an overview of JP Morgan Chase & Co.'s Consumer & Community Banking (CCB) investments, highlighting areas of growth and expected returns, making it apt for discussing investment strategies and future planning with stakeholders.
CCB investments, JP Morgan Chase, growth areas, investment returns, strategic planning, stakeholder discussions
false
Strategic Planning
Financial Services financial-services
Mixed Chart
JP Morgan
View slide
The slide contains a column chart showing changes in CCB revenue from 2012 to 2022 with different factors labeled.
Financial Performance
Financial Services
It presents a decade-long financial trend analysis of the Consumer and Community Banking revenue, including net interest income forecasts.
CCB, revenue, net interest, forecast, financial trend, 2012-2022, JPMorgan Chase & Co, banking
false
Financial Performance
Financial Services financial-services
Single Chart
JP Morgan
View slide
Column chart comparing the unsubsidized capital costs of retrofitted gas combined cycle plants with CCS and new-build power plants with CCS.
Financial Performance
Energy & Utilities
The slide provides a comparison of capital costs for CCS systems, contrasting retrofit and new-build scenarios without subsidies.
CCS, Capital cost, Retrofit, New-build, Unsubsidized
false
Financial Performance
Energy & Utilities energy-and-utilities
Single Chart
Roland Berger
View slide
Column chart comparing the levelized cost of energy for gas combined cycle plants with CCS, under retrofit and new-build scenarios, with and without subsidies.
Financial Performance
Energy & Utilities
The slide compares the costs of gas combined cycle plants with CCS, analyzing both retrofit and new-build scenarios and showing cost differences due to subsidies.
CCS, Gas combined cycle, Cost analysis, Retrofit, New-build
false
Financial Performance
Energy & Utilities energy-and-utilities
Single Chart
Roland Berger
View slide
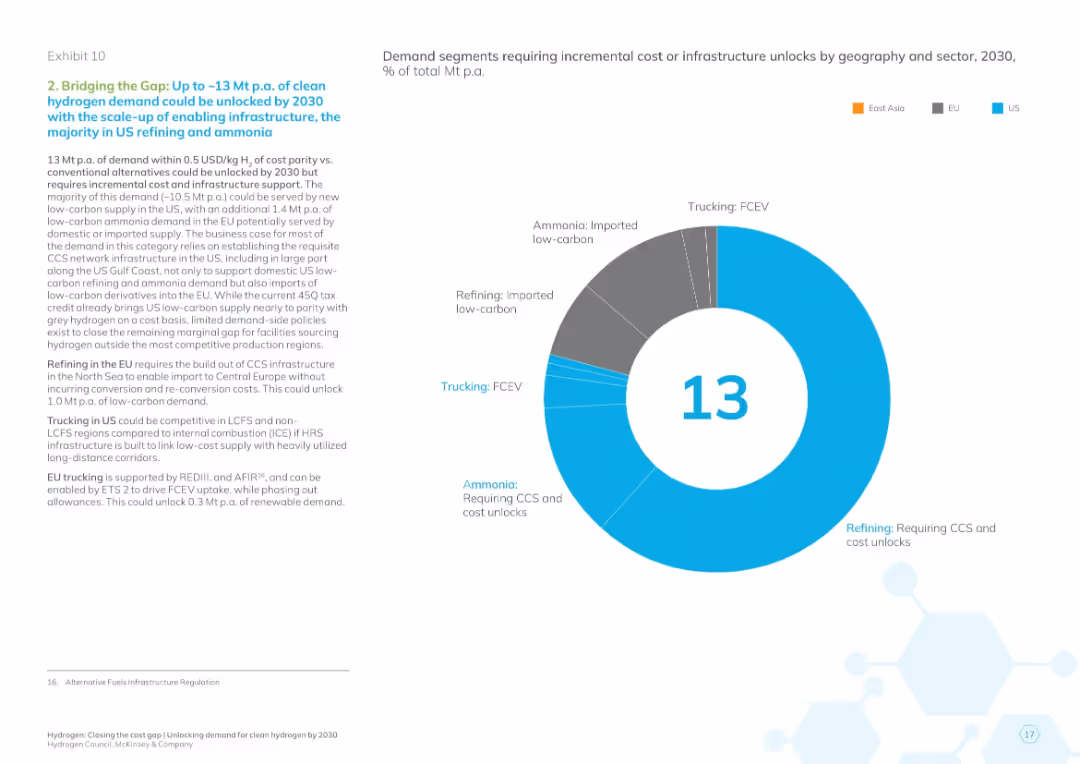
Donut chart of 13 Mt demand by sector and region; text details infrastructure and CCS requirements
Operational Efficiency
Energy & Utilities
This slide focuses on the demand segments that require moderate cost or infrastructure improvements to be viable by 2030. It emphasizes CCS expansion in US and EU for refining, low-carbon ammonia imports, and hydrogen refueling infrastructure for trucking in the US and EU.
CCS, ammonia, infrastructure unlock, cost improvement, hydrogen trucking, refining, 2030 goal, clean energy
false
Operational Efficiency
Energy & Utilities energy-and-utilities
Mixed Chart
McKinsey
View slide
The slide includes two column charts comparing survey responses from 2017 and 2019 regarding the safety and development of CCS. Below the charts is a summary of key findings from the survey.
Market Analysis and Trends
Environmental Services & Sustainability
This slide presents survey results on public perception of Carbon Capture and Storage (CCS) safety and support for its development, recommending increased public outreach to improve awareness and support for CCS initiatives.
CCS, survey, public outreach, safety, support
false
Market Analysis and Trends
Environmental Services & Sustainability environmental-services-and-sustainability
Multiple Chart
Kearney
View slide
The slide features an area chart showing the top 11 CCUS financial contributions from OECD countries from 2004-2019, with annotations indicating significant changes. A legend identifies the countries by color.
Financial Performance
Energy & Utilities
This slide highlights the financial contributions to CCUS by various OECD countries, with the United States being a major contributor. It shows trends in funding, noting the US's decreasing share and the increasing contributions from Japan and Norway.
CCUS funding, OECD, United States, financial contributions
false
Financial Performance
Energy & Utilities energy-and-utilities
Single Chart
Kearney
View slide
The slide includes an area chart showing the top 10 CCUS patents filed by OECD country producers from 1996-2018, with each country represented by a distinct color. Annotations provide context and highlight significant trends.
Financial Performance
Energy & Utilities
This slide details the number of patents filed for CCUS technologies by various OECD countries, showing the United States leading in patent filings. It highlights the competitive landscape in CCUS R&D and the leading contributors over time.
CCUS patents, United States, OECD, R&D, innovation
false
Financial Performance
Energy & Utilities energy-and-utilities
Single Chart
Kearney
View slide
The slide presents a column chart displaying the number of global CCUS projects over time. It includes different colored bars to indicate operational projects, projects in development, etc.
Market Analysis and Trends
Energy & Utilities
It provides an overview of global CCUS projects, showing trends in operational, developmental, cancelled, and completed projects from 1972 to 2030. It highlights the increase and decline phases.
CCUS projects, global overview, operational projects, development projects, cancelled projects, energy, utilities
false
Market Analysis and Trends
Energy & Utilities energy-and-utilities
Single Chart
Kearney
View slide
An image of ADNOC’s Al Reyadah facility with accompanying descriptive captions.
Client Case Studies
Industrial & Manufacturing
Describes ADNOC's Al Reyadah facility as a self-sustaining CCUS project in the iron & steel industry.
CCUS, ADNOC, Al Reyadah, iron, steel, self-sustaining
false
Client Case Studies
Industrial & Manufacturing industrial-and-manufacturing
Linear Flow
Kearney
View slide
The slide presents a combination of column charts and pie charts that forecast CO2 capture and utilization by different industries for the years 2030, 2050, and 2070. Detailed legends and color-coding aid comprehension.
Strategic Planning
Energy & Utilities
This slide forecasts the development of CCUS technologies across multiple industries over the coming decades, indicating a significant increase in CO2 capture and the predominance of storage solutions.
CCUS, CO2 capture, industry forecast, storage solutions, emission reductions
false
Strategic Planning
Energy & Utilities energy-and-utilities
Multiple Chart
Kearney
View slide
The slide shows a detailed value chain diagram for CCUS technologies, covering the entire process from CO2 sources through separation and capture, transport, and utilization/storage. Each segment is clearly labeled and color-coded.
Technology and Digital Transformation
Energy & Utilities
This slide explains the comprehensive value chain of CCUS technologies, detailing each step from CO2 capture to storage and utilization, showcasing the integrated approach needed to abate CO2 emissions.
CCUS, CO2 capture, value chain, transport, utilization, storage
false
Technology and Digital Transformation
Energy & Utilities energy-and-utilities
Linear Flow
Kearney
View slide
A column chart and a bar chart showing potential CO2 emissions reduction from CCUS on thermal power plants.
Market Analysis and Trends
Energy & Utilities
Illustrates the impact of retrofitting power plants with CCUS on reducing CO2 emissions.
CCUS, CO2 reduction, power plants, retrofitting, emissions
false
Market Analysis and Trends
Energy & Utilities energy-and-utilities
Multiple Chart
Kearney
View slide
The slide features a table listing CCUS hubs in Europe with project names, countries, CO2 capacity, and year.
Market Analysis and Trends
Energy & Utilities
The table provides an overview of various CCUS projects in Europe, including their capacities and industries.
CCUS, Europe, hubs, projects, CO2 capacity
false
Market Analysis and Trends
Energy & Utilities energy-and-utilities
Table
Kearney
View slide
The slide contains a table listing leading CCUS countries by capture capacity, number of operational projects, and type of storage.
Industry Overview
Energy & Utilities
Highlights North America's leadership in CCUS projects, detailing capture capacities, number of projects, and storage types for leading countries.
CCUS, North America, global leadership, capture capacity, operational projects, storage types
false
Industry Overview
Energy & Utilities energy-and-utilities
Mixed Chart
Kearney
View slide
Includes a column chart showing the number of CCUS projects dedicated to various industries (chemicals, heavy industries, power generation, hydrogen, oil & gas, clusters).
Market Analysis and Trends
Energy & Utilities
Explores the expansion of CCUS applications to additional large emitting sectors, analyzing the number of projects and their statuses within these industries.
CCUS, application, heavy industries, blue hydrogen, chemicals, project expansion, industry analysis
false
Market Analysis and Trends
Energy & Utilities energy-and-utilities
Mixed Chart
Kearney
View slide
Two column charts depicting the number of large-scale CCUS projects and total capture capacity (Mtpa).
Market Analysis and Trends
Energy & Utilities
Shows the expected increase in CCUS projects and capacity by 2030, indicating significant industry growth.
CCUS, capacity, projects, energy, growth, trends
false
Market Analysis and Trends
Energy & Utilities energy-and-utilities
Multiple Chart
Kearney
View slide
The slide shows a series of line and area charts illustrating various CO2 emission pathways and the required carbon dioxide removal capacities to meet the 1.5°C target. Each pathway is color-coded for clarity.
Technology and Digital Transformation
Energy & Utilities
The slide explains the need for Carbon Capture, Utilization, and Storage (CCUS) technologies to achieve the 1.5°C climate target, showing different emission reduction pathways and their potential impacts.
CCUS, carbon capture, climate target, CO2 removal, emission pathways
false
Technology and Digital Transformation
Energy & Utilities energy-and-utilities
Multiple Chart
Kearney
View slide
The slide features a flowchart diagram that outlines the main pathways of CCUS technologies, including both utilization (CCU) and storage (CCS) processes. Different applications and processes are clearly labeled.
Technology and Digital Transformation
Energy & Utilities
This slide provides a comprehensive overview of the various pathways through which CCUS technologies can either utilize or store carbon dioxide, illustrating the diversity and complexity of these technologies.
CCUS, carbon utilization, carbon storage, pathways, technology overview
false
Technology and Digital Transformation
Energy & Utilities energy-and-utilities
Diagram
Kearney
View slide
A bubble chart showing cement, iron, and steel productions combined with CCUS projects over time.
Market Analysis and Trends
Industrial & Manufacturing
Highlights recent CCUS projects in the cement, iron, and steel industries, and expected future projects.
CCUS, cement, iron, steel, projects, timeline
false
Market Analysis and Trends
Industrial & Manufacturing industrial-and-manufacturing
Single Chart
Kearney
View slide
A bar chart showing the timeline of various cement and iron & steel projects incorporating CCUS technology.
Market Analysis and Trends
Industrial & Manufacturing
Details the timeline and progress of CCUS projects in the cement and iron & steel industries.
CCUS, cement, iron, steel, projects, timeline
false
Market Analysis and Trends
Industrial & Manufacturing industrial-and-manufacturing
Single Chart
Kearney
View slide
The slide includes a scatter plot chart showing upcoming CCUS clusters by operational year and region.
Strategic Planning
Energy & Utilities
This slide shows the expected development of cross-industries CCUS clusters in Europe and North America.
CCUS, clusters, Europe, North America, operational year
false
Strategic Planning
Energy & Utilities energy-and-utilities
Single Chart
Kearney
View slide
A column chart showing the age structure of coal capacity per region as of 2019.
Market Analysis and Trends
Energy & Utilities
Discusses the potential for CCUS development in new coal power plants in China and India.
CCUS, coal power, China, India, development
false
Market Analysis and Trends
Energy & Utilities energy-and-utilities
Mixed Chart
Kearney
View slide
The slide features an area chart showing global energy sector CO2 emission reductions by measure (technology performance, electrification, etc.) up to 2070. The chart is color-coded and has a detailed legend.
Strategic Planning
Energy & Utilities
This slide emphasizes that CCUS technologies need to be combined with other solutions like electrification and technology improvements to decarbonize the energy sector effectively.
CCUS, decarbonization, energy sector, emission reductions, technology solutions
false
Strategic Planning
Energy & Utilities energy-and-utilities
Mixed Chart
Kearney
View slide
The slide shows a table listing various sectors (e.g., agriculture, industry) and their respective gross estimates of greenhouse gas emissions with potential CCUS applications. Different stages of technology maturity are also indicated.
Technology and Digital Transformation
Energy & Utilities
This slide outlines how CCUS technology can significantly reduce CO2 emissions in key sectors responsible for large amounts of greenhouse gases, highlighting its critical role in achieving emission targets.
CCUS, decarbonization, sectors, CO2 emissions, technology maturity
false
Technology and Digital Transformation
Energy & Utilities energy-and-utilities
Single Chart
Kearney
View slide
The slide features a world map highlighting the locations of CCUS facilities, using color-coded dots to indicate their status (operational, in development, etc.).
Industry Overview
Energy & Utilities
Describes the global distribution of CCUS projects, highlighting the USA as the leader. Details the operational status and geographic spread of these facilities.
CCUS, facilities, global distribution, USA, development, operational, North America, Middle East, Europe
false
Industry Overview
Energy & Utilities energy-and-utilities
Graphic
Kearney
View slide
The slide includes a table matrix showing various heavy industries (e.g., cement, steel) and the potential application of CCUS and other decarbonization technologies. Each cell is color-coded to indicate the maturity of the technology.
Risk Assessment and Management
Industrial & Manufacturing
This slide discusses the importance of CCUS for heavy industries that are hard to decarbonize, showing the potential and maturity of different technologies that can be applied to reduce emissions in these sectors.
CCUS, heavy industries, decarbonization, technology maturity, emission reductions
false
Risk Assessment and Management
Industrial & Manufacturing industrial-and-manufacturing
Table
Kearney
View slide
A bubble chart showing hydrogen production combined with CCUS projects for various industrial applications.
Market Analysis and Trends
Energy & Utilities
Discusses the development of CCUS for blue hydrogen production and its industrial applications.
CCUS, hydrogen, production, industrial, applications
false
Market Analysis and Trends
Energy & Utilities energy-and-utilities
Single Chart
Kearney
Previous
Loading...
Hold On!
We are searching in our database
If nothing, comes up, please try different filters!
Column Chart
Heatmap
Chevron
Org Chart
Infographic
Callouts
Timeline
List
Graphic
Picture
Process Flow
Diagram
Paragraph
Map
Table
Framework
Subtitle
Takeaway Box
Icon
Other Chart
Radar Chart
Waterfall Chart
Mekko Chart
Pie Chart
Scatter Plot
Line Chart
Bar chart
Bullet points
Create a FREE account to continue browsing
Receive Instant Access to 1,000+ slides from companies like McKinsey, Google, and Goldman Sachs
First Name
Last Name
Email
Password
I agree to all
Terms & Privacy Policy
Thank you! Your submission has been received!
Oops! Something went wrong while submitting the form.
Have an account?
Sign in
Upgrade to PRO to Save slides
Advanced Search and Filters
Access to 15,000+ slides
Access to Category Pages
Save/Bookmark Slides
PowerPoint Template Library
Pick a Plan
MONTHLY
$12/month
Billed every month, Cancel anytime.
YEARLY
$9/year
Billed $108 annually, Cancel anytime.
Checkout for $12/month
Checkout for $108/yr
Secured by Stripe | AES-256 bit encryption