My Account
My Slides
Search by Category
Templates
View All Templates
Download Template Slides
Leave Feedback
Login
Logout
Get Started
Browse all Slides
Browse all Slides
Create a FREE Account
Instant access to 1,000+ real slides from top companies like McKinsey, BCG, Goldman Sachs, Google and many more!
First Name
Last Name
Email
Password
I agree to all
Terms & Privacy Policy
Thank you! Your submission has been received!
Oops! Something went wrong while submitting the form.
Have an account?
Sign in
Spark Your Next Big Idea with New Presentation Templates
VIEW ALL Templates
Welcome,
Welcome
PRO
Show Featured Only
Checkbox 8
Companies
Mckinsey
Bain
BCG
EY
Deloitte
Accenture
PwC/Strategy&
JP Morgan
Goldman Sachs
Morgan Stanley
Citigroup
Deutsche Bank
Barclays
LEK
KPMG
Kearney
Oliver Wyman
Booz Allen Hamilton
Gartner
IPSOS
Nielsen
Slide type
Text Only
Linear Flow
Vertical Flow
Single Chart
Header Horizontal
Mixed Chart
Header Vertical
Pillar
Multiple Chart
Graphic
Agenda
Title
Table
Framework
Industry
Technology & Software
Artificial Intelligence
Financial Services
Retail & E-commerce
Consumer Goods
Industrial & Manufacturing
Transportation & Logistics
Telecommunications
Real Estate & Construction
Hospitality & Tourism
Professional Services
Education & Training
Media & Entertainment
Agriculture & Food Production
Healthcare & Pharmaceuticals
Environmental Services & Sustainability
Government & Public Sector
Use Case
Mergers and Acquisitions
Performance Metrics and KPIs
Client Case Studies
Competitive Landscape
Corporate Finance and Valuation
Product and Service Analysis
Customer and Market Segmentation
Organizational Structure and Change
Industry Overview
Regulatory and Compliance
Risk Assessment and Management
Investment Analysis
Organizational Structure and Change
Human Resources and Talent Management
Financial Performance
Market Analysis and Trends
Sales and Business Development
Human Resources and Talent Management
Clear all
Thank you! Your submission has been received!
Oops! Something went wrong while submitting the form.
Tag
View slide
Features a timeline depicting the stages of CCUS development from early stage to possible mature industry, with key milestones and activities for each stage.
Strategic Planning
Energy & Utilities
Discusses the industrialization of CCUS deployment, outlining the progression from early-stage projects to larger, more mature industry clusters, and future development goals.
CCUS, industrialization, development stages, project clusters, timeline, strategic planning, future goals
false
Strategic Planning
Energy & Utilities energy-and-utilities
Linear Flow
Kearney
View slide
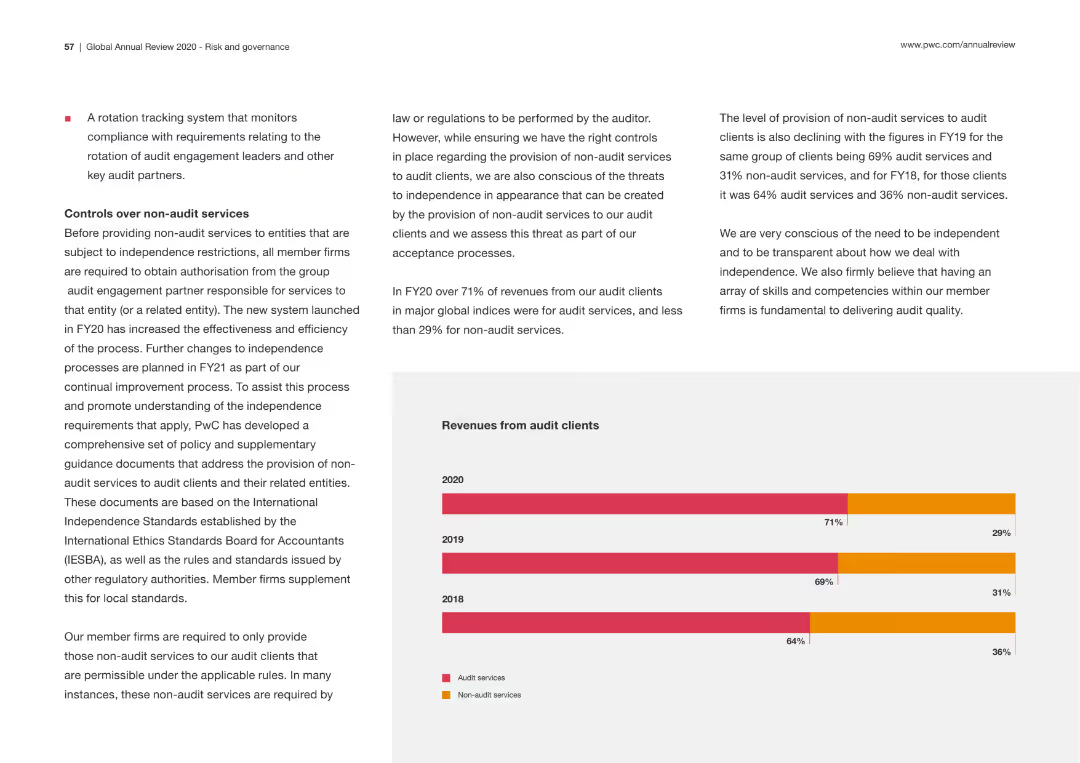
Column chart and projected figures indicating global annual investment in CCUS technology, highlighting the substantial financial commitment required by 2040.
Strategic Planning
Environmental Services & Sustainability
Focuses on the financial implications of investing in carbon capture and storage, projecting significant investment needs by 2040 to meet global sustainability goals.
CCUS, investment, sustainability, 2040, finance
false
Strategic Planning
Environmental Services & Sustainability environmental-services-and-sustainability
Single Chart
BCG
View slide
This slide has a column chart showing the potential CO2 capture capacity of current announced projects compared to the IEA SDS objectives by 2030. The gap is highlighted in red for emphasis.
Market Analysis and Trends
Energy & Utilities
The slide reveals that current CCUS projects are insufficient to meet the net-zero targets, indicating that the pipeline of projects needs to increase significantly to close the gap by 2030.
CCUS, net zero, CO2 capture, project pipeline, IEA objectives
false
Market Analysis and Trends
Energy & Utilities energy-and-utilities
Multiple Chart
Kearney
View slide
Features a line graph showing the size of carbon capture projects per industry application (1972-2030), with various industries color-coded.
Industry Overview
Energy & Utilities
Analyzes the development of CCUS projects across different industries over time, highlighting oil & gas, power generation, and other sectors leading in CCUS initiatives.
CCUS, oil & gas, power generation, industry application, carbon capture, development trends
false
Industry Overview
Energy & Utilities energy-and-utilities
Mixed Chart
Kearney
View slide
The slide features a timeline chart showing the political attractiveness curve for CCUS policies from 1996 to 2020, including significant events and milestones.
Regulatory and Compliance
Government & Public Sector
The slide depicts the political support trajectory for CCUS policies from 1996 to 2020. It highlights key events, policy milestones, and shifts in support over time, showing how political attitudes towards CCUS have evolved and the impact of various external factors on this support.
CCUS, political support, timeline, policies
false
Regulatory and Compliance
Government & Public Sector government-and-public-sector
Single Chart
Kearney
View slide
A bubble chart displaying power generation combined with CCUS projects over time.
Market Analysis and Trends
Energy & Utilities
Emphasizes the role of CCUS in retrofitting various power plants to reduce CO2 emissions.
CCUS, power generation, emissions, retrofit, biomass
false
Market Analysis and Trends
Energy & Utilities energy-and-utilities
Single Chart
Kearney
View slide
The slide contains two column charts illustrating the increase in levelized cost of energy production for coal and natural gas power plants with various CO2 capture rates.
Market Analysis and Trends
Energy & Utilities
The slide details how applying CCUS to power plants increases the levelized cost of production, with moderate impacts from higher capture rates. The left chart shows cost increases for coal, and the right for natural gas, highlighting the additional cost burden at different capture rates.
CCUS, power plants, production cost, CO2
false
Market Analysis and Trends
Energy & Utilities energy-and-utilities
Multiple Chart
Kearney
View slide
A bar chart showing the timeline of various power plant projects incorporating CCUS technology.
Market Analysis and Trends
Energy & Utilities
Details the timeline and progress of power plant projects using CCUS equipment for emissions reduction.
CCUS, power plants, projects, timeline, emissions
false
Market Analysis and Trends
Energy & Utilities energy-and-utilities
Single Chart
Kearney
View slide
Displays a column chart indicating the median CO2 capture capacities of projects (in Mtpa) by region and status (in development, operational, completed, cancelled).
Strategic Planning
Energy & Utilities
Projects significant growth in the size of CCUS projects globally. Provides insights into the future capacities and development of various regions' CCUS initiatives.
CCUS, project size, growth, future development, CO2 capture, regional analysis, strategic planning, trends
false
Strategic Planning
Energy & Utilities energy-and-utilities
Mixed Chart
Kearney
View slide
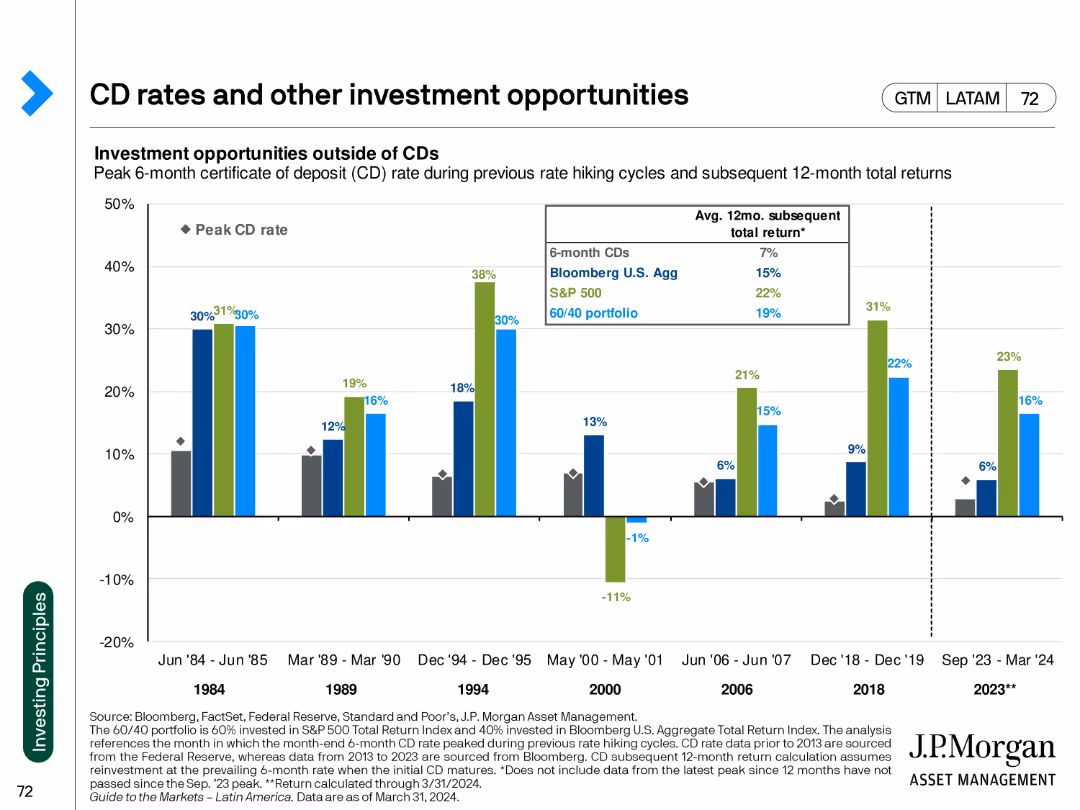
The slide includes a column chart comparing the returns of CDs to other investment opportunities, with historical data for context.
Investment Analysis
Financial Services
The slide evaluates the performance of certificates of deposit (CDs) against other investment options, highlighting potential returns during various market cycles.
CD rates, investment opportunities, historical returns, market analysis, financial comparison, investment strategies, performance metrics
false
Investment Analysis
Financial Services financial-services
Single Chart
JP Morgan
View slide
Bar chart compares the prevalence of CDO roles by digital maturity of the organization.
Organizational Structure and Change
Technology & Software
Examines the trend of appointing Chief Digital Officers in companies at different stages of digital maturity.
CDO, digital transformation, digital maturity, leadership roles, organizational change
false
Organizational Structure and Change
Technology & Software technology-and-software
Multiple Chart
BCG
View slide
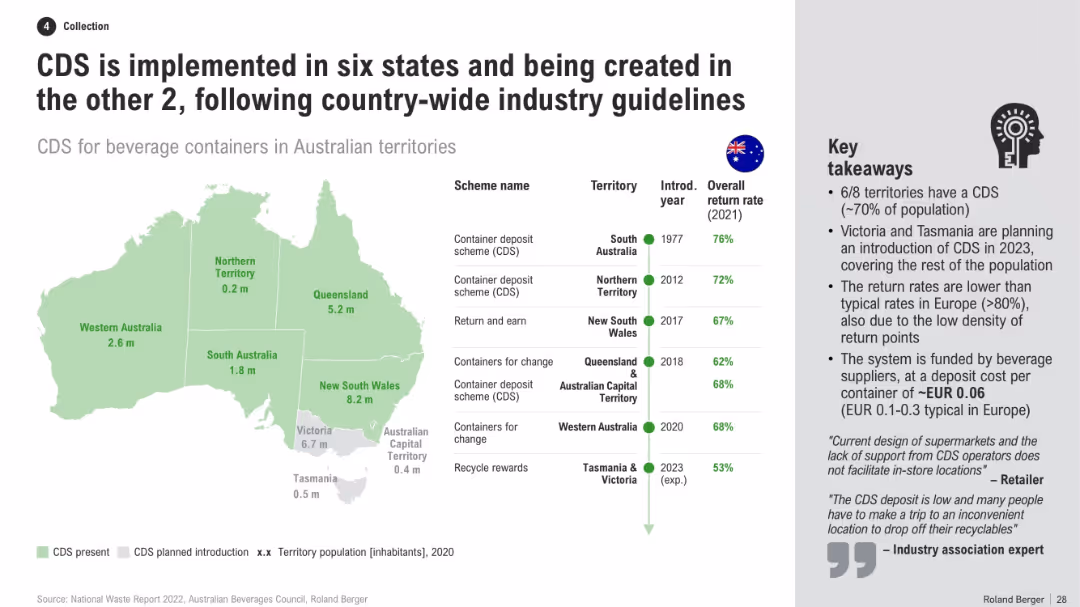
Australia map with CDS presence by state, table of schemes and return rates, and a list of key takeaways
Regulatory and Compliance
Environmental Services & Sustainability
This slide presents a national overview of CDS adoption across Australian territories, including return rates, scheme names, and timelines. It notes that Victoria and Tasmania will close remaining gaps, while explaining reasons for lower return rates vs. Europe.
CDS implementation, Australia map, recycling policy, return rates, state programs, container scheme, beverage recycling
false
Regulatory and Compliance
Environmental Services & Sustainability environmental-services-and-sustainability
Mixed Chart
Roland Berger
View slide
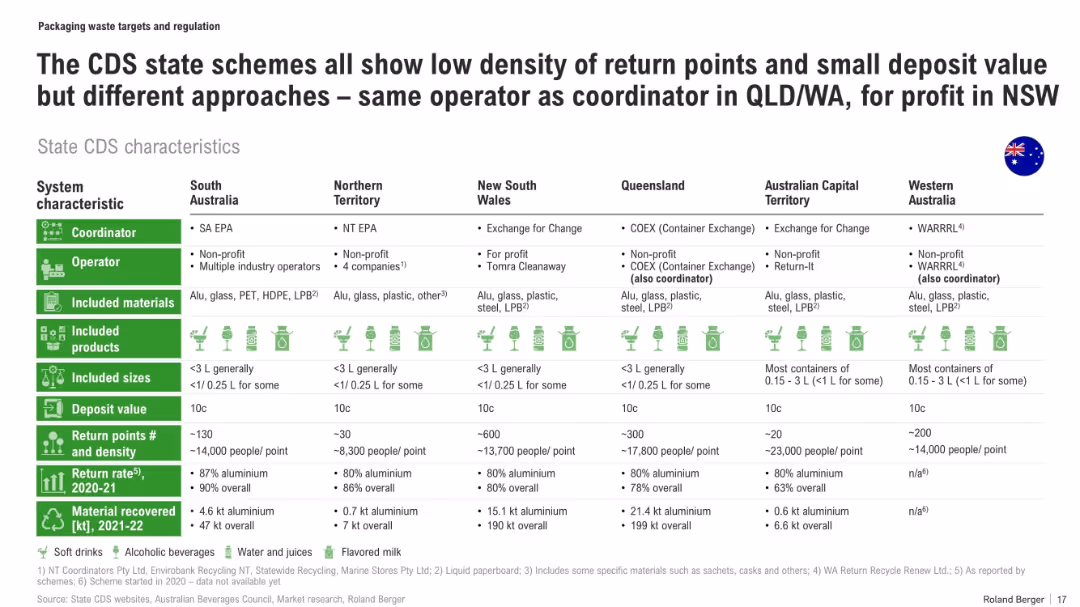
Comparative table of CDS schemes across states with icons, return rates, deposit values, and material recovery volumes
Regulatory and Compliance
Environmental Services & Sustainability
This slide compares state-level CDS (Container Deposit Scheme) characteristics in Australia, including coordinator/operator type, deposit values, material types, return infrastructure density, and recovery performance. It notes disparities in system efficiency and material recovery volumes across regions.
CDS, recycling, deposit schemes, container recovery, state comparison, aluminium, waste infrastructure
false
Regulatory and Compliance
Environmental Services & Sustainability environmental-services-and-sustainability
Table
Roland Berger
View slide
This slide has high visual complexity with a flow diagram illustrating the components of Continuous Emissions Monitoring Systems (CEMS) and their operation. Accompanying text explains the benefits of CEMS in detail.
Technology and Digital Transformation
Industrial & Manufacturing
The slide presents an in-depth look at Continuous Emissions Monitoring Systems, explaining their operation, the benefits of such systems, and their importance in regulatory compliance and process optimization. It showcases how CEMS can improve efficiency and reduce emissions by providing accurate, real-time data on gas emissions.
CEMS, Emissions monitoring, Real-time data, Process optimization, Regulatory compliance
false
Technology and Digital Transformation
Industrial & Manufacturing industrial-and-manufacturing
Diagram
LEK
View slide
A column chart compares actions taken by CEOs most impacted by supply chain disruptions versus all CEOs. Commentary and statistics are provided on the right.
Strategic Planning
Transportation & Logistics
The slide focuses on the specific actions taken by CEOs who feel most impacted by supply chain disruptions, such as diversifying the value chain and conducting vulnerability assessments.
CEO actions, supply chain, disruptions, resilience, strategic planning
false
Strategic Planning
Transportation & Logistics transportation-and-logistics
Mixed Chart
Accenture
View slide
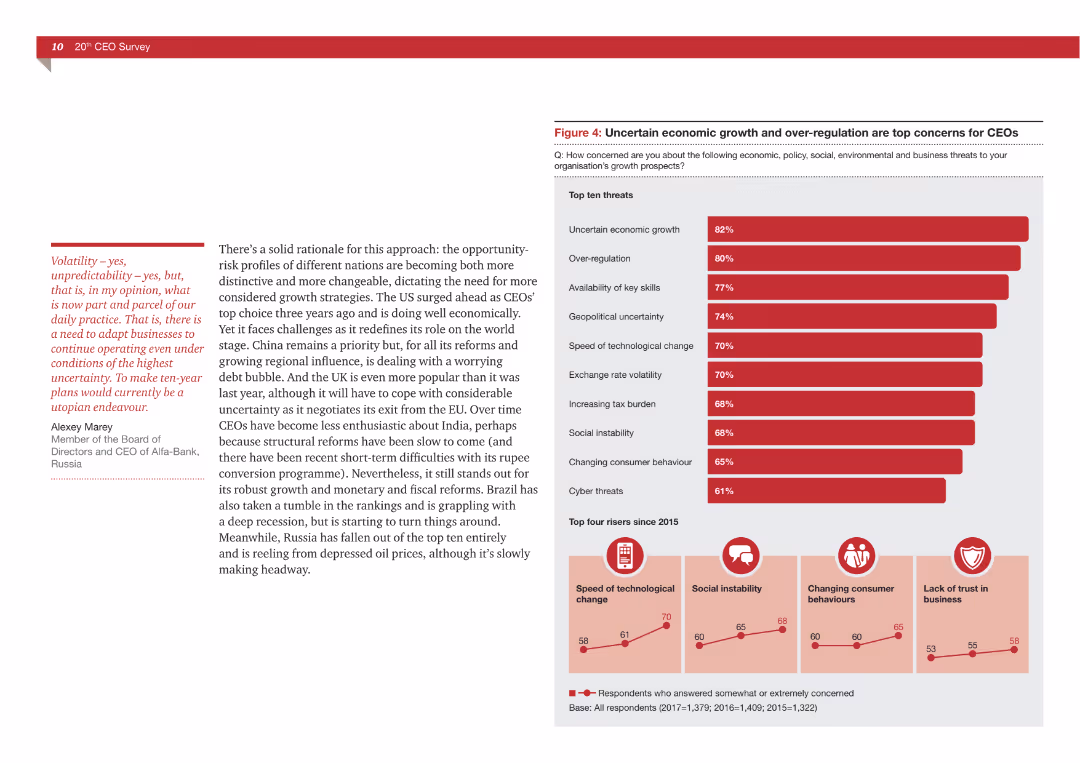
Text and a bar chart showing top concerns for CEOs, with economic and regulatory issues being predominant.
Risk Assessment and Management
Professional Services
The slide details the primary threats CEOs perceive for business growth, emphasizing economic and regulatory challenges.
CEO concerns, economic growth, regulatory issues, risk management, business threats
false
Risk Assessment and Management
Professional Services professional-services
Multiple Chart
PwC/Strategy&
View slide
Consists of two bar chart columns comparing the top 15 threats to economic growth in 2019 and 2020, with an adjacent text box posing a key question to CEOs.
Risk Assessment and Management
Financial Services
Showcases CEOs' concerns regarding uncertain economic growth, trade conflicts, and other global disharmonies impacting growth prospects.
CEO concerns, economic growth, trade conflicts, threats, disharmonies
false
Risk Assessment and Management
Financial Services financial-services
Multiple Chart
PwC/Strategy&
View slide
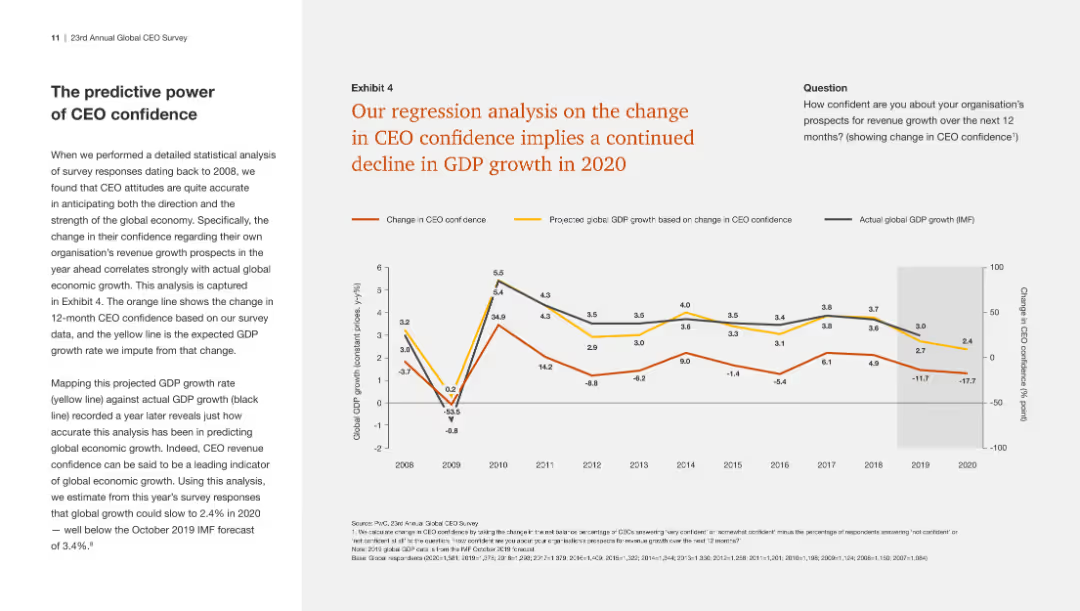
The slide has a line chart showing a regression analysis of CEO confidence and projected GDP growth, indicating a continued decline in GDP growth based on changing confidence.
Market Analysis and Trends
Financial Services
This slide presents a regression analysis showing a direct correlation between declining CEO confidence and projected GDP growth, predicting further economic downturn in 2020.
CEO confidence, GDP growth, regression analysis, economic projection
false
Market Analysis and Trends
Financial Services financial-services
Mixed Chart
PwC/Strategy&
View slide
Features two line graphs overlapping, with one indicating the change in CEO confidence and the other showing projected and actual global GDP growth, accompanied by explanatory text.
Risk Assessment and Management
Financial Services
Details a regression analysis showing the predictive relationship between CEO confidence and GDP growth, implying a continued GDP decline in 2020.
CEO confidence, GDP growth, regression analysis, prediction, decline
false
Risk Assessment and Management
Financial Services financial-services
Mixed Chart
PwC/Strategy&
View slide
This slide contains a complex combination of line charts and bar graphs displaying CEO confidence levels and global economic growth trends, with annotations and a key question section on the right side.
Market Analysis and Trends
Financial Services
Analyzes CEO confidence in relation to global economic growth, showing trends over several years and indicating a decline in confidence not seen since 2009.
CEO confidence, economic growth, revenue, decline, survey, 2009
false
Market Analysis and Trends
Financial Services financial-services
Mixed Chart
PwC/Strategy&
View slide
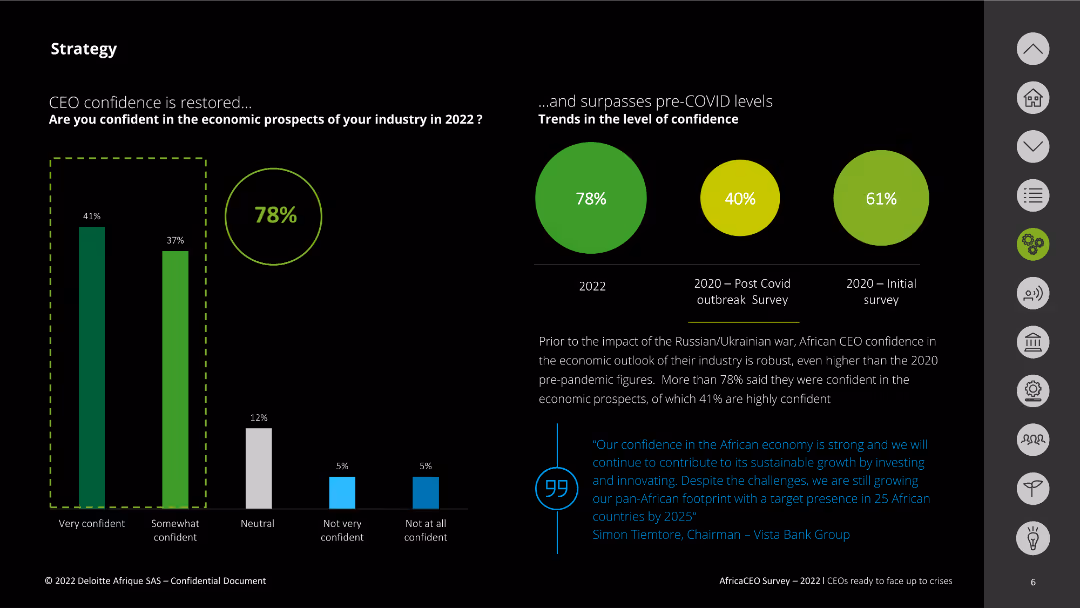
Vertical column chart showing CEO confidence in economic prospects by confidence level, and pie charts showing trends in confidence over time.
Strategic Planning
Financial Services
It discusses CEO confidence in economic prospects for 2022, comparing it with post-COVID and initial survey results, highlighting restored confidence.
CEO confidence, economic prospects, Deloitte, 2022, strategic planning, column chart, pie chart
false
Strategic Planning
Financial Services financial-services
Multiple Chart
Deloitte
View slide
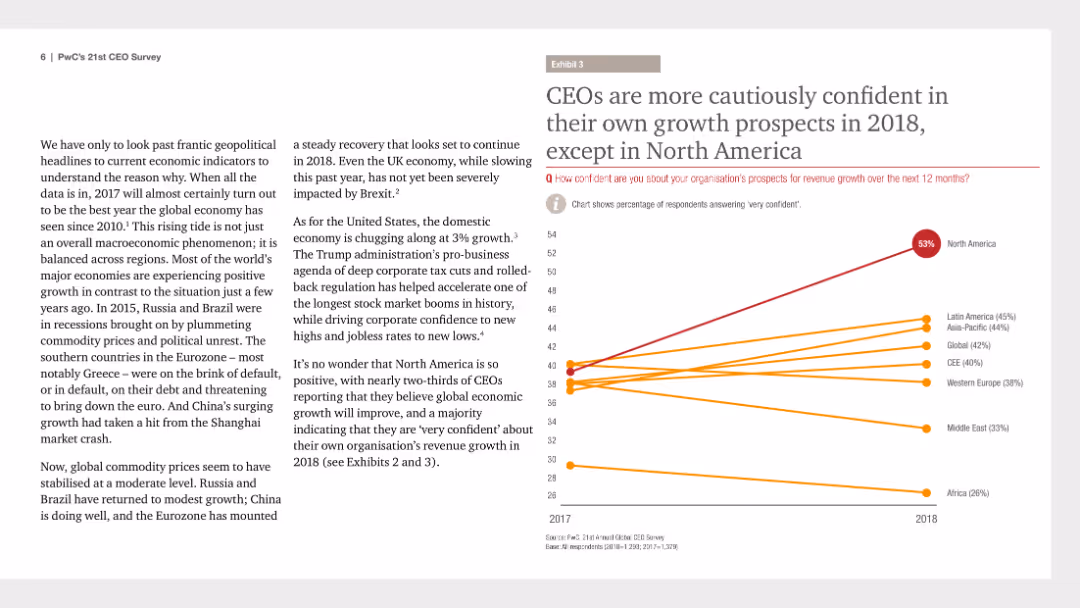
This slide includes a line chart that tracks CEO confidence in their organization's growth prospects from 2017 to 2018, with lines representing different regions.
Strategic Planning
Financial Services
The slide highlights CEO confidence levels regarding their own growth prospects for 2018 compared to 2017, emphasizing caution in most regions except North America.
CEO confidence, growth prospects, 2018, strategic planning, regional comparison, line chart, PwC, CEO Survey, cautious optimism
false
Strategic Planning
Financial Services financial-services
Mixed Chart
PwC/Strategy&
View slide
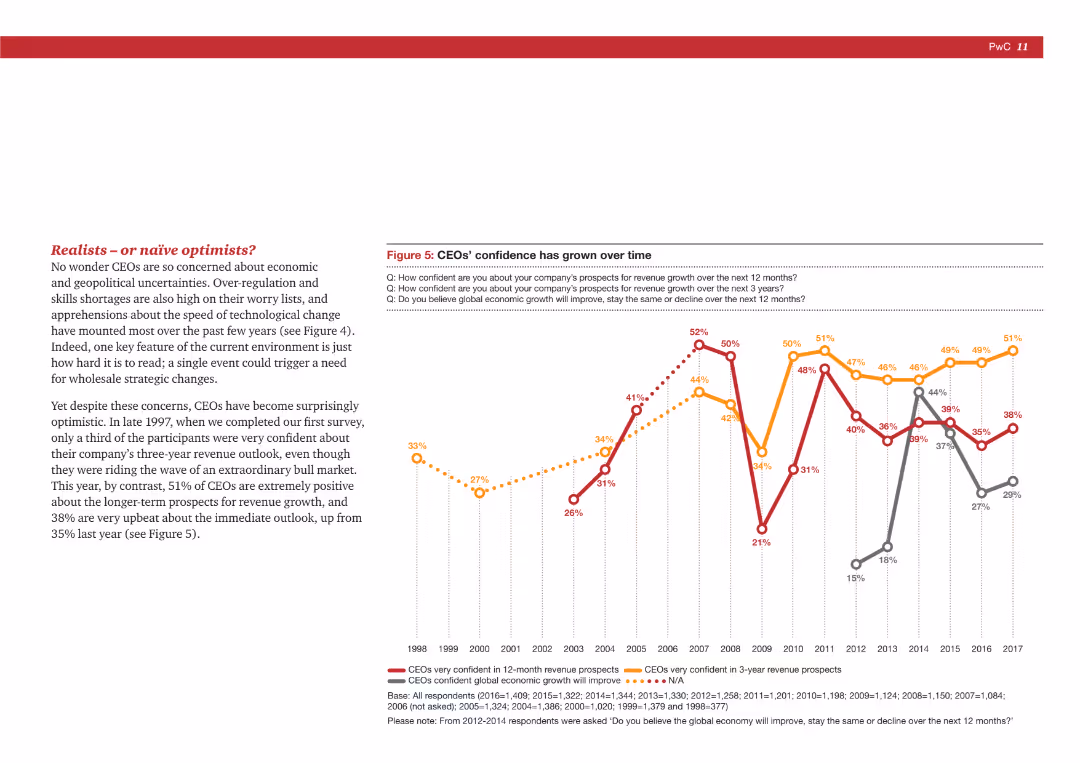
A mix of text and a line chart showing the change in CEOs' confidence over time regarding revenue growth and economic outlook.
Market Analysis and Trends
Professional Services
The slide tracks the historical confidence of CEOs in their company's revenue growth and the global economy, showing trends from 1998 to 2017.
CEO confidence, revenue growth, economic outlook, historical trends, market analysis
false
Market Analysis and Trends
Professional Services professional-services
Mixed Chart
PwC/Strategy&
View slide
It pairs a textual analysis of CEO confidence with a line chart. The chart tracks CEO confidence over the years, with a focus on the next 12 months and next three years. The design is clear and easy to follow.
Market Analysis and Trends
Professional Services
This slide analyzes the rebound in CEO confidence post-2020, showcasing a survey that indicates a shift towards more positive revenue growth expectations. It includes a historical comparison to pre-pandemic levels, providing insight into the evolving sentiment among business leaders regarding economic prospects.
CEO confidence, revenue growth, economic recovery, survey analysis
false
Market Analysis and Trends
Professional Services professional-services
Mixed Chart
PwC/Strategy&
View slide
This slide features a line chart depicting changes in CEO confidence levels for revenue growth over the next 12 months and three years. The chart uses two color lines to differentiate the timeframes. A text block on the left provides context.
Market Analysis and Trends
Professional Services
The slide analyzes the declining confidence levels among CEOs regarding their organization's revenue growth prospects, with a focus on the impacts of external factors and market conditions.
CEO confidence, revenue growth, market analysis, trends, external factors
false
Market Analysis and Trends
Professional Services professional-services
Mixed Chart
PwC/Strategy&
View slide
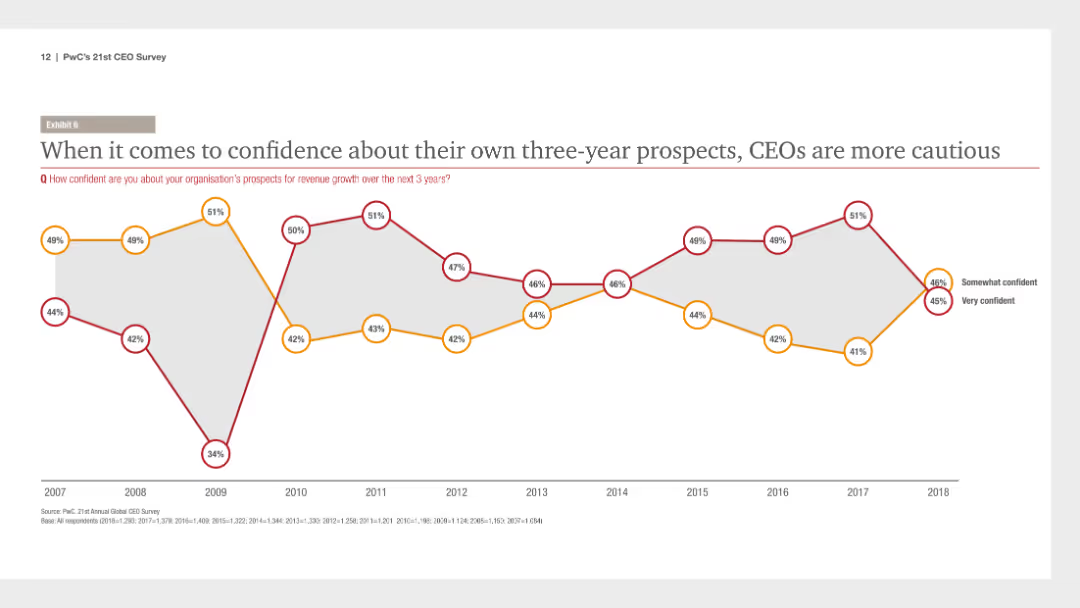
The slide includes a line chart showing CEO confidence levels about their organization's three-year growth prospects, with lines representing "somewhat confident" and "very confident".
Strategic Planning
Financial Services
It emphasizes a cautious outlook among CEOs regarding their organization's three-year growth prospects, with confidence levels fluctuating over the years.
CEO confidence, three-year prospects, cautious outlook, strategic planning, line chart, PwC, CEO Survey, confidence levels
false
Strategic Planning
Financial Services financial-services
Single Chart
PwC/Strategy&
View slide
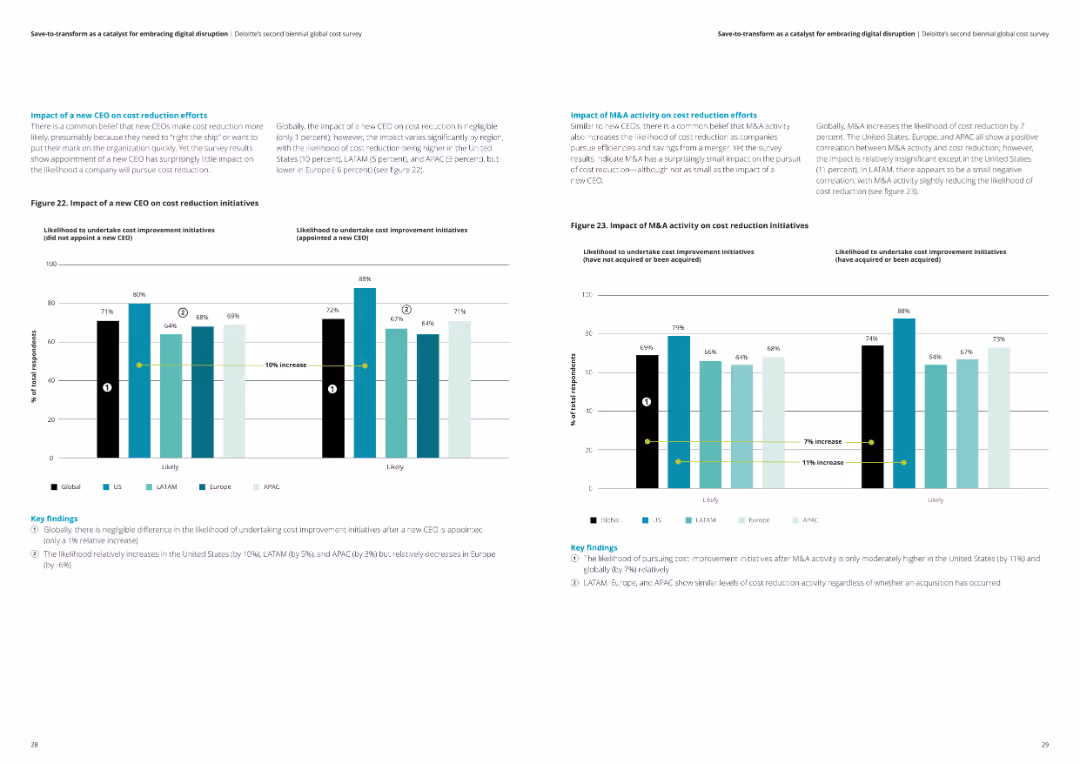
The slide features two column charts comparing the impact of a new CEO and M&A activity on cost reduction initiatives across various regions. Key findings are presented in text boxes.
Strategic Planning
Financial Services
The slide analyzes how the appointment of a new CEO and M&A activity affect cost reduction efforts globally and regionally, highlighting differences in likelihood and impact.
CEO impact, M&A activity, cost reduction, analysis, financial services
false
Strategic Planning
Financial Services financial-services
Multiple Chart
Deloitte
View slide
Split-screen design with photo of a CEO on the left and infographic pie charts with text explanations on the right
Strategic Planning
Professional Services
Highlights CEO perspectives on corporate purpose during COVID-19. Most CEOs report stronger emotional connection to purpose and its role in decision-making. Includes direct quote from Alison Rose and data from KPMG 2020 CEO Outlook.
CEO insights, COVID-19, corporate purpose, stakeholder needs, leadership, emotional connection, decision-making, KPMG, quote, Alison Rose
false
Strategic Planning
Professional Services professional-services
Mixed Chart
KPMG
View slide
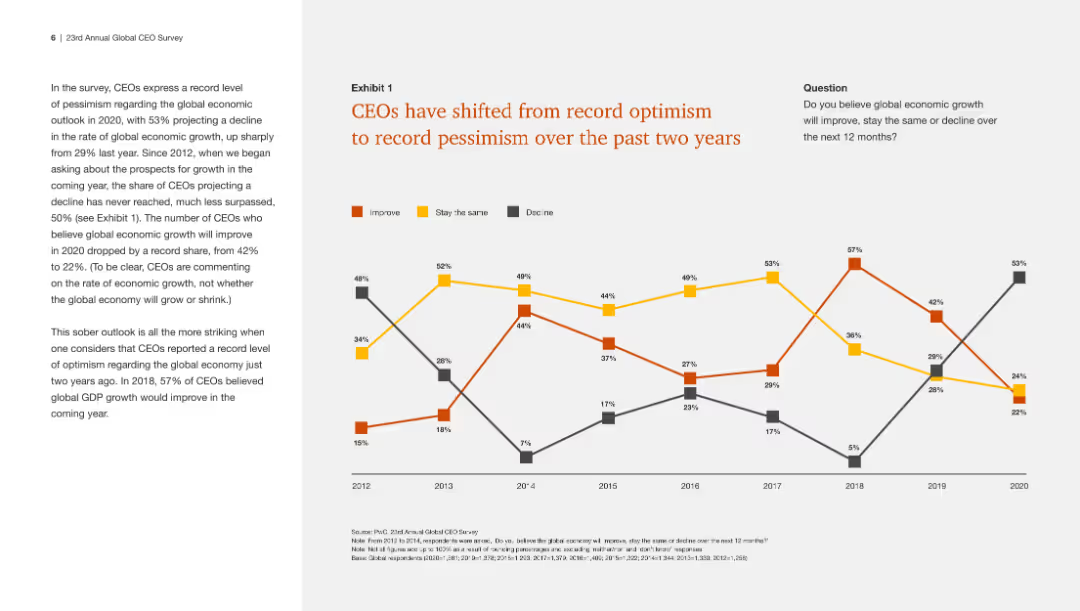
The slide includes a line chart showing changes in CEO optimism and pessimism about global economic growth from 2012 to 2020, indicating a significant rise in pessimism.
Market Analysis and Trends
Financial Services
This slide analyzes the dramatic shift in CEOs' economic outlook, highlighting a steep increase in pessimism about global economic growth over the past two years.
CEO optimism, pessimism, economic growth, trends, analysis
false
Market Analysis and Trends
Financial Services financial-services
Mixed Chart
PwC/Strategy&
View slide
The slide juxtaposes text explanations with a column chart, displaying a historical survey of CEO beliefs about global economic growth. The design is simple with clear differentiation between the textual and graphical information.
Market Analysis and Trends
Professional Services
The slide depicts the optimism of CEOs regarding global economic improvement, backed by historical survey data. The bar graph shows a significant rise in positive outlook, setting a historical context to understand current and future CEO sentiments in the business world.
CEO outlook, global economy, economic growth, survey data
false
Market Analysis and Trends
Professional Services professional-services
Mixed Chart
PwC/Strategy&
Previous
Loading...
Hold On!
We are searching in our database
If nothing, comes up, please try different filters!
Column Chart
Heatmap
Chevron
Org Chart
Infographic
Callouts
Timeline
List
Graphic
Picture
Process Flow
Diagram
Paragraph
Map
Table
Framework
Subtitle
Takeaway Box
Icon
Other Chart
Radar Chart
Waterfall Chart
Mekko Chart
Pie Chart
Scatter Plot
Line Chart
Bar chart
Bullet points
Create a FREE account to continue browsing
Receive Instant Access to 1,000+ slides from companies like McKinsey, Google, and Goldman Sachs
First Name
Last Name
Email
Password
I agree to all
Terms & Privacy Policy
Thank you! Your submission has been received!
Oops! Something went wrong while submitting the form.
Have an account?
Sign in
Upgrade to PRO to Save slides
Advanced Search and Filters
Access to 15,000+ slides
Access to Category Pages
Save/Bookmark Slides
PowerPoint Template Library
Pick a Plan
MONTHLY
$12/month
Billed every month, Cancel anytime.
YEARLY
$9/year
Billed $108 annually, Cancel anytime.
Checkout for $12/month
Checkout for $108/yr
Secured by Stripe | AES-256 bit encryption