My Account
My Slides
Search by Category
Templates
View All Templates
Download Template Slides
Leave Feedback
Login
Logout
Get Started
Browse all Slides
Browse all Slides
Create a FREE Account
Instant access to 1,000+ real slides from top companies like McKinsey, BCG, Goldman Sachs, Google and many more!
First Name
Last Name
Email
Password
I agree to all
Terms & Privacy Policy
Thank you! Your submission has been received!
Oops! Something went wrong while submitting the form.
Have an account?
Sign in
Spark Your Next Big Idea with New Presentation Templates
VIEW ALL Templates
Welcome,
Welcome
PRO
Show Featured Only
Checkbox 8
Companies
Mckinsey
Bain
BCG
EY
Deloitte
Accenture
PwC/Strategy&
JP Morgan
Goldman Sachs
Morgan Stanley
Citigroup
Deutsche Bank
Barclays
LEK
KPMG
Kearney
Oliver Wyman
Booz Allen Hamilton
Gartner
IPSOS
Nielsen
Slide type
Text Only
Linear Flow
Vertical Flow
Single Chart
Header Horizontal
Mixed Chart
Header Vertical
Pillar
Multiple Chart
Graphic
Agenda
Title
Table
Framework
Industry
Technology & Software
Artificial Intelligence
Financial Services
Retail & E-commerce
Consumer Goods
Industrial & Manufacturing
Transportation & Logistics
Telecommunications
Real Estate & Construction
Hospitality & Tourism
Professional Services
Education & Training
Media & Entertainment
Agriculture & Food Production
Healthcare & Pharmaceuticals
Environmental Services & Sustainability
Government & Public Sector
Use Case
Mergers and Acquisitions
Performance Metrics and KPIs
Client Case Studies
Competitive Landscape
Corporate Finance and Valuation
Product and Service Analysis
Customer and Market Segmentation
Organizational Structure and Change
Industry Overview
Regulatory and Compliance
Risk Assessment and Management
Investment Analysis
Organizational Structure and Change
Human Resources and Talent Management
Financial Performance
Market Analysis and Trends
Sales and Business Development
Human Resources and Talent Management
Clear all
Thank you! Your submission has been received!
Oops! Something went wrong while submitting the form.
Tag
View slide
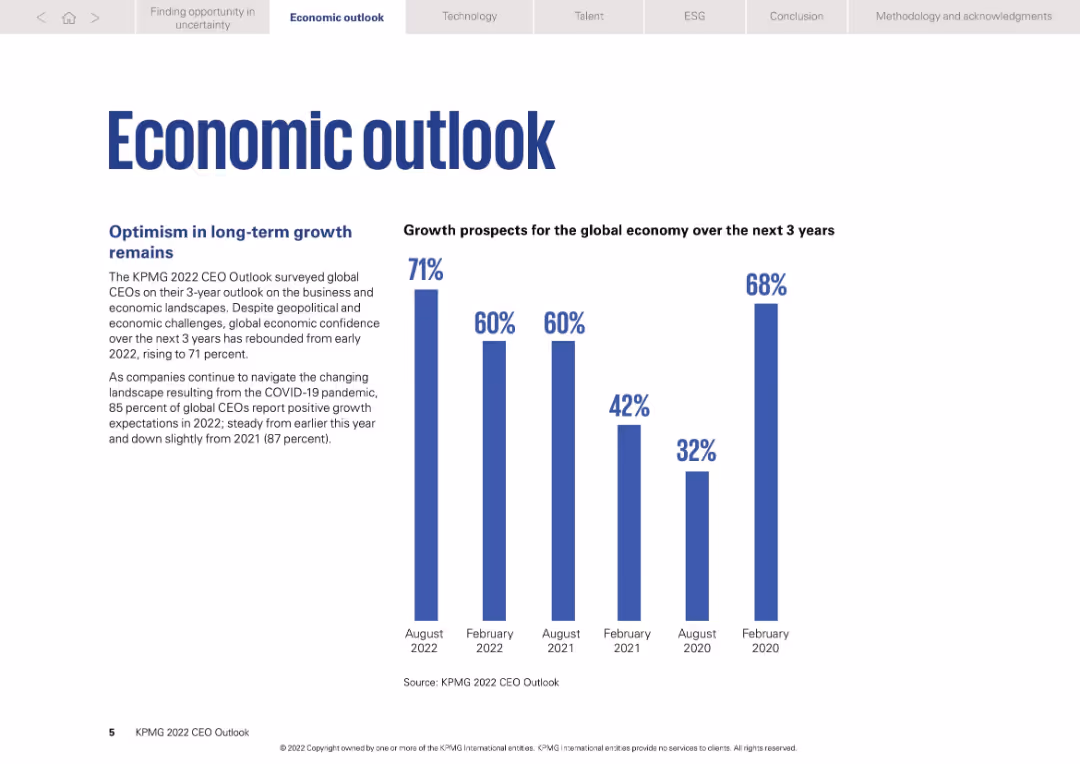
Clean, vertical bar chart showing optimism metrics over time, supported by text on left
Market Analysis and Trends
Financial Services
Highlights global CEO sentiment on long-term economic growth. Confidence in the global economy for the next 3 years rebounded to 71% by August 2022 after pandemic-driven lows. The narrative emphasizes recovery optimism post-COVID-19.
CEO outlook, global economy, growth confidence, recovery, pandemic
false
Market Analysis and Trends
Financial Services financial-services
Mixed Chart
KPMG
View slide
Consists of two column charts, one depicting the change in growth territory rankings by China CEOs and the other showing a global perspective. The slide uses a monochromatic color scheme to differentiate the years for each territory.
Market Analysis and Trends
Financial Services
This slide illustrates the shifting focus of China CEOs from the US to alternative growth territories like Australia, based on surveyed rankings. It's valuable for discussions on global market dynamics and strategic growth territory identification.
CEO preferences, Growth territories, Market trends, US, Australia, Global ranking
false
Market Analysis and Trends
Financial Services financial-services
Multiple Chart
PwC/Strategy&
View slide
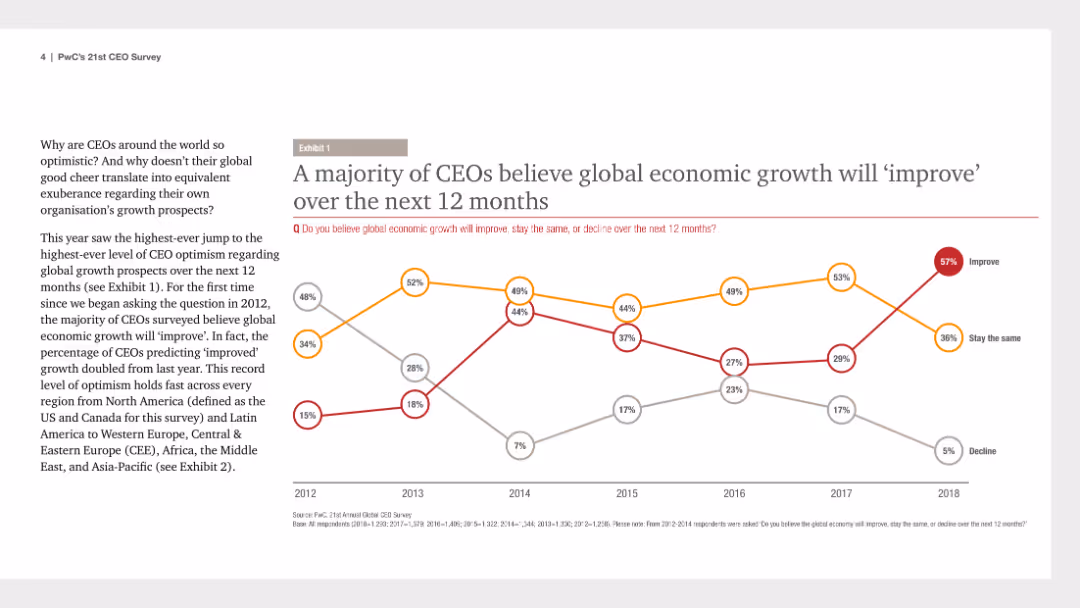
Line chart showing CEO survey results on expected global economic growth from 2012 to 2018, with lines representing different responses (improve, stay the same, decline).
Market Analysis and Trends
Financial Services
Survey results showing CEO optimism about global economic growth over the next year, based on responses from 2012 to 2018.
CEO survey, economic growth, 2012-2018, optimism
false
Market Analysis and Trends
Financial Services financial-services
Mixed Chart
PwC/Strategy&
View slide
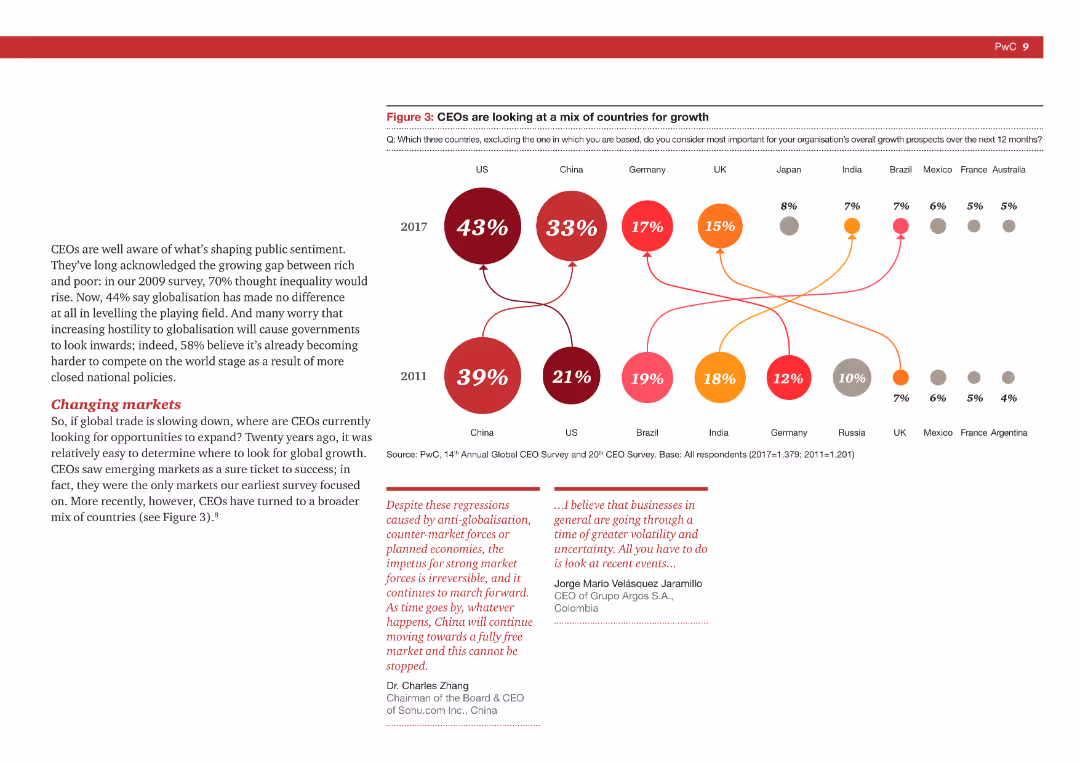
Text with a flow chart illustrating the shift in countries CEOs consider important for growth, comparing 2011 to 2017.
Strategic Planning
Professional Services
The slide highlights how CEOs' focus on countries for growth has shifted over time, based on PwC survey data.
CEO survey, growth, country focus, strategic planning, market shift
false
Strategic Planning
Professional Services professional-services
Multiple Chart
PwC/Strategy&
View slide
This slide is advanced with a complex design that integrates a full text section and column chart. It provides a comprehensive view with various textual elements and data visualizations with a focus on CEO opinions on climate change initiatives over a decade.
Market Analysis and Trends
Environmental Services & Sustainability
It delves into the shift in CEO perspectives on climate change, comparing data from 2010 and 2020. The bar charts highlight the increased recognition of climate change initiatives' benefits. This slide would be relevant in discussions regarding business strategies in the context of environmental sustainability and corporate responsibility.
CEO, Climate Change, Survey, Decade Comparison, Benefits, Investments, Sustainability, Corporate Responsibility
false
Market Analysis and Trends
Environmental Services & Sustainability environmental-services-and-sustainability
Mixed Chart
PwC/Strategy&
View slide
It uses line charts to depict CEO expectations on economic growth, with a key and explanatory notes.
Market Analysis and Trends
Professional Services
Illustrates CEO perspectives on global economic growth, with a focus on the changes in optimism and confidence over recent years.
CEO, Economic Growth, Survey, Trends
false
Market Analysis and Trends
Professional Services professional-services
Single Chart
PwC/Strategy&
View slide
The slide contains a series of stacked column charts comparing data points across regions.
Market Analysis and Trends
Professional Services
Compares CEO outlook on global economic growth by region, showing a significant rise in those expecting decline.
CEO, Economy, Global, Region, Outlook
false
Market Analysis and Trends
Professional Services professional-services
Single Chart
PwC/Strategy&
View slide
The slide features a line graph tracking CEO optimism versus pessimism over time, alongside a detailed analysis. The layout is clean with a balance of text and visual data.
Market Analysis and Trends
Professional Services
Depicts a shift in CEO sentiment towards economic growth, showcasing an increasing trend in pessimism. Useful for discussions on market sentiment and planning.
CEO, Pessimism, Optimism, Economic Growth, Survey
false
Market Analysis and Trends
Professional Services professional-services
Mixed Chart
PwC/Strategy&
View slide
It uses line charts to depict CEOs' revenue growth confidence against economic growth predictions.
Market Analysis and Trends
Professional Services
Reflects CEOs' confidence in their organizations' revenue growth prospects in contrast to their views on global economic growth, indicating a cautious outlook.
CEO, Revenue, Confidence, Economy, Growth
false
Market Analysis and Trends
Professional Services professional-services
Single Chart
PwC/Strategy&
View slide
This slide presents a comparative line chart split into two sections, "Twelve-month revenue confidence" and "Three-year revenue confidence," each tracking the percentage of confidence across regions from 2018 to 2019. The design is minimalistic with clear labels and a legend on the right side.
Market Analysis and Trends
Financial Services
The slide conveys regional CEO confidence levels in revenue growth, showing a declining trend over both short and medium terms. The slide is used to analyze and present economic outlook trends to stakeholders.
CEO, confidence, revenue growth, economic outlook, trends, decline, regional comparison, short-term, medium-term.
false
Market Analysis and Trends
Financial Services financial-services
Mixed Chart
PwC/Strategy&
View slide
Bar charts, comparative analysis, color-coded data.
Market Analysis and Trends
Professional Services
Displays CEOs' concerns by region regarding various economic, policy, and social threats.
CEO, cyber threats, policy, health crises, economic growth, uncertainty, regulation
false
Market Analysis and Trends
Professional Services professional-services
Single Chart
PwC/Strategy&
View slide
The slide contains a title section, line and bar charts showing CEO opinions from 2017 to 2020, and a column chart listing top threats of 2020. The layout is structured and balanced.
Market Analysis and Trends
Professional Services
This slide presents data from PwC's 23rd annual survey, showing changes in CEO optimism and the perceived top threats in 2020. It contrasts CEO outlook over four years and highlights top concerns like over-regulation and trade conflicts, making it useful for analyzing market trends.
CEO, survey, optimism, threats, regulation, trade
false
Market Analysis and Trends
Professional Services professional-services
Multiple Chart
PwC/Strategy&
View slide
This slide has a complex visual arrangement with a line chart showing data over a decade, emphasizing the gap between importance and data adequacy.
Organizational Structure and Change
Financial Services
It discusses CEOs' perspectives on data adequacy for decision-making over ten years, relevant to organizational change management and technology strategy sessions.
CEOs, Data Adequacy, Decision-Making, Organizational Change, Technology Strategy, Long-term
false
Organizational Structure and Change
Financial Services financial-services
Mixed Chart
PwC/Strategy&
View slide
This slide has a column chart with vertical bars comparing percentages across countries for two years. It includes text blocks explaining context and survey data.
Market Analysis and Trends
Financial Services
The slide displays CEO growth ambitions outside their home markets, showing a trend of declining certainty. It illustrates the markets considered for expansion, hinting at strategic business development and market analysis.
CEOs, Growth, Expansion, Market, Survey, Ambitions, Uncertainty, Investment, Comparison
false
Market Analysis and Trends
Financial Services financial-services
Mixed Chart
PwC/Strategy&
View slide
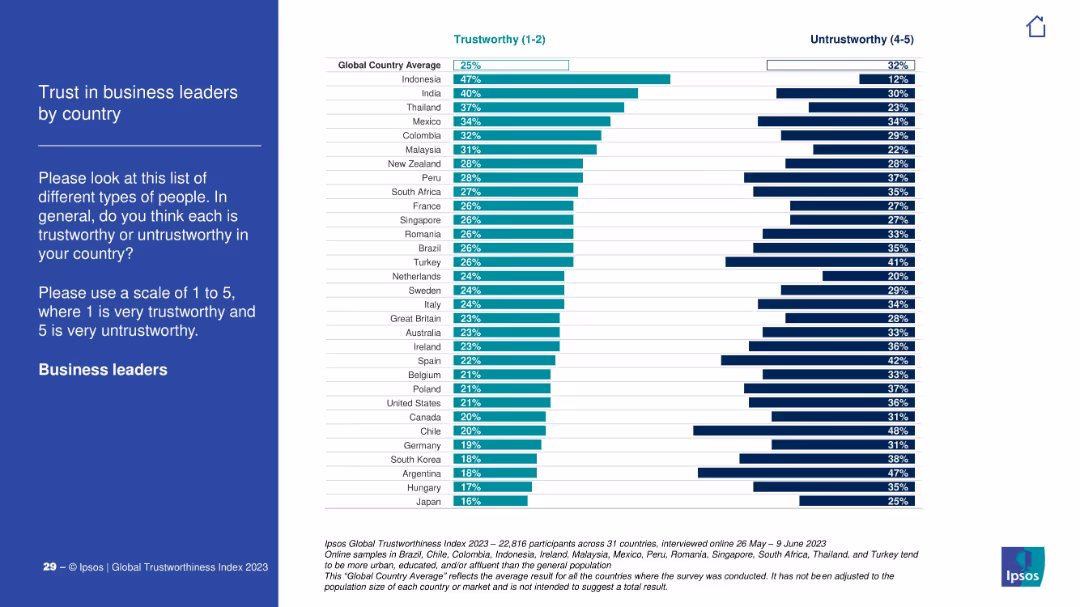
Ipsos-standard slide design. Countries' scores are shown in horizontal bars comparing trust and distrust in business leaders.
Strategic Planning
Professional Services
The slide provides a global comparison of trust in business leaders. Indonesia scores highest, Japan and Hungary lowest. Most countries show more distrust than trust.
CEOs, business leaders, executive trust, public opinion, Ipsos, country comparison, leadership
false
Strategic Planning
Professional Services professional-services
Mixed Chart
IPSOS
View slide
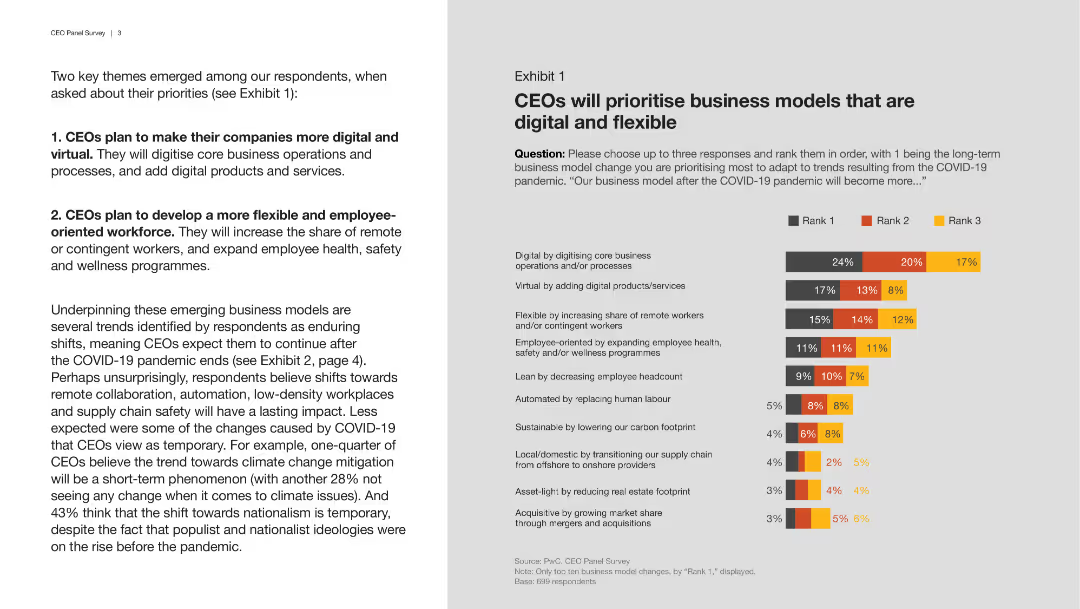
Contains a column chart ranking CEOs' priorities for digital and flexible business models post-COVID-19, with different colors representing various ranking positions.
Strategic Planning
Professional Services
This slide highlights the priorities of CEOs in adopting digital and flexible business models in response to COVID-19, showcasing survey results on business model changes.
CEOs, digital, flexible, business models, COVID-19
false
Strategic Planning
Professional Services professional-services
Mixed Chart
PwC/Strategy&
View slide
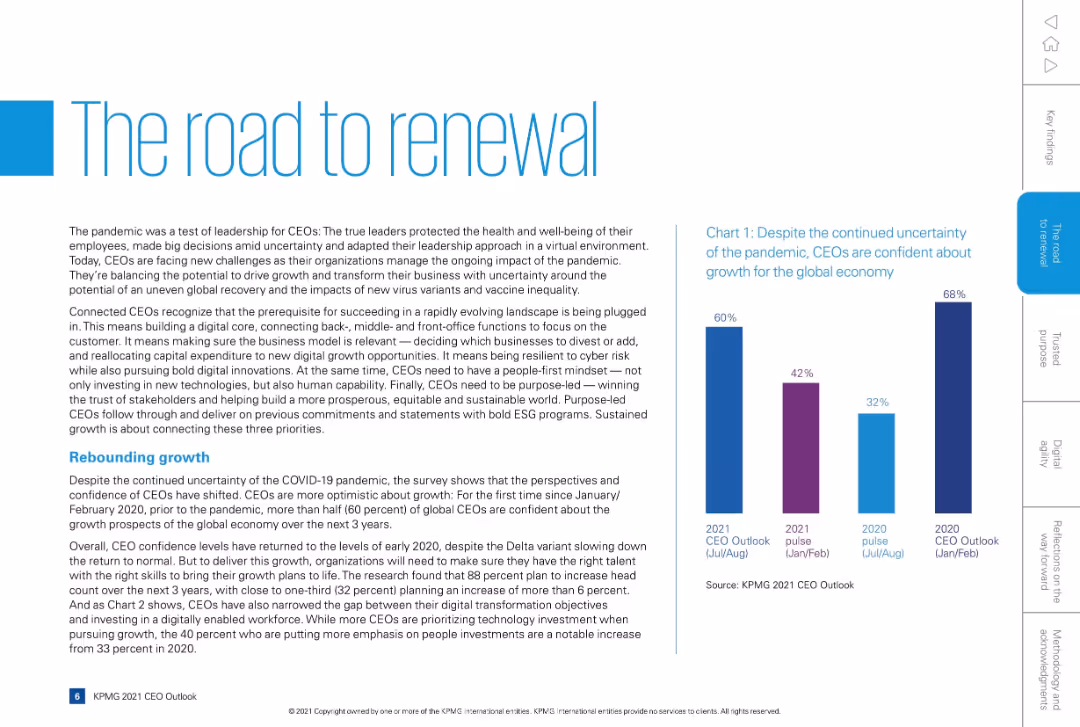
Two-column layout with large title on left, supporting text below, and a vertical bar chart on the right. Navigation tabs on the far right margin.
Strategic Planning
Professional Services
This slide discusses how CEOs have adapted to the pandemic by balancing growth opportunities with human and digital transformation. It emphasizes connected leadership, digital innovation, human capability, and ESG-driven purpose. A chart highlights rising CEO confidence in economic growth from 2020 to 2021.
CEOs, leadership, transformation, pandemic recovery, ESG, digital growth
false
Strategic Planning
Professional Services professional-services
Mixed Chart
KPMG
View slide
Bar charts, column charts, tabular data, bullet points.
Market Analysis and Trends
Professional Services
Shows CEO concerns over economic, policy, social, and environmental threats.
CEOs, threats, cyber, policy, tax, growth, economic, environmental
false
Market Analysis and Trends
Professional Services professional-services
Single Chart
PwC/Strategy&
View slide
Features a column chart of CET1 capital ratio changes quarter-over-quarter with highlights on regulatory requirements and management targets.
Financial Performance
Financial Services
Examines the CET1 capital ratio evolution, detailing influences from dividends, share repurchases, and regulatory impacts. This slide is essential for stakeholders interested in the firm's capital management strategies and regulatory compliance.
CET1 Ratio, Capital Management, Regulatory, Financial
false
Financial Performance
Financial Services financial-services
Multiple Chart
Citigroup
View slide
Column chart demonstrating changes in CET1 capital ratio from 3Q23 to 4Q23 with detailed impacts and final ratio figures.
Financial Performance
Financial Services
Examines UBS's capital strength for 4Q23, focusing on the CET1 ratio, and explaining factors affecting the ratio over the quarter.
CET1 Ratio, Capital Strength, UBS, 4Q23, Analysis
false
Financial Performance
Financial Services financial-services
Mixed Chart
UBS
View slide
Column charts for capital ratios, diagrams for ratio walk-through
Risk Assessment and Management
Financial Services
Explanation of CET1 capital ratio changes and regulatory capital requirements
CET1 Ratio, Capital, Regulatory, Column Chart, Bar Chart, Risk
false
Risk Assessment and Management
Financial Services financial-services
Multiple Chart
Citigroup
View slide
Features multiple column chart depicting changes in CET1 ratio over quarters, along with risk-weighted assets shown in smaller bar graphs beneath.
Regulatory and Compliance
Financial Services
Analyzes the CET1 capital ratio's stability through quarterly changes, highlighting the impacts of market risks, operational changes, and capital strategies. It provides insights into the bank’s capital adequacy to meet regulatory requirements and financial stability.
CET1 Ratio, Regulatory Compliance, Financial Stability, Risk Management, Capital Adequacy
false
Regulatory and Compliance
Financial Services financial-services
Multiple Chart
Deutsche Bank
View slide
This slide is a visual composite of column charts, explanatory text, and percentage indicators. It shows a 'CET1 Ratio Walk' breaking down the influences on the CET1 ratio's increase, alongside a dual-chart comparison of regulatory requirements and CET1 ratios over time.
Risk Assessment and Management
Financial Services
The slide focuses on the detailed factors affecting the Common Equity Tier 1 (CET1) capital ratio, illustrating how certain financial activities impact this key regulatory metric. It's used for in-depth risk management assessments, showcasing compliance with financial regulations, and strategic financial planning.
CET1 Ratio, Regulatory Requirements, Financial Planning, Risk Management
false
Risk Assessment and Management
Financial Services financial-services
Multiple Chart
Citigroup
View slide
The slide features a column chart and tables explaining the CET1 ratio, regulatory requirements, and quarterly changes.
Regulatory and Compliance
Financial Services
This slide discusses the CET1 ratio's quarterly changes, regulatory requirements, and the current capital ratio compared to regulatory targets.
CET1 Ratio, Standardized, Regulatory, Compliance, Capital, Quarterly, Changes, Financial, Overview, Requirements
false
Regulatory and Compliance
Financial Services financial-services
Multiple Chart
Citigroup
View slide
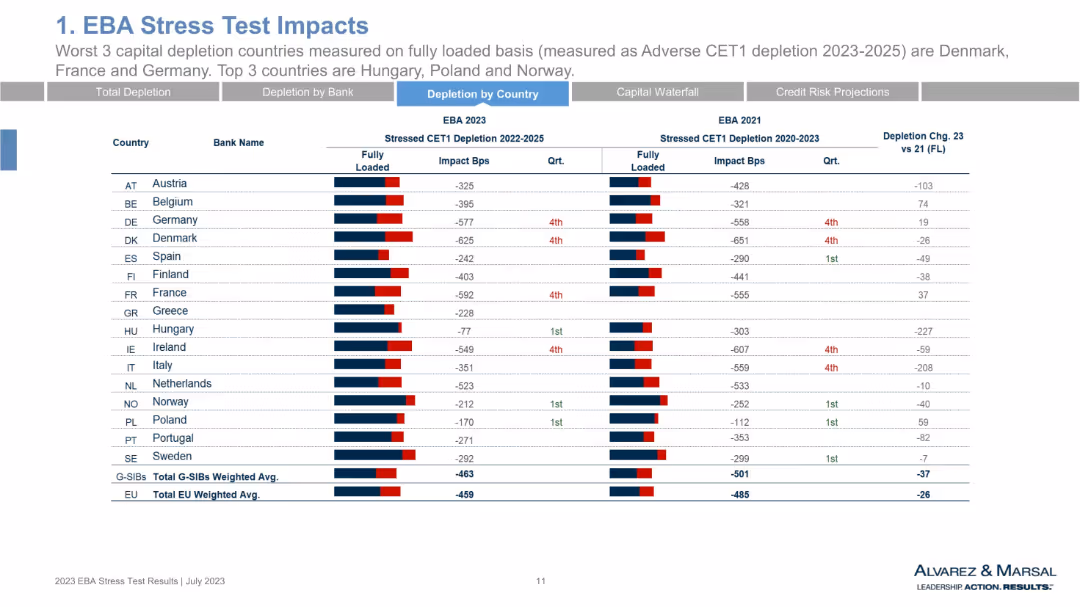
Data table by country rather than bank. Lists average CET1 depletion by nation. Includes 2023 vs. 2021 comparisons and rankings. Uses red/blue bar visuals.
Risk Assessment and Management
Financial Services
This slide aggregates CET1 stress test results at the national level. Denmark, France, and Germany show the worst capital depletion, while Hungary, Poland, and Norway perform best. The visual emphasizes geographical disparities in resilience and risk tolerance among EU member countries.
CET1 by country, stress test 2023, Denmark, Germany, Hungary, national averages, depletion
false
Risk Assessment and Management
Financial Services financial-services
Single Chart
Alvarez & Marsal
View slide
The slide contains two waterfall charts showing CET1 capital and Risk-Weighted Assets (RWA) movements from 1Q23 to 2Q23, detailing various adjustments and changes.
Risk Assessment and Management
Financial Services
The slide illustrates the changes in UBS's CET1 capital and Risk-Weighted Assets (RWA) between the first and second quarters of 2023, explaining the adjustments made for capital adequacy and risk management.
CET1 capital, RWA, adjustments, risk management, UBS
false
Risk Assessment and Management
Financial Services financial-services
Multiple Chart
UBS
View slide
The slide shows two vertical column charts illustrating CET1 capital and risk-weighted assets (RWA) changes over 3Q23.
Financial Performance
Financial Services
This slide explains changes in CET1 capital and risk-weighted assets (RWA) during Q3 2023, with regulatory impacts.
CET1 capital, RWA, financial performance, regulatory impacts, Q3 2023
false
Financial Performance
Financial Services financial-services
Multiple Chart
UBS
View slide
Column chart depicting changes in CET1 capital ratio from 2Q22 to 3Q22 with annotations for key factors.
Financial Performance
Financial Services
Analyzes the changes in CET1 capital ratio over a period, highlighting significant contributors and their impacts.
CET1 capital, equity, financial performance, UBS, 3Q22, leverage ratio, share buybacks, net profit
false
Financial Performance
Financial Services financial-services
Mixed Chart
UBS
View slide
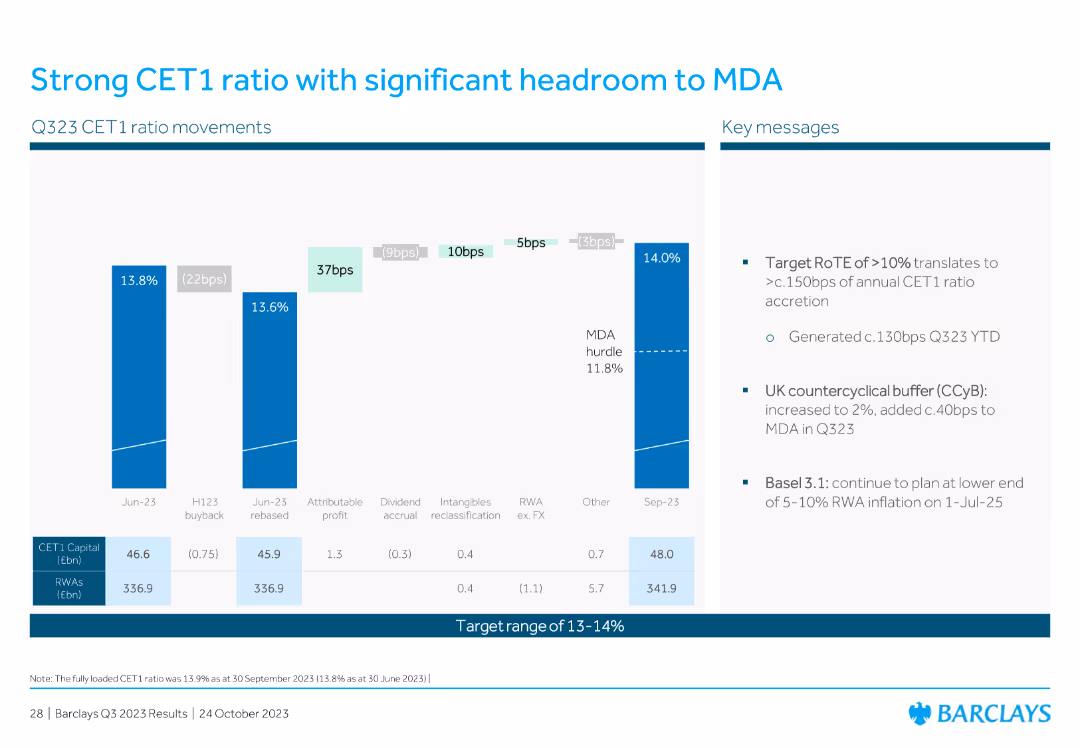
Displays a vertical bar chart showing CET1 ratio movements and key messages. The layout is clean, with a strong focus on data points and explanatory text.
Financial Performance
Financial Services
The slide illustrates the CET1 ratio movements and key messages related to financial health and regulatory requirements, emphasizing the bank's robust capital position and strategic targets.
CET1 ratio, MDA, capital, financial health, regulatory, key messages, capital position
false
Financial Performance
Financial Services financial-services
Mixed Chart
Barclays
View slide
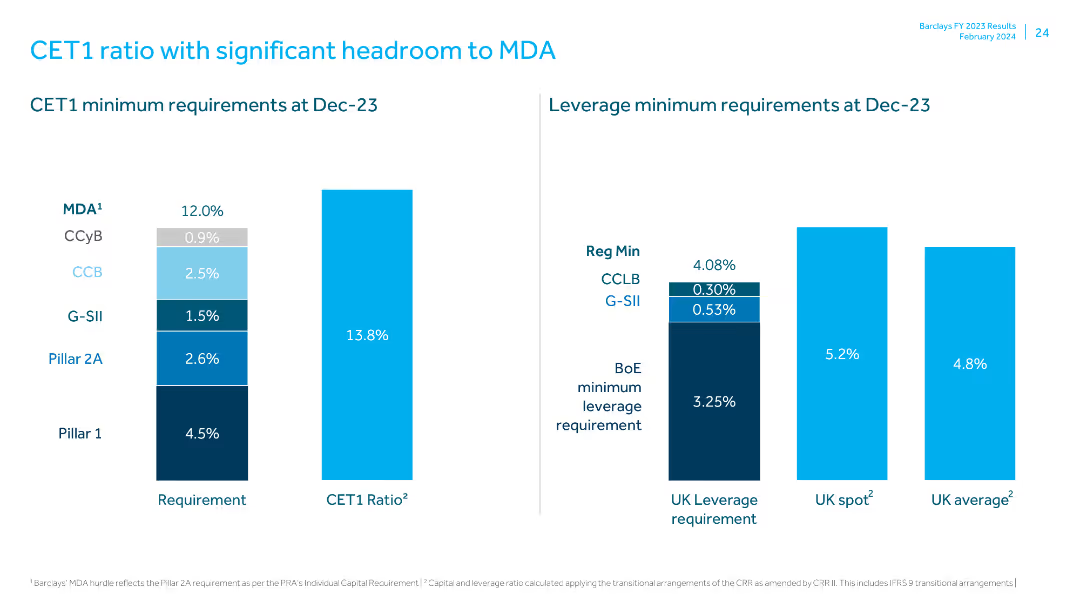
Uses column charts to display CET1 and leverage minimum requirements, comparing actual ratios to regulatory minima.
Regulatory and Compliance
Financial Services
Highlights the CET1 ratio's headroom above the minimum requirements, explaining the regulatory and leverage requirements and the bank's compliance status.
CET1 ratio, MDA, regulatory requirements, leverage ratio, compliance, financial regulation, capital adequacy, headroom, financial health, UK leverage
false
Regulatory and Compliance
Financial Services financial-services
Multiple Chart
Barclays
Previous
Loading...
Hold On!
We are searching in our database
If nothing, comes up, please try different filters!
Column Chart
Heatmap
Chevron
Org Chart
Infographic
Callouts
Timeline
List
Graphic
Picture
Process Flow
Diagram
Paragraph
Map
Table
Framework
Subtitle
Takeaway Box
Icon
Other Chart
Radar Chart
Waterfall Chart
Mekko Chart
Pie Chart
Scatter Plot
Line Chart
Bar chart
Bullet points
Create a FREE account to continue browsing
Receive Instant Access to 1,000+ slides from companies like McKinsey, Google, and Goldman Sachs
First Name
Last Name
Email
Password
I agree to all
Terms & Privacy Policy
Thank you! Your submission has been received!
Oops! Something went wrong while submitting the form.
Have an account?
Sign in
Upgrade to PRO to Save slides
Advanced Search and Filters
Access to 15,000+ slides
Access to Category Pages
Save/Bookmark Slides
PowerPoint Template Library
Pick a Plan
MONTHLY
$12/month
Billed every month, Cancel anytime.
YEARLY
$9/year
Billed $108 annually, Cancel anytime.
Checkout for $12/month
Checkout for $108/yr
Secured by Stripe | AES-256 bit encryption