My Account
My Slides
Search by Category
Templates
View All Templates
Download Template Slides
Leave Feedback
Login
Logout
Get Started
Browse all Slides
Browse all Slides
Create a FREE Account
Instant access to 1,000+ real slides from top companies like McKinsey, BCG, Goldman Sachs, Google and many more!
First Name
Last Name
Email
Password
I agree to all
Terms & Privacy Policy
Thank you! Your submission has been received!
Oops! Something went wrong while submitting the form.
Have an account?
Sign in
Spark Your Next Big Idea with New Presentation Templates
VIEW ALL Templates
Welcome,
Welcome
PRO
Show Featured Only
Checkbox 8
Companies
Mckinsey
Bain
BCG
EY
Deloitte
Accenture
PwC/Strategy&
JP Morgan
Goldman Sachs
Morgan Stanley
Citigroup
Deutsche Bank
Barclays
LEK
KPMG
Kearney
Oliver Wyman
Booz Allen Hamilton
Gartner
IPSOS
Nielsen
Slide type
Text Only
Linear Flow
Vertical Flow
Single Chart
Header Horizontal
Mixed Chart
Header Vertical
Pillar
Multiple Chart
Graphic
Agenda
Title
Table
Framework
Industry
Technology & Software
Artificial Intelligence
Financial Services
Retail & E-commerce
Consumer Goods
Industrial & Manufacturing
Transportation & Logistics
Telecommunications
Real Estate & Construction
Hospitality & Tourism
Professional Services
Education & Training
Media & Entertainment
Agriculture & Food Production
Healthcare & Pharmaceuticals
Environmental Services & Sustainability
Government & Public Sector
Use Case
Mergers and Acquisitions
Performance Metrics and KPIs
Client Case Studies
Competitive Landscape
Corporate Finance and Valuation
Product and Service Analysis
Customer and Market Segmentation
Organizational Structure and Change
Industry Overview
Regulatory and Compliance
Risk Assessment and Management
Investment Analysis
Organizational Structure and Change
Human Resources and Talent Management
Financial Performance
Market Analysis and Trends
Sales and Business Development
Human Resources and Talent Management
Clear all
Thank you! Your submission has been received!
Oops! Something went wrong while submitting the form.
Tag
View slide
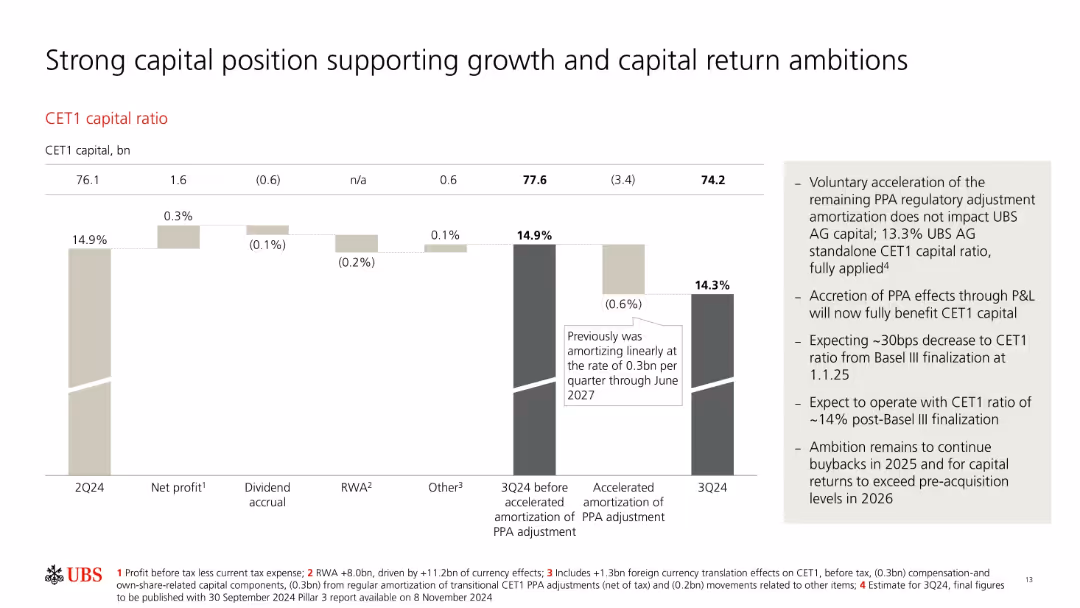
Waterfall chart showing CET1 ratio progression with callouts; text box on right with strategic notes.
Corporate Finance and Valuation
Financial Services
Explains movements in UBS’s CET1 capital ratio across 2Q24 to 3Q24, including profit impact, dividend accrual, RWA increase, and regulatory amortization changes. Commentary outlines strategic goals and regulatory expectations.
CET1 ratio, PPA adjustment, capital return, RWA, amortization, UBS
false
Corporate Finance and Valuation
Financial Services financial-services
Mixed Chart
UBS
View slide
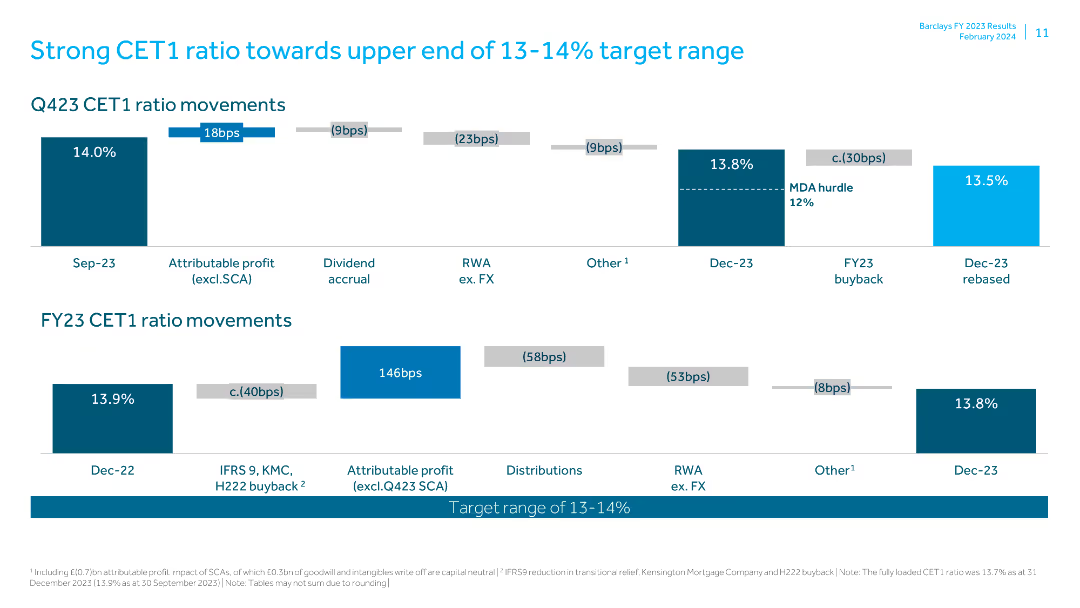
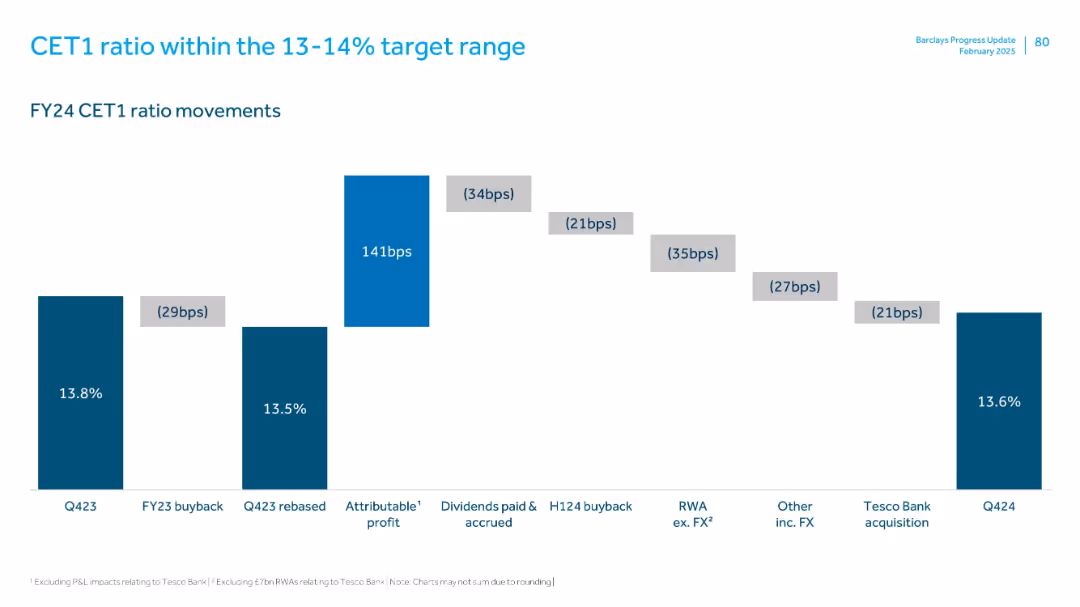
The slide uses a combination of column charts and text blocks to show CET1 ratio movements for Q423 and FY23. It features a mixture of blue and gray.
Financial Performance
Financial Services
Highlights the CET1 ratio movements for Q423 and FY23, showing progress toward the target range. Includes figures for profits, buybacks, and other factors.
CET1 ratio, Q423, FY23, target range, financial performance, dividend, RWA, FX, buyback, attributable profit
false
Financial Performance
Financial Services financial-services
Multiple Chart
Barclays
View slide
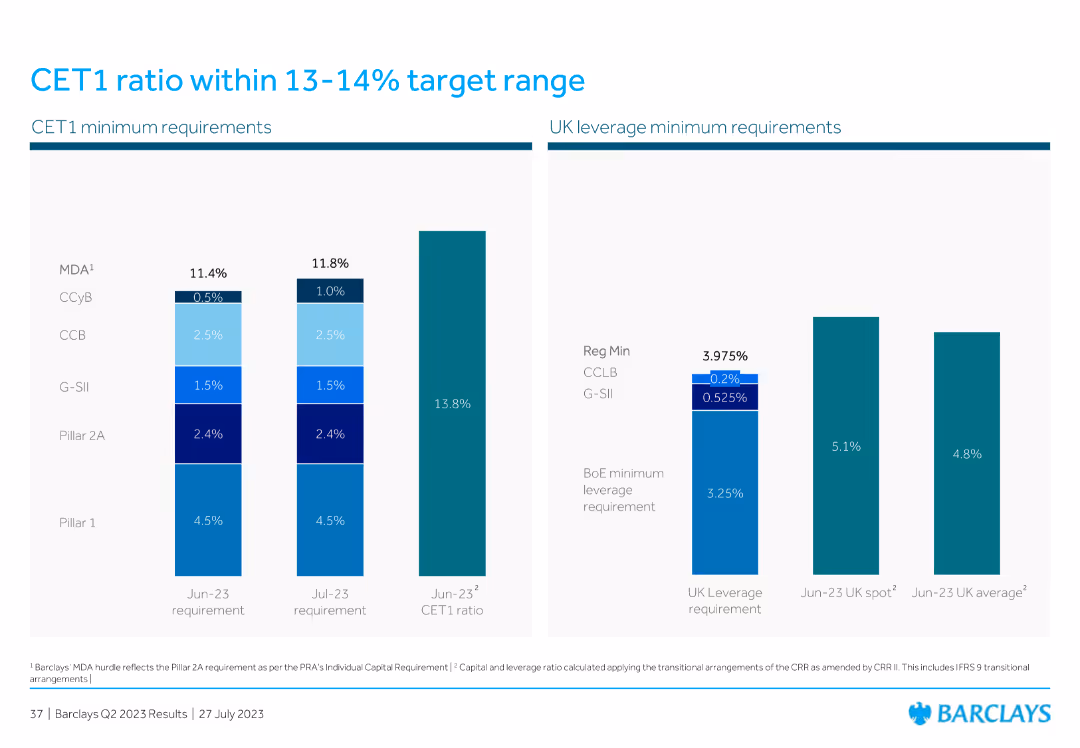
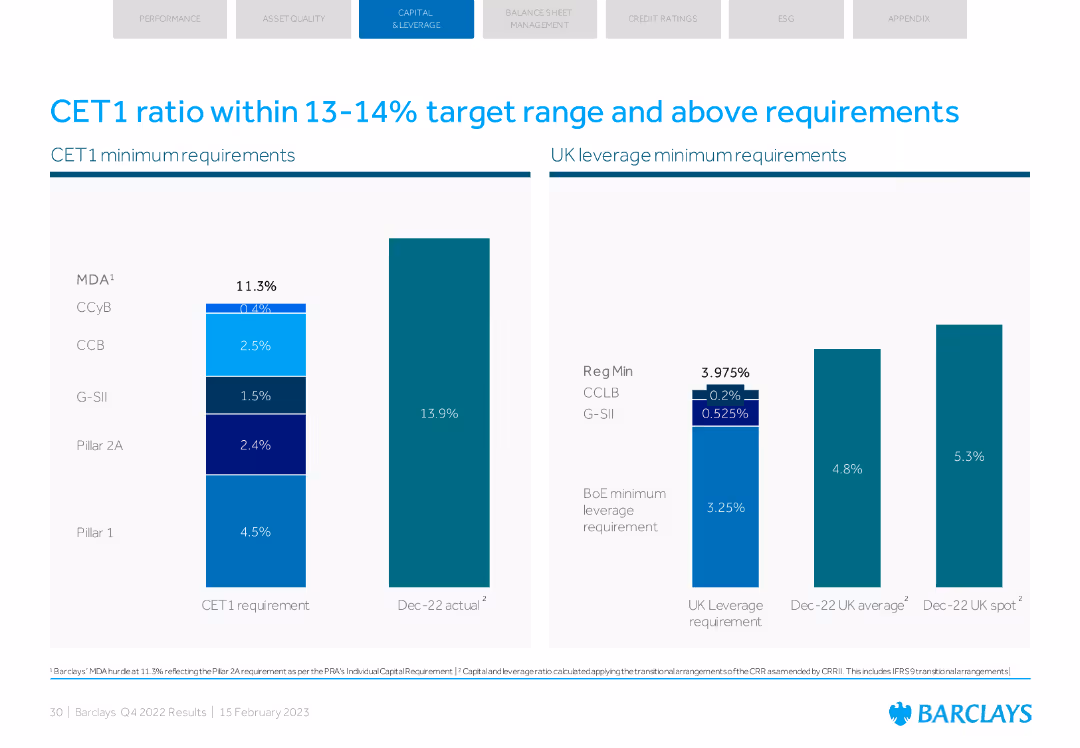
The slide displays two column charts: one for CET1 minimum requirements with different components and their percentages, and the other for UK leverage minimum requirements, highlighting the regulatory minimums and actual ratios.
Financial Performance
Financial Services
The slide shows CET1 and UK leverage ratios against regulatory minimum requirements, emphasizing the bank’s capital adequacy and compliance with financial regulations.
CET1 ratio, UK leverage, minimum requirements, capital adequacy, financial regulations
false
Financial Performance
Financial Services financial-services
Multiple Chart
Barclays
View slide
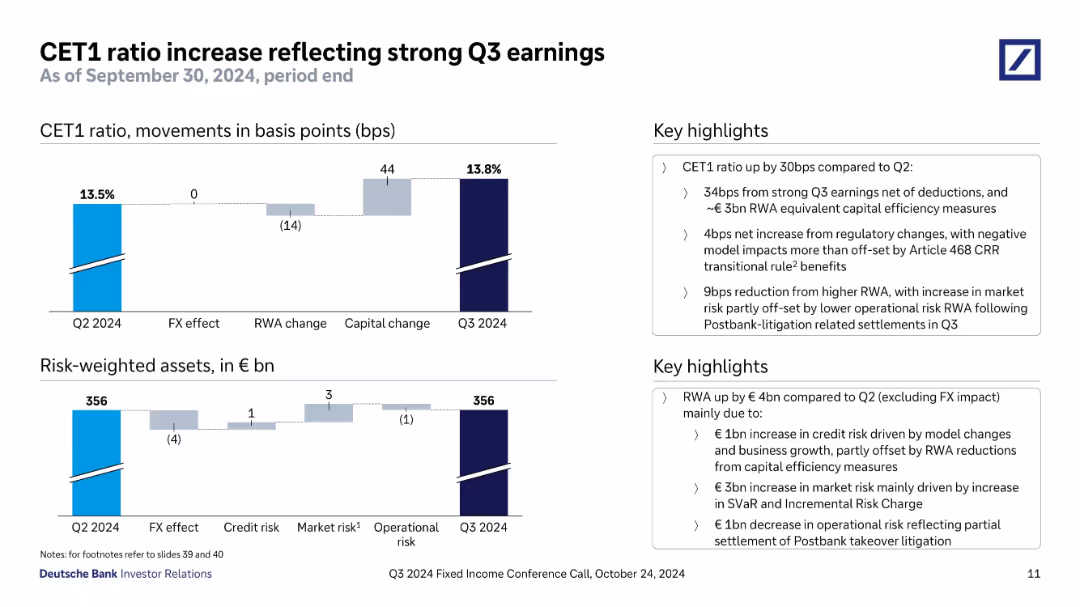
Top chart shows CET1 ratio change in basis points; bottom chart shows changes in risk-weighted assets. Key drivers annotated. Sidebar text summarizes the changes and regulatory impacts.
Regulatory and Compliance
Financial Services
Shows CET1 ratio improvement to 13.8% in Q3 2024, driven by strong earnings and capital efficiency. Regulatory changes and RWA movements are detailed, with breakdowns by credit, market, and operational risks.
CET1 ratio, capital adequacy, Q3 earnings, RWA, risk-weighted assets, regulatory change, Postbank litigation
false
Regulatory and Compliance
Financial Services financial-services
Multiple Chart
Deutsche Bank
View slide
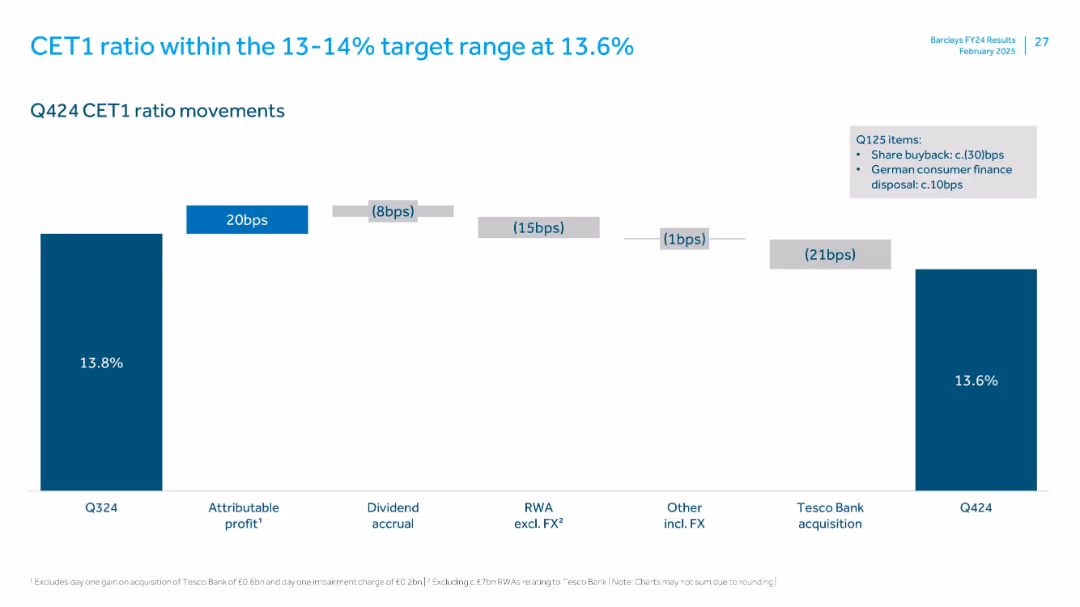
Waterfall chart showing stepwise changes from Q3 to Q4 2024 in CET1 ratio. Clean design with horizontal layout and annotations for each driver.
Regulatory and Compliance
Financial Services
This slide breaks down movements in the CET1 ratio from 13.8% to 13.6% in Q4 2024. Key impacts include attributable profit, dividend accrual, FX adjustments, and the Tesco Bank acquisition. Maintains regulatory capital target range.
CET1 ratio, capital adequacy, regulatory, profit, Tesco Bank, FX
false
Regulatory and Compliance
Financial Services financial-services
Single Chart
Barclays
View slide
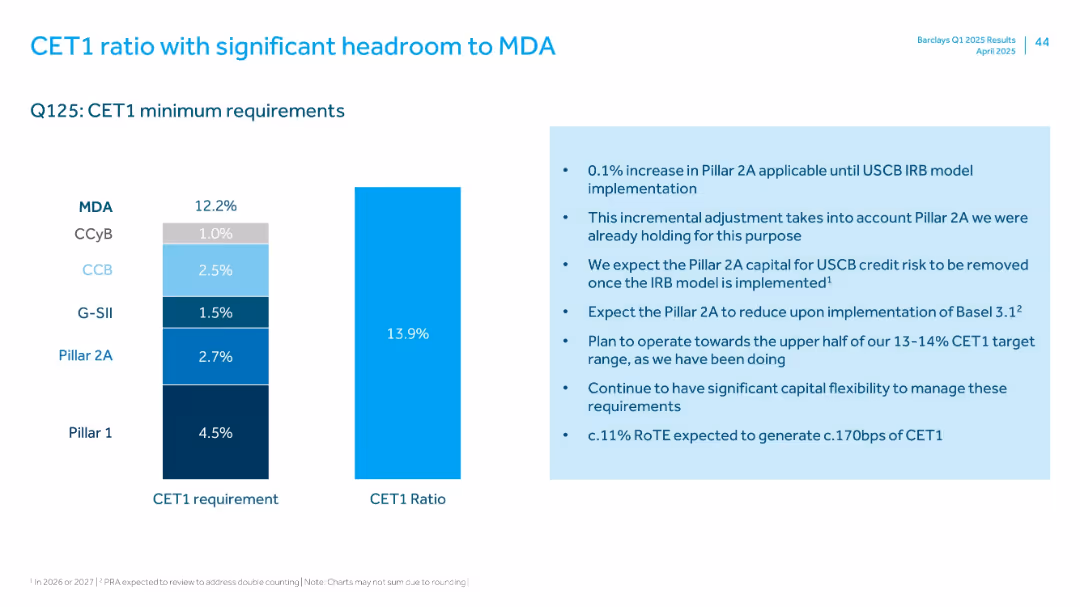
Two vertical bar charts side by side showing CET1 requirements vs. actual ratio; explanatory bullet points on the right in a light blue box.
Financial Performance
Financial Services
Shows Barclays’ CET1 ratio of 13.9% in Q1 2025, above the 12.2% minimum requirement. Provides context on Pillar 2A adjustment and flexibility under Basel 3.1. Emphasizes strong capital positioning and the bank’s ability to operate at the upper end of the target range.
CET1 ratio, capital buffer, Basel 3.1, Pillar 2A, financial strength, Barclays, Q1 2025
false
Financial Performance
Financial Services financial-services
Mixed Chart
Barclays
View slide
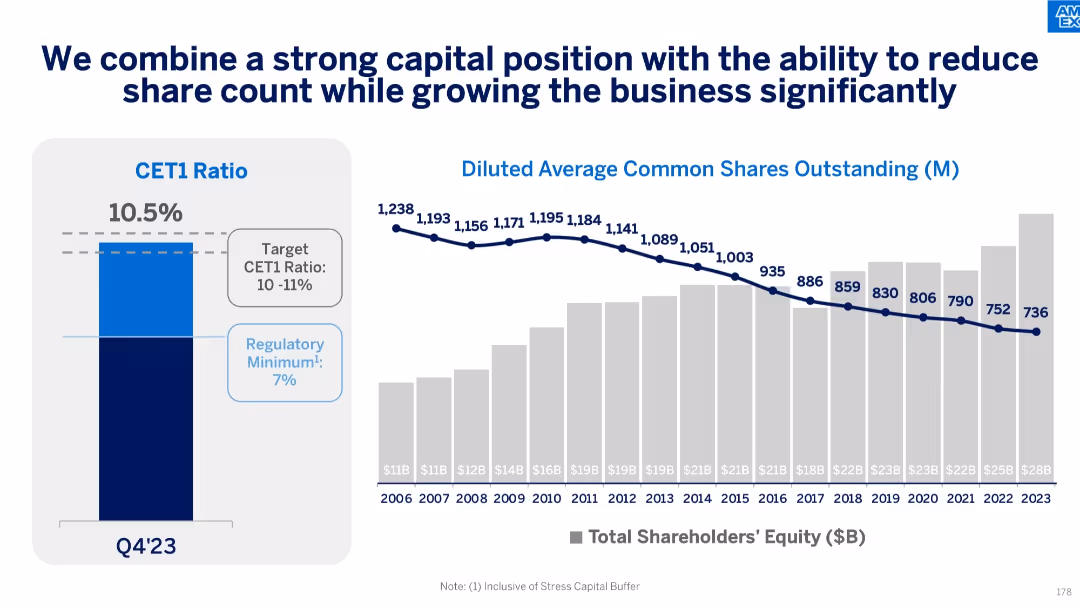
Split layout: left side shows a vertical bar chart for CET1 Ratio (Q4'23), right side features a combination of line and bar chart tracking diluted shares outstanding and shareholders’ equity from 2006 to 2023.
Financial Performance
Financial Services
This slide highlights a strong capital position with a CET1 ratio of 10.5%, above the regulatory minimum and within target range. It also shows a consistent decline in common shares outstanding while shareholders’ equity steadily increases over the years.
CET1 ratio, capital position, shares outstanding, shareholder equity, Q4'23, financial metrics, regulatory buffer, American Express
false
Financial Performance
Financial Services financial-services
Multiple Chart
McKinsey
View slide
This slide uses blue column charts and gray bars to depict changes in CET1 ratio and Risk-weighted Assets. It includes detailed footnotes and highlights key regulatory impacts and capital management strategies used to improve financial ratios.
Regulatory and Compliance
Financial Services
Displays quarterly changes in CET1 ratios influenced by regulatory adjustments, capital strategies, and market conditions. It underscores the bank's efforts in maintaining robust capital ratios through strategic financial management and regulatory compliance.
CET1 ratio, capital, regulatory, market, management
false
Regulatory and Compliance
Financial Services financial-services
Multiple Chart
Deutsche Bank
View slide
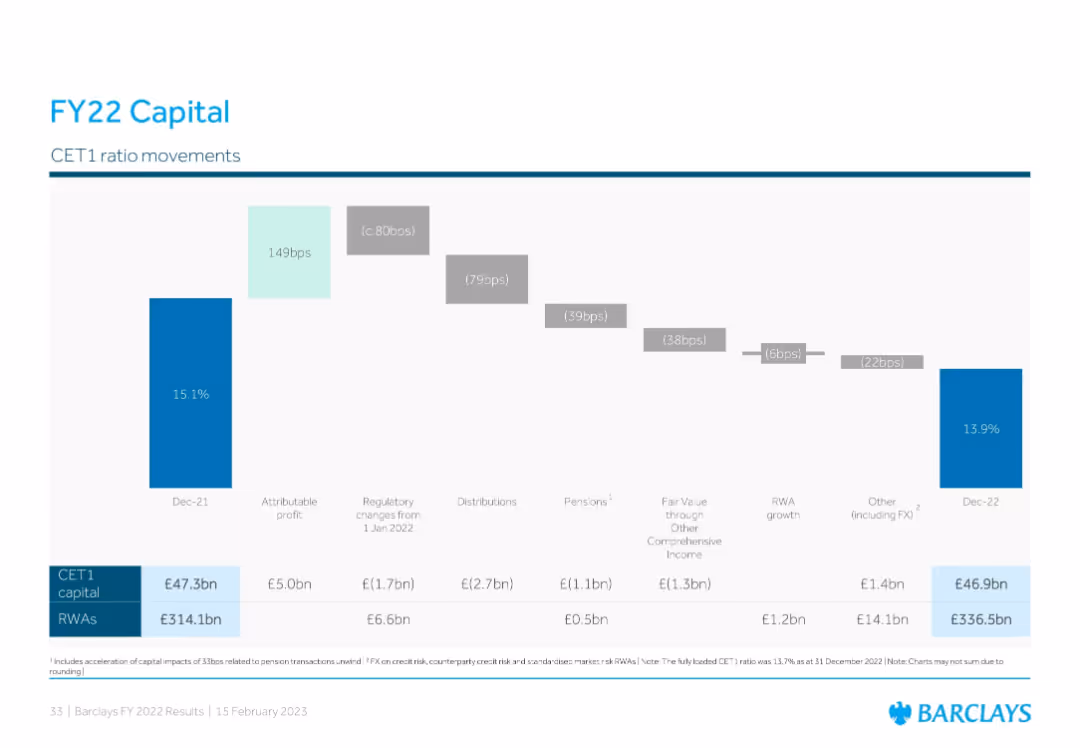
Waterfall chart showing CET1 ratio movement with contributing factors and numerical labels. Includes summary of CET1 capital and RWA amounts for 2021 and 2022.
Corporate Finance and Valuation
Financial Services
This slide illustrates changes in Barclays’ CET1 capital ratio throughout FY22, starting from 15.1% and ending at 13.9%. It breaks down the components affecting the ratio, including attributable profit, distributions, pension, fair value adjustments, and FX impacts.
CET1 ratio, capital, risk-weighted assets, profit, distributions
false
Corporate Finance and Valuation
Financial Services financial-services
Single Chart
Barclays
View slide
Displays column charts and bullet points illustrating changes in the CET1 ratio over time.
Financial Performance
Financial Services
Explains the factors influencing the CET1 capital ratio, crucial for understanding financial stability.
CET1 ratio, financial stability, capital, regulation
false
Financial Performance
Financial Services financial-services
Multiple Chart
Citigroup
View slide
The slide includes a column chart tracking CET1 ratio development over time, with additional text boxes explaining different factors influencing the CET1 ratio.
Financial Performance
Financial Services
This slide projects the group’s CET1 ratio aiming for a target of more than 13.5% by 2025, explaining the various financial actions and changes that will influence this target.
CET1 ratio, financial targets, performance metrics, capital planning, investment strategy
false
Financial Performance
Financial Services financial-services
Single Chart
Credit Suisse
View slide
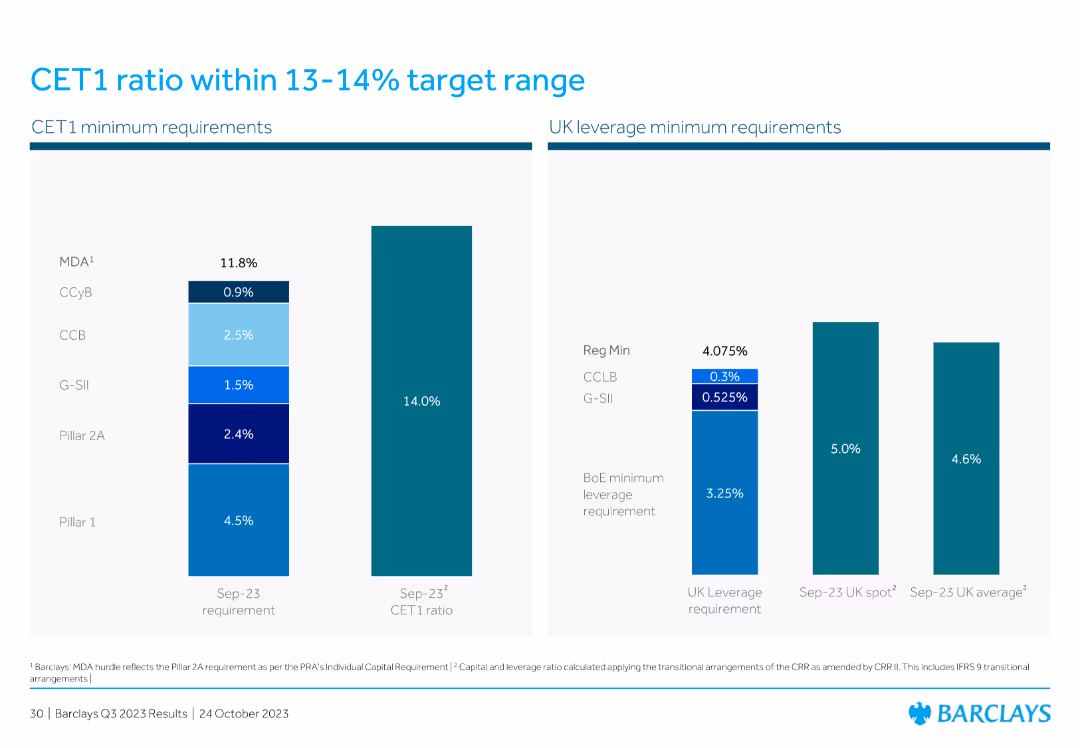
Column charts showing CET1 ratio requirements and UK leverage minimum requirements.
Regulatory and Compliance
Financial Services
Highlights Barclays' CET1 ratio within target range and above regulatory requirements, with leverage metrics.
CET1 ratio, regulatory requirements, leverage, compliance, target range
false
Regulatory and Compliance
Financial Services financial-services
Multiple Chart
Barclays
View slide
Column charts illustrate CET1 ratio development and risk-weighted assets progression. Bullets summarize key changes and impacts on the CET1 ratio.
Financial Performance
Financial Services
Highlights improvement in CET1 ratio to 14.1% due to capital raises and reductions in risk-weighted assets, providing a stable capital base.
CET1 ratio, risk-weighted assets, capital raises, financial stability, banking metrics
false
Financial Performance
Financial Services financial-services
Multiple Chart
Credit Suisse
View slide
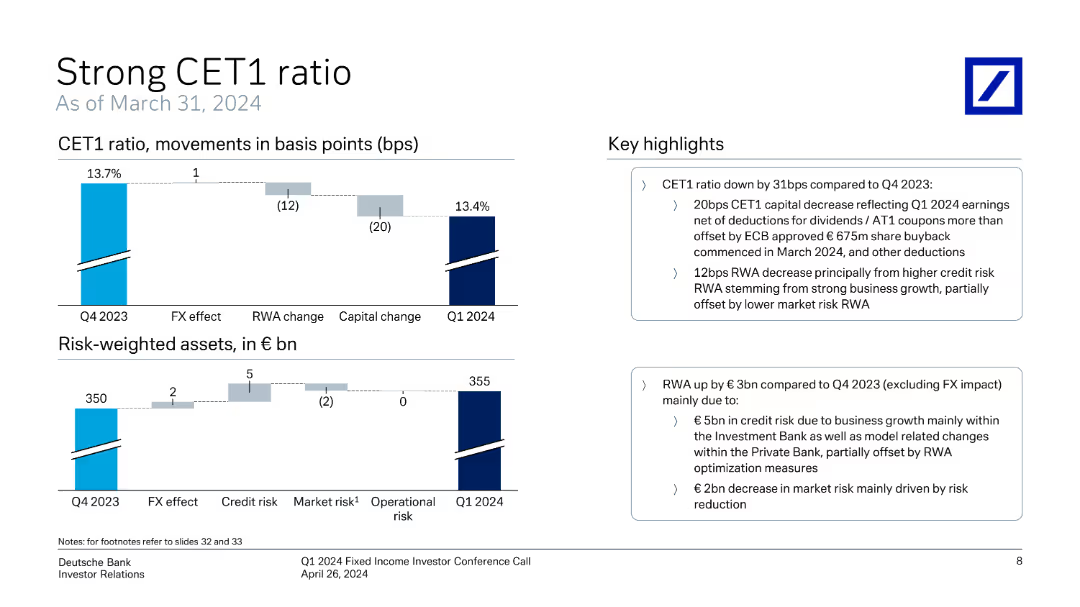
The slide includes vertical column charts displaying CET1 ratio movements and risk-weighted assets over time, accompanied by key highlights.
Financial Performance
Financial Services
The slide highlights Deutsche Bank's CET1 ratio and risk-weighted asset trends, showing changes and factors affecting these metrics from Q4 2023 to Q1 2024.
CET1 ratio, risk-weighted assets, financial metrics, Deutsche Bank, Q1 2024, investor relations, capital adequacy, regulatory requirements, financial health
false
Financial Performance
Financial Services financial-services
Multiple Chart
Deutsche Bank
View slide
Contains a vertical bar chart showing CET1 minimum requirements and a comparison chart for UK leverage minimum requirements. The design is clean and data-oriented.
Financial Performance
Financial Services
This slide discusses the CET1 ratio within the target range and compares UK leverage requirements, emphasizing regulatory compliance and financial stability.
CET1 ratio, target range, UK leverage, minimum requirements, financial stability, regulatory compliance
false
Financial Performance
Financial Services financial-services
Multiple Chart
Barclays
View slide
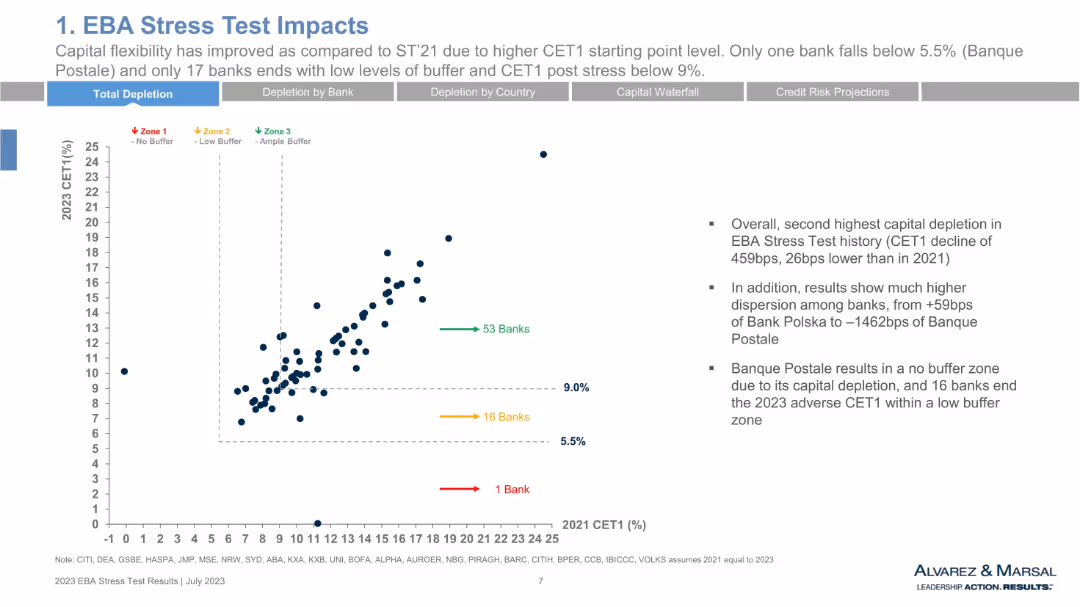
Scatter plot with CET1 2023 on Y-axis and 2021 CET1 on X-axis. Three buffer zones marked with color-coded regions. Data points represent individual banks. Bullet points on the right.
Risk Assessment and Management
Financial Services
A dot matrix graph analyzing individual EU banks’ CET1 ratio shifts from 2021 to 2023 under stress conditions. Most banks remain above the 9% buffer, while one falls below the 5.5% threshold. Summary notes explain capital dispersion and highlight Banque Postale as the weakest performer.
CET1 scatter plot, EU banks, capital buffer, Banque Postale, dispersion, stress results
false
Risk Assessment and Management
Financial Services financial-services
Mixed Chart
Alvarez & Marsal
View slide
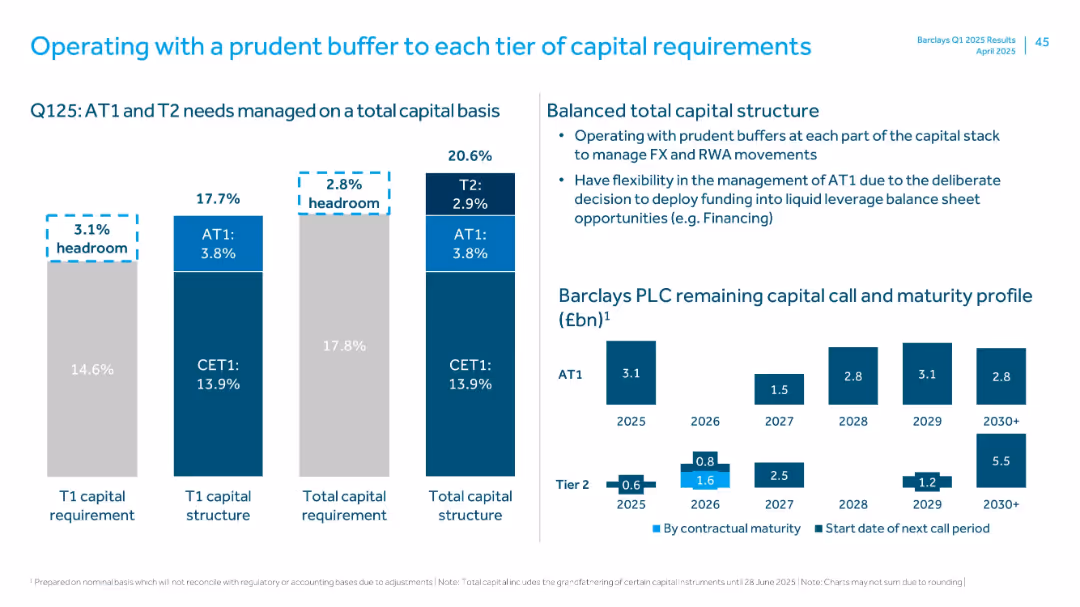
Three grouped bar charts for T1 requirement, capital structure, and total capital; supporting bullet points on the right; capital call chart at the bottom right.
Financial Performance
Financial Services
Describes Barclays’ capital structure in Q1 2025, showing CET1, AT1, and T2 buffers relative to requirements. Demonstrates prudent capital planning and provides a maturity timeline for capital instruments. Emphasizes flexibility in capital deployment.
CET1, AT1, T2, capital buffer, Barclays, capital maturity, capital call, Q1 2025
false
Financial Performance
Financial Services financial-services
Multiple Chart
Barclays
View slide
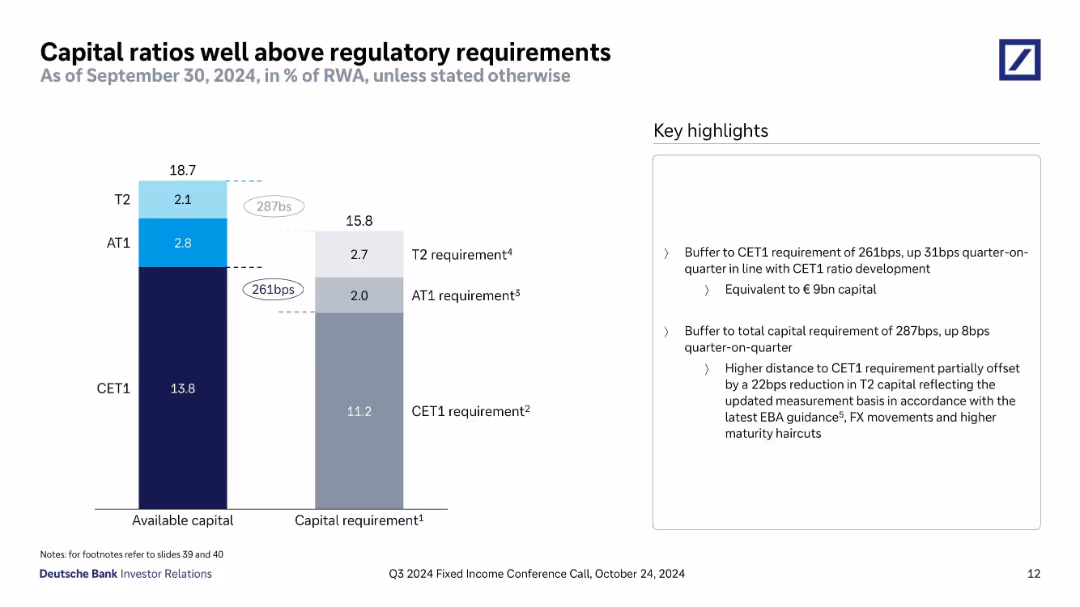
Vertical bar chart compares available capital to regulatory minimums (CET1, AT1, T2). Labels show surplus in basis points and € terms. Key messages summarized on the right.
Regulatory and Compliance
Financial Services
Communicates that Deutsche Bank maintains a strong capital buffer above CET1 and total capital requirements. Slide breaks down capital components and the regulatory thresholds, while noting quarter-on-quarter improvements and changes to T2 calculation rules.
CET1, AT1, T2, capital buffer, regulatory compliance, EBA guidance, capital surplus, 2024
false
Regulatory and Compliance
Financial Services financial-services
Mixed Chart
Deutsche Bank
View slide
This slide consists of column charts and bullet points. It highlights changes in the CET1 capital ratio over quarters and the impact of specific factors like dividends and sales. The colors used are blue and white.
Regulatory and Compliance
Financial Services
It explains the factors influencing the capital ratio, with references to regulatory requirements and targets. Suitable for financial regulatory reporting, compliance discussions, or investor briefings on capital adequacy strategies.
CET1, Capital Ratio, Regulatory, Compliance, Dividends, Financial, Performance, Target
false
Regulatory and Compliance
Financial Services financial-services
Multiple Chart
Citigroup
View slide
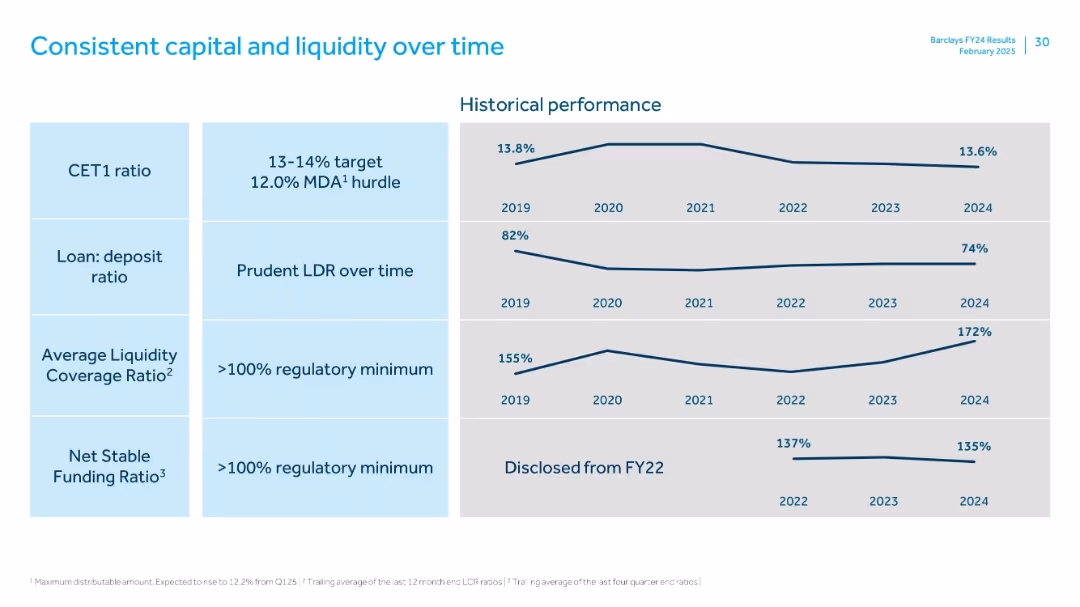
Grid layout with four metrics: CET1 ratio, loan:deposit ratio, liquidity coverage ratio, and funding ratio. Each metric has a trend line from 2019–2024.
Regulatory and Compliance
Financial Services
The slide highlights long-term stability in Barclays' capital and liquidity metrics. CET1 ratio stays within target range; LDR remains conservative; liquidity and funding ratios consistently exceed regulatory minimums.
CET1, LDR, LCR, NSFR, capital, liquidity, funding, 2024 trends
false
Regulatory and Compliance
Financial Services financial-services
Single Chart
Barclays
View slide
Dual bar charts comparing actual vs. required CET1 and leverage ratios
Regulatory and Compliance
Financial Services
Shows how Barclays’ CET1 capital ratio (12.5%) and UK leverage ratio (5.9%) exceed regulatory minimums. Helps illustrate compliance strength, capital buffers, and the institution’s financial resilience against regulatory thresholds.
CET1, Leverage Ratio, Regulation, Capital Buffer, Compliance, Barclays, Financial Safety, Ratios
false
Regulatory and Compliance
Financial Services financial-services
Multiple Chart
Barclays
View slide
The slide presents four vertical column charts in two color codes – blue for 'Bank Group (Harmonised)' and lighter blue for 'Bank Group (APRA)'. The graphs are plotted against a percentage scale with dotted lines indicating Basel III minimum standards.
Regulatory and Compliance
Financial Services
This slide illustrates the Bank Group's regulatory capital ratios as of December 2019, comparing the harmonised and APRA versions against Basel III minimums, potentially for a financial analysis or regulatory compliance presentation.
CET1, Leverage, LCR, NSFR, regulatory, ratios, Basel III, compliance, capital, banking
false
Regulatory and Compliance
Financial Services financial-services
Multiple Chart
Goldman Sachs
View slide
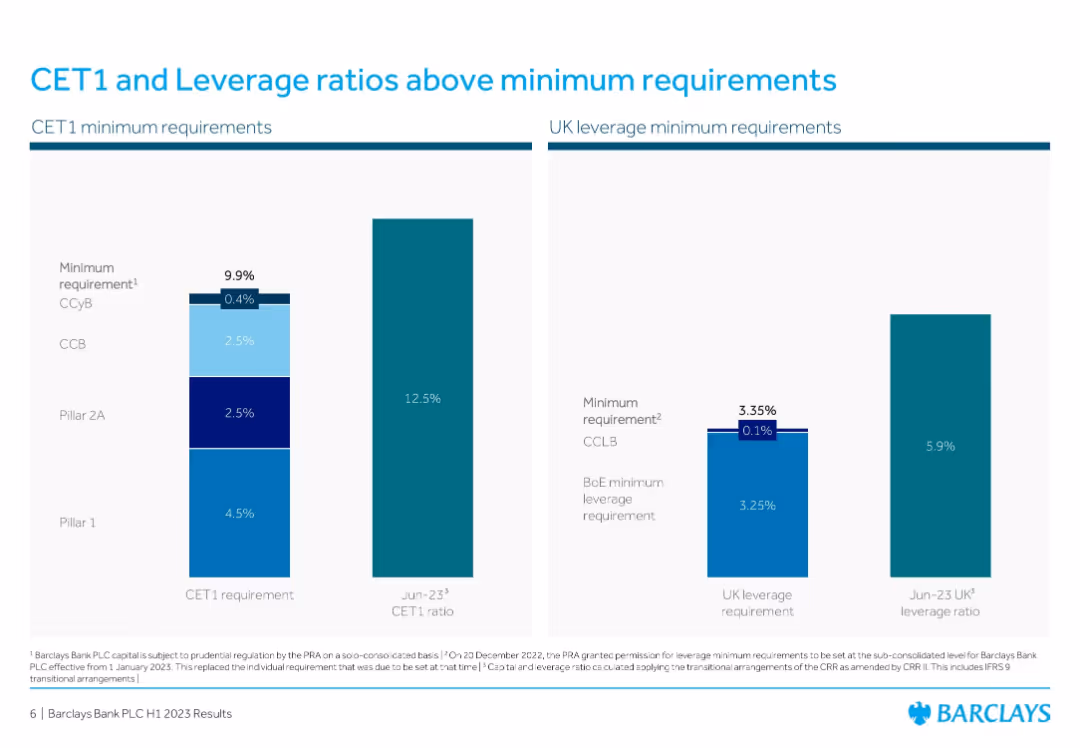
The slide features two sections with column charts. The left section shows a stacked column chart detailing CET1 minimum requirements at Dec-23 with percentages for various financial metrics. The right section shows three separate column charts comparing leverage minimum requirements.
Financial Performance
Financial Services
This slide provides a detailed view of the CET1 minimum requirements and leverage minimum requirements for financial entities as of December 2023, indicating regulatory compliance levels and financial health metrics.
CET1, MDA, leverage, financial metrics, compliance
false
Financial Performance
Financial Services financial-services
Multiple Chart
Barclays
View slide
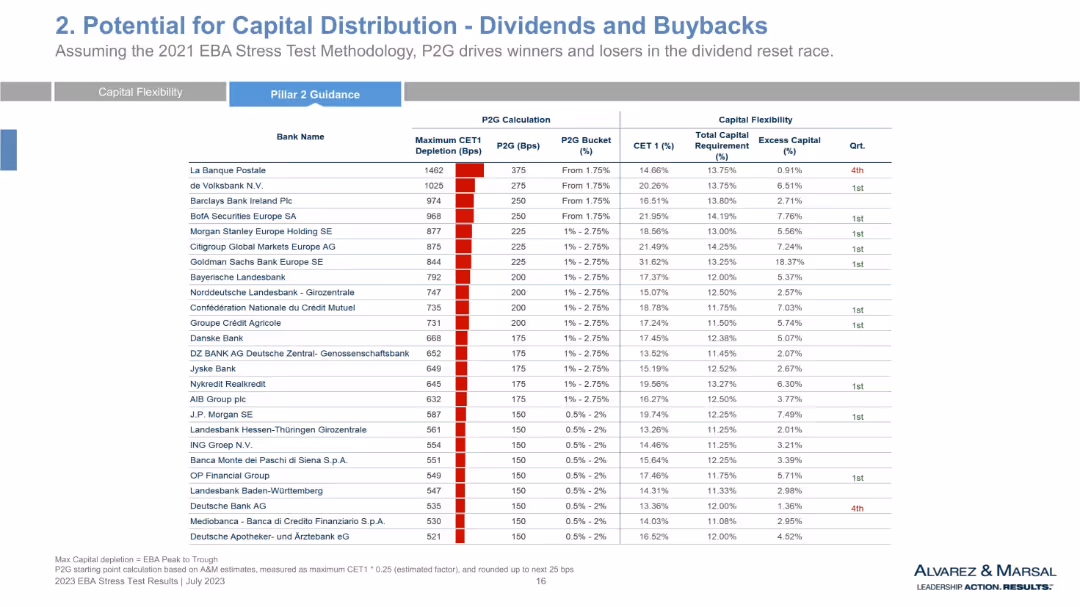
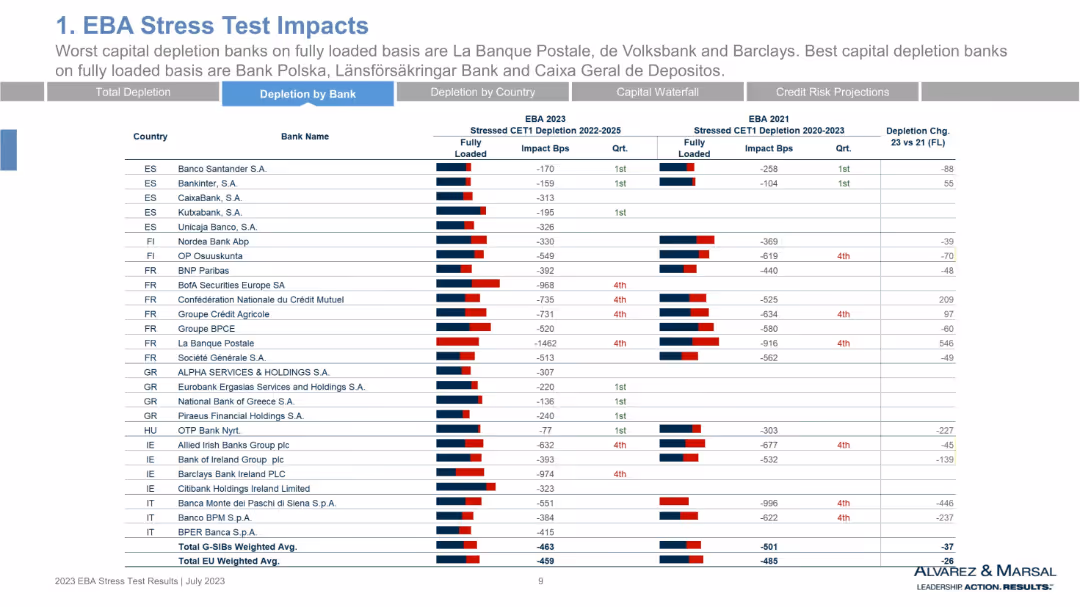
Tabular layout with detailed rows per bank, showing CET1 depletion, P2G, CET1%, total capital requirement, excess capital, and quartile ranking.
Regulatory and Compliance
Financial Services
This table quantifies individual bank performance under EBA stress testing, detailing CET1 depletion and assigned P2G buckets. It ranks banks by capital flexibility and provides quartile rankings. The focus is on differentiating capital capacity for dividends or buybacks, guiding regulatory interpretation of stress test results.
CET1, P2G, bank performance, capital requirement, dividend flexibility, EBA stress test, regulatory assessment, bucket ranking
false
Regulatory and Compliance
Financial Services financial-services
Single Chart
Alvarez & Marsal
View slide
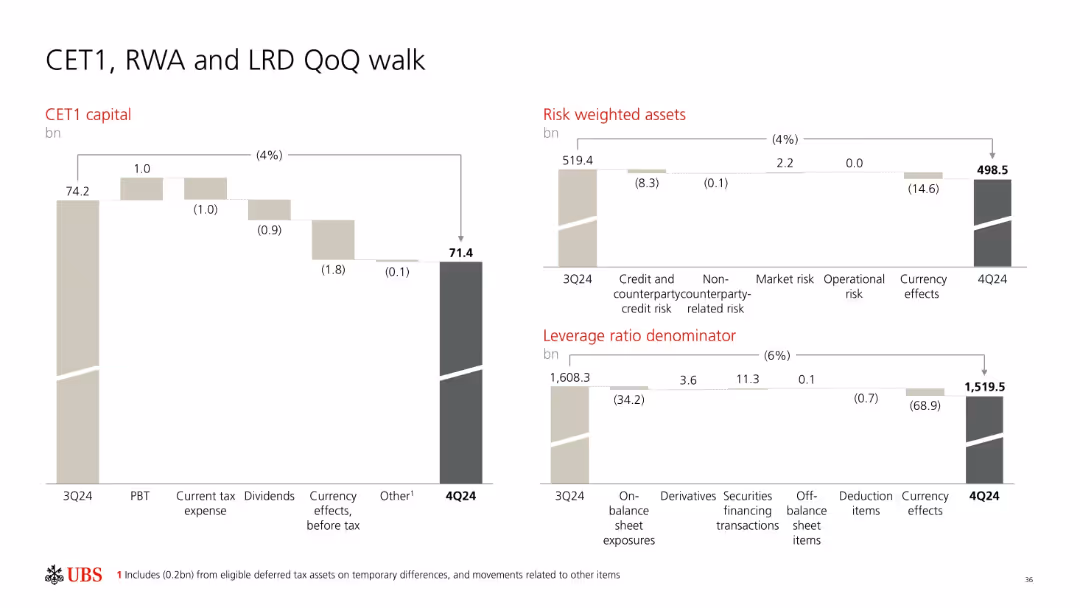
Three waterfall charts (CET1 capital, Risk-Weighted Assets, Leverage Ratio Denominator); neutral style with light beige and gray color coding.
Financial Performance
Financial Services
Shows quarter-over-quarter movement in UBS’s CET1 capital, Risk-Weighted Assets (RWA), and Leverage Ratio Denominator (LRD) from 3Q24 to 4Q24. Breaks down factors like tax expense, dividends, market risk, and currency effects contributing to changes in these key regulatory capital metrics.
CET1, RWA, LRD, capital movement, UBS, risk, leverage ratio
false
Financial Performance
Financial Services financial-services
Multiple Chart
UBS
View slide
Column charts showing CET1 capital, Risk weighted assets, and Leverage ratio denominator variations
Financial Performance
Financial Services
Highlights quarterly changes in CET1 capital, risk-weighted assets, and leverage ratio denominator
CET1, RWA, LRD, quarterly, capital
false
Financial Performance
Financial Services financial-services
Multiple Chart
UBS
View slide
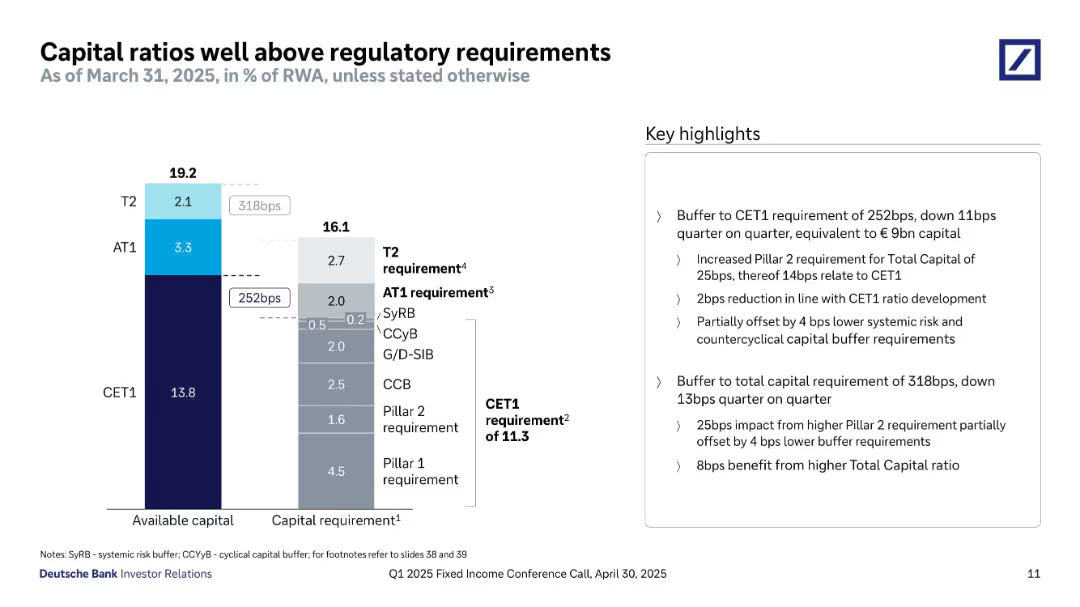
A vertical stacked bar chart compares available capital (T2, AT1, CET1) against regulatory requirements. A clear side-by-side layout with consistent color codes for capital types. Key highlights are listed on the right.
Regulatory and Compliance
Financial Services
This slide shows Deutsche Bank’s capital ratios are significantly above minimum regulatory requirements. The CET1 ratio has a 252bps buffer, while total capital has a 318bps buffer. The slide also breaks down regulatory minimums including Pillar 1 and 2, G-SIB, and countercyclical buffers. Highlights explain drivers of changes in buffer sizes and the impact of increased Pillar 2 requirements and changes in systemic buffer levels.
CET1, capital buffer, regulatory requirements, AT1, T2, Pillar 1, Pillar 2, G-SIB, capital adequacy
false
Regulatory and Compliance
Financial Services financial-services
Mixed Chart
Deutsche Bank
View slide
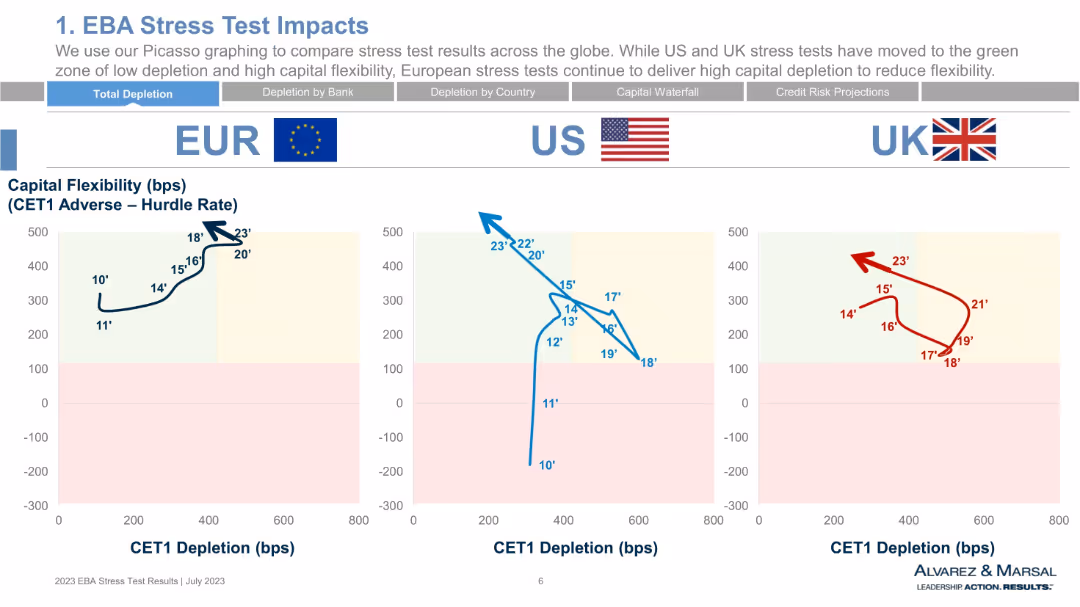
Line chart comparisons across EUR, US, and UK regions with national flags and CET1 depletion vs. capital flexibility axes. Uses color-coded backgrounds for impact zones.
Risk Assessment and Management
Financial Services
This slide compares CET1 depletion and capital flexibility by region (EU, US, UK) from 2010 to 2023. It shows regional trends and positions banks in “green” or “red” zones based on stress test outcomes. The EU shows high capital flexibility with moderate depletion, unlike the UK and US.
CET1, capital flexibility, EU vs US vs UK, stress testing, depletion, risk zones
false
Risk Assessment and Management
Financial Services financial-services
Single Chart
Alvarez & Marsal
View slide
Continuation of previous table, displaying CET1 depletion per bank across additional European countries. Red and blue bar comparisons per bank, numeric basis points data.
Risk Assessment and Management
Financial Services
Continuation of the stress test depletion analysis, expanding bank-level comparisons across Spain, Finland, France, Greece, Ireland, Italy, and more. Emphasizes capital weaknesses and resilience. Includes Banque Postale with extreme CET1 depletion (-1462bps).
CET1, capital impact, France, Greece, La Banque Postale, stress test, resilience
false
Risk Assessment and Management
Financial Services financial-services
Single Chart
Alvarez & Marsal
View slide
Waterfall chart showing changes in CET1 ratio from Q423 to Q424. Clear numeric and visual step-by-step adjustments.
Corporate Finance and Valuation
Financial Services
CET1 ratio decreased slightly from 13.8% to 13.6% due to buybacks, FX impacts, and acquisitions, despite strong attributable profits. Each component’s impact shown in basis points, highlighting careful capital management.
CET1, capital ratio, buyback, dividends, FX, profits, Q4 2024
false
Corporate Finance and Valuation
Financial Services financial-services
Single Chart
Barclays
Previous
Loading...
Hold On!
We are searching in our database
If nothing, comes up, please try different filters!
Column Chart
Heatmap
Chevron
Org Chart
Infographic
Callouts
Timeline
List
Graphic
Picture
Process Flow
Diagram
Paragraph
Map
Table
Framework
Subtitle
Takeaway Box
Icon
Other Chart
Radar Chart
Waterfall Chart
Mekko Chart
Pie Chart
Scatter Plot
Line Chart
Bar chart
Bullet points
Create a FREE account to continue browsing
Receive Instant Access to 1,000+ slides from companies like McKinsey, Google, and Goldman Sachs
First Name
Last Name
Email
Password
I agree to all
Terms & Privacy Policy
Thank you! Your submission has been received!
Oops! Something went wrong while submitting the form.
Have an account?
Sign in
Upgrade to PRO to Save slides
Advanced Search and Filters
Access to 15,000+ slides
Access to Category Pages
Save/Bookmark Slides
PowerPoint Template Library
Pick a Plan
MONTHLY
$12/month
Billed every month, Cancel anytime.
YEARLY
$9/year
Billed $108 annually, Cancel anytime.
Checkout for $12/month
Checkout for $108/yr
Secured by Stripe | AES-256 bit encryption