My Account
My Slides
Search by Category
Templates
View All Templates
Download Template Slides
Leave Feedback
Login
Logout
Get Started
Browse all Slides
Browse all Slides
Create a FREE Account
Instant access to 1,000+ real slides from top companies like McKinsey, BCG, Goldman Sachs, Google and many more!
First Name
Last Name
Email
Password
I agree to all
Terms & Privacy Policy
Thank you! Your submission has been received!
Oops! Something went wrong while submitting the form.
Have an account?
Sign in
Spark Your Next Big Idea with New Presentation Templates
VIEW ALL Templates
Welcome,
Welcome
PRO
Show Featured Only
Checkbox 8
Companies
Mckinsey
Bain
BCG
EY
Deloitte
Accenture
PwC/Strategy&
JP Morgan
Goldman Sachs
Morgan Stanley
Citigroup
Deutsche Bank
Barclays
LEK
KPMG
Kearney
Oliver Wyman
Booz Allen Hamilton
Gartner
IPSOS
Nielsen
Slide type
Text Only
Linear Flow
Vertical Flow
Single Chart
Header Horizontal
Mixed Chart
Header Vertical
Pillar
Multiple Chart
Graphic
Agenda
Title
Table
Framework
Industry
Technology & Software
Artificial Intelligence
Financial Services
Retail & E-commerce
Consumer Goods
Industrial & Manufacturing
Transportation & Logistics
Telecommunications
Real Estate & Construction
Hospitality & Tourism
Professional Services
Education & Training
Media & Entertainment
Agriculture & Food Production
Healthcare & Pharmaceuticals
Environmental Services & Sustainability
Government & Public Sector
Use Case
Mergers and Acquisitions
Performance Metrics and KPIs
Client Case Studies
Competitive Landscape
Corporate Finance and Valuation
Product and Service Analysis
Customer and Market Segmentation
Organizational Structure and Change
Industry Overview
Regulatory and Compliance
Risk Assessment and Management
Investment Analysis
Organizational Structure and Change
Human Resources and Talent Management
Financial Performance
Market Analysis and Trends
Sales and Business Development
Human Resources and Talent Management
Clear all
Thank you! Your submission has been received!
Oops! Something went wrong while submitting the form.
Tag
View slide
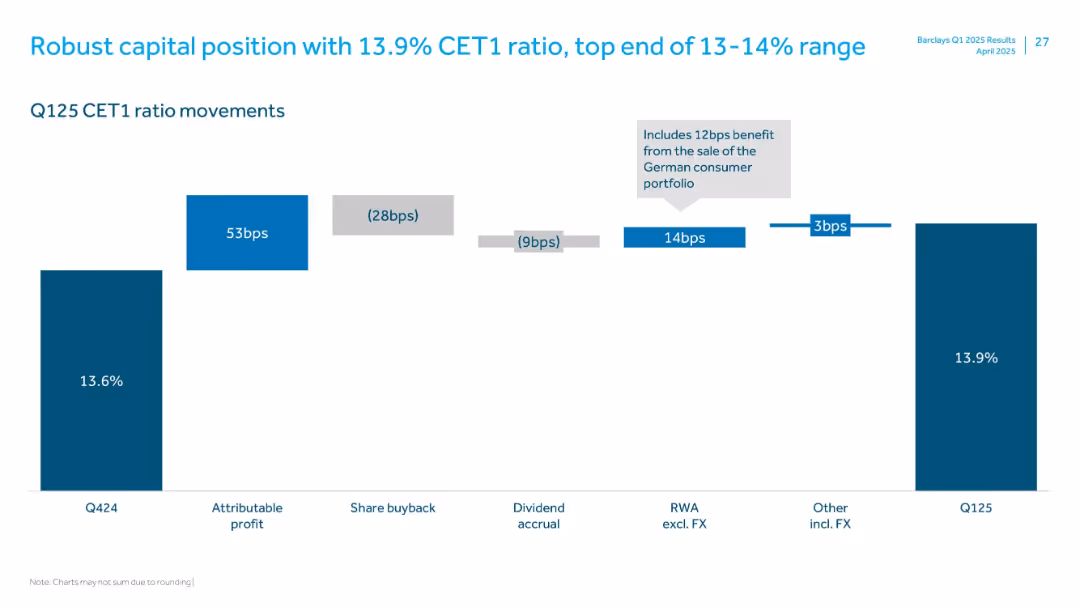
Waterfall bar chart with labeled segments showing CET1 ratio movements from Q424 to Q125
Financial Performance
Financial Services
Illustrates the movement in Barclays' CET1 ratio from Q424 to Q125, highlighting positive and negative contributors such as attributable profit, share buybacks, and RWA changes, ending at 13.9%.
CET1, capital ratio, profit, RWA, share buyback, FX, Q125
false
Financial Performance
Financial Services financial-services
Single Chart
Barclays
View slide
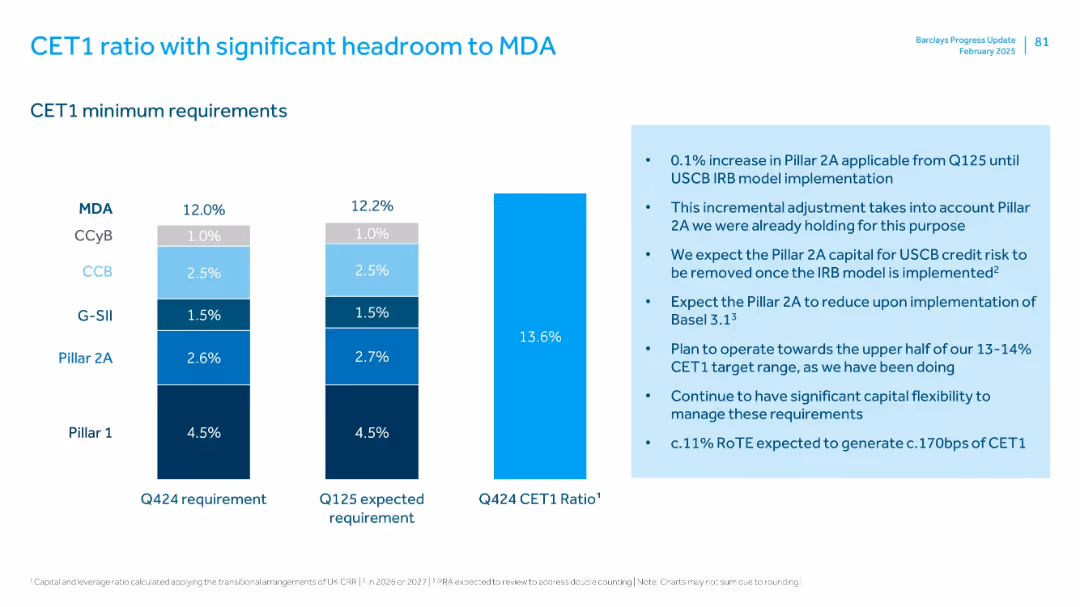
Vertical stacked bar charts showing CET1 ratio vs. regulatory minimums. Text box explains Pillar 2A changes.
Regulatory and Compliance
Financial Services
Shows Barclays’ CET1 ratio (13.6%) exceeds the regulatory minimum (12.0%-12.2%) providing significant buffer. Explains expected future reduction in capital requirements and ongoing flexibility in managing regulatory capital targets.
CET1, capital requirements, regulatory, MDA, Pillar 2A, Basel 3.1
false
Regulatory and Compliance
Financial Services financial-services
Mixed Chart
Barclays
View slide
Featuring column charts and numeric details, the slide shows CET1 ratio movements and RWA adjustments over recent quarters.
Financial Performance
Financial Services
Focuses on the bank's CET1 ratio movements within a target range, detailing specific impacts from dividends and other adjustments on capital.
CET1, capital, dividends, RWA, adjustments
false
Financial Performance
Financial Services financial-services
Single Chart
Barclays
View slide
Column chart depicting changes in CET1 capital from 2Q22 to 3Q22. Visuals include net profit, repurchase, dividend, currency effects, and others.
Financial Performance
Financial Services
Shows the progression of CET1 capital across different periods, highlighting the contributions and deductions leading to the final 3Q22 figure.
CET1, capital, net profit, dividend, currency
false
Financial Performance
Financial Services financial-services
Single Chart
UBS
View slide
Two stacked bar charts: one for CET1 requirements and one for leverage ratios; minimal text and light color theme
Regulatory and Compliance
Financial Services
Shows Barclays’ CET1 and leverage ratios versus regulatory minimums as of H1 2024. Emphasizes that the bank holds capital well above the thresholds, ensuring a strong capital base and regulatory compliance.
CET1, leverage ratio, Barclays, H1 2024, regulatory capital, minimum requirement, financial strength
false
Regulatory and Compliance
Financial Services financial-services
Multiple Chart
Barclays
View slide
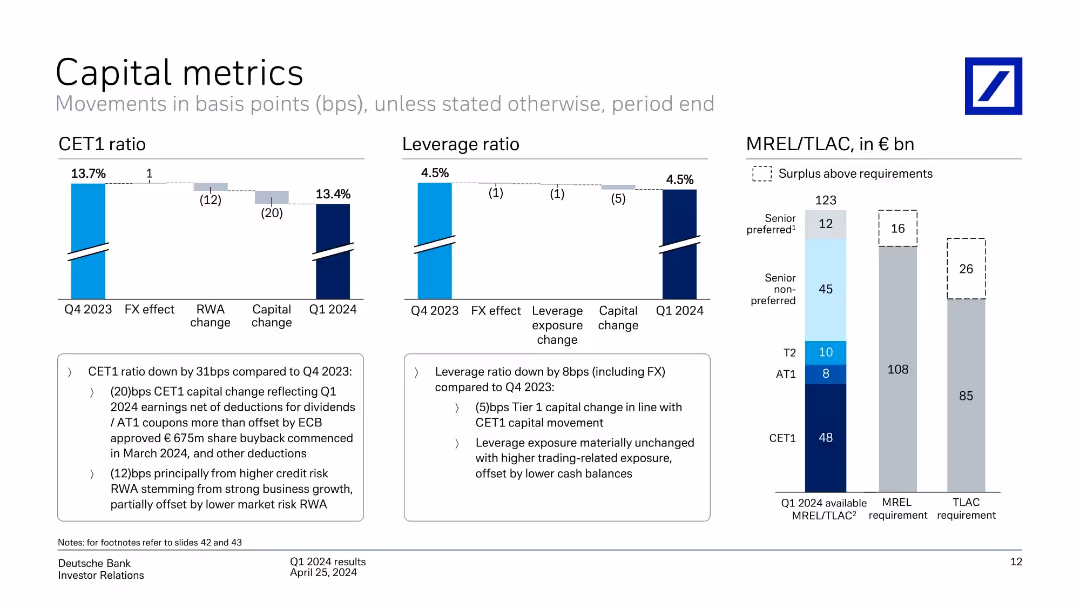
Three-panel layout: CET1 ratio, leverage ratio, and MREL/TLAC bar chart; text box summaries below
Financial Performance
Financial Services
Compares Q1 2024 capital metrics with Q4 2023, highlighting decreases in CET1 and leverage ratios due to capital changes and FX effects. The slide shows MREL/TLAC composition and surplus over regulatory requirements.
CET1, leverage ratio, MREL, TLAC, capital, regulatory surplus, FX effects
false
Financial Performance
Financial Services financial-services
Multiple Chart
Deutsche Bank
View slide
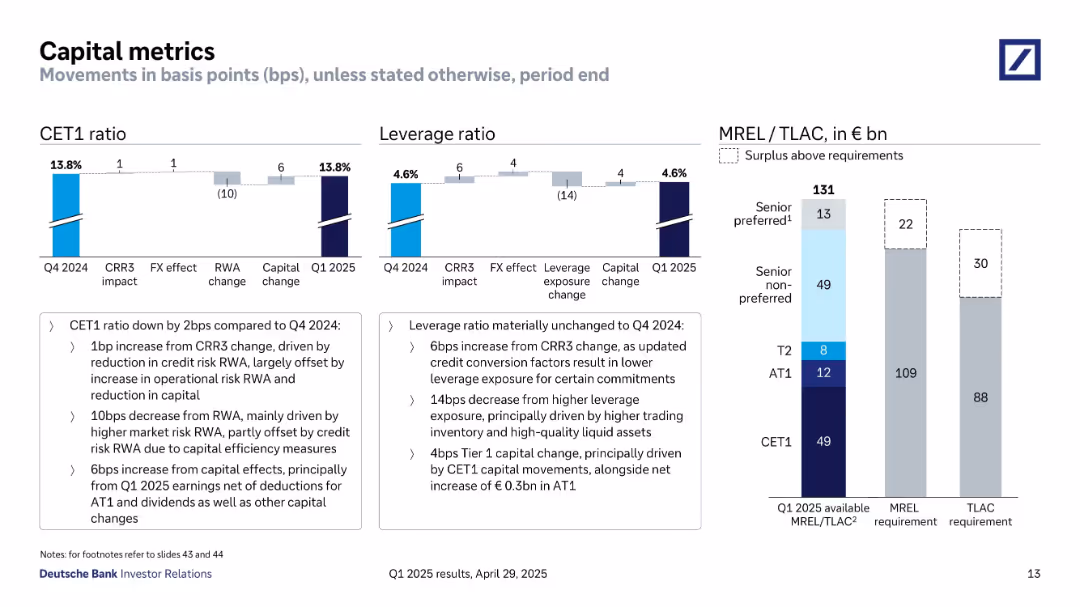
Bar and waterfall charts showing CET1 ratio, leverage ratio, and MREL/TLAC surplus; detailed annotations explain movements
Regulatory and Compliance
Financial Services
Provides a detailed overview of Deutsche Bank’s capital metrics as of Q1 2025. It includes movements in CET1 and leverage ratios and shows sufficient MREL/TLAC buffers above regulatory requirements.
CET1, leverage ratio, MREL, TLAC, regulatory capital, Deutsche Bank
false
Regulatory and Compliance
Financial Services financial-services
Multiple Chart
Deutsche Bank
View slide
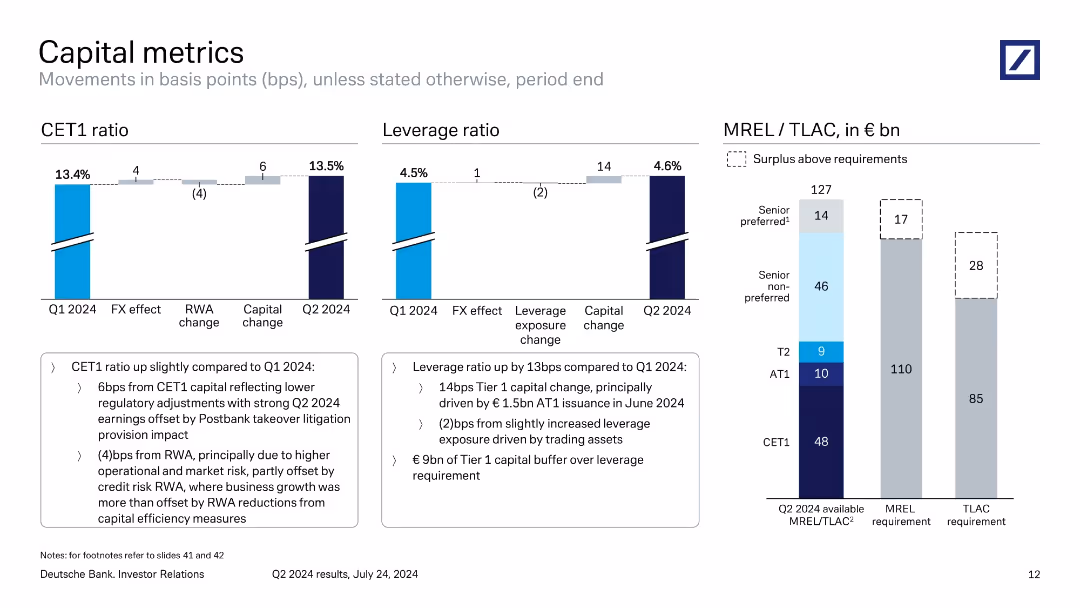
Three-panel chart layout for CET1 ratio, leverage ratio, and MREL/TLAC with supporting commentary.
Regulatory and Compliance
Financial Services
Summarizes capital adequacy and regulatory ratios as of Q2 2024. The CET1 and leverage ratios improved, driven by capital changes. MREL/TLAC status shows a surplus above requirements, reinforcing financial strength amid regulatory requirements.
CET1, leverage ratio, MREL, TLAC, regulatory capital, surplus, Deutsche Bank
false
Regulatory and Compliance
Financial Services financial-services
Multiple Chart
Deutsche Bank
View slide
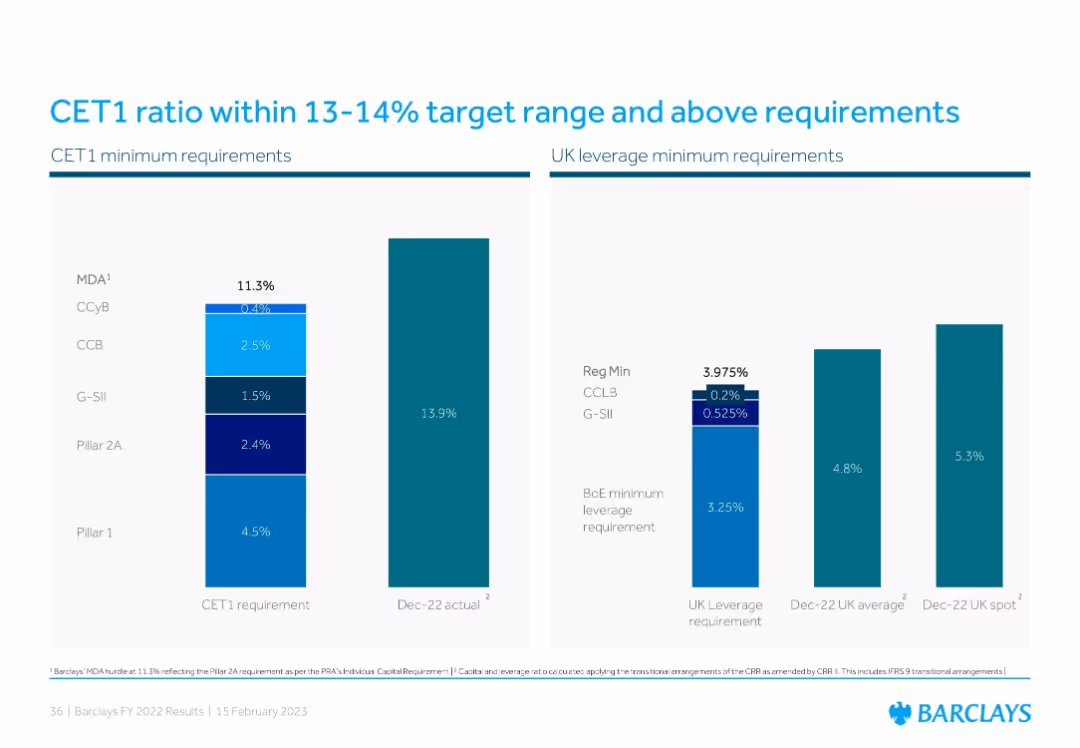
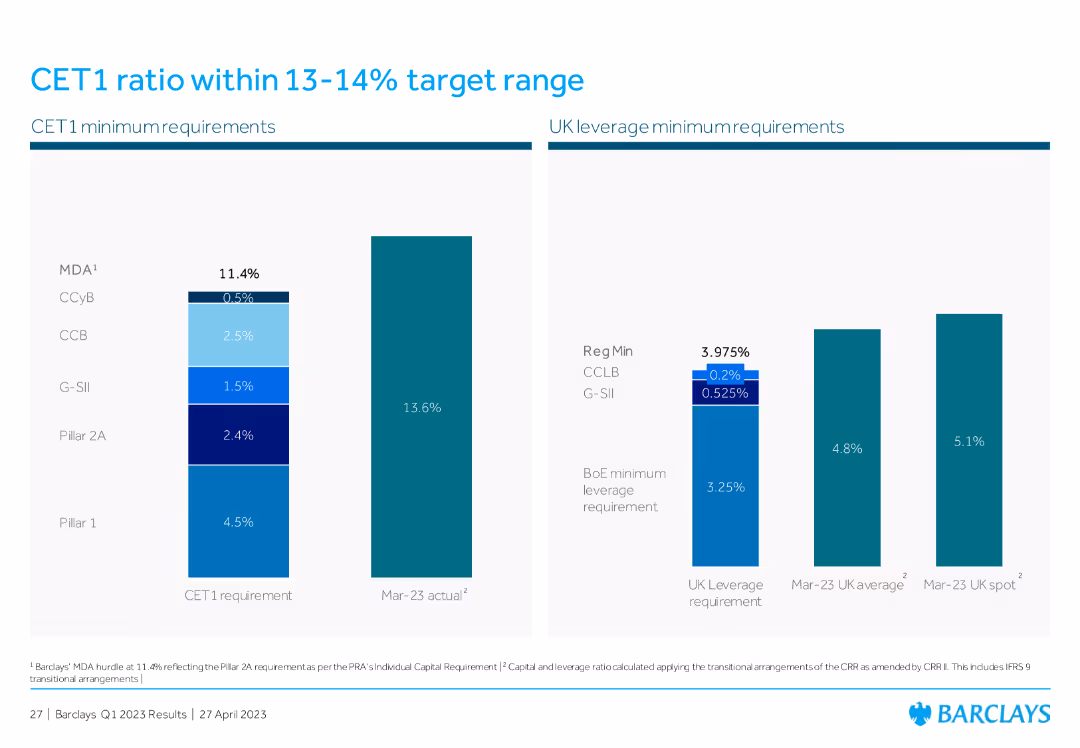
Dual bar charts illustrating CET1 minimum requirement components and actual CET1 ratio, alongside UK leverage ratio requirements and Barclays’ actuals.
Regulatory and Compliance
Financial Services
This slide compares Barclays' actual CET1 and UK leverage ratios against regulatory minimums. It demonstrates that the bank maintains sufficient capital and leverage buffers above the required thresholds, remaining in its 13–14% CET1 target range.
CET1, leverage ratio, capital requirements, regulation, Barclays
false
Regulatory and Compliance
Financial Services financial-services
Multiple Chart
Barclays
View slide
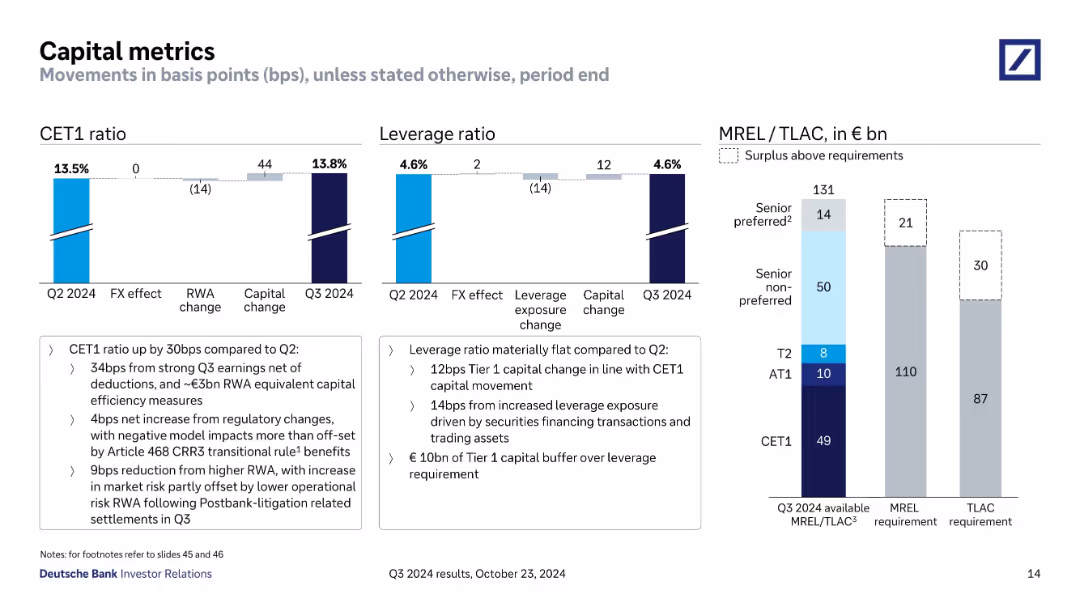
Three main charts: CET1 ratio, Leverage ratio, and MREL/TLAC stacked bars with basis points changes.
Regulatory and Compliance
Financial Services
Outlines changes in capital ratios (CET1, leverage) and capital buffer compliance (MREL/TLAC). Discusses effects from earnings, FX, regulation, and litigation settlements. Emphasizes strength in regulatory buffers and stable leverage.
CET1, leverage, MREL, TLAC, capital change, compliance
false
Regulatory and Compliance
Financial Services financial-services
Multiple Chart
Deutsche Bank
View slide
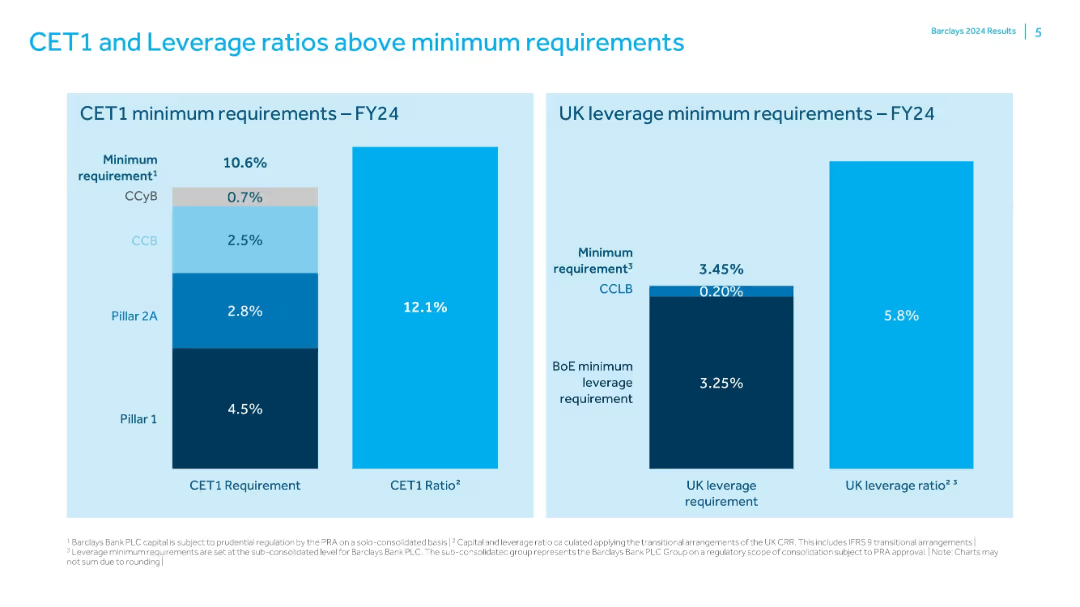
Two bar charts comparing Barclays' capital ratios to regulatory minimums; simple labeled format.
Risk Assessment and Management
Financial Services
Shows that Barclays exceeds FY24 minimum CET1 (10.6%) and UK leverage (3.45%) requirements with actual ratios of 12.1% and 5.8% respectively. Charts break down the components of regulatory minimums and the capital buffers in place.
CET1, leverage, regulatory capital, Barclays, risk management, capital ratio
false
Risk Assessment and Management
Financial Services financial-services
Single Chart
Barclays
View slide
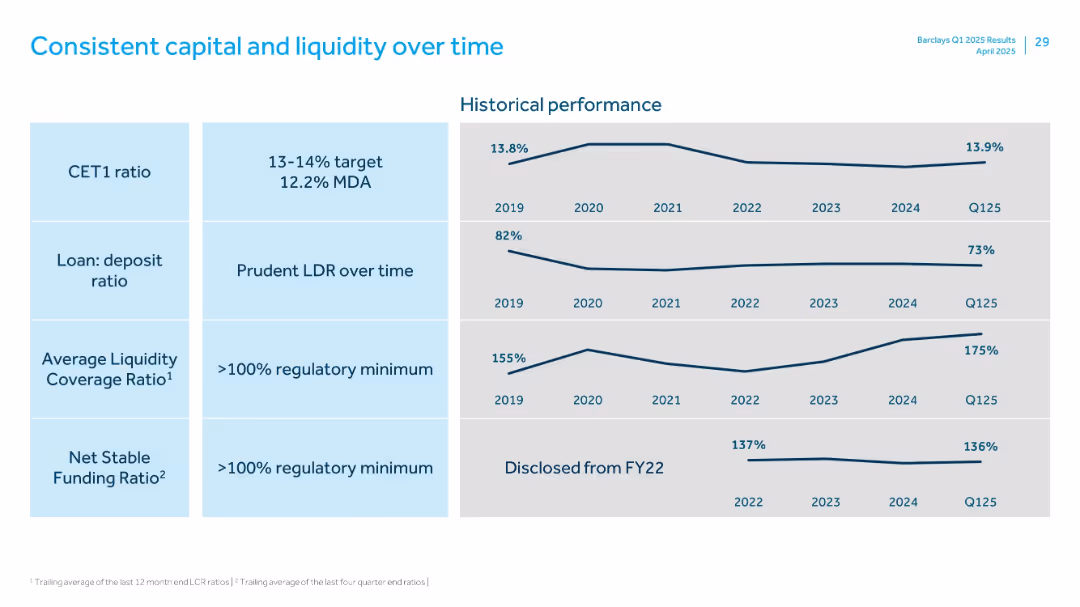
Matrix on the left and line graphs on the right showing historical trends of key financial ratios
Financial Performance
Financial Services
Presents historical trends (2019–Q125) for CET1 ratio, loan-to-deposit ratio, liquidity coverage ratio, and net stable funding ratio, emphasizing prudence and consistency across regulatory and capital metrics.
CET1, liquidity ratio, funding ratio, loan-deposit, trends
false
Financial Performance
Financial Services financial-services
Single Chart
Barclays
View slide
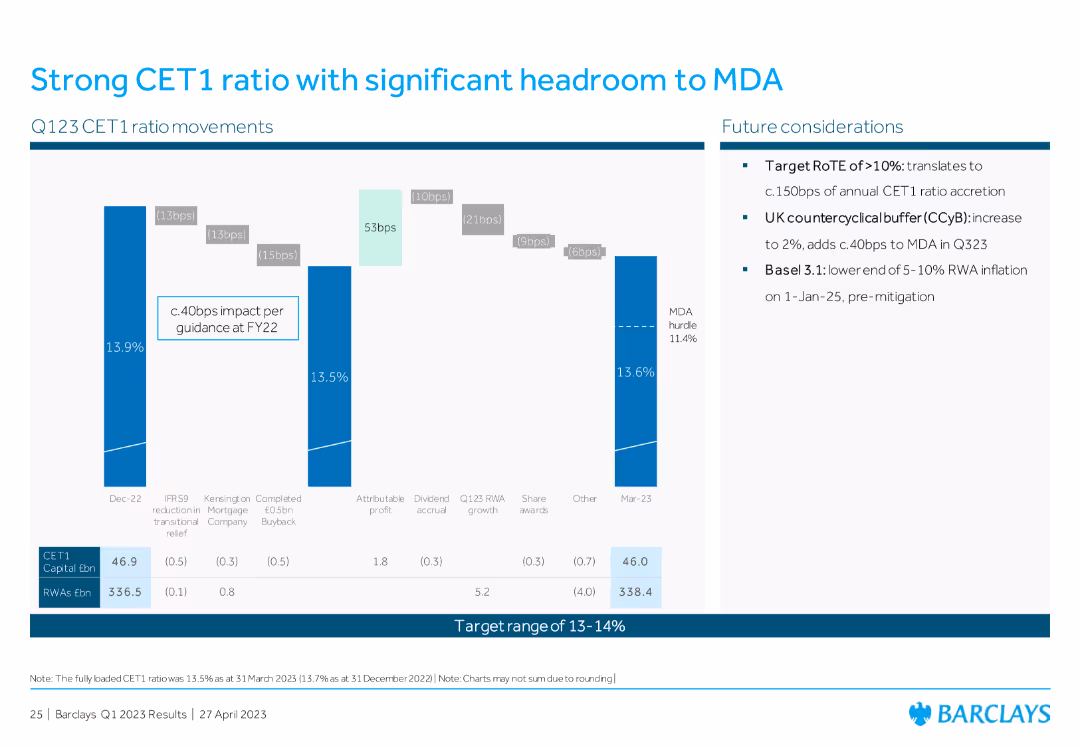
The slide contains a column chart showing CET1 ratio movements from December 2022 to March 2023. There are labels indicating basis point changes and a future considerations section with bullet points on the right.
Financial Performance
Financial Services
This slide displays the CET1 ratio movements over a period with a focus on financial metrics and future considerations for maintaining the capital ratio. It highlights key impacts and planned financial adjustments.
CET1, ratio, MDA, financial performance, basis points
false
Financial Performance
Financial Services financial-services
Mixed Chart
Barclays
View slide
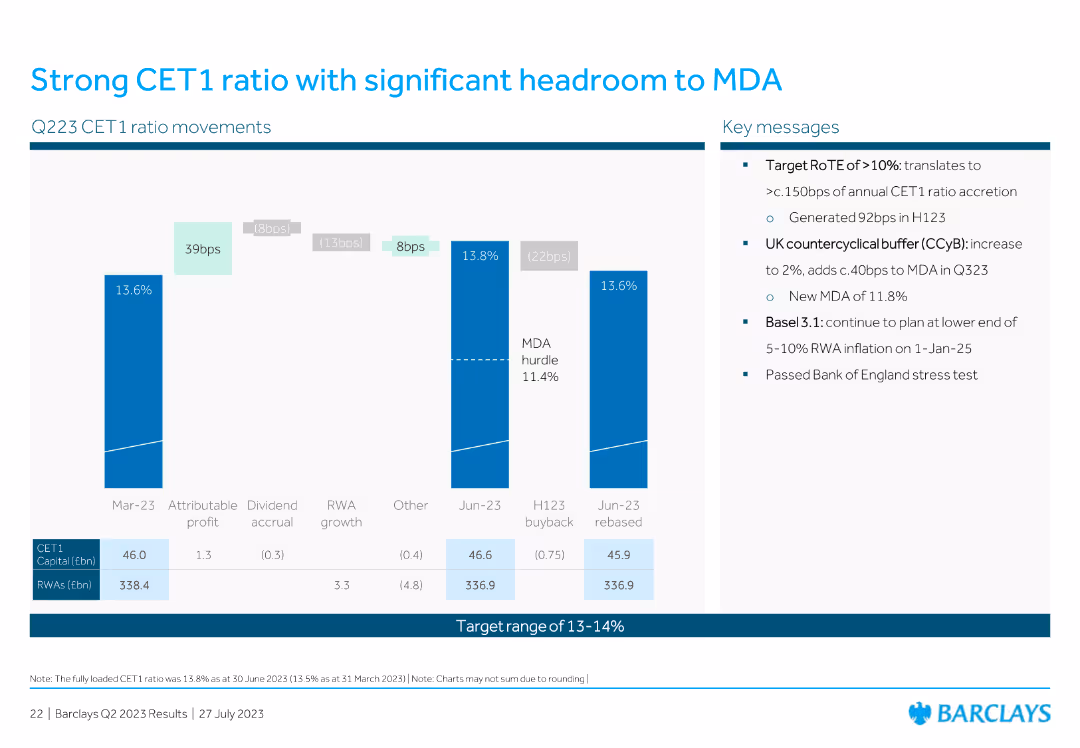
Features column charts showing CET1 ratio movements and key messages related to financial metrics.
Financial Performance
Financial Services
Highlights CET1 ratio movements and the significant headroom to the MDA, including regulatory updates and key financial data.
CET1, ratio, MDA, financial, regulatory
false
Financial Performance
Financial Services financial-services
Header Vertical
Barclays
View slide
Contains bar charts and key metrics related to CET1 ratio movements and regulatory headroom.
Financial Performance
Financial Services
Explains the strong CET1 ratio and the significant headroom to the MDA, including key regulatory and financial metrics.
CET1, ratio, MDA, regulatory, headroom
false
Financial Performance
Financial Services financial-services
Mixed Chart
Barclays
View slide
The slide features a bar chart showing the progression of CET1 ratio targets over time, with explanatory text on each contributing factor.
Financial Performance
Financial Services
The slide presents the target CET1 ratio of greater than 13.5% by 2025, outlining the steps and capital actions required to achieve this financial stability goal.
CET1, ratio, target, financial, stability
false
Financial Performance
Financial Services financial-services
Single Chart
Credit Suisse
View slide
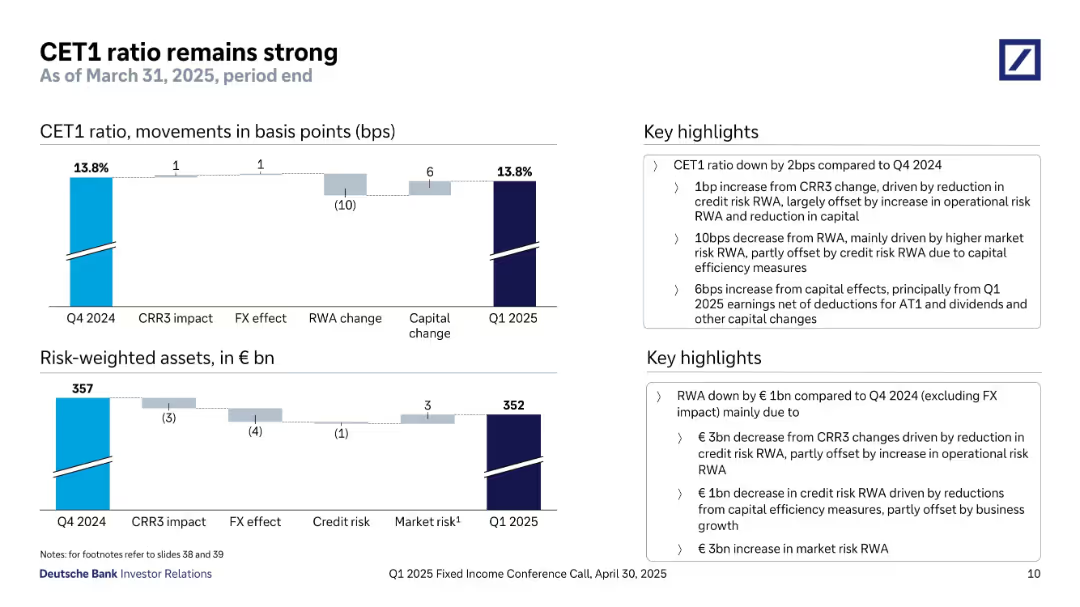
Two horizontal bar charts show changes in CET1 ratio (in bps) and risk-weighted assets (in € bn) from Q4 2024 to Q1 2025. Text boxes on the right provide detailed bullet point highlights. Blue and dark grey color schemes are used consistently.
Financial Performance
Financial Services
This slide outlines the stability of the CET1 ratio at 13.8% despite market fluctuations. It shows the impact of CRR3, FX effects, and capital changes. Risk-weighted assets slightly decreased to €352bn. The highlights explain how capital efficiency measures and operational risk RWA changes contributed to the overall CET1 stability and provide context for the underlying asset and risk trends.
CET1, risk-weighted assets, capital change, RWA, CRR3, FX impact, financial stability, capital efficiency
false
Financial Performance
Financial Services financial-services
Multiple Chart
Deutsche Bank
View slide
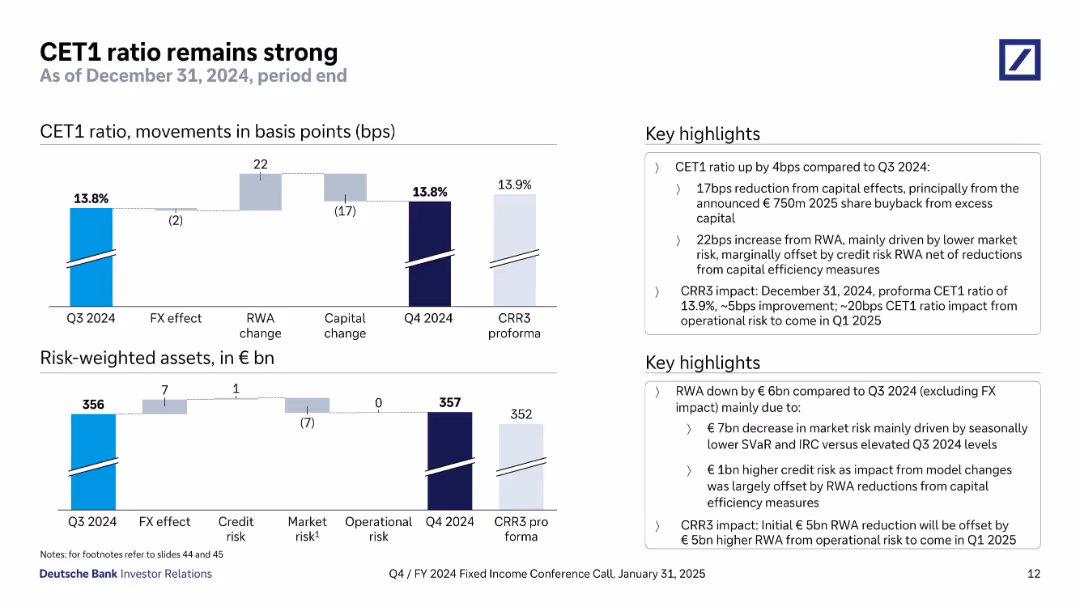
Two bar charts: one showing CET1 ratio movements in bps, the other showing risk-weighted assets. Key highlights explain changes and CRR3 impact.
Regulatory and Compliance
Financial Services
The slide indicates Deutsche Bank’s CET1 ratio stability at 13.8%, detailing drivers of change such as FX effects, RWA changes, and capital movements. The slide also projects the impact of CRR3 regulation expected in Q1 2025.
CET1, risk-weighted assets, capital, CRR3, compliance, ratios
false
Regulatory and Compliance
Financial Services financial-services
Multiple Chart
Deutsche Bank
View slide
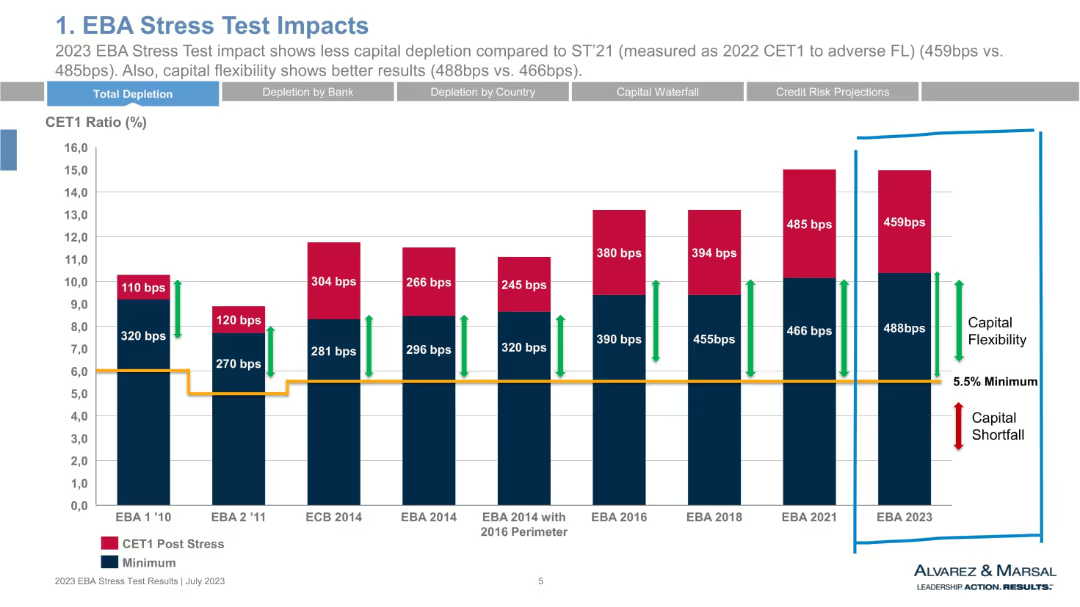
Bar chart showing CET1 ratio changes across different years. Uses color blocks (red and blue) and vertical markers. Axis labels in %, and years labeled at the bottom.
Risk Assessment and Management
Financial Services
A historical bar chart tracks CET1 ratio shifts during past EBA stress tests, comparing capital depletion (bps) and capital flexibility. 2023 results show slightly less depletion than 2021, with better capital buffers. Emphasizes the importance of resilience under severe scenarios.
CET1, stress test, capital flexibility, depletion, EBA history, 2023, EU banks
false
Risk Assessment and Management
Financial Services financial-services
Single Chart
Alvarez & Marsal
View slide
The slide includes two column charts; one for CET1 minimum requirements and another for UK leverage minimum requirements, showing various regulatory levels and actual values.
Financial Performance
Financial Services
The slide provides a detailed breakdown of the CET1 ratio requirements and actual performance, emphasizing regulatory minimums and the current status within the target range for capital adequacy.
CET1, target range, leverage, regulatory, financial
false
Financial Performance
Financial Services financial-services
Multiple Chart
Barclays
View slide
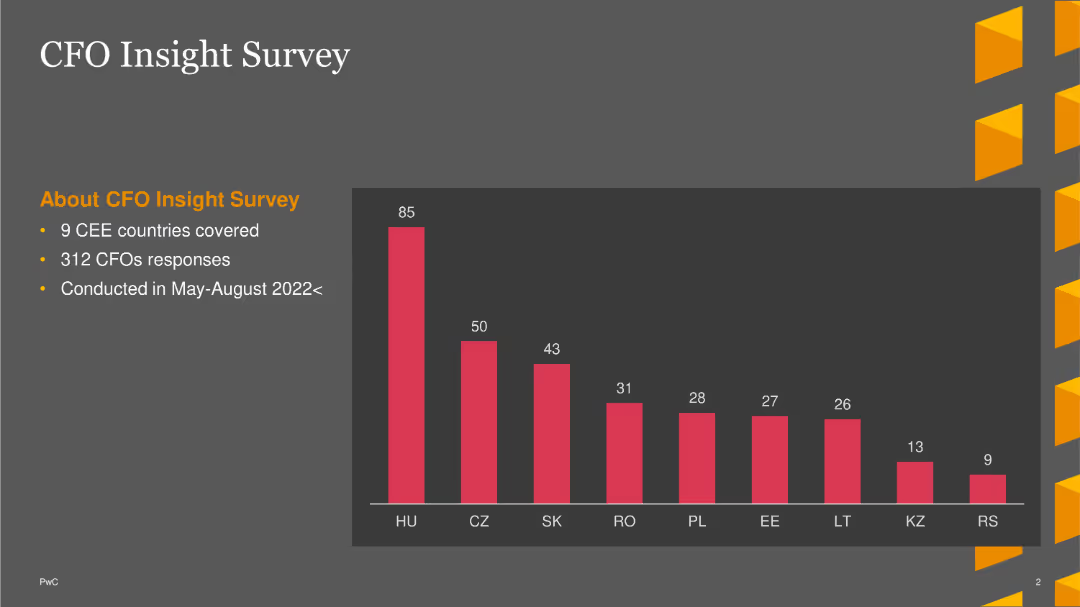
The slide contains a column chart with vertical bars representing responses from CFOs across nine CEE countries. The left side lists key details about the survey.
Market Analysis and Trends
Financial Services
This slide presents the results of a CFO survey covering nine CEE countries with 312 responses, conducted between May and August 2022.
CFO Survey, CEE, Financial, 2022, Responses, Insights, Column Chart, PwC
false
Market Analysis and Trends
Financial Services financial-services
Mixed Chart
PwC/Strategy&
View slide
A pie chart shows the prioritization of different areas by CFOs since the start of COVID-19. The chart uses shades of green and blue to represent areas like cashflow management and people and talent, with cashflow management taking the largest portion (43%).
Risk Assessment and Management
Financial Services
Discusses the shifting priorities of CFOs during the COVID-19 pandemic, emphasizing the focus on cashflow management as the highest priority, followed by forecasting and people management. This indicates a strategic pivot towards essential financial management and resilience building in uncertain times.
CFO, COVID-19, financial priorities, cashflow management, risk management
false
Risk Assessment and Management
Financial Services financial-services
Single Chart
Deloitte
View slide
The slide features a pie chart showing the resources CFOs need to deliver on their priorities, such as investment, alignment, skills, and bandwidth. The text provides an overview of the key factors affecting CFOs' ability to achieve their goals.
Human Resources and Talent Management
Financial Services
Discusses the resources necessary for CFOs to achieve their business priorities, including investment in IT infrastructure, stakeholder alignment, and team skills. The pie chart visually represents the distribution of these resources, highlighting the critical areas for successful financial management.
CFO, Resources, Priorities, Investment, Skills
false
Human Resources and Talent Management
Financial Services financial-services
Mixed Chart
Deloitte
View slide
The slide includes a detailed comparison of CFO and stakeholder priorities in a horizontal bar chart. It highlights different business priorities and their relative importance to CFOs and stakeholders, with a difference bar chart to the right.
Financial Performance
Financial Services
Analyzes the primary business priorities for CFOs and stakeholders, focusing on performance, transformation, risk management, and transactions. The charts provide a visual comparison of these priorities and their relative importance, revealing areas of alignment and divergence.
CFO, Stakeholders, Priorities, Financial Performance, Analysis
false
Financial Performance
Financial Services financial-services
Multiple Chart
Deloitte
View slide
The slide shows two horizontal bar charts comparing how CFOs spend their time on different objectives and in practice, split between formal and informal settings. It also includes a quote from a private equity investor.
Financial Performance
Financial Services
Details the allocation of CFOs' time across various functions, emphasizing differences between formal and informal practices. Highlights the importance of flexibility and adaptability in CFO roles, supported by a quote from a private equity investor discussing the need for versatile financial leadership.
CFO, Time Allocation, Financial Management, Leadership, Priorities
false
Financial Performance
Financial Services financial-services
Mixed Chart
Deloitte
View slide
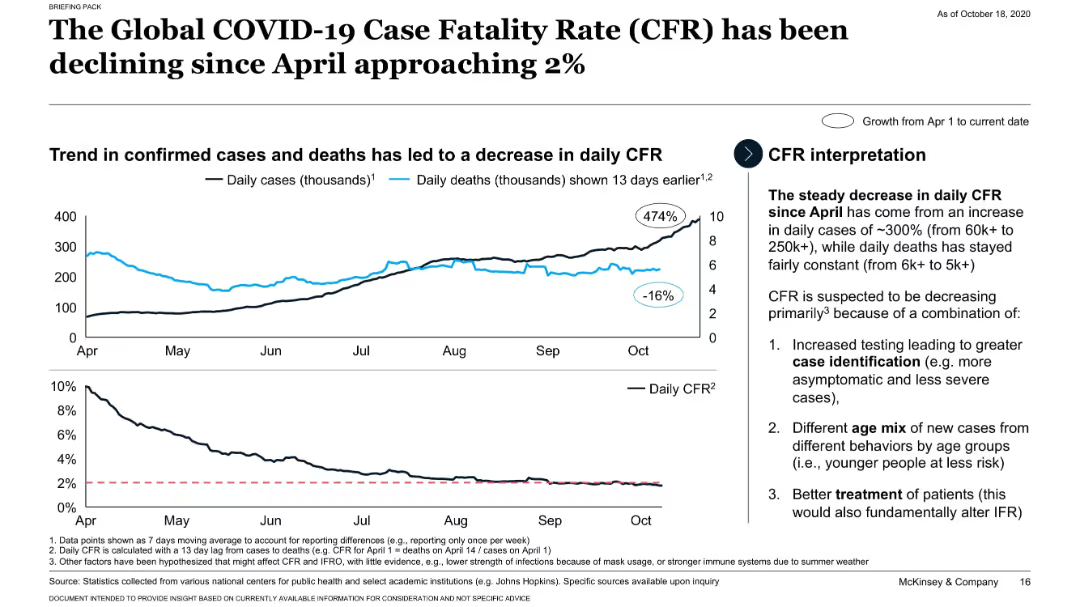
Line charts showing CFR decline alongside increase in daily cases and relative constancy in deaths.
Performance Metrics and KPIs
Healthcare & Pharmaceuticals
Analyzes the inverse relationship between rising COVID-19 cases and falling case fatality rates globally, with three main causes: better identification, different age mix, and improved treatment.
CFR decline, COVID-19, testing, treatment, case surge
false
Performance Metrics and KPIs
Healthcare & Pharmaceuticals healthcare-and-pharmaceuticals
Mixed Chart
McKinsey
View slide
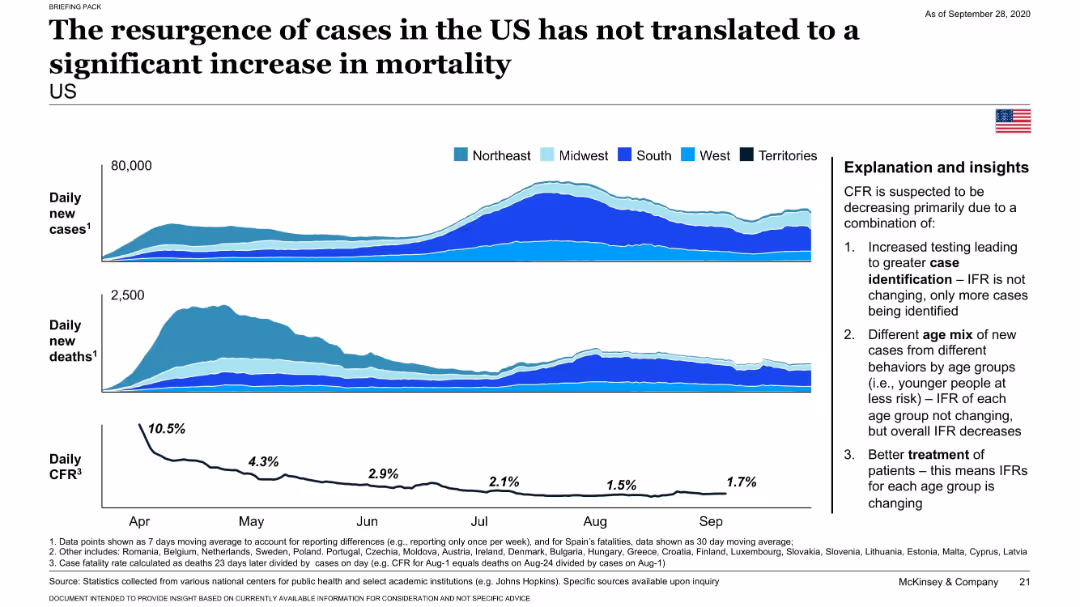
Stacked area charts for daily new cases and deaths, and a line graph for CFR, segmented by U.S. regions; includes a text box with bullet points explaining insights.
Risk Assessment and Management
Healthcare & Pharmaceuticals
Shows that despite a spike in COVID-19 cases in the U.S., the case fatality rate (CFR) and deaths have not risen proportionately. Explains this trend with factors such as increased testing, changes in age mix of cases, and better treatment protocols.
CFR, COVID-19, testing, mortality, case surge, regional analysis, insights
false
Risk Assessment and Management
Healthcare & Pharmaceuticals healthcare-and-pharmaceuticals
Mixed Chart
McKinsey
View slide
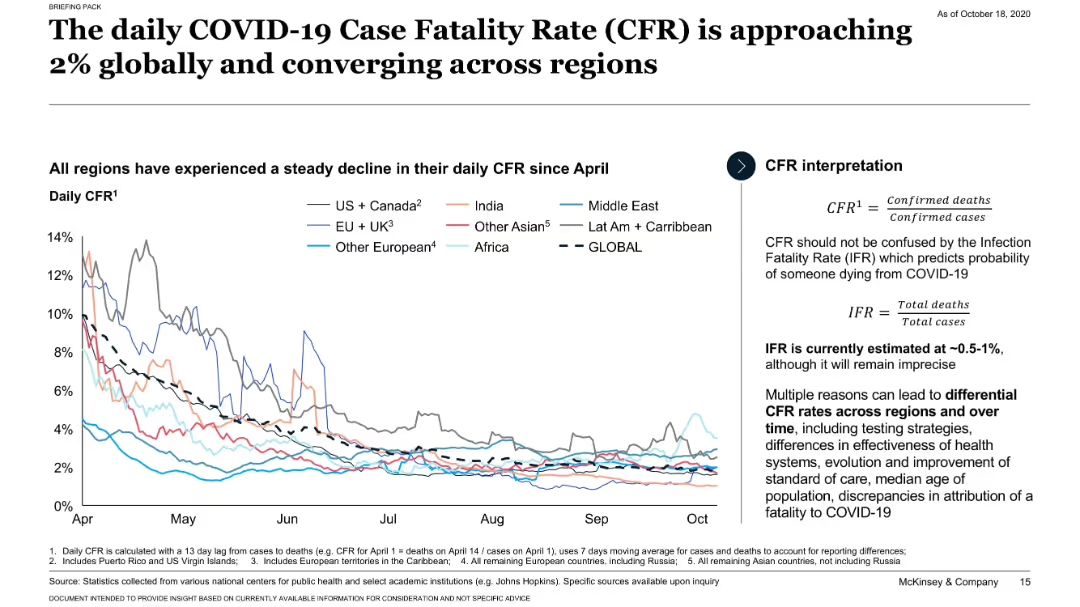
Line chart tracking daily CFR trends globally and by region since April; CFR definitions provided.
Performance Metrics and KPIs
Healthcare & Pharmaceuticals
Shows that the global daily COVID-19 CFR has declined and converged around 2% across regions. Introduces the distinction between CFR and IFR and discusses why CFR may vary.
CFR, global trends, IFR, regional comparison, COVID-19
false
Performance Metrics and KPIs
Healthcare & Pharmaceuticals healthcare-and-pharmaceuticals
Mixed Chart
McKinsey
View slide
Split layout with left-aligned explanation text and bar chart on the right. Colored segments categorize different fund types.
Regulatory and Compliance
Government & Public Sector
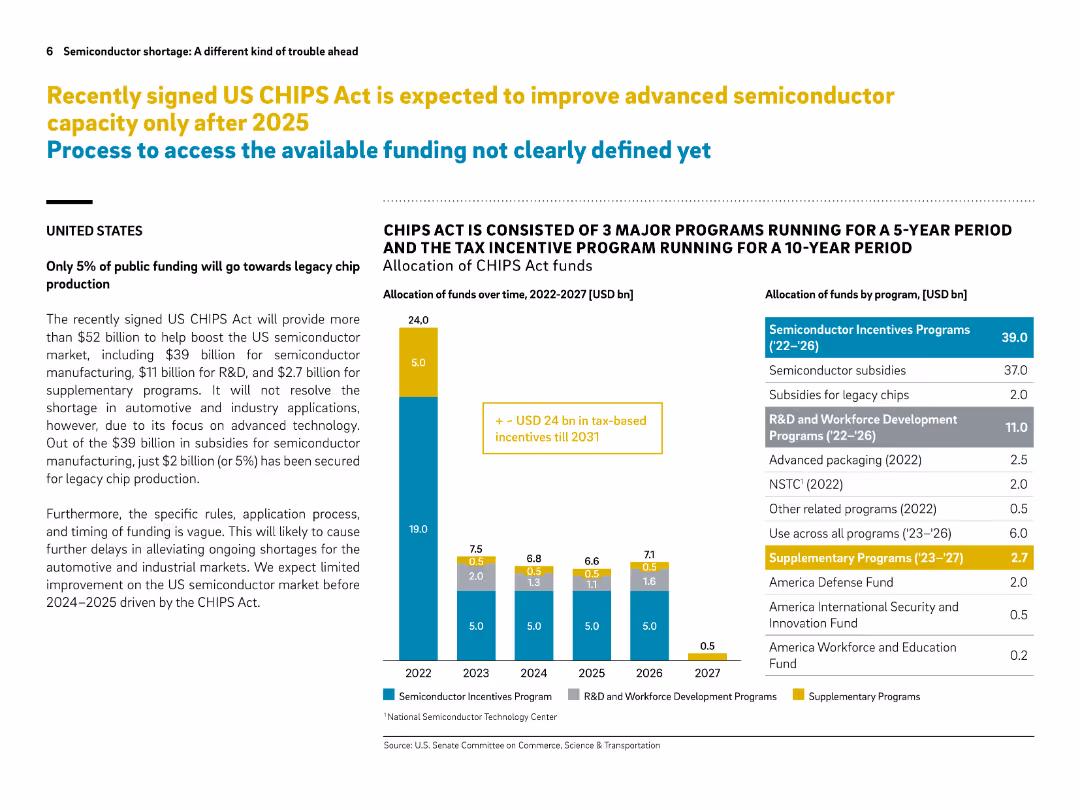
This slide explains the funding allocation under the US CHIPS Act, emphasizing that only 5% is directed to legacy chip production. It breaks down how over $52B will be spent, highlighting delays in impact and lack of support for industrial/automotive applications.
CHIPS Act, funding, semiconductor, legacy chips, US policy, advanced technology, subsidies, R&D, timeline, market support
false
Regulatory and Compliance
Government & Public Sector government-and-public-sector
Mixed Chart
Roland Berger
View slide
Split layout with summary and vertical funding bar graph showing $278.2B allocations; various shaded blocks and categories
Regulatory and Compliance
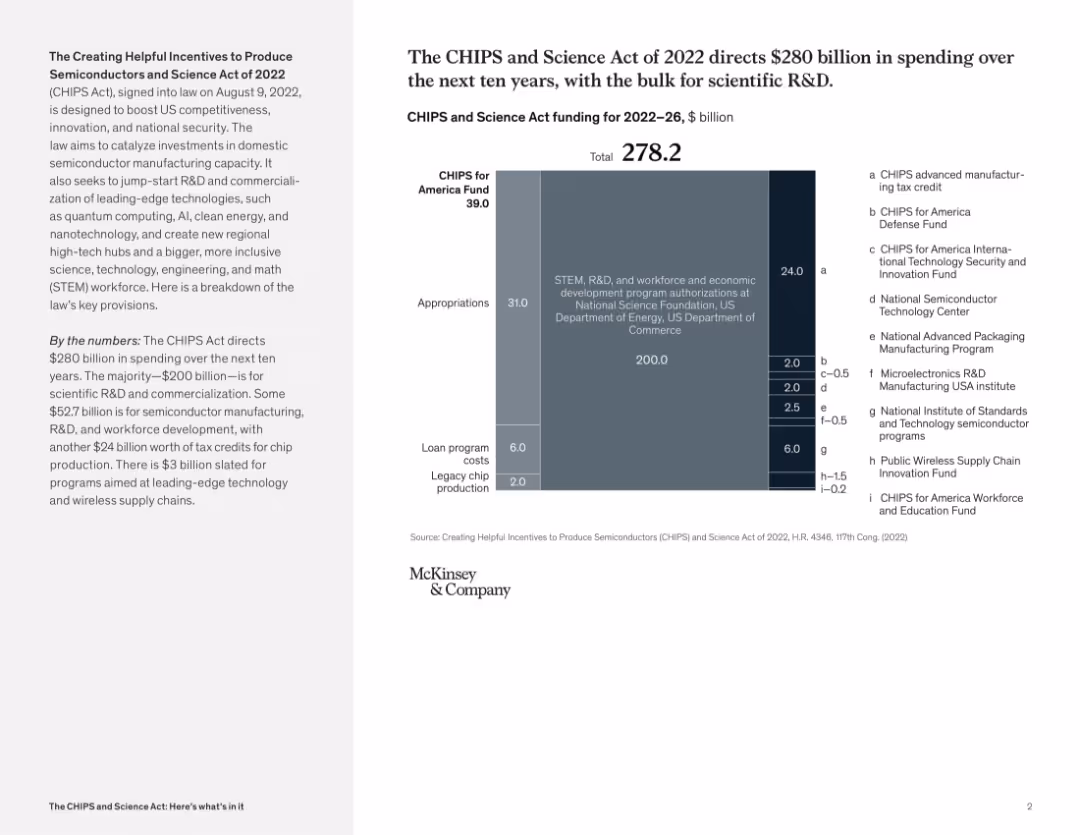
Government & Public Sector
This slide presents a breakdown of CHIPS Act spending from 2022–2026. It categorizes appropriations for R&D, loan programs, tax credits, and specific funds for semiconductor development and innovation. It communicates strategic investment priorities for boosting U.S. technology leadership.
CHIPS Act, semiconductor funding, R&D, government investment, science policy, U.S. competitiveness, federal spending
false
Regulatory and Compliance
Government & Public Sector government-and-public-sector
Mixed Chart
McKinsey
Previous
Loading...
Hold On!
We are searching in our database
If nothing, comes up, please try different filters!
Column Chart
Heatmap
Chevron
Org Chart
Infographic
Callouts
Timeline
List
Graphic
Picture
Process Flow
Diagram
Paragraph
Map
Table
Framework
Subtitle
Takeaway Box
Icon
Other Chart
Radar Chart
Waterfall Chart
Mekko Chart
Pie Chart
Scatter Plot
Line Chart
Bar chart
Bullet points
Create a FREE account to continue browsing
Receive Instant Access to 1,000+ slides from companies like McKinsey, Google, and Goldman Sachs
First Name
Last Name
Email
Password
I agree to all
Terms & Privacy Policy
Thank you! Your submission has been received!
Oops! Something went wrong while submitting the form.
Have an account?
Sign in
Upgrade to PRO to Save slides
Advanced Search and Filters
Access to 15,000+ slides
Access to Category Pages
Save/Bookmark Slides
PowerPoint Template Library
Pick a Plan
MONTHLY
$12/month
Billed every month, Cancel anytime.
YEARLY
$9/year
Billed $108 annually, Cancel anytime.
Checkout for $12/month
Checkout for $108/yr
Secured by Stripe | AES-256 bit encryption