My Account
My Slides
Search by Category
Templates
View All Templates
Download Template Slides
Leave Feedback
Login
Logout
Get Started
Browse all Slides
Browse all Slides
Create a FREE Account
Instant access to 1,000+ real slides from top companies like McKinsey, BCG, Goldman Sachs, Google and many more!
First Name
Last Name
Email
Password
I agree to all
Terms & Privacy Policy
Thank you! Your submission has been received!
Oops! Something went wrong while submitting the form.
Have an account?
Sign in
Spark Your Next Big Idea with New Presentation Templates
VIEW ALL Templates
Welcome,
Welcome
PRO
Show Featured Only
Checkbox 8
Companies
Mckinsey
Bain
BCG
EY
Deloitte
Accenture
PwC/Strategy&
JP Morgan
Goldman Sachs
Morgan Stanley
Citigroup
Deutsche Bank
Barclays
LEK
KPMG
Kearney
Oliver Wyman
Booz Allen Hamilton
Gartner
IPSOS
Nielsen
Slide type
Text Only
Linear Flow
Vertical Flow
Single Chart
Header Horizontal
Mixed Chart
Header Vertical
Pillar
Multiple Chart
Graphic
Agenda
Title
Table
Framework
Industry
Technology & Software
Artificial Intelligence
Financial Services
Retail & E-commerce
Consumer Goods
Industrial & Manufacturing
Transportation & Logistics
Telecommunications
Real Estate & Construction
Hospitality & Tourism
Professional Services
Education & Training
Media & Entertainment
Agriculture & Food Production
Healthcare & Pharmaceuticals
Environmental Services & Sustainability
Government & Public Sector
Use Case
Mergers and Acquisitions
Performance Metrics and KPIs
Client Case Studies
Competitive Landscape
Corporate Finance and Valuation
Product and Service Analysis
Customer and Market Segmentation
Organizational Structure and Change
Industry Overview
Regulatory and Compliance
Risk Assessment and Management
Investment Analysis
Organizational Structure and Change
Human Resources and Talent Management
Financial Performance
Market Analysis and Trends
Sales and Business Development
Human Resources and Talent Management
Clear all
Thank you! Your submission has been received!
Oops! Something went wrong while submitting the form.
Tag
View slide
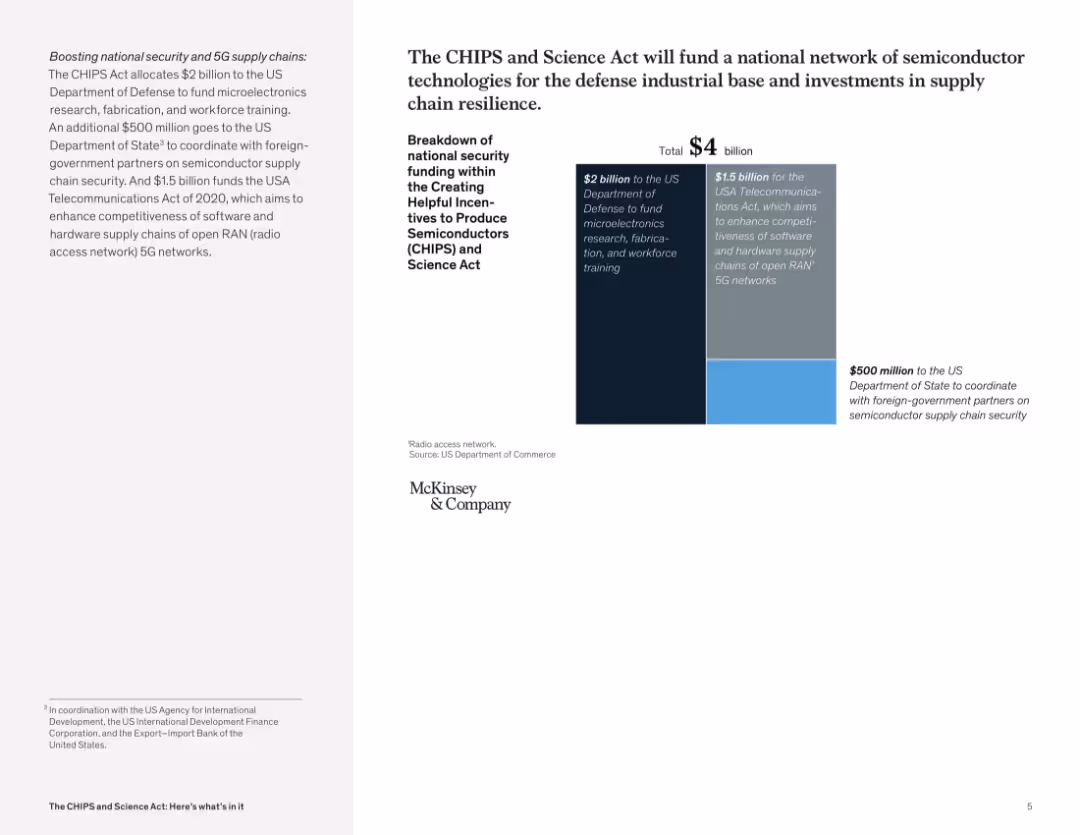
Two-column layout with text on the left and a bar graph with segmented funding blocks on the right; minimal design, McKinsey branding.
Strategic Planning
Government & Public Sector
This slide presents a $4 billion allocation from the CHIPS and Science Act, breaking it down into three components: $2B for microelectronics research and training, $1.5B for software and hardware 5G networks, and $500M for international coordination on semiconductor security.
CHIPS Act, semiconductor, funding, microelectronics, 5G, supply chain, security, US Department of Defense, workforce training, telecommunications
false
Strategic Planning
Government & Public Sector government-and-public-sector
Mixed Chart
McKinsey
View slide
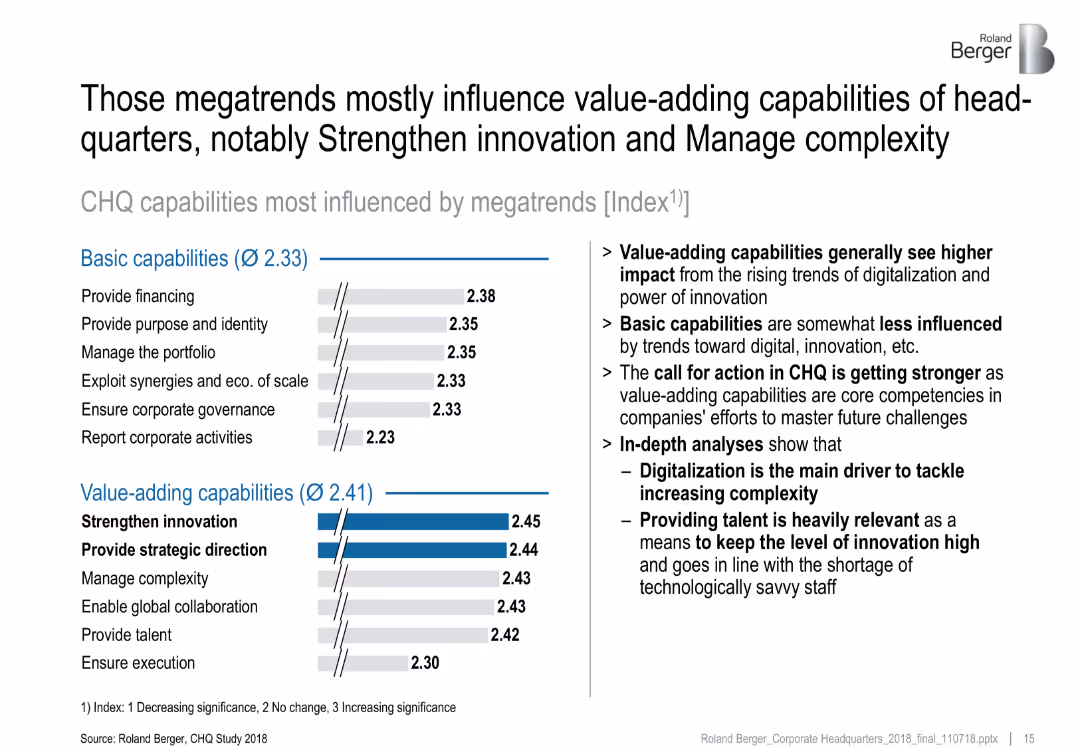
Two bar graphs comparing basic vs. value-adding CHQ capabilities; right column features bullet insights
Performance Metrics and KPIs
Professional Services
This slide contrasts the influence of megatrends on basic vs. value-adding CHQ capabilities. Value-adding functions such as “Strengthen Innovation” and “Manage Complexity” show greater impact. Digitalization and talent provision are emphasized as strategic levers.
CHQ capabilities, value-adding, megatrends, innovation, complexity, digitalization
false
Performance Metrics and KPIs
Professional Services professional-services
Multiple Chart
Roland Berger
View slide
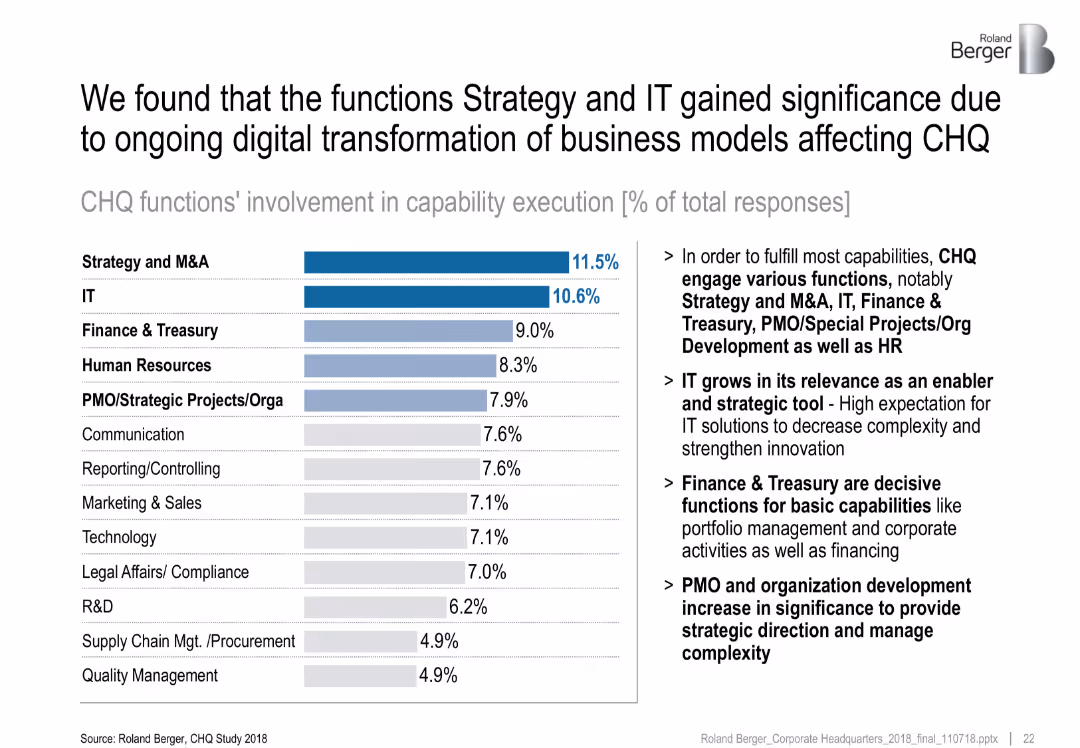
Horizontal bar chart ranked by % involvement of functions in capability execution; side notes provide context
Technology and Digital Transformation
Professional Services
This slide ranks CHQ functions by their involvement in executing capabilities, with Strategy & M&A and IT at the top. It highlights the growing strategic importance of IT and PMO roles in enabling transformation and managing complexity.
CHQ functions, IT, strategy, capability execution, transformation
false
Technology and Digital Transformation
Professional Services professional-services
Mixed Chart
Roland Berger
View slide
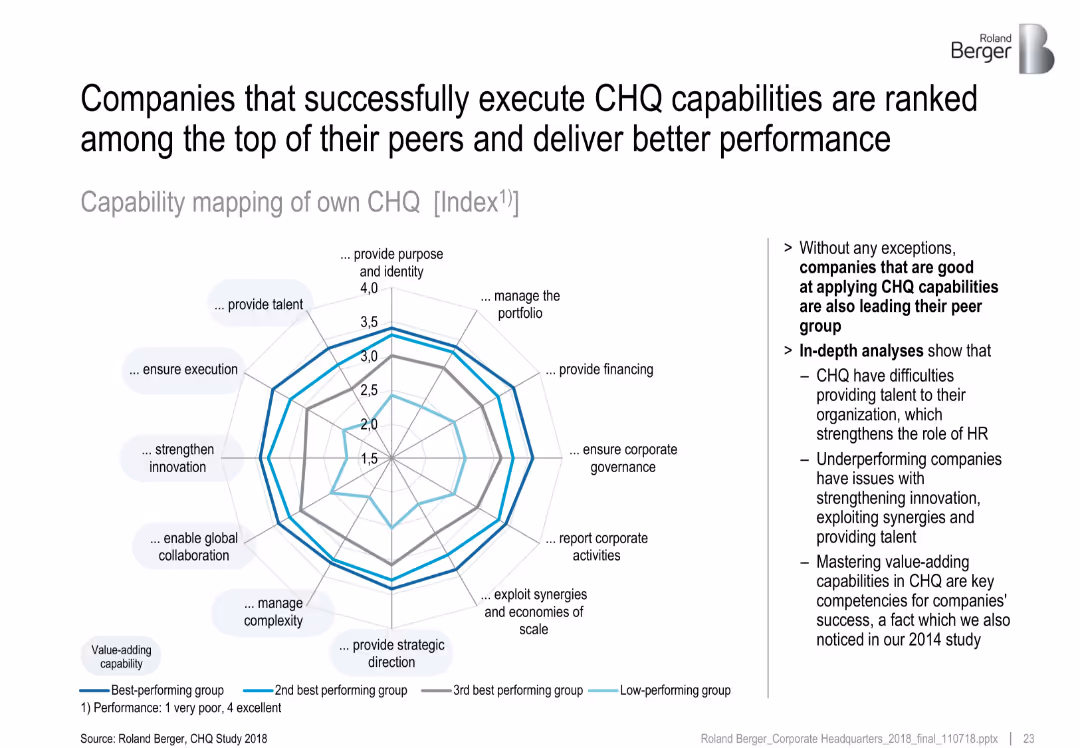
Spider/radar chart comparing performance of CHQ capabilities across four performance groups; right-hand summary
Performance Metrics and KPIs
Professional Services
This slide maps CHQ capability execution across different performance groups. Best performers excel in value-adding roles like innovation and complexity management, while low performers struggle with talent and execution.
CHQ performance, peer group, radar chart, capability mapping, innovation
false
Performance Metrics and KPIs
Professional Services professional-services
Mixed Chart
Roland Berger
View slide
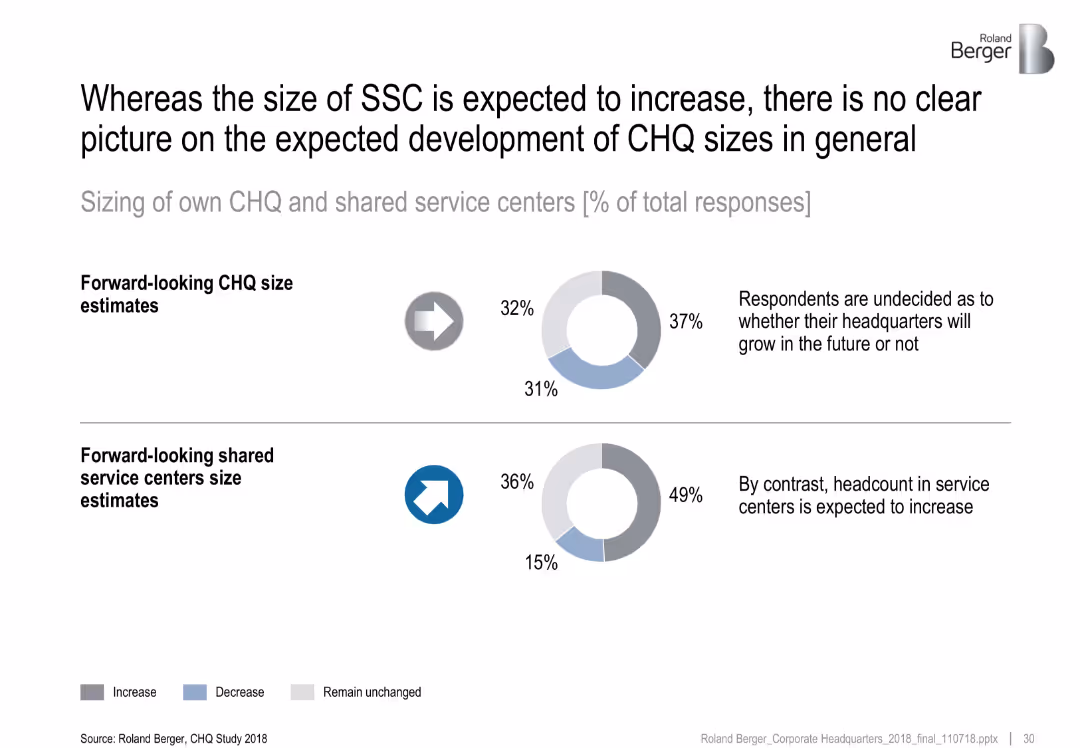
Two rows with donut charts displaying projected size trends of CHQ and SSC. Icons and summary statements on the right clarify key findings.
Organizational Structure and Change
Professional Services
This slide discusses future headcount trends. While shared service centers (SSC) are expected to grow in size, respondents are divided on the future of CHQ sizes, with nearly equal projections for increase, decrease, or no change.
CHQ size, SSC growth, headcount trends, projections, organizational structure
false
Organizational Structure and Change
Professional Services professional-services
Multiple Chart
Roland Berger
View slide
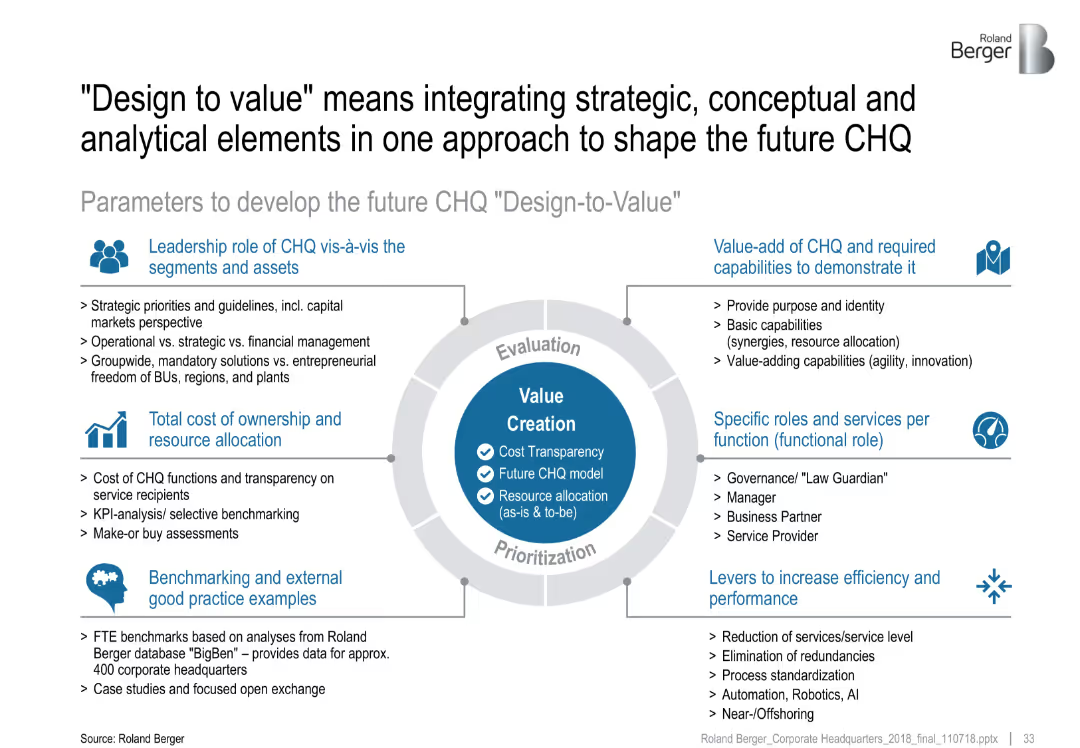
Central circular infographic detailing six development parameters around value creation. Each parameter is supported by key bullet points.
Strategic Planning
Professional Services
The slide outlines the "Design-to-Value" framework to optimize CHQ. It integrates six parameters—leadership, ownership cost, capabilities, benchmarking, roles, and efficiency—to guide future CHQ transformation.
CHQ transformation, design-to-value, strategic planning, value creation, benchmarking, efficiency
false
Strategic Planning
Professional Services professional-services
Diagram
Roland Berger
View slide
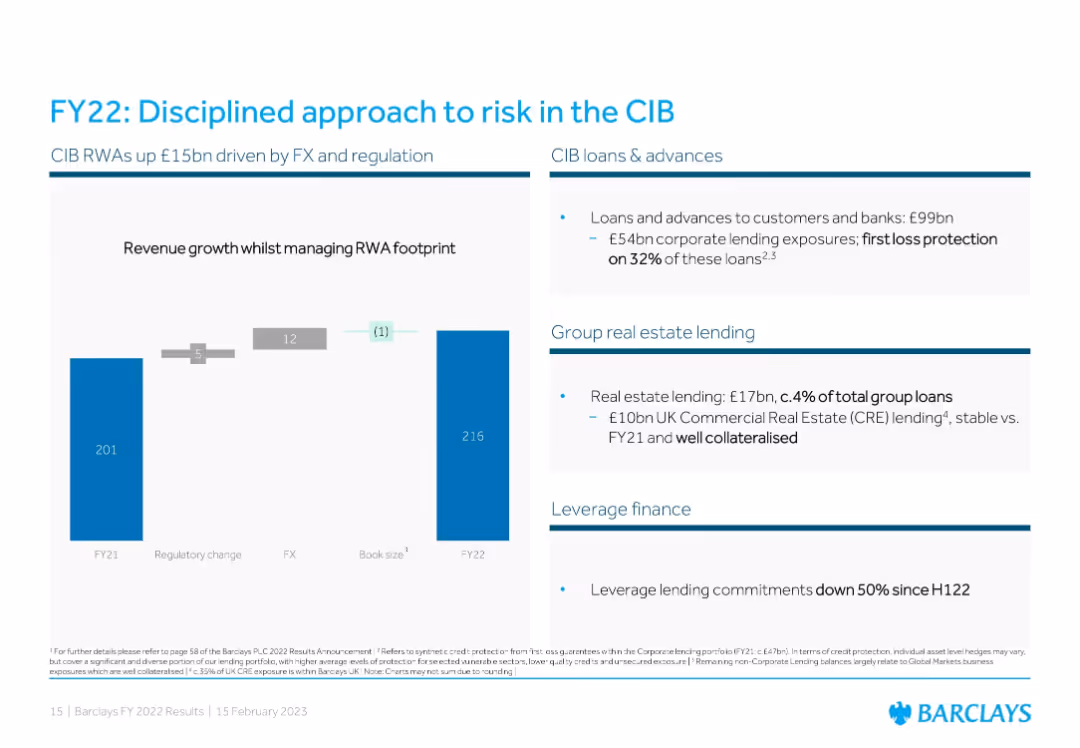
Three-part layout: Left uses a bar chart with RWA drivers; right includes text panels on CIB loans, real estate lending, and leverage finance.
Risk Assessment and Management
Financial Services
Focuses on risk management within Corporate and Investment Banking (CIB), showing RWA increases from FX/regulatory changes. It highlights low-risk exposure in real estate lending and a reduction in leveraged finance commitments.
CIB, RWAs, corporate loans, real estate, risk management, leverage finance, FX impact, regulation
false
Risk Assessment and Management
Financial Services financial-services
Mixed Chart
Barclays
View slide
Combines text, icons, and pie charts to illustrate principles of operation and the impact across business segments.
Industry Overview
Financial Services
Discusses the strength and completeness of a financial institution's Corporate and Investment Banking (CIB) segment and client impact.
CIB, client engagement, product offering, revenue opportunity, cross-business impact
false
Industry Overview
Financial Services financial-services
Multiple Chart
JP Morgan
View slide
Diagram showing interconnectivity between different CIB businesses and client engagement statistics in a geometric layout.
Industry Overview
Financial Services
This diagram illustrates the synergy among JP Morgan's CIB businesses—Investment Banking, Markets, Payments, and Securities Services—and their client coverage. It shows the percentage of clients engaged with multiple CIB services, emphasizing comprehensive client solutions and connectivity.
CIB, clients, business, synergy
false
Industry Overview
Financial Services financial-services
Mixed Chart
JP Morgan
View slide
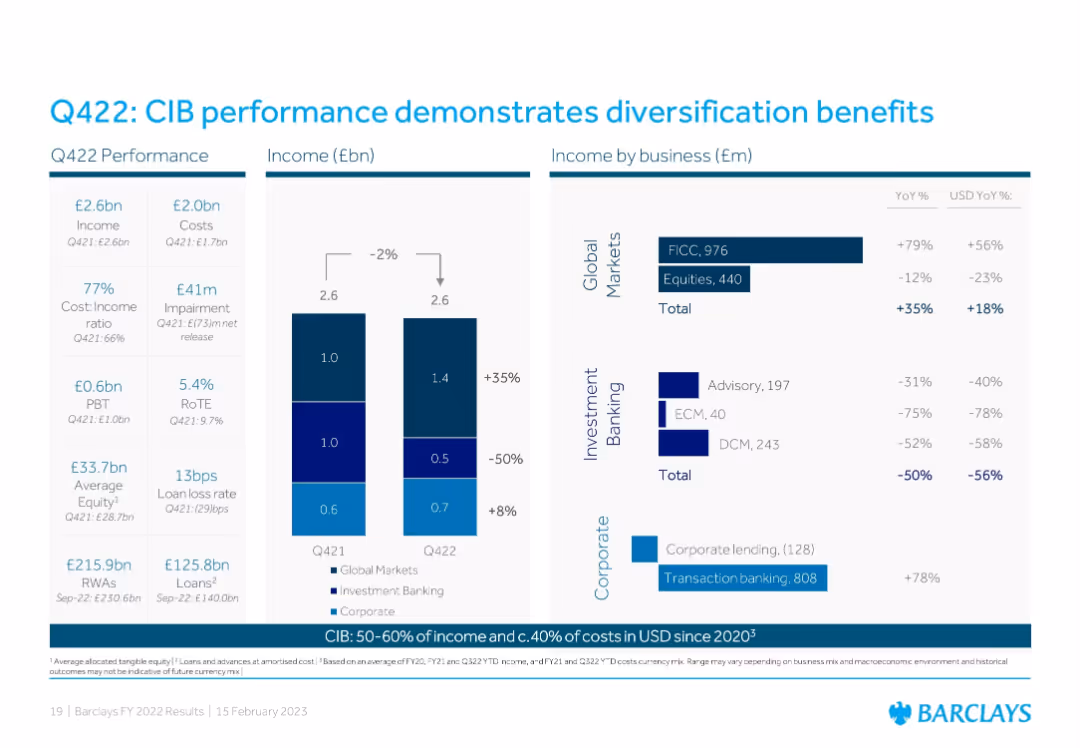
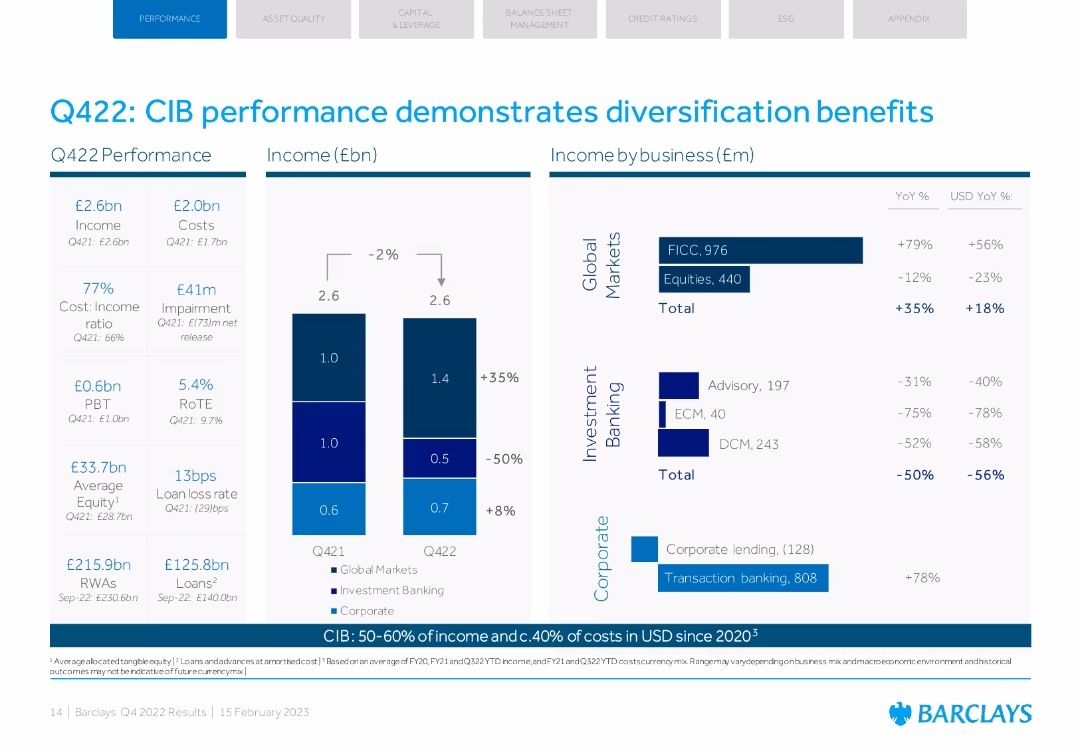
Three-panel layout: Left shows Q422 financial metrics; center has a stacked bar chart of income by business segment; right breaks down business-specific income with YoY change.
Performance Metrics and KPIs
Financial Services
Emphasizes diversified CIB performance with strong Global Markets (especially FICC) offsetting declines in Investment Banking. Highlights YoY income shifts and transaction banking gains despite sector-specific headwinds.
CIB, income, diversification, Global Markets, Investment Banking, transaction banking, FICC, performance
false
Performance Metrics and KPIs
Financial Services financial-services
Multiple Chart
Barclays
View slide
Column charts showing Q422 performance and income by business. Key metrics like income, costs, and RoTE.
Financial Performance
Financial Services
Barclays' CIB performance with detailed metrics, highlighting diversification benefits across various segments.
CIB, performance, diversification, income, business
false
Financial Performance
Financial Services financial-services
Multiple Chart
Barclays
View slide
The slide presents two column charts, the first illustrating the growth in revenue and expenses for CIB Treasury Services, and the second showing operating and non-operating deposits growth across client segments and regions.
Financial Performance
Financial Services
Geared towards financial strategists and investors, it highlights the robust growth of CIB Treasury Services, with a focus on revenue increases, expense management, and deposit growth, essential for evaluating business health and operational strategy.
CIB, treasury services, revenue growth, expense management, deposits, operational strategy, financial health
false
Financial Performance
Financial Services financial-services
Multiple Chart
JP Morgan
View slide
A horizontal bar chart listing the most demanding work problems faced by CIOs, with 'Resources/Talent' being the top issue. Each bar represents a different problem and its percentage of respondents.
Human Resources and Talent Management
Professional Services
The slide identifies the top challenges faced by CIOs, with a particular focus on issues related to resources and talent, making it a tool for HR strategy discussions.
CIO Challenges, Talent Management, HR Issues, Professional Services, Workplace Problems
false
Human Resources and Talent Management
Professional Services professional-services
Mixed Chart
Gartner
View slide
Line chart displaying the cost-to-income ratio (CIR) evolution in Europe from 2008 to 2023. Additional sections on AI investment impact and profit potential gap.
Financial Performance
Financial Services
Shows the decline in Europe's cost-to-income ratio over 15 years and discusses the impact of AI investment on profitability and cost efficiency.
CIR, AI investment, profitability, Europe, cost efficiency
false
Financial Performance
Financial Services financial-services
Multiple Chart
Kearney
View slide
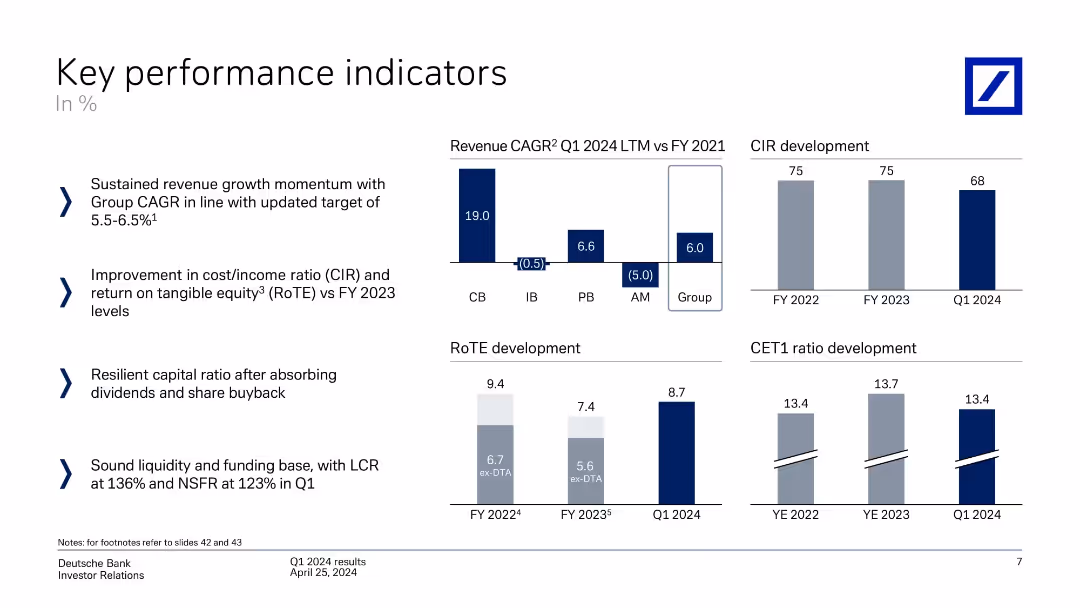
Multiple mini-charts: revenue CAGR by unit, CIR, RoTE, CET1 ratio. Left-aligned text bullets explain business performance trends.
Performance Metrics and KPIs
Financial Services
Tracks KPIs including revenue growth (Group CAGR 6%), cost/income ratio improvement, RoTE increase, and steady CET1 ratio. Demonstrates financial resilience and improved efficiency across the banking group.
CIR, RoTE, CET1, revenue growth, KPIs, financial resilience
false
Performance Metrics and KPIs
Financial Services financial-services
Multiple Chart
Deutsche Bank
View slide
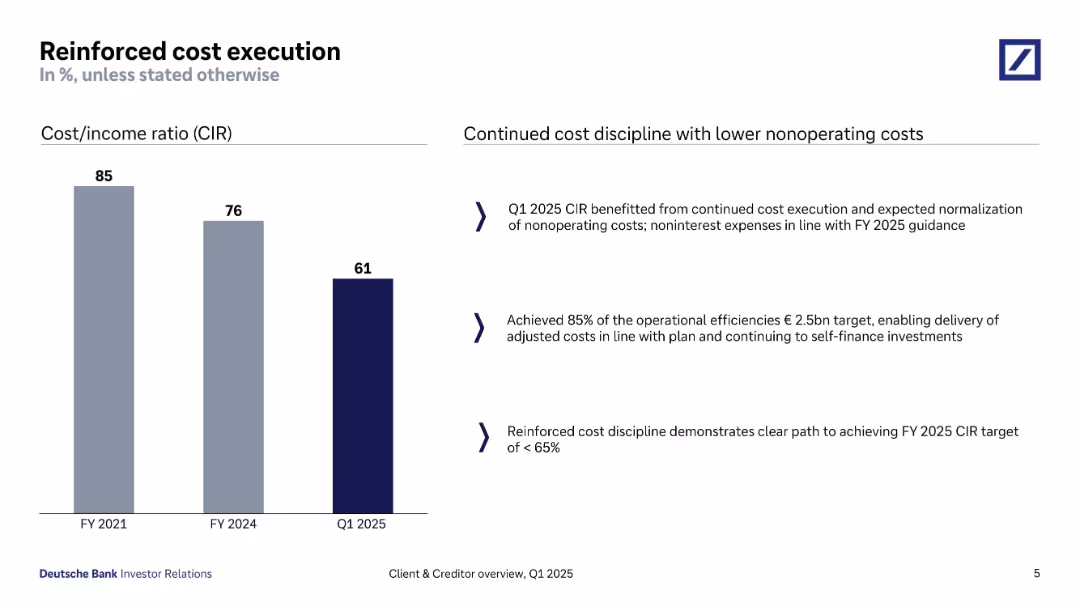
Bar chart on the left showing declining cost/income ratio (CIR) over FY2021–Q1 2025; text summary on right.
Operational Efficiency
Financial Services
The slide presents improvements in cost execution, highlighting a decline in CIR from 85% to 61%. It emphasizes cost discipline, alignment with FY2025 targets, and continued investment capacity despite lower expenses.
CIR, cost discipline, Q1 2025, operational efficiency, self-financing, cost reduction, financial management
false
Operational Efficiency
Financial Services financial-services
Mixed Chart
Deutsche Bank
View slide
Slide includes column charts comparing cost-income ratios and efficiency savings across various business units.
Competitive Landscape
Financial Services
Compares financial efficiency across different sectors of the business from 2021 to 2026.
CIR, efficiency, 2026, comparison, sectors
false
Competitive Landscape
Financial Services financial-services
Multiple Chart
Barclays
View slide
Features a trend line and column charts depicting CIR development and targeted operational efficiencies, using a clean and straightforward layout to emphasize data.
Operational Efficiency
Financial Services
Highlights strategies for reducing the cost/income ratio through operational efficiencies and revenue growth, suitable for analyzing operational cost management.
CIR, reduction, operational, efficiency, cost, income, financial, management, strategies, growth
false
Operational Efficiency
Financial Services financial-services
Mixed Chart
Deutsche Bank
View slide
The slide features a two-dimensional matrix with companies plotted based on their analyst and customer scores. It's divided into zones like "Solution Leader" and "Value Leader". Each company is represented by a circle, with varying sizes indicating the company's positioning strength. The graph is overlaid with a red outline grouping certain companies as leaders.
Market Analysis and Trends
Technology & Software
This slide illustrates the competitive landscape in the Contract Lifecycle Management (CLM) industry as of Q3, 2018. It categorizes companies into different leadership zones based on performance metrics like customer and analyst scores, helping to analyze market trends and company positions.
CLM, market analysis, leadership, performance metrics, companies, competitive landscape, 2018, technology
false
Market Analysis and Trends
Technology & Software technology-and-software
Single Chart
Kearney
View slide
This slide contains two vertical column charts. The left chart, 'Quarterly CLO Creation and Mutual Fund Flows', shows data in blue tones, with pattern differentiation for CLOs, Loan Funds, and the total. The right chart, 'Institutional Loan Volume Backing M&A', features dark and light blue bars representing different types of loans.
Investment Analysis
Financial Services
The left chart analyzes the trends in CLO creation versus mutual fund flows, suggesting an investment climate. The right chart details the volume of institutional loans supporting mergers and acquisitions, indicating market activity and investor sentiment.
CLO Creation, Mutual Fund Flows, Institutional Loans, M&A, LBO, PE-backed, Corporate, Investment Climate, Market Activity
false
Investment Analysis
Financial Services financial-services
Multiple Chart
Morgan Stanley
View slide
The left side of the slide has a table outlining the "Average Capital Structure for U.S. CLOs" with credit ratings and corresponding data. The right side features two line charts titled "CLO Tranche Support," depicting "Loss Rate" and "Default Rate."
Investment Analysis
Financial Services
Analyzing the structure and performance of U.S. CLOs, this slide contrasts various credit ratings with tranche support data. It's utilized for evaluating investment risk and potential yield advantages in portfolio management.
CLO, yield, tranche support, credit ratings
false
Investment Analysis
Financial Services financial-services
Multiple Chart
Morgan Stanley
View slide
A multi-line graph depicts the spread of CLOs against various ratings, contrasting these with underlying loan spreads.
Risk Assessment and Management
Financial Services
This slide evaluates CLO volatility relative to underlying loans, providing insights for risk management in securitized credit.
CLOs, volatility, loans, risk, securitized credit, spreads, management, analysis, ratings
false
Risk Assessment and Management
Financial Services financial-services
Single Chart
Morgan Stanley
View slide
The slide features a column chart comparing CMHC vacancy rates for purpose-built rentals and condo rentals in 2019 and 2020.
Market Analysis and Trends
Real Estate & Construction
This slide displays the vacancy rates for purpose-built and condo rentals, showing a significant increase in 2020.
CMHC, vacancy rates, rental market, purpose-built, condo rentals, column chart
false
Market Analysis and Trends
Real Estate & Construction real-estate-and-construction
Single Chart
IPSOS
View slide
Column chart comparing scores of partnership levels between CMOs and CFOs in August 2021 and September 2022, both scored out of 7. Insights are provided regarding industry alignment specifics.
Customer and Market Segmentation
Professional Services
Analyzes the collaboration levels between Chief Marketing Officers (CMOs) and Chief Financial Officers (CFOs) over two periods, highlighting consistent partnership scores and noting differences across various industries.
CMO, CFO, Marketing, Finance, Bar Chart, Partnership Levels, 2021-2022, Industry Alignment
false
Customer and Market Segmentation
Professional Services professional-services
Mixed Chart
Deloitte
View slide
Three main questions with related icons and background images.
Strategic Planning
Professional Services
Discusses three critical questions CMOs should consider when setting up or enhancing a loyalty program in their companies.
CMO, loyalty, program, company, questions
false
Strategic Planning
Professional Services professional-services
Pillar
BCG
View slide
Contains a column chart showing CMO's top priorities for the next 12 months, with accompanying text explaining the priorities.
Market Analysis and Trends
Professional Services
This slide highlights the top priorities for Chief Marketing Officers in the coming year, focusing on digital technologies, market expansion, and customer personalization.
CMO, priorities, professional services, market trends, digital technologies
false
Market Analysis and Trends
Professional Services professional-services
Mixed Chart
Deloitte
View slide
This slide combines text explanations with a diagram illustrating production-based and consumption-based CO2 accounting. The diagram uses simple geometric shapes to differentiate between the accounting methods and their implications.
Technology and Digital Transformation
Government & Public Sector
It describes the two main methods of CO2 accounting: production-based, which assesses emissions generated within a country's borders, and consumption-based, which evaluates emissions based on the country's demand. It discusses the potential for carbon leakages and the importance of accurate CO2 accounting for effective climate policies.
CO2 Accounting, Production, Consumption, Climate Policy, Carbon Leakage
false
Technology and Digital Transformation
Government & Public Sector government-and-public-sector
Diagram
EY
View slide
Contains column charts and numerical data representing the evolution of external costs related to CO2, VOC emissions, and water withdrawals, with comparisons to past years and future ambitions.
Financial Performance
Industrial & Manufacturing
Highlights Michelin's achievements in reducing emissions and water withdrawals, exceeding its 2023 ambitions, with an emphasis on the economic aspects of environmental costs.
CO2 Emissions, Environmental Costs, VOC Emissions, Water Withdrawal, Michelin, Reduction Targets, Sustainability, Compliance, 2023 Ambitions, Financial Impact
false
Financial Performance
Industrial & Manufacturing industrial-and-manufacturing
Single Chart
Morgan Stanley
View slide
The slide showcases a line graph tracking global CO2 emissions, annotated with projections for future scenarios. The visual elements are effectively spaced, with clear labeling and contrasting colors to differentiate between historical and projected data.
Market Analysis and Trends
Environmental Services & Sustainability
It presents an analysis of the global gross energy-related CO2 emissions, including historical trends and future projections under various climate commitment scenarios. It illustrates the urgency and challenges of adhering to a 1.5°C pathway and the potential global impacts.
CO2 Emissions, Global Projections, Energy-Related, Net-Zero, Climate Commitments, 1.5°C Pathway, Historical Data, Future Scenarios
false
Market Analysis and Trends
Environmental Services & Sustainability environmental-services-and-sustainability
Single Chart
McKinsey
View slide
This slide features a complex line graph tracing global CO2 emissions against time, with annotations indicating various future scenario projections. It uses shades of blue and red to distinguish the trajectories, with additional text boxes for context.
Industry Overview
Environmental Services & Sustainability
The slide provides an outlook on global CO2 emissions, juxtaposing historical data with projections based on different scenarios. It discusses the implications of current commitments on global warming and the disparities in achieving a 1.5°C pathway.
CO2 Emissions, Global Trends, Net-Zero, Climate Change, Scenarios, Historical Data, 2050 Outlook, 1.5°C Pathway
true
Industry Overview
Environmental Services & Sustainability environmental-services-and-sustainability
Mixed Chart
McKinsey
Previous
Loading...
Hold On!
We are searching in our database
If nothing, comes up, please try different filters!
Column Chart
Heatmap
Chevron
Org Chart
Infographic
Callouts
Timeline
List
Graphic
Picture
Process Flow
Diagram
Paragraph
Map
Table
Framework
Subtitle
Takeaway Box
Icon
Other Chart
Radar Chart
Waterfall Chart
Mekko Chart
Pie Chart
Scatter Plot
Line Chart
Bar chart
Bullet points
Create a FREE account to continue browsing
Receive Instant Access to 1,000+ slides from companies like McKinsey, Google, and Goldman Sachs
First Name
Last Name
Email
Password
I agree to all
Terms & Privacy Policy
Thank you! Your submission has been received!
Oops! Something went wrong while submitting the form.
Have an account?
Sign in
Upgrade to PRO to Save slides
Advanced Search and Filters
Access to 15,000+ slides
Access to Category Pages
Save/Bookmark Slides
PowerPoint Template Library
Pick a Plan
MONTHLY
$12/month
Billed every month, Cancel anytime.
YEARLY
$9/year
Billed $108 annually, Cancel anytime.
Checkout for $12/month
Checkout for $108/yr
Secured by Stripe | AES-256 bit encryption