My Account
My Slides
Search by Category
Templates
View All Templates
Download Template Slides
Leave Feedback
Login
Logout
Get Started
Browse all Slides
Browse all Slides
Create a FREE Account
Instant access to 1,000+ real slides from top companies like McKinsey, BCG, Goldman Sachs, Google and many more!
First Name
Last Name
Email
Password
I agree to all
Terms & Privacy Policy
Thank you! Your submission has been received!
Oops! Something went wrong while submitting the form.
Have an account?
Sign in
Spark Your Next Big Idea with New Presentation Templates
VIEW ALL Templates
Welcome,
Welcome
PRO
Show Featured Only
Checkbox 8
Companies
Mckinsey
Bain
BCG
EY
Deloitte
Accenture
PwC/Strategy&
JP Morgan
Goldman Sachs
Morgan Stanley
Citigroup
Deutsche Bank
Barclays
LEK
KPMG
Kearney
Oliver Wyman
Booz Allen Hamilton
Gartner
IPSOS
Nielsen
Slide type
Text Only
Linear Flow
Vertical Flow
Single Chart
Header Horizontal
Mixed Chart
Header Vertical
Pillar
Multiple Chart
Graphic
Agenda
Title
Table
Framework
Industry
Technology & Software
Artificial Intelligence
Financial Services
Retail & E-commerce
Consumer Goods
Industrial & Manufacturing
Transportation & Logistics
Telecommunications
Real Estate & Construction
Hospitality & Tourism
Professional Services
Education & Training
Media & Entertainment
Agriculture & Food Production
Healthcare & Pharmaceuticals
Environmental Services & Sustainability
Government & Public Sector
Use Case
Mergers and Acquisitions
Performance Metrics and KPIs
Client Case Studies
Competitive Landscape
Corporate Finance and Valuation
Product and Service Analysis
Customer and Market Segmentation
Organizational Structure and Change
Industry Overview
Regulatory and Compliance
Risk Assessment and Management
Investment Analysis
Organizational Structure and Change
Human Resources and Talent Management
Financial Performance
Market Analysis and Trends
Sales and Business Development
Human Resources and Talent Management
Clear all
Thank you! Your submission has been received!
Oops! Something went wrong while submitting the form.
Tag
View slide
The slide includes a column chart showing costs of CO2 abatement by CCUS for various sectors.
Market Analysis and Trends
Energy & Utilities
This slide compares the costs of CO2 abatement by CCUS across different sectors, including power and industry applications.
CO2 abatement, costs, CCUS, sectors, comparison
false
Market Analysis and Trends
Energy & Utilities energy-and-utilities
Multiple Chart
Kearney
View slide
The slide contains line charts comparing changes in the Consumer Price Index by CO2 accounting methods for EU27+UK and China, both production-based and consumption-based. It includes text explanations above the charts and color-coded lines for domestic and import data.
Regulatory and Compliance
Energy & Utilities
Discusses the impact of adopting a consumption-based accounting method on price indices for domestic and imported goods, suggesting a smoother change for domestic products compared to the production-based approach.
CO2 accounting, price index, domestic, import, consumption-based
false
Regulatory and Compliance
Energy & Utilities energy-and-utilities
Multiple Chart
EY
View slide
This slide includes a column chart showing the CO2 capture rate per case, with three distinct bars (CO2 released, CO2 avoided, Extra CO2 captured).
Market Analysis and Trends
Energy & Utilities
The slide illustrates the CO2 capture rate and LCOH increase for brown H2 sources when coupled with CCS, highlighting the additional costs involved.
CO2 capture, LCOH, brown H2, CCS, emissions, costs
false
Market Analysis and Trends
Energy & Utilities energy-and-utilities
Single Chart
Kearney
View slide
This slide features a column chart depicting the sum of CO2 capture capacity (in Mtpa) by region and status (operational, in development, completed, cancelled).
Market Analysis and Trends
Energy & Utilities
Discusses the CO2 capture capacities of CCUS projects by region, with a focus on OECD countries. Highlights future capacity projections and current capacities.
CO2 capture, capacity, OECD, CCUS, regional capacity, development, operational, trends, future projections
false
Market Analysis and Trends
Energy & Utilities energy-and-utilities
Mixed Chart
Kearney
View slide
This slide contains a column chart showing the operational CO2 capture capacity per utilization and storage from 2015 to 2030, including projections and canceled projects. It uses color coding for geological storage and EOR.
Market Analysis and Trends
Environmental Services & Sustainability
The slide illustrates the growth in operational CO2 capture capacity over the years and projects future increases, with a significant rise expected around 2030 for geological storage.
CO2 capture, capacity, projections, operational, geological storage
false
Market Analysis and Trends
Environmental Services & Sustainability environmental-services-and-sustainability
Mixed Chart
Kearney
View slide
The slide features a line chart depicting the levelized cost of CO2 capture for various large-scale post-combustion projects at coal-fired power plants from 2004 to 2028.
Market Analysis and Trends
Energy & Utilities
The slide highlights how CCUS technology can expect cost reductions from learning and technology deployment, showing historical and projected costs for various facilities. The chart illustrates a downward trend in capture costs over time, with expected further reductions as technology improves.
CO2 capture, cost, post-combustion, trends
false
Market Analysis and Trends
Energy & Utilities energy-and-utilities
Single Chart
Kearney
View slide
The slide includes a bar chart showing the levelized cost of CO2 capture for various sectors.
Financial Performance
Energy & Utilities
This slide compares the levelized cost of CO2 capture across different industries and the concentration of CO2.
CO2 capture, cost, sectors, concentration, comparison
false
Financial Performance
Energy & Utilities energy-and-utilities
Single Chart
Kearney
View slide
The slide includes a column chart showing cost ranges for different stages of CO2 capture and storage.
Financial Performance
Energy & Utilities
This slide presents the cost breakdown for capture, compression, dehydration, transport, storage, and monitoring of CO2.
CO2 capture, costs, compression, storage, monitoring
false
Financial Performance
Energy & Utilities energy-and-utilities
Mixed Chart
Kearney
View slide
A line chart indicating the trajectory of atmospheric CO2 concentrations approaching critical warming thresholds.
Strategic Planning
Environmental Services & Sustainability
Highlights the approaching critical thresholds of CO2 concentrations, essential for strategic planning in environmental management and policy making.
CO2 concentrations, critical thresholds, strategic planning, climate goals, environmental policy
false
Strategic Planning
Environmental Services & Sustainability environmental-services-and-sustainability
Single Chart
BCG
View slide
A line chart showing the carbon abatement cost (CAC) versus CO2 emissions from electricity generation for different countries by 2030. The chart compares costs for grid, grid + wind, and grid + solar setups.
Market Analysis and Trends
Energy & Utilities
The slide highlights that top coal consumers would not reduce CO2 emissions by coupling electrolyzers with the grid, except for the USA and Russia, at a higher cost than renewable energy sources.
CO2 emissions, CAC, coal, grid, wind, solar, electrolyzer, USA, Russia, renewable
false
Market Analysis and Trends
Energy & Utilities energy-and-utilities
Mixed Chart
Kearney
View slide
A line chart shows the CAC versus CO2 emissions from electricity generation by 2030 for various countries, comparing costs for grid, grid + wind, grid + solar, and blue hydrogen CAC setups.
Market Analysis and Trends
Energy & Utilities
The slide evaluates the cost-effectiveness of hydrogen from grid-powered electrolyzers for reducing emissions, noting the carbon footprint threshold for competitive cost.
CO2 emissions, CAC, grid, wind, solar, hydrogen, electrolyzer, cost-effectiveness
false
Market Analysis and Trends
Energy & Utilities energy-and-utilities
Mixed Chart
Kearney
View slide
This slide features a column chart on the left showing avoided CO2 emissions (Mtpa) in three scenarios (minimum, reference, maximum) and a bar chart on the right indicating the abatement cost range in $ per tCO2. It also includes explanatory text below the charts.
Market Analysis and Trends
Energy & Utilities
The slide presents potential CO2 emission reductions from the H-vision project, illustrating different scopes and corresponding abatement costs. It explains how a CCS unit can significantly reduce CO2 emissions from hydrogen production.
CO2 emissions, H-vision project, CCS unit, hydrogen production, abatement cost
false
Market Analysis and Trends
Energy & Utilities energy-and-utilities
Multiple Chart
Kearney
View slide
A column chart compares avoided CO2 emissions and abatement costs versus coal turbines for various grid utilizations (wind, solar, grid wind, grid solar) by 2030.
Market Analysis and Trends
Energy & Utilities
The slide evaluates the CO2 emissions reduction potential and costs of converting coal turbines to P2P systems coupled with renewable energy sources.
CO2 emissions, abatement cost, coal, turbines, P2P, renewable, grid, wind, solar
false
Market Analysis and Trends
Energy & Utilities energy-and-utilities
Multiple Chart
Kearney
View slide
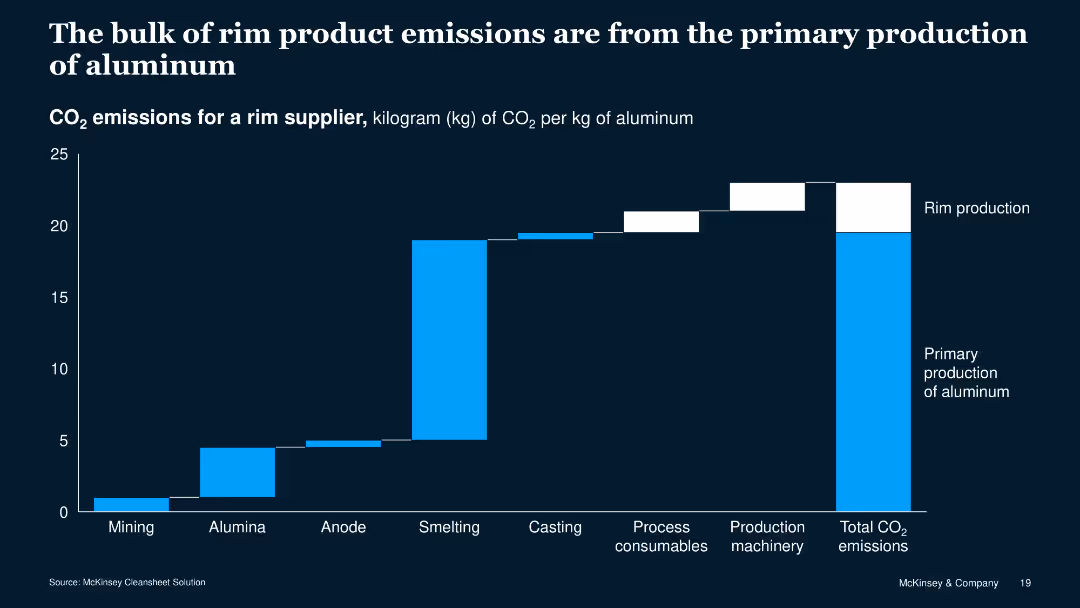
The slide features a column chart with blue and white bars showing CO2 emissions across different production stages of aluminum rims. The chart is against a dark blue background.
Risk Assessment and Management
Industrial & Manufacturing
This slide presents data on CO2 emissions from various stages of aluminum rim production, highlighting that primary production contributes most to the total emissions.
CO2 emissions, aluminum, production stages, data visualization, environment, manufacturing, risk, assessment, management, sustainability
false
Risk Assessment and Management
Industrial & Manufacturing industrial-and-manufacturing
Single Chart
McKinsey
View slide
A column chart presents avoided CO2 emissions and avoidance costs versus SMR for different grid utilizations (wind, solar, grid wind, grid solar) by 2030.
Market Analysis and Trends
Energy & Utilities
The slide highlights the potential of renewable sources to reduce CO2 emissions, with a focus on the avoidance cost compared to SMR, emphasizing the impact of electrolyzer-powered renewables.
CO2 emissions, avoidance cost, SMR, grid, wind, solar, electrolyzer, renewable
false
Market Analysis and Trends
Energy & Utilities energy-and-utilities
Multiple Chart
Kearney
View slide
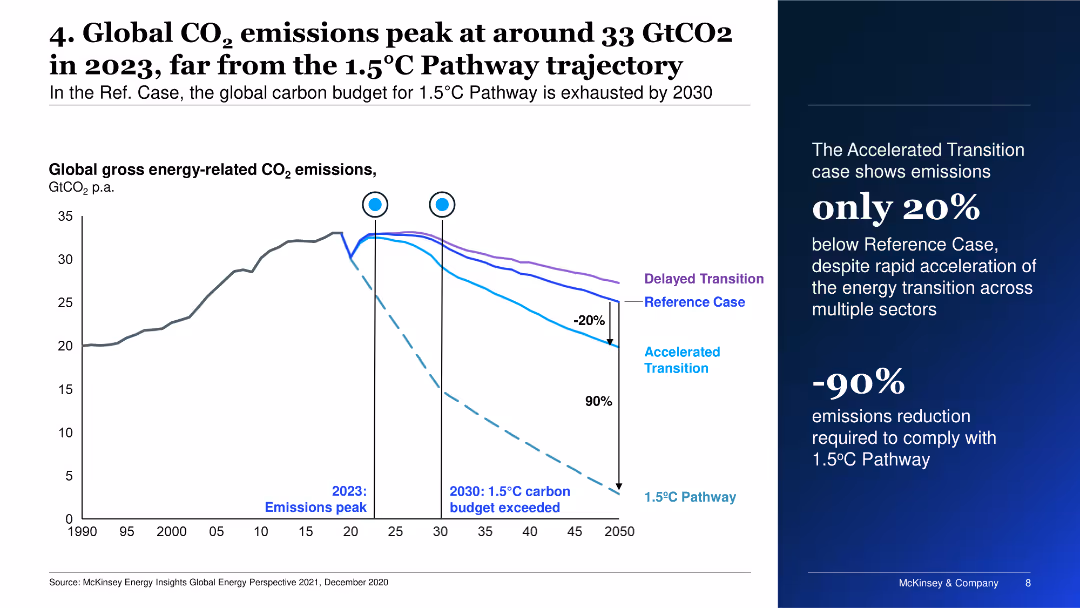
This slide presents a line chart with multiple scenarios for global CO2 emissions. It shows the peaking of emissions in 2023 and different pathways, including delayed and accelerated transitions.
Risk Assessment and Management
Energy & Utilities
It discusses global carbon emissions trends, emphasizing the peak in 2023 and the need for drastic emission reductions to meet the 1.5°C Pathway.
CO2 emissions, climate change, pathways, transition, peak
false
Risk Assessment and Management
Energy & Utilities energy-and-utilities
Mixed Chart
McKinsey
View slide
The slide features two column charts. The first chart shows global anthropogenic CO2 emissions from 1850 to 2011, and the second chart shows atmospheric CO2 concentration since 2005. Both charts have detailed axes and annotations.
Market Analysis and Trends
Energy & Utilities
This slide highlights the significant contribution of fossil fuels to CO2 emissions and the rising CO2 concentration in the atmosphere, emphasizing the urgency of addressing anthropogenic climate change.
CO2 emissions, fossil fuels, climate change, greenhouse gases, anthropogenic CO2
false
Market Analysis and Trends
Energy & Utilities energy-and-utilities
Multiple Chart
Kearney
View slide
The slide features a bar chart on the left showing the share of global CO2 emissions by country and a column chart on the right showing global CO2 emissions per capita.
Market Analysis and Trends
Environmental Services & Sustainability
It presents the distribution of CO2 emissions by country and compares per capita emissions, offering insights into the global contributions to greenhouse gas emissions.
CO2 emissions, global warming, environmental impact, greenhouse gases, country comparison, per capita emissions, J.P. Morgan, climate data, sustainability, carbon footprint
false
Market Analysis and Trends
Environmental Services & Sustainability environmental-services-and-sustainability
Multiple Chart
JP Morgan
View slide
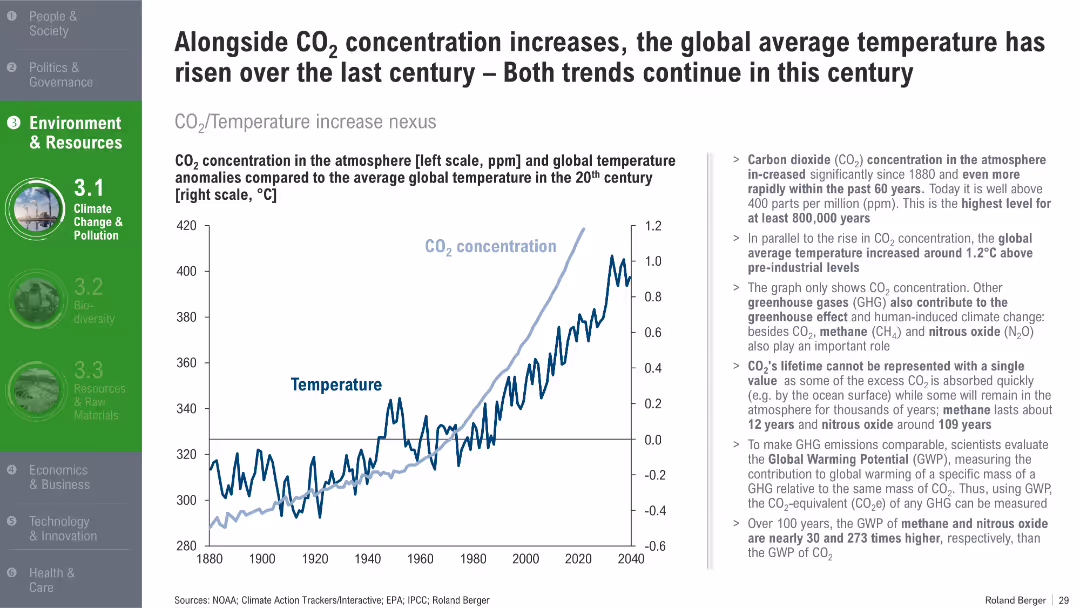
Dual-axis line chart comparing CO₂ levels with temperature anomalies from 1880 to 2040. Summary of scientific implications on the right.
Risk Assessment and Management
Environmental Services & Sustainability
This slide shows the direct correlation between rising CO₂ concentrations and global temperature increases. It explains greenhouse gas contributions and their long-term environmental impact.
CO2 emissions, global warming, greenhouse gases, temperature rise, climate science, sustainability
false
Risk Assessment and Management
Environmental Services & Sustainability environmental-services-and-sustainability
Mixed Chart
Roland Berger
View slide
Line chart showing historical data and projections of global CO2 emissions under different scenarios.
Market Analysis and Trends
Environmental Services & Sustainability
Analyzes global CO2 emissions data and projections, emphasizing the need for new technologies to meet climate goals.
CO2 emissions, global, projections, scenarios, climate goals
false
Market Analysis and Trends
Environmental Services & Sustainability environmental-services-and-sustainability
Mixed Chart
EY
View slide
The slide uses a horizontal bar chart to compare CO2 emissions for different hydrogen production methods from various primary sources, with color coding for clarity.
Regulatory and Compliance
Energy & Utilities
The slide examines CO2 emissions from hydrogen production using different primary energy sources, such as coal, natural gas, nuclear fuel, solar, and wind, emphasizing the environmental impact of each method.
CO2 emissions, hydrogen, production, pathways, environment
false
Regulatory and Compliance
Energy & Utilities energy-and-utilities
Mixed Chart
Kearney
View slide
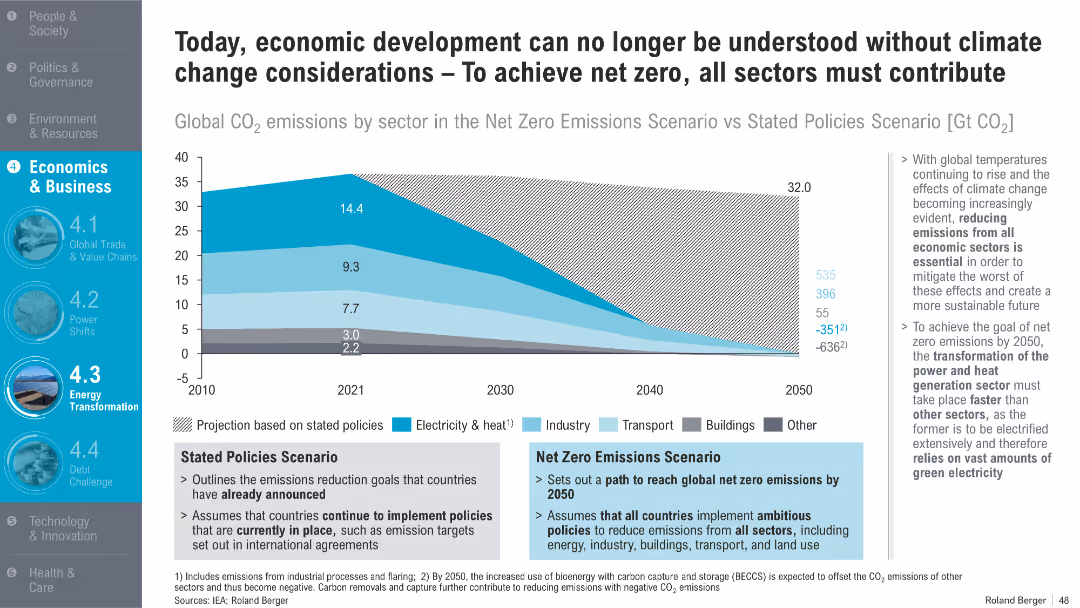
Area chart comparing global CO₂ emissions under two scenarios by sector (electricity, transport, buildings); side notes explain scenario assumptions and implications
Regulatory and Compliance
Energy & Utilities
The slide presents two global emissions scenarios—'Stated Policies' and 'Net Zero'—and emphasizes the importance of reducing emissions across all sectors to mitigate climate change. It highlights the especially vital role of electricity transformation.
CO2 emissions, net zero, climate policy, electricity, decarbonization, energy transition, sectors, sustainability, 2050
false
Regulatory and Compliance
Energy & Utilities energy-and-utilities
Mixed Chart
Roland Berger
View slide
Features a column chart displaying the CO2 emission contributions from various materials in the nickel-based battery supply chain, emphasizing upstream processes.
Operational Efficiency
Energy & Utilities
Highlights the major contributions to CO2 emissions in battery production, particularly from mining and refining processes, suggesting Australia's competitive position in reducing emissions.
CO2 emissions, nickel, battery production, mining, refining, Australia, sustainability, supply chain, environmental impact
false
Operational Efficiency
Energy & Utilities energy-and-utilities
Mixed Chart
Accenture
View slide
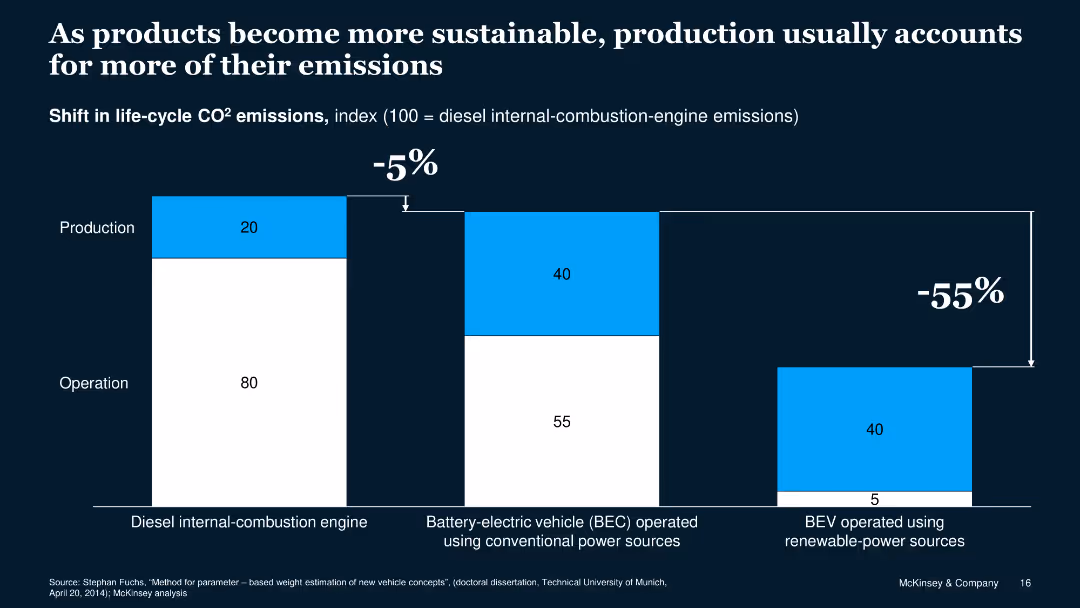
Column chart showing the shift in life-cycle CO2 emissions from different vehicle types.
Market Analysis and Trends
Environmental Services & Sustainability
Highlights the shift in CO2 emissions with a focus on production and operation of different vehicles.
CO2 emissions, production, operation, vehicles, sustainable
false
Market Analysis and Trends
Environmental Services & Sustainability environmental-services-and-sustainability
Single Chart
McKinsey
View slide
Column chart showing CO2 emission differences by economic sector under baseline and LCE scenarios.
Market Analysis and Trends
Environmental Services & Sustainability
Compares CO2 emissions under different scenarios, highlighting the impact of LCE and LCE+ policies on emission reductions.
CO2 emissions, scenarios, comparison, LCE, LCE+
false
Market Analysis and Trends
Environmental Services & Sustainability environmental-services-and-sustainability
Mixed Chart
EY
View slide
The slide presents a column chart showing annual regional CO2 emissions from power generation and industries, compared to the corresponding storage capacity in years. It includes bars representing different regions worldwide.
Market Analysis and Trends
Environmental Services & Sustainability
The slide details the relationship between CO2 emissions and geological storage capacities in different regions, highlighting the storage capacity as not being a constraint in mature areas like North America.
CO2 emissions, storage capacity, regional analysis, global, power generation
false
Market Analysis and Trends
Environmental Services & Sustainability environmental-services-and-sustainability
Mixed Chart
Kearney
View slide
Contains a graph showing historical and projected CO2 levels over 20,000 years, highlighting significant increases during the Anthropocene and projections under different RCP scenarios.
Regulatory and Compliance
Environmental Services & Sustainability
Discusses the projected trajectory of CO2 levels and their potential stabilization or increase over the next 30 years and their implications on climate for the next 10,000 years. Aimed at showcasing long-term impacts of current environmental policies.
CO2 levels, Climate change, Projections, RCP scenarios, Long-term impact
false
Regulatory and Compliance
Environmental Services & Sustainability environmental-services-and-sustainability
Single Chart
BCG
View slide
A line chart showing historical CO2 concentrations, highlighting significant increases over millennia and recent years.
Regulatory and Compliance
Environmental Services & Sustainability
Offers historical context for current CO2 levels, underscoring the urgency in addressing climate change for policy makers and environmental planners.
CO2 levels, climate change, environmental policy, historical data, sustainability
false
Regulatory and Compliance
Environmental Services & Sustainability environmental-services-and-sustainability
Single Chart
BCG
View slide
The slide features a flow diagram illustrating multiple chemical pathways from CO2, showcasing the conversion of CO2 into various chemical products like hydrocarbons, methanol, formic acid, and more.
Technology and Digital Transformation
Energy & Utilities
The slide presents opportunities for the chemical industry to utilize CO2 through various pathways, highlighting the potential to reduce fossil fuel dependence and valorize emitted CO2.
CO2 pathways, chemical conversion, industry opportunities, fossil fuel reduction
false
Technology and Digital Transformation
Energy & Utilities energy-and-utilities
Diagram
Kearney
View slide
The slide features a column chart displaying the average CO2 price per ton (€) from 2012 to 2023. On the right, there are two bar charts comparing CCGT marginal price variation in low vs. high prices. The color scheme is green and dark grey, with green bars and texts. The layout is dense with data, providing a clear visual representation of the ETS and CCGT prices' impact.
Market Analysis and Trends
Energy & Utilities
This slide shows the increase in ETS price over the years and its significant impact on market dynamics, focusing on CO2 prices and CCGT marginal price variations. It highlights the substantial rise in CO2 price and how it affects the contribution mix and marginal prices, providing a detailed analysis of the economic implications.
CO2 price, ETS, market dynamics, CCGT price, impact
false
Market Analysis and Trends
Energy & Utilities energy-and-utilities
Multiple Chart
EY
Previous
Loading...
Hold On!
We are searching in our database
If nothing, comes up, please try different filters!
Column Chart
Heatmap
Chevron
Org Chart
Infographic
Callouts
Timeline
List
Graphic
Picture
Process Flow
Diagram
Paragraph
Map
Table
Framework
Subtitle
Takeaway Box
Icon
Other Chart
Radar Chart
Waterfall Chart
Mekko Chart
Pie Chart
Scatter Plot
Line Chart
Bar chart
Bullet points
Create a FREE account to continue browsing
Receive Instant Access to 1,000+ slides from companies like McKinsey, Google, and Goldman Sachs
First Name
Last Name
Email
Password
I agree to all
Terms & Privacy Policy
Thank you! Your submission has been received!
Oops! Something went wrong while submitting the form.
Have an account?
Sign in
Upgrade to PRO to Save slides
Advanced Search and Filters
Access to 15,000+ slides
Access to Category Pages
Save/Bookmark Slides
PowerPoint Template Library
Pick a Plan
MONTHLY
$12/month
Billed every month, Cancel anytime.
YEARLY
$9/year
Billed $108 annually, Cancel anytime.
Checkout for $12/month
Checkout for $108/yr
Secured by Stripe | AES-256 bit encryption