My Account
My Slides
Search by Category
Templates
View All Templates
Download Template Slides
Leave Feedback
Login
Logout
Get Started
Browse all Slides
Browse all Slides
Create a FREE Account
Instant access to 1,000+ real slides from top companies like McKinsey, BCG, Goldman Sachs, Google and many more!
First Name
Last Name
Email
Password
I agree to all
Terms & Privacy Policy
Thank you! Your submission has been received!
Oops! Something went wrong while submitting the form.
Have an account?
Sign in
Spark Your Next Big Idea with New Presentation Templates
VIEW ALL Templates
Welcome,
Welcome
PRO
Show Featured Only
Checkbox 8
Companies
Mckinsey
Bain
BCG
EY
Deloitte
Accenture
PwC/Strategy&
JP Morgan
Goldman Sachs
Morgan Stanley
Citigroup
Deutsche Bank
Barclays
LEK
KPMG
Kearney
Oliver Wyman
Booz Allen Hamilton
Gartner
IPSOS
Nielsen
Slide type
Text Only
Linear Flow
Vertical Flow
Single Chart
Header Horizontal
Mixed Chart
Header Vertical
Pillar
Multiple Chart
Graphic
Agenda
Title
Table
Framework
Industry
Technology & Software
Artificial Intelligence
Financial Services
Retail & E-commerce
Consumer Goods
Industrial & Manufacturing
Transportation & Logistics
Telecommunications
Real Estate & Construction
Hospitality & Tourism
Professional Services
Education & Training
Media & Entertainment
Agriculture & Food Production
Healthcare & Pharmaceuticals
Environmental Services & Sustainability
Government & Public Sector
Use Case
Mergers and Acquisitions
Performance Metrics and KPIs
Client Case Studies
Competitive Landscape
Corporate Finance and Valuation
Product and Service Analysis
Customer and Market Segmentation
Organizational Structure and Change
Industry Overview
Regulatory and Compliance
Risk Assessment and Management
Investment Analysis
Organizational Structure and Change
Human Resources and Talent Management
Financial Performance
Market Analysis and Trends
Sales and Business Development
Human Resources and Talent Management
Clear all
Thank you! Your submission has been received!
Oops! Something went wrong while submitting the form.
Tag
View slide
Two column charts showcasing data on underutilized capacity and operational fit of products to customer requirements. Both charts are clearly labeled and distinguish between different ranges of percentages.
Operational Efficiency
Environmental Services & Sustainability
Details survey findings on underutilized product capacity and operational fit, indicating inefficiencies in resource utilization and the alignment of products with customer needs.
Capacity, Utilization, Operational, Efficiency, Survey
false
Operational Efficiency
Environmental Services & Sustainability environmental-services-and-sustainability
Multiple Chart
Accenture
View slide
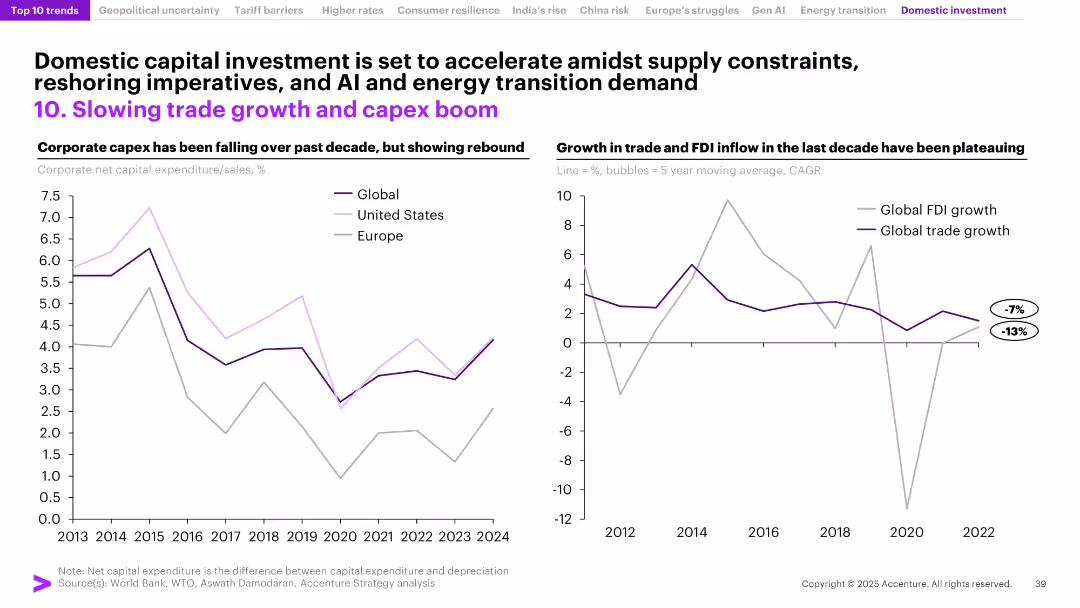
Split into two charts on a white background with black and purple fonts. Left chart shows corporate capex over time for Global, US, and Europe; right chart displays global trade and FDI growth. Title and subheaders are bold with accent color.
Market Analysis and Trends
Financial Services
The slide explores the decline in global trade growth and FDI inflows alongside a decade-long fall in corporate capex, followed by recent rebounds. It emphasizes the need for domestic investment amid global shifts in trade and capital deployment.
Capex, Trade Growth, FDI, Domestic Investment, Global Markets, Rebound, U.S., Europe, CAGR, Investment Trends
false
Market Analysis and Trends
Financial Services financial-services
Multiple Chart
Accenture
View slide
Duplicate layout from earlier capital structure slide, but updated with latest 2Q24 figures and share repurchase year-to-date.
Corporate Finance and Valuation
Financial Services
Reflects capital allocation priorities as of mid-2024. Shows declining share repurchases, current debt composition, and leverage ratios. Reinforces a strategy focused on stock repurchase, maintaining flexibility, and avoiding major debt paydowns.
Capital Allocation, Debt, Share Buyback, Leverage Ratio, Cash Management
false
Corporate Finance and Valuation
Financial Services financial-services
Mixed Chart
Gartner
View slide
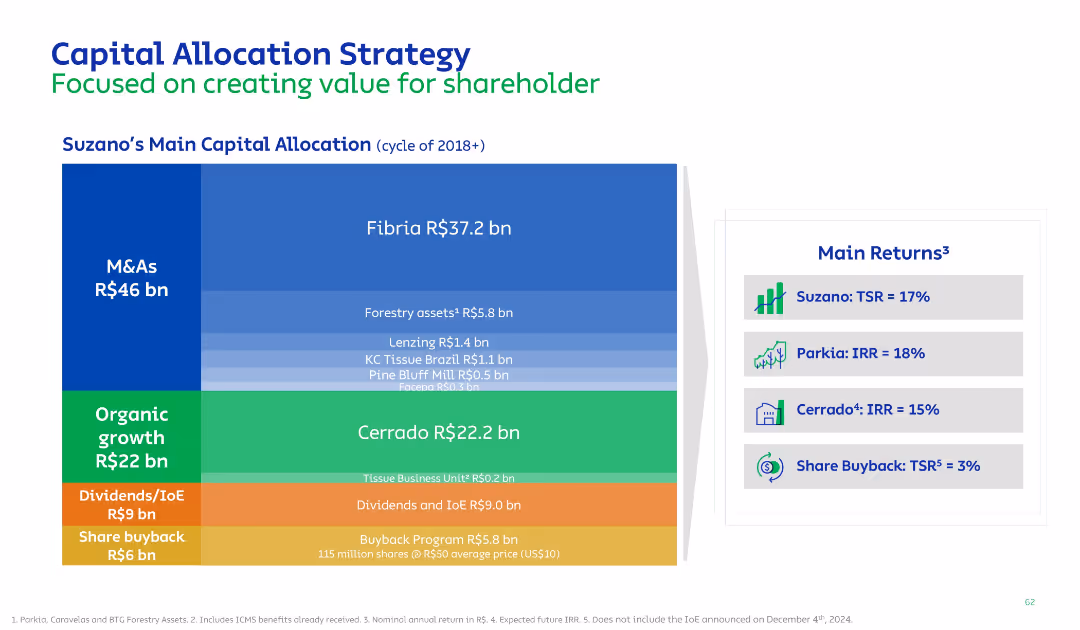
Vertical block chart categorizing capital use (M&As, growth, dividends, buyback), with each tier labeled by initiative and value; right panel lists IRR/TSR of key programs.
Strategic Planning
Consumer Goods
The slide summarizes Suzano’s capital allocation strategy post-2018, with a clear focus on M&As, organic growth, and shareholder returns. Key investments like Fibria and Cerrado are quantified with their projected returns.
Capital Allocation, M&A, IRR, TSR, Growth Strategy
false
Strategic Planning
Consumer Goods consumer-goods
Mixed Chart
Goldman Sachs
View slide
The slide has a four-point list on the left and a checklist comparing strategic criteria for M&A on the right. It uses a combination of check marks and cross marks to visually denote achievements or targets.
Strategic Planning
Financial Services
Outlines the company’s philosophy on capital allocation, prioritizing organic growth, dividends, strategic acquisitions, and share repurchases. The right side evaluates potential M&A opportunities against strategic goals, providing a clear decision-making framework.
Capital Allocation, Organic Growth, Dividends, M&A, Strategic Acquisitions, Share Repurchases
false
Strategic Planning
Financial Services financial-services
Boxed
Goldman Sachs
View slide
This slide features a horizontal bar chart comparing the capital costs of various renewable and conventional energy technologies.
Financial Performance
Energy & Utilities
The slide provides a comparative analysis of the capital costs required for different energy technologies, offering insights into the financial requirements and economic feasibility of energy projects.
Capital Costs, Energy Technologies, Financial Analysis, LCOE, Comparison
false
Financial Performance
Energy & Utilities energy-and-utilities
Single Chart
Roland Berger
View slide
Contains a column chart illustrating the standardized CET1 ratio over time and a checklist describing the capital management philosophy. The chart shows a base minimum and adjustments for various factors. The layout is organized for a professional audience.
Strategic Planning
Financial Services
The slide offers insights into the firm's capital management over time, reflecting changes in capital requirements and strategy. It's designed for presentations to stakeholders or regulators, explaining dynamic capital adjustments and the overarching capital management philosophy.
Capital Management, CET1 Ratio, Regulatory Requirements, Strategic Adjustments
false
Strategic Planning
Financial Services financial-services
Mixed Chart
Goldman Sachs
View slide
The slide presents a sequence of column charts and textual analysis. It visually communicates the historical capital allocation and expectations for future returns with a clear graphical representation using shades of blue and gray.
Investment Analysis
Financial Services
The slide from JPMorgan Chase focuses on capital optimization and projected return on equity (ROE). It is designed for financial presentations that detail capital allocation strategies and the expected outcomes in terms of growth and returns, highlighting both the cost of capital and the benefits of disciplined capital deployment.
Capital Optimization, Growth, Returns, ROE, Cost of Capital, Investment, Disciplined Deployment, Client Wallet, Market Completeness
false
Investment Analysis
Financial Services financial-services
Multiple Chart
JP Morgan
View slide
This slide lists key points related to capital allocation optimization, using icons and short texts in bullet points. There's a small column chart comparing Group RoRWA percentages over time, with a projected mid-term goal. The visual is straightforward, with icons illustrating each bullet point, and uses a blue and grey color scheme. Santander's logo appears at the top, with a cogwheel icon indicating optimization.
Strategic Planning
Financial Services
The slide provides an overview of strategies for capital allocation to improve profitability, coupled with a chart showing historical and targeted RoRWA. It's suitable for financial planning and strategy meetings to discuss and plan for improved financial performance.
Capital Optimization, Profitability, RoRWA, Financial Strategy, Santander, Business Optimization, Allocation Strategies, Financial Improvement
false
Strategic Planning
Financial Services financial-services
Mixed Chart
Morgan Stanley
View slide
This slide features a bar chart displaying the challenges businesses face in raising capital, along with cohort data of companies not yet raising subsequent funding rounds. The charts use contrasting colors and are labeled for clarity.
Investment Analysis
Financial Services
It highlights the increasing difficulty for businesses in securing capital, providing an analysis of the current funding environment, and underlining the challenges and delays companies face. This slide is vital for discussions on capital raising strategies and investor expectations, particularly in volatile economic conditions.
Capital Raising, Business Challenges, Funding Delays, Investment Climate, Strategic Planning
false
Investment Analysis
Financial Services financial-services
Mixed Chart
JP Morgan
View slide
This slide contains pie charts, a leverage ratio comparison, and bullet points emphasizing the bank's strong capital position and strategies.
Financial Performance
Financial Services
The slide provides an overview of BBVA's capital ratios and risk-weighted assets, evidencing a robust capital position. Useful for discussions on financial solidity and regulatory compliance.
Capital Ratios, Financial Strength, Risk Management, Leverage Ratio, Regulatory Compliance, Capital Generation
false
Financial Performance
Financial Services financial-services
Multiple Chart
Morgan Stanley
View slide
Includes stacked column chart illustrating capital ratios against regulatory requirements with detailed annotations explaining the data points.
Regulatory and Compliance
Financial Services
Provides a detailed review of capital ratios like CET1, AT1, and T2, showing how they stand against regulatory requirements at the end of Q4 2023. It focuses on the bank's financial health and capital strategy, ensuring compliance and buffer maintenance above the minimum required levels.
Capital Ratios, Regulatory Compliance, Financial Health, Banking, Capital Strategy
false
Regulatory and Compliance
Financial Services financial-services
Mixed Chart
Deutsche Bank
View slide
Presents a series of column chart with quantitative data about Macquarie's capital requirements, accompanied by a side panel detailing key drivers affecting these figures.
Operational Efficiency
Financial Services
This slide analyzes business capital requirements and the key drivers affecting them within Macquarie. It is relevant for discussions on financial planning and operational efficiency.
Capital Requirements, Financial Planning, Key Drivers, Operational Efficiency
false
Operational Efficiency
Financial Services financial-services
Mixed Chart
Morgan Stanley
View slide
Two pie charts compare the nature of capital spending today versus the next 30 years. Blue and black are used to illustrate the contrast in spending on high-emissions versus low-emissions assets.
Strategic Planning
Environmental Services & Sustainability
Highlights the shift in capital spending required under a net-zero transition scenario, focusing on the allocation between high-emissions and low-emissions assets. Details the predicted change over the next three decades.
Capital Spending, Net-Zero, Emissions, Transition, Assets, Investment
false
Strategic Planning
Environmental Services & Sustainability environmental-services-and-sustainability
Boxed
McKinsey
View slide
Similar to slide 3613, it has updated information in its tables of balance sheet data, visualizing book value distribution, in a clean blue and gray layout.
Financial Performance
Financial Services
Provides a current snapshot of the company's capital and balance sheet, useful for financial analysis sessions or presentations to investors concerning the company's capital structure and liquidity.
Capital Structure, Balance Sheet, Liquidity, Valuation
false
Financial Performance
Financial Services financial-services
Table
Goldman Sachs
View slide
The slide combines text and a line chart. The text details the capital structure and free cash flow deployment, while the chart shows share repurchases over time.
Financial Performance
Financial Services
The slide discusses the capital structure, financial leverage, and free cash flow deployment strategies, including share repurchases and debt metrics.
Capital Structure, Leverage, Free Cash Flow, Share Repurchases, Debt Ratings, Investment Grade
false
Financial Performance
Financial Services financial-services
Mixed Chart
Gartner
View slide
The slide combines text and a line chart. The text details the capital structure and free cash flow deployment, while the chart shows share repurchases over time.
Financial Performance
Financial Services
It discusses capital structure, financial leverage, free cash flow deployment, including strategic acquisitions, and debt ratings.
Capital Structure, Leverage, Free Cash Flow, Share Repurchases, Debt Ratings, Investment Grade
false
Financial Performance
Financial Services financial-services
Mixed Chart
Gartner
View slide
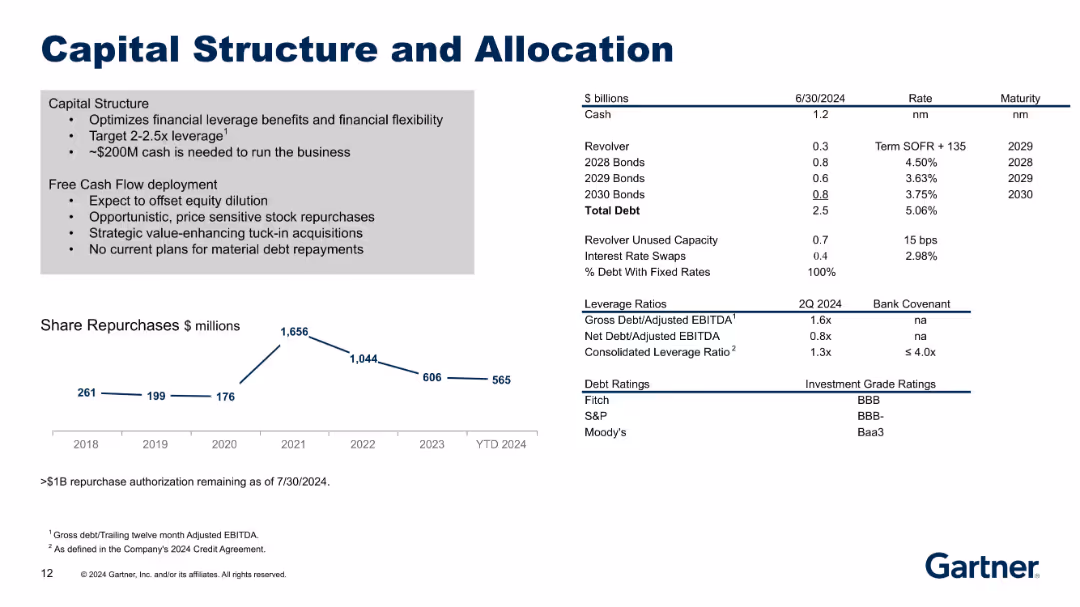
Balanced layout: left section lists capital structure policies, center shows share repurchase trend, and right contains a table of debt breakdowns.
Corporate Finance and Valuation
Financial Services
The slide highlights capital strategy, share repurchases, debt structure, and leverage ratios. It shows Gartner’s cash levels, bond maturities, interest rates, and debt ratings, along with policies on cash deployment and leverage targets.
Capital Structure, Leverage, Share Repurchase, Debt, Ratings, Cash Flow
false
Corporate Finance and Valuation
Financial Services financial-services
Mixed Chart
Gartner
View slide
The slide features a table highlighting capital attribution across different segments like Investment Banking and Asset Management with associated 2019 returns and ROE percentages, next to a text section describing the capital framework.
Investment Analysis
Financial Services
Showcasing the allocation of capital and segment returns within Goldman Sachs, this slide compares average 2019 capital attributions and ROE percentages, possibly aimed at investors or analysts for assessing company performance and investment distribution.
Capital allocation, ROE, investment banking, asset management, returns
false
Investment Analysis
Financial Services financial-services
Table
Goldman Sachs
View slide
Two main sections show a comparison of ROE figures for Global Markets and Investment Banking against competitors, and bullet points highlighting drivers for higher returns. There is also a blue color theme with bar charts for visual comparison.
Strategic Planning
Financial Services
This slide compares Goldman Sachs' capital deployment strategies and ROE performance in Global Markets to its peers, possibly serving as a strategic guide for optimizing resource allocation and capital redeployment in client financing for business planning sessions.
Capital deployment, ROE, Global Markets, resource optimization, strategy
false
Strategic Planning
Financial Services financial-services
Multiple Chart
Goldman Sachs
View slide
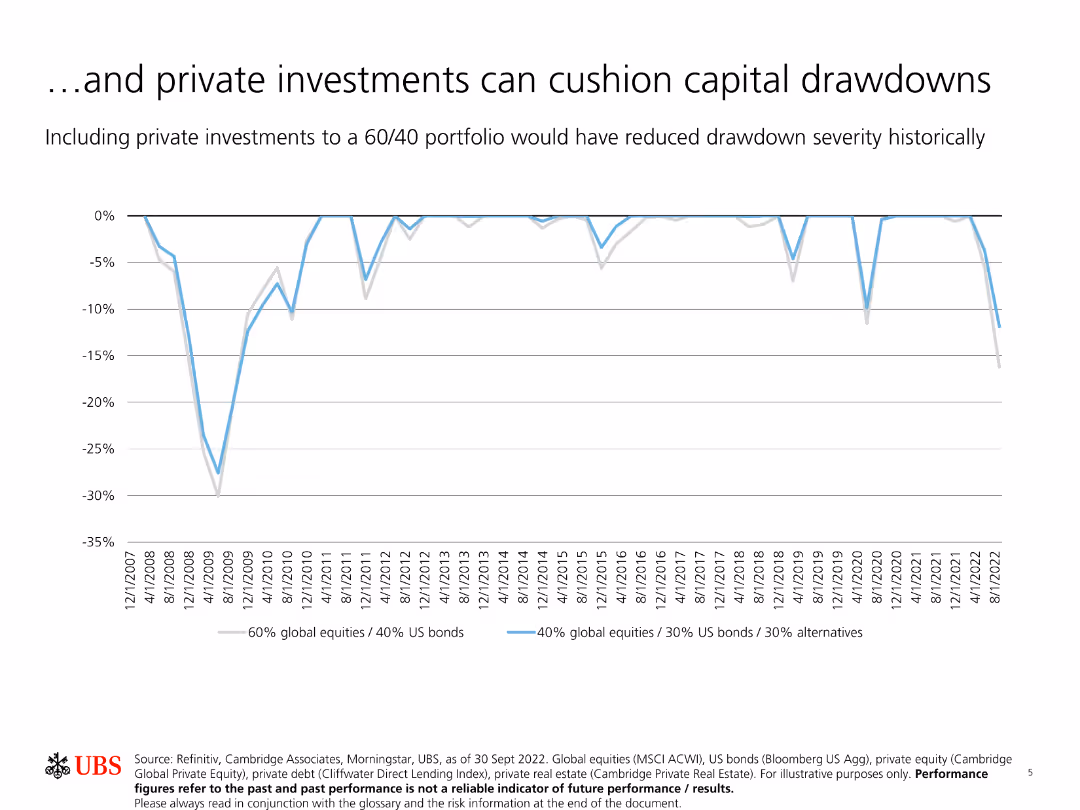
The slide shows a line chart depicting the historical drawdown severity of different portfolio allocations, indicating reduced severity with private investments.
Risk Assessment and Management
Financial Services
This slide illustrates how including private investments in a 60/40 portfolio could have reduced the severity of capital drawdowns historically, supporting the risk mitigation benefits of private assets.
Capital drawdowns, private investments, risk mitigation, portfolio, historical data
false
Risk Assessment and Management
Financial Services financial-services
Single Chart
UBS
View slide
The slide features a dark blue color scheme with a line chart comparing Goldman Sachs and U.S. Peer Average BVPS growth over a 10-year period, and a bar chart showing GS's outperformance in 3, 5, and 10-year spans. There's a bullet point list on the left outlining capital management philosophy.
Financial Performance
Financial Services
This slide presents Goldman Sachs' prudent capital management over the years, highlighting significant returns of capital, net income, and growth in BVPS compared to its peers, likely used in financial reviews or investor presentations.
Capital management, BVPS, financial growth, performance, Goldman Sachs
false
Financial Performance
Financial Services financial-services
Multiple Chart
Goldman Sachs
View slide
This slide is divided into two sections: the left side lists key forward drivers of capital management, and the right side presents a column chart illustrating the CET1 Ratio targets and components, including the Stress Capital Buffer and G-SIB.
Risk Assessment and Management
Financial Services
The slide details forward-looking statements on capital management, focusing on stress capital buffer improvements, G-SIB surcharge expectations, and management buffer estimates, useful for discussions on future financial strategies and regulatory requirements.
Capital management, CET1 Ratio, stress test, G-SIB, financial strategy
false
Risk Assessment and Management
Financial Services financial-services
Mixed Chart
Goldman Sachs
View slide
Two pie charts in shades of blue, detailing types of funding products and currencies.
Financial Performance
Financial Services
Summarizes capital markets issuance and outstanding amounts, crucial for understanding funding strategies and financial health.
Capital markets, funding, financial health, currencies, financial strategy, issuance, banking
false
Financial Performance
Financial Services financial-services
Multiple Chart
Deutsche Bank
View slide
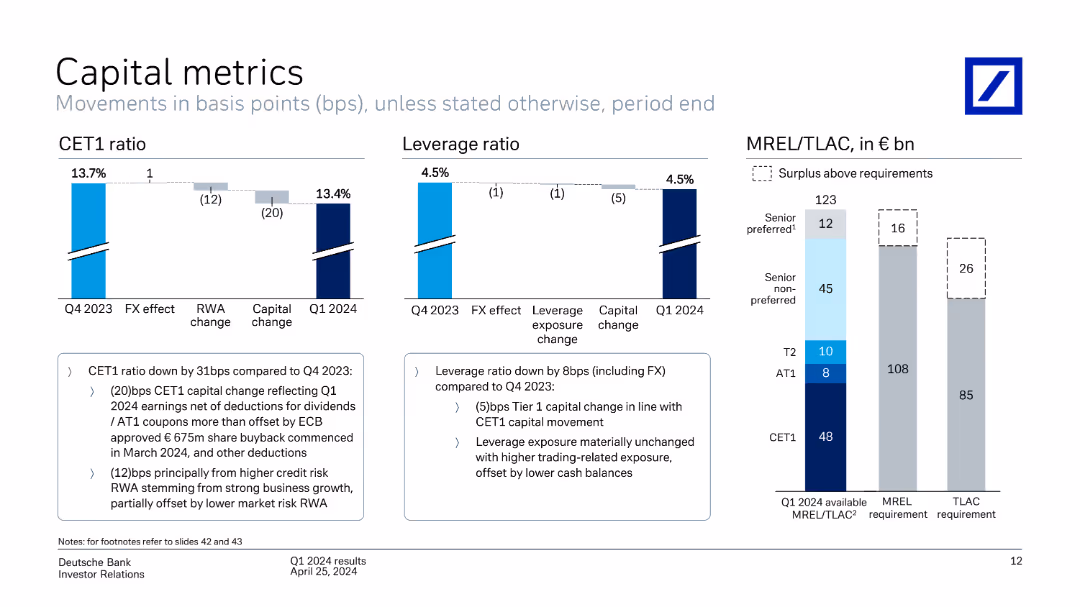
Includes multiple column charts showing CET1 ratio, leverage ratio, and MREL/TLAC metrics, with explanatory text. The slide is detailed with several visual elements.
Financial Performance
Financial Services
The slide presents key capital metrics for Deutsche Bank, including CET1 ratio, leverage ratio, and MREL/TLAC, providing a detailed breakdown of changes and regulatory compliance.
Capital metrics, CET1 ratio, leverage ratio, MREL, TLAC
false
Financial Performance
Financial Services financial-services
Multiple Chart
Deutsche Bank
View slide
Features bar and line graphs depicting capital allocation with corresponding textual explanation.
Strategic Planning
Financial Services
Discusses Booz Allen’s capital allocation strategy, showcasing past and projected financial strategies. Ideal for strategic planning sessions and investor briefings.
Capital, Allocation, Strategy, Dividends, Share Repurchases
false
Strategic Planning
Financial Services financial-services
Multiple Chart
Booz Allen Hamilton
View slide
Contains tables and bullet points highlighting capital information, balance sheet data, and graphical representation of book value.
Regulatory and Compliance
Financial Services
Analyzes the company's capital and balance sheet positions, indicating regulatory compliance and financial health. Useful for stakeholders reviewing capital adequacy, asset allocations, and financial stability.
Capital, Balance Sheet, CET1 Capital, RWAs, Liquidity, Shareholders' Equity, Deposits, Financial Health, Regulatory Compliance, Book Value
false
Regulatory and Compliance
Financial Services financial-services
Table
Goldman Sachs
View slide
The slide includes tables and column charts presenting risk-based capital & liquidity metrics, end-of-period assets, and liabilities and equity.
Financial Performance
Financial Services
This slide gives a comprehensive view of capital and balance sheet metrics, highlighting liquidity, capital ratios, and asset distribution.
Capital, Balance Sheet, Liquidity, Assets, Liabilities, Equity, Metrics, Ratios, Financial, Performance
false
Financial Performance
Financial Services financial-services
Multiple Chart
Citigroup
View slide
The slide includes a table, column charts displaying risk-based capital metrics, leverage-based capital metrics, liquidity metrics, and balance sheet data. It's in a blue and gray color scheme.
Financial Performance
Financial Services
This slide provides an in-depth look at a company's capital adequacy and liquidity position over time, detailing various financial metrics such as CET1 capital and liquidity coverage ratio. It is ideal for detailed financial analysis and presentations to stakeholders interested in the financial health of the organization.
Capital, Balance Sheet, Liquidity, Leverage, Metrics, Risk, Financial, CET1, Assets, Liabilities
false
Financial Performance
Financial Services financial-services
Multiple Chart
Citigroup
View slide
This slide presents a black background with a divided column chart on the left, displaying different levels of capital requirements with associated percentages, and text blocks on the right side outlining strategies related to capital management.
Financial Performance
Financial Services
The slide provides information on capital investment strategies, stressing sustainable growth and return on buybacks. It also discusses target management buffer and minimum capital requirements.
Capital, Buffer, Investment, Dividends, Buybacks, Requirements, Financial, Strategy
false
Financial Performance
Financial Services financial-services
Mixed Chart
Goldman Sachs
Previous
Loading...
Hold On!
We are searching in our database
If nothing, comes up, please try different filters!
Column Chart
Heatmap
Chevron
Org Chart
Infographic
Callouts
Timeline
List
Graphic
Picture
Process Flow
Diagram
Paragraph
Map
Table
Framework
Subtitle
Takeaway Box
Icon
Other Chart
Radar Chart
Waterfall Chart
Mekko Chart
Pie Chart
Scatter Plot
Line Chart
Bar chart
Bullet points
Create a FREE account to continue browsing
Receive Instant Access to 1,000+ slides from companies like McKinsey, Google, and Goldman Sachs
First Name
Last Name
Email
Password
I agree to all
Terms & Privacy Policy
Thank you! Your submission has been received!
Oops! Something went wrong while submitting the form.
Have an account?
Sign in
Upgrade to PRO to Save slides
Advanced Search and Filters
Access to 15,000+ slides
Access to Category Pages
Save/Bookmark Slides
PowerPoint Template Library
Pick a Plan
MONTHLY
$12/month
Billed every month, Cancel anytime.
YEARLY
$9/year
Billed $108 annually, Cancel anytime.
Checkout for $12/month
Checkout for $108/yr
Secured by Stripe | AES-256 bit encryption